
This chapter presents the framework established by the panel for evaluating the use of estimates based on American Community Survey (ACS) data, describes the data and information sources and how they were used, and provides an overview of the panel’s evaluation approach. It also presents intermediate results, such as those related to the use of ACS variables to define eligible students. Results of comparisons of estimates from alternative data sources are presented in Chapter 4.
The key variables of interest for this study are the percentages of students eligible or certified for free, reduced-price, and full-price meals and the percentages of meals served to students in each eligibility category. These are the eligibility, certification, and participation percentages shown in Figure 2-1 in Chapter 2. Estimates that can be computed from the ACS are eligibility rates (with eligibility determined using ACS variables), while estimates that can be computed from administrative data are certification rates that reflect students applying and being approved or directly certified through the application, certification, and verification processes. An ultimate goal is the determination of claiming percentages that reflect participation—meals served by category—under a universal feeding option, also shown in Figure 2-1.
While the panel analyzed all eligibility, certification, and participation percentages (free, reduced price, and full price), we focused on the blended reimbursement rate (BRR) described as part of the reimbursement equations presented in Chapter 2. Looking at changes in the free, reduced-price, and full-price percentages individually can be confusing because
they are correlated, making the impact of changes difficult to assess. The advantage of the BRR is that it depends on all three percentages in a way that is of most direct interest to districts. Specifically, it gives the impact of changes in the percentages on the bottom line— reimbursement. In fact, it is the average reimbursement per meal. The BRR is especially useful as a summary measure for ascertaining the differences in reimbursement that result from using different percentage distributions (eligible students, certified students, or meals served) as claiming percentages. Nonetheless, workshop participants told the panel that to consider participating in the ACS Eligibility Option (AEO), they would need to see all estimates (percentages of students eligible for free, reduced-price, and full-price meals) in addition to the BRR and claiming percentages to help them assess whether to adopt the AEO.1
The panel’s analytical results are focused throughout on school districts in which more than 75 percent of students were eligible for free or reduced-price meals in any school year from 2004-2005 through 2009-2010 because these districts are most likely to be interested in the AEO dis-trictwide. We call these districts “very high FRPL [free or reduced-price lunch].”2Table 3-1 shows the distribution of these and other districts by size for all districts that have school meals program certification data for school year 2009-2010 from the Common Core of Data (CCD) and for which the Census Bureau derived ACS estimates. There are 1,291 such districts in the nation (about 10 percent of all districts), which enrolled nearly 13 percent of all students and 22 percent of students certified for
____________
1 Many of our analyses examine the individual free, reduced-price, and full-price percent ages. As noted, however, the BRR is a useful way to summarize these percentages and focus attention on whether different sets of percentages substantially affect reimbursement, given that the difference of $.40 (currently) between the free and reduced-price meal reimburse ment rates is very small relative to the difference of more than $2 between those rates and the rate for full-price meals. Based on the lunch reimbursement rates (with the $.02 increment) for 2010-2011 (see Table 2-6 in Chapter 2), the BRR with free, reduced-price, and full-price eligibility percentages of 80, 5, and 15 percent, respectively, is less than 2 percent higher than the BRR with percentages of 70, 15, and 15 percent, respectively ($2.3510 versus $2.3110). In contrast, the latter is nearly 10 percent greater than the BRR with percentages of 70, 5, and 25 percent ($2.1050). In other words, shifting 10 percent (of students or meals) from the reduced-price category to the full-price category has a much greater effect on reimbursement than shifting them to the free category. The Healthy, Hunger-Free Kids Act of 2010 explicitly acknowledges the BRR as a useful measure for analysis and decision making, requiring states to calculate and disseminate BRRs for districts for purposes of implementing and administering the Community Eligibility Option.
2 The 75 percent figure was identified as a threshold for potential interest in a universal feed ing provision in many phases of the panel’s analysis. It is noted in publications by the Food Research and Action Center (see http://frac.org/newsite/wp-content/uploads/2009/05/provision2.pdf). As discussed later, the 75 percent threshold also was mentioned by partici pants in the panel’s workshop and in its survey of Provision 2/3 districts.
TABLE 3-1 Number and Percentage of U.S. School Districts* by Size and Percentage Approved for Free or Reduced-Price Meals
|
|
||||
| Size | Low FRPL | High FRPL | Very High FRPL | |
|
|
||||
| Large | Number of districts | 468 | 305 | 110 |
| Percentage of districts | 3.6 | 2.4 | 0.9 | |
| Percentage of enrollment | 24.1 | 19.2 | 8.7 | |
| Medium | Number of districts | 1,415 | 722 | 187 |
| Percentage of districts | 10.9 | 5.6 | 1.4 | |
| Percentage of enrollment | 16.0 | 8.4 | 2.1 | |
| Small | Number of districts | 5,645 | 3,092 | 994 |
| Percentage of districts | 43.6 | 23.9 | 7.7 | |
| Percentage of enrollment | 12.9 | 6.6 | 1.9 | |
| Total | Number of districts | 7,528 | 4,119 | 1,291 |
| Percentage of districts | 58.2 | 31.8 | 10.0 | |
| Percentage of enrollment | 52.9 | 34.1 | 12.8 | |
|
|
||||
NOTE: FRPL = free or reduced-price lunch.
*All school districts in the United States with Common Core of Data (CCD) free or reduced-price meals certifcation data for 2009-2010 and American Community Survey (ACS) estimates. Large districts have 1-year estimates. Medium-sized districts have 3-year estimates, but do not have 1-year estimates. Small districts have only 5-year estimates.
SOURCE: Prepared by the panel.
free or reduced-price meals. We also considered districts with more than 50 percent but never more than 75 percent of students eligible for free or reduced-price meals in the school years from 2004-2005 through 2009-2010 because these districts might be interested in the AEO for a subset of schools. We call these districts “high FRPL.” There are 4,119 such districts nationwide (32 percent of districts), enrolling 34 percent of all students and 44 percent of students certified for free or reduced-price meals.
The data collected on form FNS-742 (described in more detail later) show that only 431 of these school districts were operating under Provision 2 or 3, not in a base year, in 2009-2010. Of these, 296 were operating under Provision 2 or 3 districtwide, and 135 were operating under Provision 2 or 3 for only some schools. Of those operating under Provision 2 or 3 districtwide, 79 percent had an FRPL percentage greater than or equal to 75, 10 percent had an FRPL percentage greater than or equal to 50 but less than 75, and 12 percent had an FRPL percentage less than 50. Of the districts where Provision 2 or 3 was implemented for only some schools, 32 percent had a district-level FRPL percentage greater than or equal to 75, 45 percent had an FRPL percentage greater than or equal to 50 percent but less than 75, and 23 percent had an FRPL percentage less than 50. We also refer to districts as large, medium, and small, depending on whether they had 1-year, 3-year, and 5-year ACS direct estimates available (population
of at least 65,000); 3-year and 5-year (but not 1-year) estimates available (population between 20,000 and 64,999); or only 5-year estimates available (population under 20,000).
SOURCES OF DATA ON ELIGIBILITY AND PARTICIPATION
The ACS is the only national survey that may be large enough for use in estimating numbers of students eligible for free or reduced-price meals in school districts and school attendance areas under a potential new provision. The panel considered the use of estimates from the ACS in terms of their accuracy, timeliness, and geographic coverage. Assessment of these properties and the development of possible corrections for any shortcomings required comparison with additional data sources and data products. This section begins with a description of the ACS direct and model-based estimates and then describes the other data sources the panel compared with the ACS: the administrative data collected by the Food and Nutrition Service (FNS) in support of the school meals programs, administrative information about schools and school districts collected and provided by the National Center for Education Statistics (NCES) in the CCD, and school-level data provided to the panel by our case study districts. These data sources were used to assess not only any systematic differences between ACS and administrative estimates, but also the precision, temporal stability, and timeliness of ACS estimates for all school districts in the country and for the schools in our case study districts.
The American Community Survey
The ACS is a continuous survey used to collect data on income, family composition, and other individual and household characteristics that previously were gathered once every 10 years from the long-form sample of the decennial census of population. After a decade of testing and development, the ACS became fully operational in 2005 for households; people living in group quarters were added beginning in 2006. With the advent of the ACS, the 2010 census (as will be true of future censuses) included only the short-form items of age, sex, race, ethnicity, relationship to householder, and owner/renter status (see National Research Council, 2007).
The ACS samples about 240,000 housing unit addresses every month from the Census Bureau’s Master Address File, for a total of nearly 2.9 million housing unit addresses every year (increased to 295,000 addresses per month in June 2011). Each month, about half of the households receiving a questionnaire in the mail fill it out and mail it back; nonresponding households for which telephone numbers can be obtained are contacted using computer-assisted telephone interviewing (CATI). A one-third sam-
ple (approximately) of the remaining nonrespondents is designated for follow-up using computer-assisted personal interviewing (CAPI). High overall response rates have been achieved for the ACS. The response rate, obtained by adding mailback and CATI respondents together with a weighted estimate of respondents in the CAPI subsample, was approximately 98 percent in 2009.3
The goal of the ACS is to provide small-area estimates similar in precision to but more timely than those provided by the census long-form sample. Because the ACS sample is spread out over time, the data must be accumulated over months and years to provide reliable estimates for small areas. In late 2006 (for calendar year 2005), the Census Bureau began releasing ACS 1-year estimates for states, counties, cities, school districts, and other geographic areas with at least 65,000 people. In late 2008, the Census Bureau began releasing ACS 3-year estimates for areas with at least 20,000 people. Finally, in late 2010, the Census Bureau began releasing ACS 5-year estimates for all geographic areas in Census Bureau databases, including block groups, census tracts, small cities, towns, and school districts.
The ACS data provide an opportunity to construct estimates of students who are eligible for free, reduced-price, and full-price meals for the attendance areas of schools, groups of schools, and school districts. Most school districts in the United States are small in population size. Thus of the 13,777 school districts for which ACS estimates were released in fall 2011, only 985 had 65,000 or more residents according to the July 2010 Census Bureau population estimates, and only 3,411 had more than 20,000 residents.4 Moreover, even in medium-sized and large school districts, attendance areas for individual schools or groups of schools are small. Because ACS estimates are not provided for school attendance areas, estimates for these areas would need to be based on boundary information or lists of census blocks provided to the Census Bureau by a state or local education agency.
Numerous challenges must be addressed before the ACS can be used to derive eligibility estimates and establish claiming percentages for the school meals programs. Five of the most important issues are (1) constructing geographic areas to represent school attendance areas; (2) determining eligibility using ACS variables; (3) assessing systematic differences between ACS and administrative estimates; (4) assessing levels of variability, temporal stability, and timeliness; and (5) accounting for participation. Subsequent sections of this chapter address the first two issues and outline the empirical analyses needed to address the last three. Results of the data comparisons and analyses are provided in Chapter 4.
____________
3 See http://www.census.gov/acs/www/methodology/sample_size_and_data_quality/.
4 See http://www.census.gov/acs/www/data_documentation/areas_published/.
Small Area Income and Poverty Estimates (SAIPE) and ACS Model-Based Estimates
The No Child Left Behind Act of 2001 directed the U.S. Department of Education to distribute Title I basic and concentration grants directly to school districts on the basis of the most recent estimates of school-age children in poverty available from the Census Bureau. These estimates, from the SAIPE Program, were first developed in the late 1990s (see National Research Council, 2000a,b) and are currently based on data from the ACS, the 2000 census, the Supplemental Nutrition Assistance Program (SNAP, formerly the Food Stamp Program), aggregated federal income tax data, and a series of statistical models. The 2009 and 2010 SAIPE estimates correspond to 2009-2010 school district boundaries.
Annual SAIPE estimates of related children aged 5-17 living in families with income below the poverty line are used in allocating $14 billion to school districts for Title I of the No Child Left Behind Act.5 The school district estimation process uses the number of school-age children in poverty in a county estimated from a statistical model and the estimated number of children in households below the poverty line based on federal income tax returns for each school district (or part of a district) in that county. The county-level model combines the results of a regression equation with direct (not model-based) 1-year ACS estimates, controlled to estimates from a state-level model. The county- and state-level regression equations use administrative records data and estimates from the 2000 census long-form sample to predict numbers of school-age children living in poverty for each county or state.6
The SAIPE model estimates are produced for a given year with about a 1-year time lag; for example, the 2009 estimates were released in December 2010, incorporating administrative records information for 2008. This timing is only a few months later than the release of direct ACS estimates. As a result, SAIPE estimates are considerably more timely than the 5-year ACS estimates, the only other available option for small school districts. The SAIPE model-based estimates have the advantage of reducing mean-squared error relative to direct estimates for small geographic areas; however, their accuracy depends on the validity of the underlying model and
____________
5 Related children are people under age 18 and related by birth, marriage, or adoption to the householder of the housing unit in which they reside; foster children, other unrelated individuals under age 18, and residents of group quarters under age 18 are not considered related children.
6 It will not be possible to update the 2000 census variables in the state and county models because the 2010 census ascertained only basic demographic information on households, with the ACS obtaining the detailed socioeconomic data formerly included on the census long form.
may vary for different kinds of areas. SAIPE estimates are not available for census tracts or block groups, and they pertain to the official statistical poverty level and not the 130 percent and 185 percent ratios of income to the poverty guidelines that determine eligibility for free or reduced-price school meals, respectively.
The panel collaborated with the Census Bureau, which agreed to adapt the SAIPE approach and provide model-based ACS estimates of the percentages of students eligible for free and reduced-price meals in each school district in the United States and in the school attendance areas in the case study districts. The methodology developed to provide these model-based estimates is described in Appendix C, and the estimates are evaluated in Chapter 4.
Administrative Data
Both FNS and NCES in the Department of Education collect data from school districts nationwide that can be considered a benchmark for comparisons with the estimates from the ACS. FNS has two relevant data collection mechanisms—form FNS-742, School Food Authority Verification Summary Report (information for school districts), and form FNS-10, Report of School Program Operations (information at the state level only). NCES provides detailed information through the CCD, including data on enrollment, number of students certified for free meals, and number certified for reduced-price meals, for all public school districts and public schools in the country. The panel also collected detailed administrative data concerning enrollment, certification, and meals served from our five case study districts.
Form FNS-7427 collects data on verification activities. With few exceptions, each school district that operates the National School Lunch Program (NSLP) or School Breakfast Program (SBP) must report the information on this form annually. Section I of the form obtains information as of the last operating day in October. Included are the number of schools operating the NSLP or SBP and the enrollment of those schools, the total number of free-certified and reduced-price-certified students, and the number of free-certified students who are separately identified as (1) not subject to verification (directly certified, homeless liaison list, income-eligible Head Start, pre-K Even Start, students in residential child care institutions [RCCIs], and nonapplicants approved by local officials); (2) certified based on a SNAP, Temporary Assistance to Needy Families (TANF), or Food Distribution Program on Indian Reservations (FDPIR) case number submitted on an application; (3) certified based on income
____________
7 The form is available at http://www.fns.usda.gov/fns/forms.htm.
reported on an application; and (4) certified in Provision 2 and 3 schools not operating in a base year. The number of reduced-price-certified students also is separately identified for Provision 2 and 3 schools not operating in a base year.
Section II of form FNS-742 provides information about verification. The reported outcomes of verification include no change, responded and changed to free, responded and changed to reduced price, responded and changed to full price, did not respond, and reapplied and was reapproved on or before February 15. For each outcome, three counts are reported: the number of free-certified students based on the SNAP/ TANF/FDPIR case number submitted on the application; the number of free-certified students based on income provided on the application; and the number of reduced-price-certified students based on income. The form also collects data on the number of applications and the number of students for each outcome. Data from form FNS-742 are maintained by FNS and are used to prepare summary reports of verification activities.
Form FNS-10 collects state-level counts related to the school meals programs and is completed by state agencies. The form has two parts. Part A, which must be submitted monthly, obtains the number of meals served in the state under the NSLP and SBP by category (free, reduced price, full price), the total number of meals, and the average daily number of meals. This information is used to compute state-level reimbursements for the school meals programs. Part B is to be completed once a year. In October, states report the number of meals served by category in private schools and RCCIs. Also included are counts of public schools, private schools, and RCCIs that participate in the school meals programs (by program) and the enrollment of those schools. For the NSLP, the form shows the number of students approved for free lunches and the number approved for reduced-price lunches.
To complete form FNS-10, a state agency obtains the necessary information from school districts. Data must be kept for 3 years. FNS provides summary information on its website at http://www.fns.usda.gov/pd/cnpmain.htm. Form FNS-10 was the only comprehensive source of participation information available to the panel, but as noted, it is available only at the state level.
The CCD, a program of NCES, conducts five census operations annually to collect fiscal and nonfiscal data on all public schools, public school districts, and state education agencies in the United States. It provides an official listing of public elementary and secondary schools and school districts in the nation, which is used to select samples for other NCES surveys, and it provides basic information and descriptive statistics on public elementary and secondary schools and schooling in general. The data, supplied by state education agency officials,
include information about schools and school districts: name, address, and phone number; information about students and staff, including demographic characteristics; and fiscal data, including revenues and current expenditures. Most of these data are obtained from administrative records, presumably the same ones used by states as the basis for completing FNS forms.
For purposes of this study, the most relevant data from the CCD are the school and school district counts of enrolled students and numbers of students certified for free- and reduced-price meals. The CCD also contains demographic variables (race and ethnicity, English-language-learner status) that were used in the panel’s analysis.
Case Study Districts
The panel invited six school districts to participate in this study as case studies, and five agreed. A district could be considered for participation if it had taken applications for the school meals programs for all schools in the district for the past 5 years, had no outstanding counting/ claiming issues, was willing and able to provide digitized boundaries for the attendance areas for each school, and was willing to provide an extensive amount of school-level data for up to 6 school years.
The panel decided that case studies should be selected from districts with “medium need,” that is, free or reduced-price percentages of 50 to 75 percent. Another criterion was that the districts should be “heterogeneous,” that is, have at least 25 percent of schools with free or reduced-price percentages of more than 75 percent and at least 25 percent of schools with free or reduced-price percentages of less than 50 percent. The intent was to identify school districts that were likely to consider adopting the AEO for only a subset of schools. From among such districts, we wanted ones that varied in terms of enrollment but were not so small that estimates for schools or groups of schools would be too imprecise. As a rough guide, we chose to consider only the 65 medium-need, heterogeneous school districts with enrollment greater than 12,000 students based on CCD data for 2007-2008. Within this group, we planned to select 4 large school districts (enrollment of at least 25,000) and 2 medium-sized school districts (enrollment between 12,000 and 25,000). The resulting list of potential case study districts was further refined on the basis of diversity in the aggregate level of need for free and reduced-price meals, diversity in the pattern of heterogeneity of need across schools, available information about state and district management and program operations, geographic diversity, and diversity in the race and ethnicity of students. The five school districts listed in Table 3-2 agreed to participate as case study districts: Austin, Texas;
TABLE 3-2 Case Study Districts
|
|
|||
| School District | Number of Participating Schools | Number of Students (in thousands) | Students in Schools Without Boundaries (percentage of enrolled)* |
|
|
|||
| Austin, Texas | 114 | 83 | 3.0 |
| Chatham County, Georgia | 46 | 35 | 5.4 |
| Norfolk, Virginia | 56 | 36 | 10.0 |
| Omaha, Nebraska | 86 | 47 | 4.6 |
| Pajaro Valley, California | 32 | 19 | 7.4 |
|
|
|||
*Omaha and Chatham County are also open enrollment districts. In open enrollment districts, many schools have geographic boundaries, but students are not required to attend neighborhood schools.
SOURCE: Prepared by the panel.
Chatham County,8 Georgia; Norfolk, Virginia; Omaha, Nebraska; and Pajaro Valley, California.
The panel contacted state directors in the states of the potential case study districts to describe the study and ask for their assistance. With the approval of state directors, we contacted school district staff. To facilitate the development of the case studies, we obtained the support of the School Nutrition Association (SNA). The president of SNA, Dora Rivas, wrote a letter in support of the study that was included with our letters to state directors and to school district officials.
From each case study district, the panel obtained digitized boundaries for school attendance areas for the most recent school year and detailed data for each school on enrollment, students approved for free and reduced-price meals, and reimbursable meals served under the SBP and NSLP by category for up to six school years. These data enabled us to conduct a limited analysis of the boundary information, to compare school-level data with CCD data for the same school, and to compare school-level data with ACS estimates to evaluate systematic differences and precision. We also used the case study data as part of our evaluation of the relationship between eligibility and participation as the basis for claiming percentages for reimbursement under the AEO and to illustrate how the AEO might work in practice. Appendix E, Part 1 describes the data collected from the case study districts and provides summary information. In addition to providing data and collaborating with the panel, the school food authority directors of the case study school districts were invited to participate in a workshop held in Washington, DC, in March 2011. The agenda for the workshop is provided in Appendix E, Part 2.
____________
8 The Chatham County School District is named Savannah-Chatham County Public School System on its public website.
CONSTRUCTION OF EVALUATION DATABASES
The school district-level evaluation database used by the panel consists of school district-level ACS direct estimates and ACS model-based estimates that the Census Bureau provided to us, together with district-level data we obtained from the CCD and form FNS-742.9 The database includes all 13,527 school districts with both ACS 5-year estimates and ACS model-based estimates. Merging ACS estimates with the CCD data was straightforward because the Census Bureau used the NCES ID to identify school districts. However, not all school districts are included in the Census Bureau’s Topologically Integrated Geographic Encoding and Referencing (TIGER) files.10 Additionally, 41 districts had ACS direct estimates but were not in the CCD, and 227 districts had ACS model-based estimates but no 5-year ACS estimates.11 Merging with form FNS-742 data was more challenging because the ID numbers in that file vary by state and over time and are often different from NCES IDs. A recent study documenting the linkage between the FNS-742 and CCD districts in the country was helpful to the panel.12
The final school district-level evaluation database includes enrollment and eligibility percentages and their standard errors from ACS direct 5-year estimates (2005-2009), together with five 1-year model-based ACS estimates for calendar years 2005 through 2009 for each school district in the database. For districts with populations greater than 20,000, the database also includes three ACS direct 3-year estimates (2005-2007, 2006-2008, and 2007-2009), and for districts with populations greater than 65,000, it includes five ACS direct 1-year estimates (for 2005 through 2009). Included as well, when database records could be linked, are FNS-742 annual data for school years 2004-2005 through 2009-2010, including Provision 2 or 3 participation (not in a base year) indicators, enrollment, and percentages certified by category, along with information on categorical
____________
9 The data set is named District Data School Meals.xlsx.
10 TIGER is the database that associates codes for school districts and other political and statistical geographic areas with street segments and address ranges.
11 The Census Bureau withheld ACS estimates for some districts—probably small districts— because of disclosure concerns. Estimates were not withheld for any other reason (e.g., inade quate precision). No ACS model-based estimates were withheld.
12VSR-CCD Linkfile, a report delivered to FNS by Mathematica Policy Research on May 21, 2010, was provided to the panel by FNS. (VSR stands for Verification Summary Report.) The project director was Nancy Cole. The report notes reasons for differences between VSR (from the FNS-742) and CCD data. Although usually there was a one-to-one match, the primary exceptions occurred when school food authority (SFA) operations were centralized for mul tiple school districts. Examples where this was common include Montana, New Hampshire, and New York City. In 2008-2009, there were 14,717 (unduplicated) SFAs in the VSR file, and 95.5 percent of these matched with the CCD data.
eligibility and verification outcomes. The database includes the following CCD data for each school district for each school year from 2004-2005 through 2009-2010: enrollment; percentages certified by category; demographic information, such as the racial/ethnic distribution of students; the prevalence of English-language learners; enrollment in the district’s magnet and charter schools; and several measures of a district’s proximity to charter schools that are independent of the district. The school district database is available from a Committee on National Statistics website (http://sites.nationalacademies.org/DBASSE/CNSTAT/Using_ACS_for_School_Meals/index.htm).
The panel created the school-level evaluation database13 by merging the ACS 5-year estimates for 2005-2009 and five 1-year ACS model-based estimates (for calendar years 2005 through 2009) with the school-level data provided by the case study districts for school years 2003-2004 through 2008-2009 and with the CCD school-level data for 2004-2005 through 2008-2009. This analysis file includes only those schools in the case study districts that had school attendance boundaries in 2009-2010 (the date of the boundary file), passed the Census Bureau’s disclosure review, and were in operation during at least 2008-2009, the last year for which data were collected from the case study districts. An alternative data file14 was prepared that contained the school-level data provided by the case study districts for the schools for which no ACS data were provided (including schools without boundaries, schools that closed prior to 2008-2009, and schools withheld by the Census Bureau because of disclosure concerns). This last file also includes CCD school-level data for the same years.
SOURCES OF INFORMATION FOR DESIGNING AND IMPLEMENTING AN ACS ELIGIBILITY OPTION
The panel used three sources to gather information about the challenges associated with managing the school meals programs and attitudes regarding special provisions. These sources helped us develop details of the AEO. The three sources were a workshop with selected school food authority directors, a survey of Provision 2 and 3 school districts, and a wealth of information from the school food authority directors of the case study districts.
____________
13 Data set named District_ACS_SAIPE_CCD_schools_Master.V2.xlsx.
14 Data set named District_CCD_schools_05252011.xlsx.
Workshop
On March 3-4, 2011, the panel hosted a workshop in Washington, DC, with school food authority directors from the case study districts and with selected other individuals from the school food community who had insights to offer regarding Provision 2 and the school meals programs more generally. The purpose of the workshop was to help us better understand issues pertaining to a potential new provision for the school meals programs and the information school districts would need to determine whether to adopt this special provision. The workshop agenda appears in Appendix E, Part 2. Key observations from workshop participants follow. Note that although the workshop participants were highly knowledgeable about the school meals programs, their observations reflected their personal opinions and individual experiences rather than a consensus of the group. Moreover, their observations may not be representative of those that would be expressed by other school food authority directors.
The district representatives said they are keenly interested in increasing participation in the school meals programs, and one way to do so is to offer free meals to all students. Participation in the programs in elementary schools is already high, so the greatest potential for increased participation is in middle and high schools. To increase participation, a district must improve the image of school meals. Universal feeding likely reduces stigma, contributing to increased participation.
Several participants said there are economies of scale in offering meals and that a district can usually handle increased participation up to some point with the same seating capacity, staff, and equipment. Up to that point, there is an increase in the total cost of providing meals, but the average cost per meal goes down because the only increase in cost is for extra food. After that point, however, other costs may increase (the district may need more labor, expanded facilities, etc.).
Some districts provide universal free feeding without operating under Provision 1, 2, or 3. Typically, they do so to increase participation. The Chatham County and Denver school districts have implemented universal free feeding in some schools. Chatham’s implementation of free breakfasts in high schools reportedly increased participation. Denver instituted universal free feeding on November 1, 2010. The executive director of enterprise management for the Denver public schools stated that participation by students paying full price has risen by 6 to 9 percent, and participation by those certified for free meals has risen by 10 to 12 percent; however, participation by students certified for reduced-price meals has risen by only 1 or 2 percent.
Workshop participants agreed that having 75 percent of enrolled students certified for free or reduced-price meals is a reasonable estimate for
the break-even point15 for Provision 2 (although at least one person suggested that this figure might be a little higher—80 percent). At or above that level, the additional costs of feeding all students for free are expected to be offset by savings associated with elimination of administrative processes associated with the traditional school meals programs. Below that level, it becomes more challenging to offset the additional costs of providing universal free meals.
Workshop participants noted that the panel would have to be careful in describing differences between ACS and administrative estimates to ensure that these differences would not be interpreted as indicative of widespread fraud in the application process. They also advised that the panel would need to provide a clear and convincing discussion of the accuracy of ACS data if it were to suggest that these data would be used in the AEO. Another issue raised was whether ACS data would be deemed accurate enough for use as a replacement for the data on free or reduced-price certification percentages that are used by districts for allocating Title I funding to schools and in administering other programs.
Further, participants noted that the panel would need to address whether the ACS includes certain populations, such as migrant workers, refugees, the homeless and runaways, and military families. Pajaro Valley, for example, has a large migrant population that resides in the district only from May through October. Some of the migrant children are likely to live in migrant camps that are not included in the ACS household population. The director expressed concern about how well the ACS captures these children if the migrant population is afraid of the census and does not participate in the ACS.16
Participants were concerned about the time frame of the ACS data and about being locked into percentages that do not reflect current circumstances. They raised questions about the quality of income data reported in the ACS and how well the ACS can account for changes over time and in geography. Economic conditions can change rapidly, and attendance areas can change when there is a shift in population or a district opens new schools or closes old ones. Traditional application and certification procedures can easily capture these changes.
Participants stressed that anything that impacts funding should be
____________
15 The term “break-even point” may not be entirely accurate. The panel was unable to find any evidence that a cost-benefit analysis was used to determine this point, and in fact had difficulty in collecting consistent information about the costs of the administrative processes that are eliminated under Provisions 2 and 3, the AEO, and the Community Eligibility Option.
16 Refugees are usually settled in regular housing, where they would be captured by the ACS during the time they are in the district. However, some might choose not to participate in the ACS. The ACS includes all military personnel in the United States and their families, whether living on or off base.
effective at the beginning of a school year. Most school district budgets are developed in winter/spring (December-February) for the following school year. Reimbursement rates are available from FNS in July. Participants said they need to know the claiming percentages at the latest by July but would like to have them sooner.
Census Bureau staff participating in the workshop noted that school meals program eligibility estimates from the ACS for a particular calendar year or period (e.g., 2010, 2008-2010, or 2006-2010) could be made available within a little more than a year after the end of data collection (i.e., early 2012 for the years listed). They noted further that the school district-level data products they regularly prepare from the ACS for NCES are delivered in February-March, so most likely that would be the timing for ACS-based AEO tabulations as well.
Despite their concerns about having estimates that reflect current conditions, participants agreed that substantial variation in claiming percentages over time would be a problem for administering the school meals programs. They would prefer less variation even if the data were older and less responsive to change. Moreover, if the average reimbursement implied by the claiming percentages were to decrease because of improved economic conditions or other reasons, they would prefer steady, smaller decreases rather than a constant average reimbursement followed by a significant drop (as under the current Provision 2 when a new baseline must be established). Participants said that school districts would decide whether to adopt the AEO by “doing the math.” Districts would first determine whether the AEO might increase participation in targeted schools of interest to them. They would then evaluate the data to determine the impact on their budgets and whether they could afford the likely increased participation. This evaluation would include determining whether state requirements could be met and whether the district could accommodate increases in participation. Districts would need to make sure that à la carte food offerings or catering would provide enough money to pay any difference not covered by administrative cost savings. The concern of any district would be, “Would I lose money?” Some districts would initially consider the AEO for breakfast only.
Districts would want to have estimates of percentages eligible by category and estimated claiming percentages (if different from percentages eligible). They would need percentages eligible to report to the state—for example, for Title I. They would also need these numbers to convince themselves that the quality of the estimates was acceptable. They would need the claiming percentages (if different) to assess changes in revenue. One participant suggested that FNS implement the AEO as a demonstration or pilot program.
Participants stated that the panel’s presentation on geography and the
issues raised on the subject were outside their technical capabilities. The Census Bureau already has boundary information for all school districts, so if a district wanted to participate in the AEO districtwide, geographic boundaries would not be an issue. If districts wanted to participate in the AEO for some but not all of their schools but had to pay to have school attendance boundaries prepared, it would be very difficult for them to participate. Some workshop participants already knew where (in the local government) to obtain geographic boundaries for schools, while others had no idea how to begin looking. Representatives of participating districts expressed interest in a web application, believing that they might be able to have a staff person use it.17 (See the discussion of the School Attendance Boundary Information System [SABINS] later in this chapter.) In summary, obtaining geographic boundaries for groups of schools might be a challenge for some districts, but not all.
Survey of Provision 2 and 3 Districts
The panel conducted a survey of school food authority directors in school districts that reported operating under Provision 2 or 3. The purpose was to ascertain the advantages and disadvantages of these provisions from their point of view and to see whether they had data they were willing to share that would help us identify changes in participation because of providing universal free meals. Details concerning the frame construction, pilot test, and survey are provided in Appendix E, Part 3.
This survey was a “target of opportunity” and cannot be viewed as representative of all school districts that operate under Provision 2 or 3. However, observations made by multiple respondents are likely to be commonly held views. The panel was fortunate to have the cooperation of SNA for our study. In addition to providing a letter of support for our initial recruitment of case study districts, SNA supported this survey and provided a database entitled SNA.Provision123.data, an extract of names of participants from its recent conferences who reported that their districts participate in Provision 1, 2, or 3. The panel used this database as the sample frame for the pilot test. The pilot test involved conducting telephone interviews with 10 of 12 school food authority directors selected from the SNA list. After being refined in accordance with results of the pilot test, the survey was administered via Survey Monkey on the Internet. The
____________
17 The School Attendance Boundary Information System (SABINS) project has been working to develop a web-based digitizing application. As of April 2012, the application was still in testing. SABINS is now funded by NCES, which will host the final version of the remote digitizing service. NCES also plans to update SABINS annually and gradually increase its geographic coverage.
sample frame for the main survey was based on the FNS-742 data, which yielded 287 districts with enrollments of at least 500 that reported operating under Provision 2 or 3 (not in a base year) during 1 to 4 of the past 5 years.18 Working with its regional offices, FNS provided e-mail addresses for 100 of these districts, each of which was invited to participate in our survey; 22 districts completed the Internet survey.
Of the 10 districts participating in the pilot survey, 1 had not implemented a special provision and was out of scope, 3 were using Provision 2 for breakfast only, and 6 were using Provision 2 for both lunch and breakfast; none was using Provision 3. The number of schools in these districts ranged from 10 to 140, with an average of 41. Enrollment ranged from 5,400 to 89,000, with an average of 30,000. Of the 22 Internet survey respondents, 1 had not implemented a special provision and was out of scope; 1 reported that it had used Provision 2 in the past but could no longer afford to participate because of district finances; 1 reported that it used Provision 2 for breakfast only; and the others reported that they used Provision 2 or 3 for both breakfast and lunch. (Three stated that they used Provision 3, and 1 that it used both Provision 2 and 3. However, none of the districts reported the number of schools using Provision 3, so it is possible they did not understand the distinction or were no longer using a special provision.) Eleven indicated that they had implemented Provision 2 districtwide. About 10 districts said they had data demonstrating changes in participation due to the implementation of Provision 2, and about half of them provided those data to the panel. The number of schools in the 22 districts ranged from 2 to 90, with an average of about 16. Enrollment ranged from 1,100 to 49,000, with an average of about 8,300.
Respondents indicated that the percentage of students certified for free and reduced-price meals that triggered the adoption of Provision 2 was high. One district used the severe need breakfast cut-off (60 percent), another used 70 percent, and others used 75 percent or more. The provisions were applied most commonly in elementary schools and special high schools (where one motivation appears to be to avoid handling cash). One district respondent mentioned the geographic proximity of the schools considered for Provision 2, while another noted political ramifications if not all schools participated.
A wide range of advantages and disadvantages of Provision 2 were identified. Respondents noted the following advantages, but no respondent mentioned all of them: faster serving lines, less paperwork and labor, no applications, good for students (less stigma), no money handling, participation increases, students no longer need ID cards or money, no dun-
____________
18 We wanted to identify districts that had conducted a recent base year in hopes of obtaining base-year data.
ning of parents whose children cannot pay, and ability to serve breakfast in the classroom. Districts using Provision 2 for only some schools still had to carry out administrative processes associated with applications for the remaining schools, so the reduction in paperwork and labor was less than for districts using Provision 2 districtwide.
Disadvantages cited included the following (although some respondents said there were no disadvantages): revenue decreases, a large amount of base-year record keeping, administrative glitches requiring attention (students changing schools), and claiming percentages being fixed at the base-year level and not reflecting changes in participation or demography. There were also comments about problems in obtaining completed applications in nonprovision schools and the resulting difficulty of collecting meal charges from parents who had not filed applications but whose children ate the meals.
Districts do occasionally take schools off of Provision 2. Reasons given included the free or reduced-price percentage falling below a threshold, school closings and relocation of students, and district finances.
Most respondents said they believe they have lowered their administrative costs by operating under a special provision. However, few districts had quantified their administrative savings. Although they could cite reduced labor hours, most districts did not appear to have gained significant savings. Breakfast-only implementation appears to have more to do with hunger prevention and nutrition goals than with administrative efficiencies.
Other uses cited for the data on student certification varied considerably. Common uses included aggregate reporting needed for Title I funding under the Elementary and Secondary Education Act (ESEA), as amended, and individual data used as socioeconomic indicators linked to test scores for reporting under the No Child Left Behind Act (NCLB) Other respondents mentioned grants or district needs for the data for waiving or reducing various student fees. Programs that used the aggregate numbers were cited more frequently than those that used individual family status; in the latter case, the need appeared to be mainly for obtaining fee waivers. Some respondents reported use of a separate family application process to secure Erate funding.19
District directors noted that state agencies did not appear to be proactive in promoting implementation of the special provisions or in offering
____________
19 The Schools and Libraries Program of the Universal Service Fund, commonly known as “E-Rate,” is administered by the Universal Service Administrative Company under the direction of the Federal Communications Commission, and provides discounts to assist most schools and libraries in the United States in obtaining affordable telecommunications and Internet access. See http://www.universalservice.org/sl/about/overview-program.aspx.
technical assistance. They suggested that the panel consider recommending that FNS and states provide sufficient technical assistance should the panel recommend implementing a new provision.
Additional Information from Case Study Districts
In addition to providing the information formally requested of the case study districts and participating in the panel’s workshop, the case study school food authority directors responded to many additional questions we posed as we attempted to understand the data on and processes of the school meals programs. We are grateful for their assistance. They provided input concerning the percentage of applications received by October of each year (about 90 percent, but sometimes less if the region has an economic downturn, a factory closing, or many migrant workers). Pajaro Valley provided some detail about its large number of migrant students. Omaha, an open enrollment district, provided spreadsheets showing counts of students and free and reduced-price percentages by both school catchment area residence and school attended so we could consider the impact of open enrollment. Case study directors helped us work through complexities in the data and provided examples illustrating potential causes: for example, students assigned to a school sometimes attend a different school for part of the day and receive lunch there; some districts provide school meals for children of students (not included in enrollment counts); and some districts provide Head Start programs that may move to different schools in different years.
FRAMEWORK FOR EVALUATING THE USE OF ESTIMATES BASED ON ACS DATA
This section considers the suitability of estimates for the school meals programs under an AEO from the perspective of their fitness for use. The panel applied four main criteria in evaluating the use of ACS data in support of the school meals programs:
- conceptual fit,
- accuracy (systematic differences and precision),
- temporal stability, and
- timeliness.
Conceptual fit addresses possible discrepancies between the concepts behind estimated claiming percentages and those behind the authorizing legislation and regulations of the school meals programs. In particular, conceptual fit relates to how well ACS variables can be used to define stu-
dents eligible for free or reduced-price school meals. Accuracy (systematic differences and precision) was addressed by comparing ACS estimates with administrative data20 to determine whether systematic differences exist and whether and in what situations the error from using the ACS is comparable to that associated with existing practices and provisions. Temporal stability and timeliness also were addressed by comparing ACS estimates with administrative data to assess whether ACS estimates would be sufficiently stable while maintaining adequate responsiveness to changes in socioeconomic conditions. These comparisons considered how the estimates would be used in practice and what the context of the decision processes affected by the estimates would be.
In applying this framework, the panel recognized that no system for determining claiming percentages for reimbursement for school meals is perfect. We sought to identify the best method possible, not only from an error perspective but also from the viewpoint of reducing the costs and burden associated with administering the school meals programs, as well as improving access to the programs by the nation’s schoolchildren.
The quality of an estimate has many determinants, including the data sources used as inputs and the underlying methods used to generate the estimate. Survey estimates, for example, are subject to errors that arise in the process of sampling a population, obtaining data from the sampled households, and processing the collected data to create a data set for analysis. Errors in administrative databases used for model-based estimation arise from the fact that these databases generally were not created to be analyzed as a whole, but to manage individual cases. Attention has seldom been given to editing administrative data in a unified way, so there may be data entry or other errors. A survey or administrative database will record information on variables to measure concepts that are developed for specific applications, and these variables may not match the programmatic intent of the school meals programs. Another part of the process involves identifying which records in a database are associated with the school district or school based on some geographic domain, and error can occur here as well. Finally, when estimates for small populations, such as small school districts or individual schools, are needed, the estimation method almost certainly involves some form of statistical model that specifies a structure to approximate—with error— the observed relationships in the population.
While this list of error sources may appear extensive, the current procedures for certification and meal counting in the school meals programs are subject to their own errors associated with administrative processes that
____________
20 While the panel compared ACS data with administrative data, it should be noted that the administrative data also are subject to error.
involve parents, students, lunch room staff, and office staff. As described in Chapter 2, the Access, Participation, Eligibility, and Certification (APEC) Study (U.S. Department of Agriculture/Food and Nutrition Service, 2007b) showed that the error rates and costs associated with these processes can be large.
APPROACH TO DEVELOPING ACS ESTIMATES
Before estimates can be evaluated, they must first be developed. Hence, the first task facing the panel was to decide how to use the ACS to provide estimates of percentages of students eligible for free and reduced-price meals under the school meals programs. This task had two distinct activities: defining geographic regions for which estimates are needed and considering the combination of ACS variables that best identifies students eligible for school meals. This work led to the panel’s conclusions concerning ACS definitional issues and resulted in the specifications we provided to the U.S. Census Bureau (see Appendix D). This section describes the development of specifications; the next section describes our approach to evaluating the direct and model-based ACS estimates.
Developing Specifications for Geographic Areas
For the ACS and other surveys conducted by the Census Bureau, the corresponding geographic support is provided by the Census Bureau’s TIGER database, a digital map of streets, boundaries, and other features. The accuracy of TIGER was recently substantially improved through a major initiative in preparation for the 2010 decennial census, so that positional errors are now in the 5 meter range for streets and other major features. Geographic areas that are available in TIGER include blocks, block groups, census tracts, school districts, small cities, towns, counties, and states. The Census Bureau routinely provides detailed demographic data for school districts, as well as for higher levels of geography.
The Census Bureau’s SAIPE program manages the School District Review Program, which was completed most recently in 2010, to keep the geographic boundaries of school districts up to date. During the update, the Census Bureau works with states to provide updates for the school districts within the state. The next update will be completed in 2012. This state-level approach relies on collaboration between the state and local school districts to keep track of boundary changes made at the local level. The panel found, however, that local school district boundary changes occasionally are not recorded in TIGER. For example, in Pajaro Valley Unified School District in California, one of our case study school districts,
the TIGER district boundary was different from the actual current school district boundary, leading to inevitable differences in demographic data.
To obtain the estimates for school attendance areas needed for this study, the panel had to obtain digitized school attendance area boundaries from the case study districts. We were fortunate to be able to work with the SABINS project (National Science Foundation, 2009), an effort led by principal investigator Salvatore Saporito that received funding from the National Science Foundation in 2009. The project has established a spatial database of school attendance boundaries for the most populous school districts in the country. SABINS data are distributed via the National Historic Geographic Information System website, see http://www.nhgis.org/. The boundaries provided through SABINS are compatible with the TIGER database to facilitate social science research. As of early 2012, SABINS provided school attendance boundaries for the 600 largest U.S. school districts, all districts embedded in three states (Delaware, Minnesota, and Oregon), and all districts embedded in 11 metropolitan areas.
The panel received digitized boundaries from our case study districts, and SABINS independently obtained boundary information for these districts. For each district, SABINS used the boundary information to construct a database for each grade (K-12), integrated with information from the CCD, and uniquely identified the census blocks associated with each school attendance area. SABINS provided the databases for the case study districts to the Census Bureau on behalf of the panel. The Census Bureau produced estimates for these school attendance areas by aggregating block-level data associated with each school attendance area.
SABINS encountered several challenges in the collection of school attendance boundaries. Some districts maintain detailed, accurate boundaries for all schools and all grades in digitized form in geographic information systems (GIS). In these cases, the acquisition of boundaries by SABINS was straightforward. In other cases, however, there appeared to be a lack of coordination among different district agencies—for example, the version of the school attendance boundaries used by the transportation office might differ substantially from that used by other offices. In other cases, maps might exist only in rough form on paper.
The panel considered several approaches by which school districts could transfer information on school attendance area boundaries to the Census Bureau as part of the AEO, with a view to determining which approach would be most accurate, easiest for school districts, and most efficient for the Bureau to use in tabulating data for schools. We determined that the best approach would be block rectification, the method adopted by SABINS. The process of block rectification assigns each census block entirely to a school attendance area (or not). In other words, blocks are not split between two (or more) school attendance areas. This opera-
tion is easily performed in a GIS. The Census Bureau agreed that block rectification is also the most efficient approach for it to use.
In the panel’s interim report, we discussed efforts we might undertake should there be a need to split blocks (National Research Council, 2010). If a boundary splits a block, an error is associated with assigning the block to just one school, since the portion of the block not contained within that school’s attendance area will be incorrectly assigned to it. Alternatively, one might attempt to estimate the proportion of a split block’s students that should be assigned to each of the schools whose boundaries split the block. For example, one might estimate that 30 percent of the block’s students are in one attendance area and 70 percent in another. Such estimation processes are known as areal interpolation (Goodchild and Lam, 1980). Saporito and Sohoni (2006, 2007) collected maps for the schools in the 21 largest school districts and computed estimates for race and ethnicity (available at the block level) and for income eligibility for free and reduced-price school meals (available only at the block group level) from the 2000 census. They observed that “unlike blocks, block groups do not nest neatly within school attendance boundaries but, in fact, cut across them in unpredictable ways” (Saporito and Sohoni, 2007:1,231-1,232). They used areal interpolation of block group data to school attendance areas and found that “the correlation between estimated and actual percent of white children in school attendance boundaries was .999 based upon all attendance boundaries in the study” (Saporito and Sohoni, 2007:1,247).
The Austin Independent School District provides a convenient example with which to illustrate the errors associated with block rectification and obtain quantitative estimates of their magnitude. Figure 3-1 shows elementary school attendance areas overlaid on 2010 census block boundaries; census blocks that straddle boundaries are shaded green. Figure 3-2 shows split blocks overlaid on an aerial image; the large split block in the lower center is composed largely of an airport. We found that split blocks often are unpopulated, an observation that is consistent with the first of these figures, where split blocks lack the dense street patterns characteristic of populated areas.
To obtain a quantitative estimate of block rectification error, we examined a random sample of 35 of the 678 Austin blocks that are split by elementary school boundaries. Of the 35, 20 have zero population. Thus, an estimated upper bound on the rectification error can be computed by taking the fraction of blocks that are split times the fraction that have nonzero population, that is, (678/9,724) * (15/35) or 3.0 percent. From this analysis, it appears that at most 3.0 percent of the elementary school population of Austin may live in a block that is split by an elementary school boundary. Only a subset of these children would be misassigned as
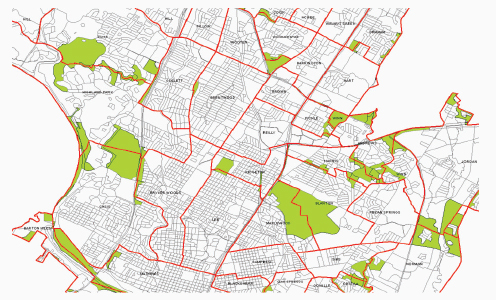
FIGURE 3-1 Illustration of split blocks: School attendance areas and census blocks in Austin, Texas.
NOTE: School attendance boundaries are shown in red; split blocks are shaded green.
SOURCE: Prepared by the panel.
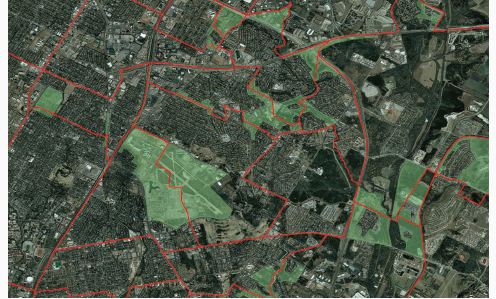
FIGURE 3-2 Illustration of split blocks: Aerial view of school attendance areas in Austin, Texas; close-up of areas surrounding airport.
NOTE: School attendance boundaries are shown in red.
SOURCE: Prepared by the panel.
a result of block rectification. We caution, however, against generalizing too broadly from this simple analysis of one school district.
The SABINS project provides block-rectified lists for the school attendance areas in many of the country’s districts for school year 2009-2010. If available for a district, these are sufficiently accurate for use in the school meals programs and would be an easy way for a district to obtain the needed geographic data. The Minnesota Population Center has received support from the National Science Foundation to maintain the SABINS data, and some work is continuing. In early 2012, the panel learned that the SABINS project will be taken over by NCES and ultimately expanded. One of the potential issues associated with using SABINS is that it includes boundary information associated with grades K-12. If a district needs boundary information for prekindergarten grades and they differ from those associated with other grades, these boundaries will not be available from SABINS. SABINS did include most prekindergarten grades in support of this study.
Using the ACS to Determine Eligibility for School Meals
When conducting a survey, one generally is interested in collecting data on a specific concept, even if one cannot always directly observe that concept. Specification error arises when the question or measurement method does not match the target concept. For this study, the panel interpreted specification error somewhat differently: we looked at specific questions in the ACS with respect to the concepts associated with school meals eligibility criteria (e.g., income and reporting unit) compared with the original target concept the survey question was designed to measure. Another example of specification error in our application pertains to the timing of the data. For example, the ACS collects public school enrollment data for the last 3 months and income for the last 12 months from the date the questionnaire is completed, while school meals administrative data are typically dated October 31 of the school year.
A concept related to specification error is measurement error, which arises in the response process. There are many potential sources of measurement error, depending on the type of question. For example, a respondent may have difficulty understanding or be inattentive to the correct meaning of the question; have trouble recalling past events or estimating such items as income in accordance with the questions’ definitions; or provide erroneous answers because of social desirability pressures, perceived stigma, or privacy concerns when answering sensitive questions, such as those about income and program participation.
In considering specification and measurement errors, the panel focused on variables used to estimate eligibility: income, relationships
within the household, program participation (SNAP, public assistance), school status, grade, and age. Using annual aggregate income for the U.S. population as a measure, Czajka and Denmead (2008) found that the ratio of the ACS estimate to the Current Population Survey (CPS) estimate was between .995 and 1.006 for the three lowest income quintiles (the income range of greatest interest to this study), a much narrower range than the three other major household surveys used in their comparison.21 However, the annual figure averages over monthly income fluctuations and, as noted later in this chapter, is likely to indicate as ineligible some students who would be eligible for free or reduced-price meals based on monthly income values (U.S. Census Bureau, 1998). Relative to program eligibility criteria, moreover, household relationships are not completely ascertained in the ACS, and in some situations, such as with multiple family units living in a housing unit, the identification of a household for purposes of eligibility determination may be incomplete. Although the ACS includes a question on SNAP participation during the past year, public assistance programs providing cash income are lumped into a single question, and only some of those programs confer categorical eligibility for free meals. There is also evidence that program participation is underreported in the ACS.22
A key task for the panel was to determine how data collected in the ACS can be used to reflect the eligibility criteria of the school meals programs. This task has several different issues to address: (1) how to use ACS variables to identify public school students, (2) how to apply income eligibility guidelines to determine eligibility, (3) how to define income for purposes of evaluating eligibility for school meals, (4) how to group individuals in households to define a student’s economic unit for school meals eligibility, and (5) how to identify categorically eligible students using ACS variables.
Definition of Public School Students
The ACS collects information on school attendance: whether attending within the last 3 months, public or private school, and grade (or grade range). The ACS also collects information about students’ age. Hence for
____________
21 They used the CPS as a standard because it is the official source of household income and poverty measures for the United States and provides a useful standard.
22 Czajka and Denmead (2008:170) report, “As a rule surveys underreport numbers of participants in means tested programs, so in comparing estimates of participation across surveys, more is generally better.” Of the surveys they examined, the Survey of Income and Program Participation (SIPP) had the highest number, 31.4 million people (or 11.2 percent of the population), in families receiving welfare or food stamps at any time during 2002. The ACS was second, with 24.5 million people or 8.8 percent of the population.
persons in ACS data files who reside in a given public school district or public school attendance area, the Census Bureau can identify those who are less than 20 years old, do not have a high school diploma or general educational development (GED) credential, attended public school within 3 months of the ACS interview, and are in the appropriate grade range. Given the grade range of the school, the total number of such students is an estimate of the number of enrolled students in a calendar year. Most of these variables are not thought to be subject to substantial measurement error; however, there may be specification error in the assignment of students to school years and to districts and schools.
Income Eligibility Guidelines
Income eligibility guidelines are prescribed annually by the secretary of agriculture for use in determining eligibility for free and reduced-price meals and for free milk.23 These guidelines differ by the size of the family or economic unit and whether the student lives in Alaska or Hawaii. Eligibility for free meals is based on income at or below 130 percent of the federal poverty guidelines, while that for reduced-price meals is based on income between 130 and at or below 185 percent of the federal poverty guidelines. Each year the secretary of agriculture announces in the Federal Register the income eligibility guidelines to be used from July 1 of the year they are issued to June 30 of the following year.24
The panel considered two options for using the school-year guidelines with the calendar-year ACS data:
- average the two guidelines from the 2 school years that occurred during the calendar year of the ACS data (e.g., average the guidelines for the 2009-2010 and 2010-2011 school years when using the 2010 ACS data), or
- 2. use the guidelines for the school year that began in the latter half of the calendar year of the ACS data (e.g., use the guidelines for school year 2010-2011 when using the 2010 ACS data).
After deliberating, the panel chose to use the second approach. The primary reason for this decision reflects the observation that most eligibility determinations for the school meals programs are made at the start of the school year, and the income for the “current” calendar year (which is not yet over) would be the best approximation of what the household would report. While a family can submit an application for
____________
23 See http://www.fns.usda.gov/cnd/Governance/notices/iegs/IEGs.htm.
24 See http://www.fns.usda.gov/cnd/Governance/notices/iegs/IEGs09-10.pdf.
the school meals programs any time during the year, the school district sends letters to households of all schoolchildren before the beginning of the school year, informing them of the school meals programs and inviting them to apply. A sample of the applications that have been received by October 1 of the school year must undergo verification. Data on enrollment and certification during October are the official data reported to NCES (as of October 1) and to FNS (as of October 31). Participants in the panel’s workshop indicated that generally about 90 percent of applications are received by the end of October. Workshop participants further commented that possible reasons for later applications include downturns in the local economy that result in job losses, an influx of migrant workers, or attempts to obtain benefits for summer programs.
Definition of Income
In applying to receive benefits under the school meals programs, the “household must report current income on a free and reduced price application. Current income means income received by the household for the current month, the amount projected for the first month the application is made for or for the month prior to application. If this income is higher or lower than usual and does not fairly or accurately represent the household’s actual circumstances, the household may, in conjunction with LEA [local education agency] officials, project its annual rate of income based on the guidelines on special situations” (U.S. Department of Agriculture/Food and Nutrition Service, 2011b:40). In the same document, FNS describes 14 categories that make up the income that should be reported.
The ACS collects data on the gross money income of household members aged 15 and older in the previous 12 months, so an economic unit’s income can be compared against 130 percent and 185 percent of the applicable poverty guideline to determine its income eligibility status. These data are requested in eight detailed categories.
Appendix B further documents and contrasts these two detailed ways of collecting income. The FNS and ACS income definitions appear to be very close, both specifically mentioning most of the same sources of income. A few minor differences are discussed in the appendix.
While the ACS income data are designed to represent families’ calendar-year income, they reflect income received over 2 calendar years. A household is asked to report the amount of income received by each person aged 15 or older in the last 12 months, with about one-twelfth of the sample being interviewed in each month of the calendar year. Consequently, a household interviewed in January 2010 would report income data for January 2009 through December 2009, while a household
interviewed in December 2010 would report income for December 2009 through November 2010. The Census Bureau adjusts each respondent’s reported income using a Consumer Price Index (CPI) price adjustment to reflect differences in consumer prices between the 12-month period that was covered by the respondent’s answers to the income questions and the calendar year of the interview.25 Differences in the timing of income measurement between the ACS and applications for the school meals programs, combined with challenges in determining which school year should apply to a given public school student’s record, contribute to specification error.
Another challenge in using the ACS data on benefit receipt and, more generally, income is reporting error. The ACS is no exception to the well-known phenomenon of underreporting of sources of income, including substantial underreporting of public assistance benefits by survey respondents (see Czajka and Denmead, 2008; Meyer and Sullivan, 2009). It has been hypothesized that income underreporting patterns on surveys are similar to those on applications for benefits.
Definition of Economic Unit
For the school meals programs:
Household composition for the purpose of making an eligibility determination for free and reduced priced benefits is based on economic units. An economic unit is a group of related or unrelated individuals who are not residents of an institution or boarding house but who are living as one economic unit, and who share housing and/or significant income and expenses of its members. Generally, individuals residing in the same house are an economic unit. However, more than one economic unit may reside together in the same house. Separate economic units in the same house are characterized by prorating expenses and economic independence from each other. (U.S. Department of Agriculture/Food and Nutrition Service, 2011b:37)
____________
25 The following is the Census Bureau’s description of its adjustments to income in the ACS: “Income components were reported for the 12 months preceding the interview month. Monthly Consumer Price Indices (CPI) factors were used to inflation-adjust these components to a reference calendar year (January through December). For example, a household interviewed in March 2010 reports their income for March 2009 through February 2010. Their income is adjusted to the 2010 reference calendar year by multiplying their reported income by the 2010 average annual CPI (January-December 2010) and then dividing by the average CPI for March 2009-February 2010.” See http://www.census.gov/acs/www/Downloads/data_documentation/SubjectDefinitions/2010_ACSSubjectDefinitions.pdf.
An alternative and broader definition of an economic unit comes from FNS guidance to local school meals programs regarding the preparation of their application materials.26 Item #11 of the generic Letter to Households says, “Who should I include as members of my household?” The answer is, “You must include all people living in your household, related or not (such as grandparents, other relatives, or friends). You must include yourself and all children living with you.” Applicants are later instructed to list all household members, as well as each type of income for each member. This definition of an economic unit does not raise the possibility of multiple units living within the household and is consistent with the Census Bureau’s definition of a household—all persons living in the same residence.27
The difference between the two FNS definitions of an economic unit led to considerable discussion among panel members. Should the panel attempt to evaluate eligibility based on an economic unit as defined by the Eligibility Manual for School Meals (U.S. Department of Agriculture/Food and Nutrition Service, 2011b), or should we use the definition embedded in the local instructions (i.e., a household)? We concluded that we should do our best to evaluate eligibility based on an economic unit.
For purposes of determining which persons in the household are sharing resources and which are economically independent of other household members, the only relevant information available from the ACS consists of the answer to the questions, “How many people are living or staying at this address?” and “How is each person related to person 1?” Possible responses for related individuals include husband or wife, biological son or daughter, adopted son or daughter, stepson or stepdaughter, brother or sister, father or mother, grandchild, parent-in-law, son-in-law or daughter-in law, and other relative. Possible responses for unrelated individuals include roomer or boarder, housemate or roommate, unmarried partner, foster child, and other nonrelative. The Census Bureau defines all related individuals as a “family” and all persons who live in the housing unit as a “household.”28
The Healthy, Hunger-Free Kids Act of 2010 specifies that foster children are categorically eligible for free meals. The panel’s definition of
____________
26 See http://www.fns.usda.gov/cnd/frp/2010_application.doc.
27 The Eligibility Manual for School Meals definition of an economic unit, cited above, is similar to the definition of a SNAP household in terms of focusing on the sharing of resources and expenses. See http://www.fns.usda.gov/snap/applicant_recipients/eligibility.htm.
28 Not all federal agencies use these definitions. For example, according to the Code of Federal Regulations for Agriculture, 7 CFR 245.2:
245.2(b) Family means a group of related or nonrelated individuals, who are not residents of an institution or boarding house, but who are living as an economic unit; and 245.2(d) Household means family as defined in 245.2(b).
an economic unit removes foster children from a household for purposes of determining the eligibility of other children who may live in the household.29
While being related to the householder does not necessarily imply a sharing of economic resources, the panel chose to make this inference, so that all persons who were related to the householder (members of the family) would be members of the same economic unit. We also chose to include an individual reported as an “unmarried partner” as a member of the economic unit containing family members. We believed that, although not related by blood or marriage to the other members of the primary family, an individual declared to be the householder’s partner would be sharing resources with the family. We denote the family plus unmarried partner the “core family.” The remaining question we addressed was whether to assign unrelated individuals, particularly unrelated children, to this economic unit or to other economic units within the household.
Although there is no perfect solution to the identification of economic units given the data available in the ACS, the panel assessed the sensitivity of eligibility estimates to alternative assignment strategies. As discussed in detail in Appendix B, we prepared tabulations from the 2008 ACS Public Use Microdata Sample (PUMS) file. Five different methods for arranging related and unrelated individuals into economic units in a household were specified and compared at the national level, at the state level, and for the 115 school districts that are coterminous with (that is, occupy the entire same geographic territory as) one or more Public Use Microdata Areas (PUMAs).30 In preparing these tabulations, we removed foster children from the household before determining eligibility for other children. In all five methods, the “primary” economic unit included the core family. Alternatives included different assignments for unrelated individuals (other than the householder’s partner) in a household: (1) all are part of the primary economic unit (resulting in one unit per household); (2) each is a separate economic unit of size one (resulting in two or more units per household); (3) all are in one secondary economic unit (resulting in two units per household); and (4) all are part of the primary economic unit if all unrelated individuals are children (resulting in one unit per household), or all are in a separate economic unit if there is at least one adult among the unrelated individuals (resulting in two units per household).
____________
29 Excluding foster children from a household when determining eligibility was consistent with guidelines in place at the time the panel developed its specifications. Under U.S. Department of Agriculture/Food and Nutrition Service (2011b) foster children are to be counted as part of the household when determining eligibility for other household children.
30 PUMAs were defined for the 2000 census by states in cooperation with the Census Bureau to consist of one or more entire counties with at least 100,000 population; they will be redefined after the 2010 census.
Of these, the panel opted for alternative 4. The primary economic unit consists of the core family. If the only unrelated individuals in a household are children, they are also assigned to the core family’s economic unit. However, if the unrelated individuals in a household include one or more adults, they are collectively considered a second economic unit. The sensitivity analysis led us to conclude that any judgment about the choice of economic unit would likely have only a small impact on estimates of eligible children at the national level. As shown in Appendix B, while there could be more of an impact at the local level, it would still be small.
Categorical Eligibility
As discussed in Chapter 2, income eligibility is not the sole means by which individual students can obtain free school meals; participation in certain programs, for example, offers categorical eligibility for free meals. In the determinations discussed up to this point, eligibility is conferred solely on the basis of income. This section examines how categorical eligibility can increase the estimated percentages of school children who are eligible for free school meals.
Students are categorically eligible for free meals if someone in the family participates in certain means-tested public assistance programs targeting the low-income population. Specifically, students are categorically eligible for free meals if their families receive assistance from SNAP, TANF, or FDPIR. Foster children are also categorically eligible for free meals. Additionally, a student is categorically eligible if a family member is enrolled in a Head Start or Even Start Program (based on meeting that program’s low-income criteria) or if the student is (1) a homeless child as determined by the school district’s homeless liaison or by the director of a homeless shelter, (2) a migrant child as determined by the state or local Migrant Education Program coordinator, or (3) a runaway child who is receiving assistance from a program under the Runaway and Homeless Youth Act and is identified by the local educational liaison (U.S. Department of Agriculture/Food and Nutrition Service, 2011b). These definitions include both students who live in households and students who may not live in typical housing units (runaway, homeless, and some migrant children).
For persons in households, the ACS collects information about the receipt of SNAP benefits and the receipt of public assistance income. The receipt of SNAP benefits is reported on the household portion of the questionnaire. The respondent is asked to report that the household participates in SNAP if any person in that household received SNAP benefits during the past 12 months. Data on public assistance income are collected as item f in the income questions completed for each person in
the household aged 15 and older. Specifically, the respondent is asked to report “the amount of any public assistance or welfare payments from the state or local welfare office” received during the past 12 months. Although this amount may include payments from TANF, which confers categorical eligibility, it may also include payments from programs that do not confer categorical eligibility.31
While the ACS cannot be used to identify all sources of categorical eligibility, it can be used to identify those that affect the greatest number of children: SNAP and TANF. However, one challenge in using the ACS data on benefit receipt to measure categorical eligibility, discussed earlier, is reporting error (Czajka and Denmead, 2008:170). In the case of benefit receipt, a match between ACS and public records in Maryland showed that many ACS respondents do not report the SNAP or TANF benefits they actually receive.32,33,34 There is also specification error because the time frames of the ACS SNAP and public assistance data (indicating participation at any time during the calendar year preceding the date of the ACS interview) do not match the time frame of the administrative data (indicating current participation) used to conduct direct certification or otherwise identify categorically eligible students in the school meals programs.
While one might expect that all categorically eligible students would also be income-eligible, there could be some categorically eligible students who are not estimated to be income-eligible based on the available ACS data. Reasons for this discrepancy could include not only measurement error in reporting income and program participation on the ACS, but also the fact that SNAP or welfare program participation may have
____________
31 This potential shortcoming (inclusion in “public assistance” of state or local program benefits that do not confer categorical eligibility) is more than offset by the underreporting of TANF benefits. Meyer and colleagues (2009) show that in 2004, the most recent year for which they had data, administrative TANF dollar amounts exceeded ACS reports of receipt of public assistance by 15.6 percent of total TANF receipts.
32 Two studies document results building on a match between ACS and SNAP records in Maryland. Taeuber and colleagues (2004) matched (weighted) 87,420 ACS records of households that reported receiving SNAP benefits in 2000-2001 to state benefit data but found an additional 50,939 ACS households that reported not receiving SNAP benefits when they were according to Maryland records. In an earlier study, Taeuber and colleagues (2003) found that the underreporting was greater for households without children than for households with children.
33 Lynch and colleagues (2007) used a match of TANF records in Maryland to examine household characteristics related to underreporting. Of the 95 households in the match, 43 said “yes” to “public assistance” and 52 said “no.” False-negative reporting accounts for 81 percent of the discrepancy. One reason for underreporting of TANF benefits for children is that “public assistance” is an income variable not reported for children under 15.
34 A more recent match of 2001 ACS data with state-level administrative data for Maryland and Illinois found similar results (Meyer and George, 2011).
been gained on the basis of a period of low monthly income, while the 12-month income reported in the ACS was too high to meet the income eligibility criteria for the school meals programs. Additionally, broad-based categorical eligibility for SNAP (and hence free school meals) is conferred if a household qualifies for a noncash TANF or other benefit. A household (and hence students in a household) may qualify for noncash TANF benefits despite having income that exceeds the eligibility guidelines for SNAP or the school meals programs.
The panel compared ACS estimates of eligibility using our preferred definition of an economic unit and considering the household to be a single economic unit in order to evaluate the contribution of receipt of SNAP benefits and public assistance income to the percentages of children eligible for free, reduced-price, and full-price school meals. This analysis, using the 2008 PUMS file, is described in Appendix B. The addition of categorical eligibility due to receipt of SNAP benefits increases the percentage eligible for free meals by a little more than 5 percentage points for both definitions of an economic unit. Accounting for categorical eligibility because of receipt of both SNAP benefits and public assistance income increases the percentage eligible for free meals by nearly 6 percentage points for both economic unit definitions.35
Based on these results, the panel believes that SNAP and public assistance should be included in ACS tabulations of eligibility to account for categorical eligibility. These variables appear to identify students who are not eligible for free meals based on ACS income alone. The only caveat is that because of underreporting of SNAP benefits and public assistance income on the ACS and other household surveys, this approach likely does not capture all such categorically eligible students.
Group Quarters
In addition to people living in households, the ACS includes individuals who live in group quarters. These individuals are surveyed as part of the ACS, but using a separate methodology. According to the Census Bureau:
Group quarters are places where people live or stay, in a group living arrangement that is owned or managed by an entity or organization
____________
35 Accounting for both SNAP and public assistance decreased the percentage eligible for reduced-price meals by about 2.5 percentage points for both economic unit definitions and the percentage eligible for full-price meals by about 3.5 percentage points. Accounting only for SNAP participation decreased the percentage eligible for reduced-price meals by 2.4 percentage points and the percentage eligible for full-price meals by more than 2.6 percentage points under both economic unit definitions.
providing housing and/or services for the residents. These services may include custodial or medical care as well as other types of assistance, and residency is commonly restricted to those receiving these services. People living in group quarters usually are not related to each other. Group quarters include such places as college residence halls, residential treatment centers, skilled nursing facilities, group homes, military barracks, correctional facilities, workers’ dormitories, and facilities for people experi encing homelessness. (U.S. Census Bureau, 2009:8-1)
The ACS has separate categories for institutional group quarters, such as correctional facilities and nursing homes, and for noninstitutional group quarters, such as college dormitories, military barracks, migrant worker camps, and shelters. Only a subset of the noninstitutional group quarters population might include children attending public schools.
The ACS survey of group quarters is based on independent state samples. For each state, a list of group quarters is constructed,36 and a sample of included facilities is selected. An ACS interviewer collects data from a sample of residents at each sampled facility. The questions asked of group quarters residents include all the person-level questions of the ACS except household relationship and only the food stamp question from the housing unit questionnaire. Group quarters facilities were not included in the 2005 sample but have been included since 2006.
The Census Bureau provided the panel with useful information about the group quarters portion of the ACS, including the methods used for sample selection and estimation and the quality of the data at the state and substate levels. Because the group quarters survey is a state-based design, state-level estimates are of high quality. However, the quality of estimates at the substate level is highly variable, particularly by group quarters type. In part, this is because approximately half of all tracts listed with group quarters addresses in the Census Bureau’s Master Address File sampling frame have had no sample units selected for 5 years. As a result, some areas and some types of group quarters are overrepresented in the sample, and some are underrepresented.
For purposes of this study, ACS data must provide estimates of eligibility for the school meals programs for small geographic areas defined by individual schools or school districts. All children attending these schools are eligible to obtain school meals for free or at the reduced or full price whether they live in traditional housing units or group quarters. Students
____________
36 According to U.S. Census Bureau (2009:4-9), the ACS frame excludes domestic violence shelters, soup kitchens, regularly scheduled mobile food vans, targeted nonsheltered outdoor locations, crews of commercial maritime vessels, natural disaster shelters, and dangerous encampments for a variety of reasons, including concerns about privacy and confidentiality and the operational feasibility of repeat interviewing for a continuing survey.
attending public schools who live in group quarters (and are most likely migrant, runaway, or homeless youth) may be categorically eligible for free meals. Since the group quarters data are not reliable for small areas and since local school districts are likely to have good knowledge of students in their schools that come from group quarters, the panel concluded that group quarters students would be excluded from ACS tabulations. At our workshop, school district representatives indicated that they have information about the number of migrant, homeless, runaway, and other “group quarters” children in their jurisdictions. Our proposal, described in detail later in the report, allows districts to use local counts of categorically eligible children who do not live in traditional housing in computing final eligibility percentages and claiming percentages under the AEO.
Summary of Conclusions on How to Estimate Eligibility for Free and Reduced-Price School Meals
Based on the discussion presented above, the panel came to the following conclusions, which are reflected in the specifications provided to the Census Bureau in our request for tabulations (see Appendix D).
Conclusion 1: Providing a list of blocks associated with each grade in a school for the Census Bureau to use in constructing school attendance area estimates is an acceptable approach for tabulating ACS data for the school meals programs. School districts that plan to use this approach should evaluate blocks at the borders to ensure that large population groups are not assigned incorrectly.
Conclusion 2: An appropriate definition of a public school student in the ACS is a person aged 20 or younger with no high school diploma or GED who attended public school within the past 3 months and was in a grade included in the school or school district.37
Conclusion 3: The appropriate income eligibility guidelines to use with ACS data are those for the school year that began in the last half of the past calendar year referenced by the ACS data.
Conclusion 4: Because the ACS definition of income is sufficiently close to the definition of income for the school meals programs and the ACS measure of annual income is sufficiently close to other widely used measures of annual income, the ACS definition of income is
____________
37 This definition does not use a lower limit on the age of a student. The definition allows students in pre-kindergarten programs and kindergarten if the school includes such students.
suitable for estimating income eligibility for the school meals programs. It should be noted, however, that the ACS income estimates for a calendar year reflect an average of incomes received in the past 12 months spanning a 2-year period. This income measure will not be as responsive to changes in economic conditions as will income measured in surveys for which the time frame covers a single calendar year, such as the CPS, and will also be less responsive than monthly income reported on applications for the school meals programs. Consequently, in areas where economic conditions are deteriorating (e.g., unemployment is rising), the ACS will likely understate the number of students eligible for free or reduced-price meals. Conversely, in periods of recovery, the ACS will likely overstate the number of students eligible for free or reduced-price meals.
Conclusion 5: Based on the analysis performed by the panel and our interpretation of the school meals programs’ definition of an economic unit, an appropriate definition of an economic unit for determining eligibility for free or reduced-price school meals should allow for multiple economic units in an ACS household.
Conclusion 6: ACS data on the receipt of SNAP benefits and public assistance income should be used to account for categorical eligibility when deriving eligibility estimates for the school meals programs.
Conclusion 7: ACS group quarters data should not be used in estimating students eligible for free or reduced-price meals. Instead, districts should be allowed to adjust ACS eligibility estimates using valid local data on students who do not live in traditional housing.
Potential Limitations
This section summarizes some of the limitations associated with using geographic boundaries and the ACS variables to define the public school student population in total and the percentage that is eligible for free and reduced-price school meals.
Reasons for geography-related differences between actual enrollment in a school and residence in the school’s catchment area include the following: (1) there may be students who attend the school but live outside the school catchment area, (2) there may be students who live within the school catchment area but do not attend the school, (3) school boundaries change over time, and (4) the boundaries used for tabulating ACS data might not reflect the latest changes. The first two issues are related to the presence and effects of charter schools, magnet schools, open enroll-
ment policies, and other school choice programs. Choice programs could result in an understatement of the percentage of students eligible for free or reduced-price meals if such programs tend to draw the more affluent students away from their neighborhood schools. Enrollment estimates could be similarly affected.
The collection of annual rather than monthly income in the ACS and the underreporting of SNAP benefits and public assistance income are likely to produce an underestimate of the percentage of students eligible for free meals when the ACS is used. As discussed below, this might necessitate some adjustment or benchmarking.
The impact of the exclusion of students who live in nontraditional housing from ACS estimates will likely contribute to underestimation of both enrollment and the number of students eligible for free meals. The impact would probably be small in most districts, but it could be large in some. To address this issue, the panel believes that local districts either have or can obtain valid data that could be used for an adjustment. All of these potential limitations of ACS estimates are addressed further in Chapters 4 and 5.
APPROACH TO EVALUATING ACS ESTIMATES
Estimates from probability survey samples such as the ACS are evaluated using a framework called “total survey error,” which identifies the types of errors that occur at various points in the development of a survey estimate. Components of total survey error include sampling (reflecting the fact that data are collected on a portion, rather than all, of the population), coverage (the degree to which the frame used to draw the sample includes the entire target population), nonresponse (failure to obtain responses for the entire sample), specification (the degree to which a question asked matches the concept about which information is desired), measurement (unintentional or intentional errors in a respondent’s answer), and processing (errors in applying coding, statistical processing, and estimation methods). In the context of estimating eligibility for free and reduced-price school meals, the most problematic error components for the ACS are likely to be sampling, specification, and measurement error. The ACS has relatively high coverage and response rates, and processing errors in an ongoing survey tend to be small because of the repeated use of systems developed for the survey. Also important to consider, as indicated in the previous section on limitations, are errors in the panel’s specifications for using the ACS data to estimate eligibility for the school meals programs.
In March-April 2011, using the panel’s specifications, the Census
Bureau provided us with ACS 5-year estimates for 2005-2009 for enrollment, percentage of students eligible for free meals, percentage of students eligible for reduced-price meals, and percentage of students eligible for full-price meals (and standard errors for each estimate) for all school districts in the country. The Bureau also provided 3-year estimates for districts with populations greater than 20,000 for the 2005-2007, 2006-2008, and 2007-2009 periods and 1-year estimates for the largest districts—those with populations greater than 65,000—for each year from 2005 to 2009. In addition, the Census Bureau provided five 1-year model-based ACS estimates for the percentage of students eligible for free meals and the percentage eligible for reduced-price meals for each year from 2005 to 2009. It also provided one set of ACS direct 5-year estimates and five sets of 1-year model-based ACS estimates for all schools with boundaries in our five case study districts.
This section describes the panel’s approach to evaluating the quality of the ACS-based estimates of eligibility through a comparison with estimates from other data sources. Results of the comparison are presented in Chapter 4. In particular, ACS direct and ACS model-based estimates for school districts were compared with administrative estimates from the CCD, which, while not error-free, is the most complete and readily usable alternative source of data for school districts and schools available to the panel. ACS direct and model-based estimates were also compared with each other to help us determine which might be best to use in the AEO. Finally, estimates from the FNS-742 administrative data were compared with the CCD administrative estimates to help in assessing any differences between these two benchmarks that might illuminate our comparisons. At the school level, the ACS 5-year and model-based estimates were compared with estimates from administrative data provided by the case study districts. School-level data provided by the districts were also compared with CCD school-level data.
A number of questions needed to be answered through this evaluation.
- Are ACS direct and model-based estimates for school districts consistent with administrative estimates from the CCD? Are ACS estimates for schools consistent with administrative estimates provided by the case study school districts and administrative estimates from the CCD? These comparisons would identify whether there are systematic differences between estimates from the survey and administrative data sources.
- How variable are the ACS estimates? We assessed precision, as measured by the variance, standard error (SE), or coefficient of
variation (CV),38 as well as variation over time. Variation over time will be important for school districts considering a new provision because such variation causes changes in reimbursement from year to year, some of which are desirable and some of which are not from a district’s perspective. Finally what is the trade-off between temporal stability and responsiveness to real changes in socioeconomic conditions?
- Is the difference between ACS estimates and CCD estimates related to district characteristics? Among the characteristics we considered were size of district (measured by enrollment) and prevalence of students certified for free or reduced-price meals (measured by FRPL category).
Our analyses needed to address another issue—the relationships among three distributions: (1) the distribution of students eligible or certified in a district by category (free, reduced price, full price); (2) the distribution of meals served in a district by category under traditional operating procedures when some students pay (based on their certification status) the reduced price or full price for a meal; and (3) the distribution of meals that a district would expect to serve by category under the AEO when meals are provided free to all students. Understanding these relationships is critical for developing claiming percentages that reflect not only the distribution of eligible students but also the rates at which they participate, that is, take meals when the meals are free for everyone. Under standard economic assumptions, we expect those participation rates (under the AEO) to be higher than the rates under traditional operating procedures, which will affect the distribution of meals served. It is appropriate that this participation effect of the AEO be captured in the percentages used to claim reimbursement under the AEO. Analyzing such claiming percentages, the projected reimbursements implied by
____________
38 Accuracy is assessed by comparing an estimator to a true value. The theoretical bias of an estimator is defined as its mean (its average or expected value over repeated sampling) minus the true value. An estimator is said to be “unbiased” if its bias is zero. It is approximately unbiased if it is on average “close” to the true value; for example, “close” might mean that the (absolute value of the) bias is less than 5 percent of the truth. An accurate estimator is at least approximately unbiased. An estimator is said to be precise if its expected variation in repeated sampling is small. The theoretical variance measures expected variation as the average squared deviation of the estimator from its mean. The standard error of an estimator is the square root of its variance, and is expressed in the same units as the measurements and, thus, the mean. The CV expresses the variation in a way that does not depend on the unit of measurement. It is the ratio of the SE to the mean. The mean squared error (MSE) is measured as the average squared deviation of the estimator from the true value. It is equal to the sum of the variance and the squared bias. The root mean squared error (RMSE) is the square root of the MSE. It is in the same units as the measurements.
those percentages, and the ACS eligibility estimates, a school district will be able to assess the financial viability of adopting the AEO.
The key parameters of interest for our analysis include the percentage of enrolled students eligible for free meals, the percentage eligible for reduced-price meals, and the sum of the two: the percentage eligible for either free or reduced-price meals. In addition, the panel focuses on the BRR as a summary measure of the distribution of students (or meals served) across the free, reduced-price, and full-price categories. The BRR is the average reimbursement per meal under the assumption that reimbursement is based on eligibility, certification, or meals served percentages, and is calculated as a weighted sum of the percentages for the free, reduced-price, and full-price categories. The weights in the sum are the per meal reimbursement rates paid by the federal government. We used the rates that were in effect during 2008-2009 in a district eligible for the $.02 per meal increment: $2.59, $2.19, and $.26 for free, reduced-price, and full-price meals, respectively. (Constant reimbursement values were used so that comparisons over time would not be affected by inflation.)
As described above, the panel classified districts based on two main characteristics: (1) percentage of students eligible for free or reduced-price meals and (2) size (small, medium, or large). The free or reduced-price percentage is directly related to a district’s potential interest in the AEO. The so-called “very high FRPL” districts had at least one free or reduced-price percentage equal to or greater than 75 percent over a span of several school years (2004-2005 through 2009-2010) and might consider district-wide adoption of the AEO. During those same school years, the so-called “high FRPL” districts had free or reduced-price percentages of 50 percent in at least one year but never as high as 75 percent and might consider the AEO, but perhaps only for a subset of schools. Districts with free or reduced-price percentages of less than 50 percent in every year are unlikely to benefit from the AEO.
Two aspects of district size are important to the panel. The definitions of small, medium, and large presented above are related to the ACS direct estimates that would be available to a district. Population size is important as well because it is related to sample size and hence sampling error (larger samples are associated with smaller sampling error). In our analyses, we also used a related measure of size—enrollment. As noted previously, Table 3-1 shows the population of school districts categorized according to free and reduced-price percentage and district population size. As discussed above, we had available five 1-year ACS estimates for the large school districts, three 3-year estimates for the medium districts, and only one 5-year estimate for the small districts. Table 3-3 illustrates the theoretical sampling error associated with different enrollment categories and different free or reduced-price percentages.
|
|
||||||
| ACS Release | School Enrollment | Fraction of Students Eligible for Free or Reduced-Price Meals | ||||
| 0.5 | 0.6 | 0.7 | 0.8 | 0.9 | ||
|
|
||||||
| 1-year | 12,000 | 0.091 | 0.090 | 0.084 | 0.073 | 0.055 |
| 1-year | 16,000 | 0.079 | 0.077 | 0.072 | 0.063 | 0.047 |
| 1-year | 20,000 | 0.071 | 0.069 | 0.065 | 0.057 | 0.042 |
| 3-year | 4,000 | 0.089 | 0.088 | 0.082 | 0.071 | 0.054 |
| 3-year | 7,000 | 0.068 | 0.066 | 0.062 | 0.054 | 0.041 |
| 3-year | 10,000 | 0.057 | 0.055 | 0.052 | 0.045 | 0.034 |
| 5-year | 500 | 0.191 | 0.187 | 0.175 | 0.153 | 0.115 |
| 5-year | 1,500 | 0.110 | 0.108 | 0.101 | 0.088 | 0.066 |
| 5-year | 3,000 | 0.078 | 0.076 | 0.071 | 0.062 | 0.047 |
|
|
||||||
NOTE: For purposes of this report, we calculated standard errors using the formula for a simple random sample and a design effect of 3. Data provided by the Census Bureau include the actual standard errors of all estimates. The standard error divided by the estimate and converted to a percentage gives the coeffcient of variation (CV), which should be 10 percent or less by commonly used statistical standards; a higher CV indicates a less reliable estimate. In this table, the standard errors in boldface type are 10 percent or less of the estimated fraction of students eligible for free or reduced-price meals.
SOURCE: Prepared by the panel.
Systematic Differences
To address the question of consistency between estimates from the ACS and alternative administrative data sources, the panel evaluated the difference between an ACS estimate (enrollment, percentage free, percentage reduced price, percentage free or reduced price, BRR) and the corresponding estimate from an alternative data source computed for each school district or school in our evaluation database.39 If the average of these differences over a large group of districts (or schools) were near zero, we would conclude that there is no systematic difference between the two estimates. We analyzed systematic differences by examining the average difference over districts or schools grouped by variables that we think may have a relationship to such differences: FRPL level and size. We also analyzed potential sources of differences using additional data, including SNAP administrative data and data from the Survey of Income and Program Participation (SIPP). In addition, we considered whether a
____________
39 The panel’s evaluation data base is named prog9_merged_fns_wSE.xlsx.
regression model could be used to adjust for differences between ACS and CCD estimates based on demographic and other variables that were available from the CCD.
Precision, Intertemporal Stability, and Timeliness
To evaluate precision, intertemporal stability, and timeliness, the panel concentrated on the BRR because it is stability of reimbursement that is of greatest importance to school food authority directors. For ACS estimates (direct and model-based), the primary measure of precision is the sampling error, as measured by the standard error.40 Because they are based on a larger sample, the 5-year ACS estimates for a district will have smaller sampling error than the 3-year or 1-year estimates. However, this greater precision comes at a price: a 5-year ACS estimate reflects the average observed over a 5-year period, and thus will be relatively slow in adjusting to real changes in the economy. Trade-offs between stability and timeliness are assessed by comparing the year-to-year variability in BRRs computed using CCD certification data versus the alternative ACS eligibility estimates (1-, 3-, and 5-year). The BRRs based on CCD certification percentages provide an indication of the year-to-year variation in reimbursement that is normally experienced by and, therefore, will likely be acceptable to districts. Data on school district reimbursements under the school meals programs were not available to the panel, so there is no way to compare ACS estimates with actual reimbursement data.
Participation
For the case study districts and schools within those districts, the panel compared BRRs based entirely on distributions of students with BRRs based on distributions of meals served. These distributions and the associated BRRs differ because students in the different categories participate at different rates, with, generally, students receiving free meals having the highest rate, students paying full price having the lowest rate, and students paying a reduced price having a rate between the other two. The BRRs based on the distribution of meals served reflect these differential participation rates, whereas the BRRs based entirely on the distribution of eligible or certified students take no account of participation. Comparing the BRRs illustrates how a district would generally be underreimbursed if participation were not taken into account in developing claiming percentages.
____________
40 Standard errors were provided by the Census Bureau for all ACS direct and model-based estimates.
Taking participation into account, however, is complicated because participation rates will likely increase in each category—probably by different amounts—if a district adopts the AEO and provides free meals to all students in some or all of its schools. As noted above, given standard economic assumptions about the role of prices in demand for school meals (that school meals are a normal good, for which demand increases when the price decreases), adoption of the AEO would be expected to increase demand among all students who were not already approved to receive free meals. The availability of free school meals for all students might also be expected to increase demand (increase the number of school meals consumed) among those eligible for free meals because it would reduce the family’s burden of applying for benefits and remove any perceived stigma associated with participating in the program. Because the panel had limited data with which to assess the impact of increases in participation attributable to providing free meals, we simulated the potential effects of the AEO on participation and examined how the simulated participation effects would affect BRRs. In light of our results, our proposed procedure for implementing the AEO includes the operation of a base year during which all students receive free meals, applications are solicited from parents, and certification and verification are conducted. With this approach, as under Provision 2, the increases in participation can be estimated and reflected in claiming percentages. The claiming percentages will also incorporate eligibility estimates based on the most recently released ACS data.
Assessment of the Need for Benchmarking
The panel’s central goal was to assess the suitability of ACS estimates to support the school meals programs from the perspective of the estimates’ fitness for use. We found that the conceptual fit of the ACS estimates is acceptable, although it would benefit from additional research. Chapter 4 presents our analysis of any systematic differences between ACS and administrative estimates and considers the precision, temporal stability, and timeliness of ACS estimates. If there are districts in which ACS eligibility estimates fluctuate excessively in ways that are not consistent with real changes in socioeconomic conditions, there will be little a district can do other than decide not to adopt the AEO. If ACS estimates are fairly stable but differ systematically from administrative estimates, however, a procedure for benchmarking the ACS estimates to the administrative estimates could provide the best way to use ACS data in support of the school meals programs. Based on the results of our analyses (presented in Chapter 4 and in several appendixes), we developed procedures for implementing the AEO, presented in Chapter 5.


