
To determine the suitability of the American Community Survey (ACS) as a source of claiming percentages for reimbursement under an ACS Eligibility Option (AEO) for universal free school meals, the panel implemented the technical approach described in Chapter 3 and conducted extensive analyses of the ACS direct and model-based estimates produced by the U.S. Census Bureau. This chapter describes the principal results of these analyses and presents the panel’s main conclusions. Additional results from our analyses are reported in Appendix F.1
The chapter begins with an analysis of the differences between ACS and administrative estimates, including consideration of the many reasons why such differences might arise. The potential sources of differences include errors in each set of estimates. ACS estimates are subject not only to sampling error but also to nonsampling error from, for example, households not responding at all to the survey or responding incorrectly by misreporting their incomes or whether they received benefits from the Supplemental Nutrition Assistance Program (SNAP, formerly the Food Stamp Program). Although not subject to sampling error, administrative estimates reflect the effects of certification error, as discussed in Chapter 2, as well as data entry, tabulation, and transmission error. Some differences between the estimates are undoubtedly attributable to the use of survey
____________
1 To simplify an already complex set of analyses, the panel focused on school lunches. For a district considering actual implementation of the AEO, it will be important to consider breakfasts separately from lunches, given the different reimbursement rates for the two programs.
versus administrative procedures, while others arise because the procedures are intended to obtain different data. For example, the ACS collects data on income received in the past 12 months on a rolling basis. Thus households interviewed in January report on income received during the period from the previous January through December, while households interviewed in December report on income received during the period from the previous December through November. In contrast, school meals program applications obtain data on current monthly income, which will typically be income for the month in which the application is being completed or the previous month—probably July, August, or September for most students. Even if the data obtained by the ACS and by program applications are fully accurate, eligibility based on annual income can be different from eligibility and certification based on monthly income. Yet another difference is that the ACS records where students live, while school meals program certification data are based on where students attend school. In areas with school choice options, such as charter and magnet schools or open enrollment policies, some students may not attend their neighborhood school or even any school in the district in which they reside. This phenomenon will be captured in the administrative data but not the ACS data.
The second section of the chapter presents the panel’s analysis of the precision, intertemporal stability, and timeliness, as well as the general relative performance, of the alternative estimates from the ACS, including the 1-year, 3-year, 5-year, and model-based estimates. As discussed in Chapter 3, stability in reimbursement is important to districts because it facilitates budgeting and other planning activities involved in operating the school meals programs. Nonetheless, some instability in reimbursement occurs naturally under traditional operating procedures as a result of changes in certification percentages and participation rates from year to year due to ups and downs in the economy, outreach efforts by school authorities, and other factors. However, basing reimbursements on ACS estimates will introduce additional instability due to sampling variability and other sources of error that cause estimates to fluctuate. Because they are based on larger samples and average the data collected in different years, 5-year ACS estimates will tend to be more precise and stable than 3-year estimates, which will be more precise and stable than 1-year estimates. However, the precision and stability carry a cost: the 5-year estimates and, to a lesser degree, the 3-year estimates will be less timely and less responsive to real changes in socioeconomic conditions. The panel’s analyses explored these trade-offs.
The panel also explored the role of participation—that is, the purchase or free receipt of meals by students. Participation is important because it is the basis for reimbursing districts for the meals they serve
under traditional operating procedures or Provisions 2 and 3. The ACS, however, does not collect data on participation. It provides estimates of eligibility, specifically the numbers and percentages of students eligible for free, reduced-price, and full-price meals. Unless students in the three eligibility categories participate at the same rate, which, generally, they do not, the distributions across the categories of students and of meals served will not be the same and may differ substantially. Thus claiming percentages based entirely on the percentages of eligible students in each category will differ from claiming percentages based on the percentages of meals served in each category. In fact, with students eligible for free and reduced-price meals participating at higher rates than students paying full price, claiming percentages based solely on ACS estimates of eligible students—with no accounting for differences in participation— could cause districts to be substantially under reimbursed should they adopt the AEO. This effect could be at least partially mitigated, however, by the changes in participation that might occur under the AEO with free meals being offered to all students, substantially lowering the monetary cost of meals for those students formerly paying full price and increasing their participation rates relative to other students. In the third section of the chapter, the panel analyzes the role of participation and the potential effect of offering free meals to all students under the AEO. In Chapter 5, we propose an approach to implementing the AEO that incorporates into the AEO claiming percentages not only the ACS eligibility estimates but also the participation rates of students when all are offered free meals.
DIFFERENCES BETWEEN ACS AND ADMINISTRATIVE ESTIMATES
The panel compared ACS estimates of students eligible for school meals by category (free, reduced price, full price) with administrative data on students certified for each category. The administrative data are from the Common Core of Data (CCD) for most of our analyses at the district level. School districts report data for the CCD to state agencies, which submit the data to the National Center for Education Statistics. For our school-level analyses, the case study districts provided the administrative data directly to us at our request. As described in Chapter 3, the administrative data are subject to error; thus, they are not a gold standard. However, they were the best standard available to us. Although we generally characterize average differences between ACS and administrative estimates as measures of systematic error in the ACS estimates, the limitations of the administrative data should be kept in mind. Later in this chapter, we explore the potential effects of certification error in the
administrative estimates on the differences between ACS and administrative estimates.
The analyses presented in this chapter focus on those districts for which the AEO is most relevant: the districts described as “very high FRPL [free or reduced-price lunch]” and “high FRPL” in Chapter 3. A very high FRPL district had at least 75 percent of its students eligible for free or reduced-price meals according to the CCD in one or more school years from 2004-2005 to 2009-2010. Although a high FRPL district never reached that threshold, it did have at least 50 percent of its students eligible for free or reduced-price meals during one or more of those years. For some of our analyses of these districts, we present separate results for large, medium, and small districts. The large districts have populations of at least 65,000, and thus have 1-year ACS estimates as well as 3- and 5-year estimates. The medium districts have populations of 20,000 to 65,000 and have 3- and 5-year but not 1-year ACS estimates. The remaining districts, with populations under 20,000, have only 5-year ACS estimates and are designated as small. Although all districts included in our analyses have model-based estimates, we focus in this section on the 1-, 3-, and 5-year direct estimates from the ACS.
Systematic Differences Between ACS and Administrative Estimates
The panel’s analyses revealed that ACS estimates differ systematically from administrative estimates for districts that might be most interested in the AEO. Figure 4-1 plots ACS and CCD estimates of the percentage of students eligible for free meals in very high FRPL districts. The ACS estimates are 5-year estimates for 2005-2009, and the CCD estimates are for school year (SY) 2009-2010. Because the purpose of using ACS data is to provide current estimates, we compare the most recent ACS estimates with the most recent estimates from the CCD. Thus, the ACS 5-year estimates for 2005-2009 are compared with the CDD estimates for SY 2009-2010.2 Some of the observed average difference between these two sets of estimates maybe attributable solely to their different reference periods and the fact that the economy was worsening, resulting in an upward trend in the percentage of students eligible for free or reduced-price meals. From 2005 to 2009 according to the CCD, the percentage of students eligible for free or reduced-price meals in very high FRPL districts rose from 76.3 percent to 79.7 percent. For high FRPL and all districts,
____________
2 We follow the same principle with 3-year estimates, comparing the estimates for 2005-2007, 2006-2008, and 2007-2009 with CCD estimates for school years 2007-2008, 2008-2009, and 2009-2010, respectively.
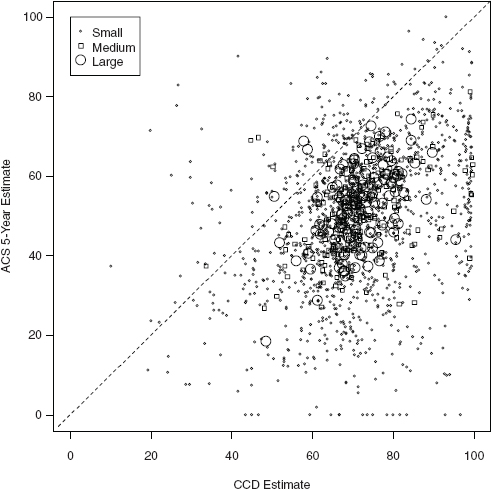
FIGURE 4-1 Comparison of ACS 5-year (2005-2009) and CCD (2009-2010) estimates for very high FRPL districts: Percentage of students eligible for free meals.
NOTE: ACS = American Community Survey; CCD = Common Core of Data; FRPL = free or reduced-price lunch.
SOURCE: Prepared by the panel.
this percentage increased from 52.9 percent to 59.8 percent and from 43.2 percent to 47.5 percent, respectively.3,4
____________
3 For very high FRPL districts, the percentages of students eligible for free or reduced-price meals were 76.3, 75.4, 75.3, 77.6, and 79.7 for 2005, 2006, 2007, 2008, and 2009, respectively, according to the CCD. For the high FRPL districts, the corresponding percentages were 52.9, 53.1, 54.2, 56.3, and 59.8, and for all districts, they were 43.2, 43.3, 43.8, 45.3, and 47.5.
4 Although the use of older data is a potentially serious limitation of the 5-year estimates relative to the 1-year and even the 3-year estimates, we also compared the 5-year ACS esti mates with 5-year averages of CCD estimates to assess their differences when they include,
In Figure 4-1, the overwhelming majority of districts fall below the 45° line of equality between the estimates, indicating that the ACS identifies a smaller percentage of students as eligible for free meals relative to the CCD. For many of these very high FRPL districts, the percentage of students eligible for free meals according to the ACS is substantially lower than the percentage based on the administrative data on certified students.
In contrast, a different pattern pertains to the estimates of students eligible for reduced-price meals. According to Figure 4-2,5 the ACS estimate exceeds the CCD estimate for a majority of districts, but the difference often is just a few percentage points. Many districts are clustered around the line of equality between the ACS and administrative estimates for the reduced-price category.
The scatter plots in Figures 4-1 and 4-2 suggest that for the typical very high FRPL district, the ACS substantially underestimates the percentage eligible for free meals and slightly overestimates the percentage eligible for reduced-price meals. The net effect of these patterns is that on average, the ACS estimate is substantially less than the CCD estimate for the percentage of students eligible for free or reduced-price meals and for the blended reimbursement rate (BRR) based on eligible students, as shown in Figures 4-3 and 4-4, respectively.
Tables 4-1, 4-2, 4-3, and 4-4 provide numerical estimates of the average differences between ACS and CCD eligibility percentages and BRRs.6 The first column in the top panel of Table 4-1 pertains to 5-year estimates for all very high FRPL districts and corresponds to the results presented
____________
in principle, the same trend within the reference period of the estimates. The results of that comparison are qualitatively the same as the3 results of our comparisons of 5-year ACS estimates with 1-year CCD estimates. Although statistically significant for all types of estimates and large for percentage free, percentage free or reduced price, and BRR, the differences, of course, are smaller than those from our main comparisons because the differences based on CCD 5-year averages ignore the loss of timeliness due to the use of older data by the ACS 5-year estimates. Further details can be found in Appen dix F, which also presents a comparison of 3-year ACS estimates with 3-year averages of CCD estimates.
5 In this figure, the 5-year ACS estimates have a relatively large number of sampling zeros because the percentage eligible for reduced-price meals is relatively small, and some districts are small areas. One possible reason for zeros in the CCD data is that missing data are recorded as zeros.
6 For reasons given above, Tables 4-1, 4-2, and 4-4 compare the ACS 5- and 3-year estimates with the CCD estimates for the most recent school year in the reference period of the ACS estimates. Accordingly, the ACS 5-year estimates for 2005-2009 and 3-year estimates for 2007-2009, for example, are compared with the CCD estimates for SY 2009-2010. Appendix F presents tables that compare the ACS 5- and 3-year estimates with 5- and 3-year averages of CCD estimates for the same time periods. Such comparisons reflect differences when data are aligned in time but do not reflect the loss of timeliness that would result from using the multiyear estimates in the AEO.
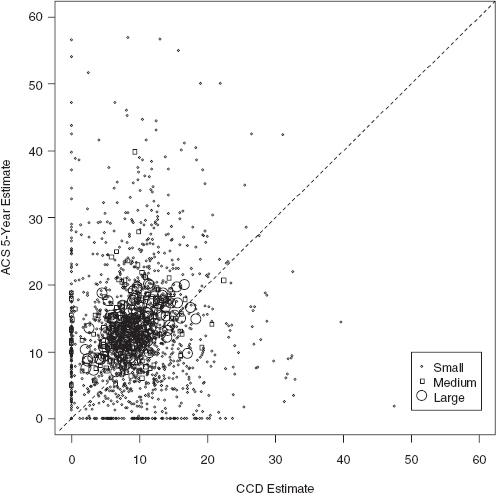
FIGURE 4-2 Comparison of ACS 5-year (2005-2009) and CCD (2009-2010) estimates for very high FRPL districts: Percentage of students eligible for reduced-price meals.
NOTES: This figure excludes two outliers. Both are small districts. One has a CCD estimate of 2 percent and an ACS estimate of 78 percent, and the other has a CCD estimate of 80 percent and an ACS estimate of 6 percent. ACS = American Community Survey; CCD = Common Core of Data; FRPL = free or reduced-price lunch.
SOURCE: Prepared by the panel.
in Figures 4-1 through 4-4. The last three columns in the top panel of Table 4-1 provide separate estimates for large, medium, and small districts, and the bottom panel provides estimates of average ACS-CCD differences for high FRPL districts. Tables 4-2 and 4-3 display average ACS-CCD differences for 3-year and 1-year ACS estimates, respectively. Table 4-2 includes
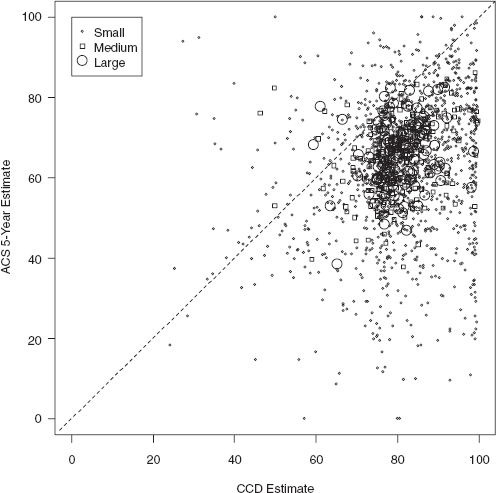
FIGURE 4-3 Comparison of ACS 5-year (2005-2009) and CCD (2009-2010) estimates for very high FRPL districts: Percentage of students eligible for free or reduced-price meals.
NOTE: ACS = American Community Survey; CCD = Common Core of Data; FRPL = free or reduced-price lunch.
SOURCE: Prepared by the panel.
only large and medium districts because small districts do not have 3-year ACS estimates. Similarly, Table 4-3 includes only large districts because they are the only districts with 1-year ACS estimates. Table 4-2 provides results for each of the three available sets of 3-year estimates (2005-2007, 2006-2008, and 2007-2009), and Table 4-3 provides results for each of the five available sets of 1-year estimates. All differences in each of these
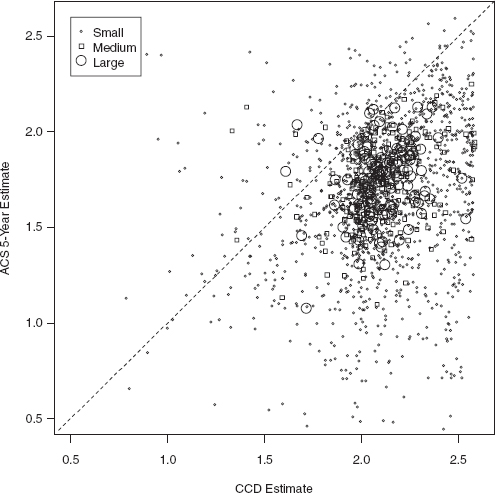
FIGURE 4-4 Comparison of ACS 5-year (2005-2009) and CCD (2009-2010) estimates for very high FRPL districts: BRR.
NOTES: This figure excludes three outliers, all of which are small districts with ACS BRRs of $0.26. Their CCD BRRs are $1.50, $2.10, and $2.10. ACS = American Community Survey; BRR = blended reimbursement rate; CCD = Common Core of Data; FRPL = free or reduced-price lunch.
SOURCE: Prepared by the panel.
tables are statistically significant, that is, significantly different from zero.7Table 4-4 summarizes the results in the other tables by averaging across the three sets of 3-year estimates and the five sets of 1-year estimates.
____________
7 Statistical significance is determined by comparing the ratio of the average difference to its estimated standard error with critical values from a standard normal distribution.
|
|
||||
|
Estimand |
All Districts |
Large Districts |
Medium Districts |
Small Districts |
|
|
||||
|
Very High FRPL Districts |
(1,641) |
(122) |
(227) |
(1,292) |
|
Percentage free |
–21.7 |
–19.5 |
–20.4 |
–22.2 |
|
Percentage reduced price |
4.0 |
4.5 |
5.0 |
3.8 |
|
Percentage free or reduced price |
–17.8 |
–15.0 |
–15.4 |
–18.4 |
|
BRR, $ |
–0.43 |
–0.37 |
–0.38 |
–0.44 |
|
High FRPL Districts |
(4,214) |
(304) |
(710) |
(3,200) |
|
Percentage free |
–10.8 |
–13.6 |
–12.1 |
–10.3 |
|
Percentage reduced price |
2.3 |
2.7 |
2.8 |
2.1 |
|
Percentage free or reduced price |
–8.5 |
–11.0 |
–9.3 |
–8.1 |
|
BRR, $ |
–0.21 |
–0.27 |
–0.23 |
–0.20 |
|
|
||||
NOTES: All average differences are statistically signifcant (different from zero) at the 0.01 level. ACS = American Community Survey; BRR = blended reimbursement rate; CCD = Common Core of Data; FRPL = free or reduced-price lunch.
SOURCE: Prepared by the panel.
For very high FRPL districts, several consistent patterns emerge from these tables of average ACS-CCD differences:
- The average ACS estimate of the percentage of students eligible for free meals is typically 15 to 22 percentage points lower than the average CCD estimate.
- The average ACS estimate of the percentage of students eligible for reduced-price meals is typically about 3 to 4 percentage points higher than the average CCD estimate.
- The ACS’s overestimation of the percentage eligible for reduced-price meals is not sufficient to compensate for the underestimation of the percentage eligible for free meals. Thus, the average ACS estimate of the percentage eligible for either free or reduced-price meals is typically 12 to 18 percentage points lower than the average CCD estimate.
- For a BRR based on the distribution of students across categories, the average ACS estimate is usually about $0.30 to $0.40 lower than the average CCD estimate of roughly $2.10.
Qualitatively similar patterns are observed for average high FRPL districts: overestimation of the percentage reduced-price-eligible, but underestimation of the percentage free-eligible, the percentage free or reduced-price-eligible, and the BRR. Also, all of the differences are statis-
|
|
|||||||||
| Large and Medium Districts | Large Districts | Medium Districts | |||||||
| Estimand | 2005-2007 | 2006-2008 | 2007-2009 | 2005-2007 | 2006-2008 | 2007-2009 | 2005-2007 | 2006-2008 | 2007-2009 |
|
|
|||||||||
| Very High FRPL Districts | (337) | (350) | (349) | (121) | (123) | (122) | (216) | (227) | (227) |
| Percentage free | -17.1 | -18.6 | -20.1 | -15.5 | -18.2 | -19.5 | -17.9 | -18.8 | -20.4 |
| Percentage reduced price | 3.6 | 3.1 | 3.9 | 3.7 | 2.9 | 3.7 | 3.5 | 3.2 | 4.1 |
| Percentage free or reduced price | -13.5 | -15.5 | -16.2 | -11.8 | -15.3 | -15.7 | -14.5 | -15.6 | -16.4 |
| BRR, $ | -0.33 | -0.37 | -0.39 | -0.29 | -0.37 | -0.38 | -0.35 | -0.38 | -0.40 |
| High FRPL Districts | (972) | (1,012) | (1,014) | (298) | (303) | (304) | (674) | (709) | (710) |
| Percentage free | -8.4 | -10.2 | -12.7 | -9.8 | -11.2 | -13.6 | -7.8 | -9.8 | -12.3 |
| Percentage reduced price | 1.9 | 1.7 | 2.3 | 1.9 | 1.7 | 2.2 | 1.9 | 1.7 | 2.3 |
| Percentage free or reduced price | -6.5 | -8.5 | -10.5 | -7.9 | -9.5 | -11.4 | -5.9 | -8.1 | -10.1 |
| BRR, $ | -0.16 | -0.21 | -0.25 | -0.19 | -0.23 | -0.27 | -0.15 | -0.20 | -0.24 |
|
|
|||||||||
NOTES: All average differences are statistically significant (different from zero) at the 0.01 level. ACS = American Community Survey; BRR = blended reimbursement rate; CCD = Common Core of Data; FRPL = free or reduced-price lunch. SOURCE: Prepared by the panel.
TABLE 4-3 Average Differences Between ACS 1-Year Estimates and CCD Estimates, Large Districts Only
|
|
|||||||||
| Estimand | 2005 | 2006 | 2007 | 2008 | 2009 | ||||
|
|
|||||||||
| Very High FRPL Districts | (123) | (126) | (121) | (123) | (122) | ||||
| Percentage free | –15.1 | –15.1 | –17.4 | –19.0 | –17.2 | ||||
| Percentage reduced price | 3.6 | 2.9 | 3.1 | 2.1 | 2.9 | ||||
| Percentage free or reduced price | –11.5 | –12.2 | –14.3 | –16.9 | –14.3 | ||||
| BRR, $ | –0.28 | –0.30 | –0.34 | –0.40 | –0.34 | ||||
| High FRPL Districts | (297) | (306) | (298) | (303) | (304) | ||||
| Percentage free | –8.8 | –8.9 | –11.4 | –11.2 | –11.5 | ||||
| Percentage reduced price | 1.9 | 1.4 | 1.6 | 1.0 | 1.5 | ||||
| Percentage free or reduced price | –6.9 | –7.4 | –9.7 | –10.1 | –10.0 | ||||
| BRR, $ | –0.17 | –0.18 | –0.23 | –0.24 | –0.24 | ||||
|
|
|||||||||
NOTES: All differences are statistically signifcant (different from zero) at the 0.01 level. ACS = American Community Survey; BRR = blended reimbursement rate; CCD = Common Core of Data; FRPL = free or reduced-price lunch.
SOURCE: Prepared by the panel.
|
|
|||||
| Estimand | 5-Year Estimates for All Districts | 3-Year Estimates for All Medium and Large Districts | 1-Year Estimates for All Large Districts | ||
|
|
|||||
| Very High FRPL Districts | (1,641) | (329) | (113) | ||
| Percentage free | –21.7 | –18.9 | –17.1 | ||
| Percentage reduced price | 4.0 | 3.5 | 2.9 | ||
| Percentage free or reduced price | –17.8 | –15.4 | –14.2 | ||
| BRR, $ | –0.43 | –0.37 | –0.34 | ||
| High FRPL Districts | (4,214) | (962) | (280) | ||
| Percentage free | –10.8 | –10.6 | –10.5 | ||
| Percentage reduced price | 2.3 | 1.9 | 1.4 | ||
| Percentage free or reduced price | –8.5 | –8.6 | –9.1 | ||
| BRR, $ | –0.21 | –0.21 | –0.22 | ||
|
|
|||||
NOTE: ACS = American Community Survey; CCD = Common Core of Data; FRPL = free or reduced-price lunch.
SOURCE: Prepared by the panel.
|
|
||||
| Estimand | 5-Year Estimates for All Districts | 3-Year Estimates for All Medium and Large Districts | 1-Year Estimates for All Large Districts | |
|
|
||||
|
Low to Moderate FRPL |
(5,255) | (973) | (263) | |
|
Percentage free |
-4.7 | -5.0 | -4.9 | |
|
Percentage reduced price |
2.3 | 1.3 | 1.0 | |
|
Percentage free or reduced price |
-2.4 | -3.7 | -3.9 | |
|
BRR, $ |
-0.06 | -0.09 | -0.09 | |
|
|
||||
NOTE: ACS = American Community Survey; BRR = blended reimbursement rate; CCD =Common Core of Data; FRPL = free or reduced-price lunch.
SOURCE: Prepared by the panel.
tically significant. The magnitudes of the average ACS-CCD differences, however, are much smaller for the high FRPL districts than for the very high FRPL districts. For the high FRPL districts, average BRR differences are typically $0.15 to $0.25, rather than the $0.30 to $0.40 for the very high FRPL districts. Furthermore, as shown in Table 4-5 and in more detailed tables in Appendix F, average BRR differences are even smaller—$0.05 to $0.13—for low and moderate FRPL districts, that is, districts with FRPL percentages below 50 percent in all school years from 2004-2005 through 2009-2010.8 These results demonstrate a challenge entailed in using ACS data to obtain school meals program eligibility estimates with which to implement the AEO. Specifically, the differences between ACS and administrative estimates are greatest, on average, for those districts for which the AEO might otherwise be most attractive (because they have higher fractions of students certified for free or reduced-price meals under traditional operating procedures).9
____________
8 It is notable that the differences between ACS and administrative estimates for these districts, which make up the majority of districts in the country, are not very large. The average ACS estimate of the percentage of students eligible for free or reduced-price meals is typically only 1 to 5 percentage points less than the average CCD estimate.
9 Average differences between ACS and CCD estimates of district enrollment are presented in Appendix F. For very high FRPL districts, average ACS estimates of enrollment are 7 to 12 percent higher than average CCD estimates for large districts and 2 to 4 percent higher for medium and small districts. For high FRPL districts, average ACS estimates tend to be roughly equal to or slightly lower than average CCD estimates.
Potentially Important Sources of Systematic Differences
The results just presented demonstrate that ACS eligibility estimates are different from estimates derived from administrative data on student enrollment and certification for free and reduced-price school meals. Because ACS estimates are based on samples of households, sampling error will cause them to differ from CCD estimates for individual districts. However, sampling error cannot account for the large differences between estimates from the ACS and CCD that have been derived by averaging across many districts because sampling error is purely random and “averages out” to approximately zero. In fact, we find that the differences are statistically significant, that is, greater than would be expected as a result of sampling error alone. In contrast, errors in the estimates based on certification data and, in particular, the aggregate over certification found in the Access, Participation, Eligibility, and Certification (APEC) study (described in Chapter 2) may contribute to the observed average differences between ACS and CCD estimates. The results of the panel’s analysis of the potential effects of certification error are presented below.
Errors in the ACS estimates can also contribute to the differences between those estimates and administrative estimates. The panel’s review of the literature, consultation with experts during our meetings and workshop, and analyses revealed four major potential sources of systematic error in ACS estimates that may contribute to the average differences between the ACS and CCD estimates:
- underreporting of SNAP participation in the ACS;
- determination of eligibility from annual income in the ACS rather than monthly income as in the application process for the school meals programs;
- limitations of using ACS data to count homeless students, students in families of migrant or seasonal workers, and other students who do not live in traditional housing; and
- the effects of families’ exercising school choice opportunities, such as attending charter, magnet, and other nonneighborhood schools.
Other sources of systematic error in ACS eligibility estimates include underreporting of Temporary Assistance for Needy Families (TANF) participation, incorrect identification of economic units within ACS households, the inability to derive eligibility estimates not just based on monthly income but for the specific months for which incomes are reported on applications (mainly July, August, and September) and for school attendance as of October (the month to which certification estimates pertain) to capture important seasonal effects, and inadequate
imputation or other adjustments for nonresponse to the entire ACS survey or to specific income and program benefit questions.10 Below we discuss the potential contribution of administrative certification error to the differences between ACS and CCD estimates, and then the four sources of error in ACS estimates listed above.
Certification Error in Administrative Estimates
As described in Chapter 2, the APEC study (U.S. Department of Agriculture/Food and Nutrition Service, 2007b) provided national estimates for SY 2005-2006 of the percentages of students who were mis-classified by eligibility category. The APEC certification error estimates apply to all certified students (including those directly certified) and denied applicants, that is, applicants who were denied free or reduced-price certification. These error rates do not apply to students who were not directly certified and whose families did not apply for benefits. Although it is likely that most of these students were not eligible for free or reduced-price meals, some may have been, and there is no current information about the true eligibility distribution of nonapplicants. Accordingly, the panel considered a range of assumptions pertaining to nonapplicants, two of which are presented here to support examination of the potential impact of certification error on the differences between ACS eligibility estimates and administrative certification estimates.
The panel used the APEC certification error estimates (reproduced in Table G-7 in Appendix G) to evaluate the potential impact of certification error on administrative eligibility estimates; detailed results are presented in Appendix G. Table 4-6 shows results for three hypothetical districts. Each is assumed to have 10 percent of its students certified for reduced-price meals. The percentages certified for free meals are 65 percent, 75 percent, and 85 percent to illustrate the effects of certification error on administrative estimates for districts with very high levels of free or reduced-price students. Two different eligibility distributions are displayed in Table 4-6 based on different assumptions concerning those who do not apply for benefits. For the first distribution (denoted “(1)” in Table 4-6), we assumed that among those students who must pay full price because they were not approved for free or reduced-price meals, 10 percent applied for but were denied free or reduced-price certification. The remaining 90 percent did not apply, and we assumed that all of these nonapplicants were truly eligible only for full-price meals. For the 10 percent who applied but were denied free or reduced-price certi-
____________
10 Analyses conducted by the panel and described in Appendix G indicate that imputation for nonresponse makes a negligible contribution to the ACS-CCD differences.
|
|
|||||
|
Certified Students |
Eligible Students (1) |
Eligible Students (2) |
Eligible (1)-Certified (percentage points or $) |
Eligible (2)-Certified (percentage points or $) |
|
|
|
|||||
|
Hypothetical District 1—75% of Students Certified for Free or Reduced-Price Meals |
|||||
|
Free |
65% |
60% |
62% |
–5 |
–3 |
|
Reduced price |
10% |
10% |
12% |
0 |
2 |
|
Full price |
25% |
30% |
26% |
5 |
1 |
|
Free or reduced price |
75% |
70% |
74% |
–5 |
–1 |
|
BRR |
$1.97 |
$1.84 |
$1.94 |
–$0.13 (–6%) |
–$0.03 (–1%) |
|
Hypothetical District 2—85% of Students Certified for Free or Reduced-Price Meals |
|||||
|
Free |
75% |
68% |
70% |
–7 |
–5 |
|
Reduced price |
10% |
10% |
12% |
0 |
2 |
|
Full price |
15% |
21% |
19% |
6 |
4 |
|
Free or reduced price |
85% |
79% |
81% |
–6 |
–4 |
|
BRR |
$2.20 |
$2.05 |
$2.11 |
–$0.15 (–7%) |
–$0.09 (–4%) |
|
Hypothetical District 3—95% of Students Certified for Free or Reduced-Price Meals |
|||||
|
Free |
85% |
77% |
77% |
–8 |
–8 |
|
Reduced price |
10% |
11% |
11% |
1 |
1 |
|
Full price |
5% |
12% |
11% |
7 |
6 |
|
Free or reduced price |
95% |
88% |
89% |
–7 |
–6 |
|
BRR |
$2.43 |
$2.26 |
$2.28 |
–$0.18 (–7%) |
–$0.16 (–6%) |
|
|
|||||
NOTES: To derive the estimates of eligible students denoted “(1),” we assumed that among those students who must pay full price because they were not approved for free or reduced-price meals, 10 percent applied for but were denied free or reduced-price certifcation. The remaining 90 percent did not apply, and we assumed that all of these nonapplicants were truly eligible only for full-price meals. For the 10 percent who applied but were denied free or reduced-price certifcation, we assumed that the true eligibility distribution conformed to the Access, Participation, Eligibility, and Certifcation Study (APEC) estimates: 19.0, 16.6, and 64.4 percent were eligible for free, reduced-price, and full-price meals, respectively. To derive the estimates of eligible students denoted “(2),” we assumed that among those students who must pay full price because they were not approved for free or reduced-price meals, 25 percent applied for but were denied free or reduced-price certifcation. For these applicants, we assumed that the true eligibility distribution conformed to the APEC estimates. For the 75 percent who were nonapplicants, we assumed that 9.5, 8.3, and 82.2 percent were eligible for free, reduced-price, and full-price meals, respectively. These percentages for free and reduced-price eligibility are equal to half of the APEC estimates. BRR = blended reimbursement rate.
SOURCE: Prepared by the panel.
fication, we assumed that the true eligibility distribution conformed to the APEC estimates for denied applicants: 19 percent, 16.6 percent, and 64.4 percent were eligible for free, reduced-price, and full-price meals, respectively. Although results of the APEC study suggest that the national application rate for students who must pay full price is on the order of 10 percent or a little higher, this rate may be higher in districts with very high percentages certified for free or reduced-price meals because applying for benefits is more common in those districts. Therefore, to derive the estimates of eligible students denoted “(2)” in Table 4-6, we assumed that among those students who must pay full price because they were not approved for free or reduced-price meals, 25 percent applied for but were denied free or reduced-price certification. For these applicants, we assumed that the true eligibility distribution conformed to the APEC estimates. For the 75 percent who were nonapplicants, we assumed that the true eligibility distribution was 9.5 percent, 8.3 percent, and 82.2 percent eligible for free, reduced-price, and full-price meals, respectively. These percentages for free and reduced-price eligibility are equal to half of the APEC estimates pertaining to denied applicants. These assumptions and the others we considered (see Appendix G) are intended to illustrate the impact of certification errors under a range of possibilities.
Under the first set of assumptions, Table 4-6 shows that across the three hypothetical districts, certification error causes the percentage of students eligible for free or reduced-price meals to be overestimated by 5 to 7 percentage points and the BRR to be overestimated by $0.13 to $0.18 (6 to 7 percent)—that is, the administrative certification estimates of these values are too large. Under the second set of assumptions, however, the effects of certification error are smaller and vary more widely. For the district with 95 percent of its students certified for free or reduced-price meals, certification error causes the BRR to be overestimated by $0.16 (6 percent)—nearly as much as under the first set of assumptions. For the district with 85 percent of its students certified for free or reduced-price meals, however, the BRR is overestimated by $0.09 (4 percent), while it is overestimated by just $.03 (1 percent) in the district with 75 percent of its students certified for free or reduced-price meals. These results suggest that the estimated effects of certification error become more sensitive to our assumptions about nonapplicants as the percentage of students certified for free or reduced-price meals becomes smaller.
What do the illustrative results in Table 4-6 suggest about the potential effects of certification error on the differences between ACS eligibility estimates and administrative certification estimates? For very high FRPL districts, we found that BRRs based on ACS eligibility estimates are, on average, about $0.30 to $0.40 less than BRRs based on certification estimates from the CCD. If our first set of assumptions about nonapplicants is
accurate, certification error may account for about one-third to three-fifths of the average differences between ACS and CCD estimates. If our second set of assumptions about nonapplicants is more accurate, however, certification error may account for about one-half of the difference between ACS and CCD estimates in some districts, but perhaps for only one-tenth of the difference in other districts.
Our analysis suggests that certification error probably contributes to the observed differences between ACS and administrative estimates. However, we had to rely on assumptions to conduct our analysis, and the results are not definitive. The effects of certification error may be fairly small or very large. One also must keep in mind that the APEC estimates are national estimates pertaining to all districts—not just districts with high percentages certified for free or reduced-price meals—and are several years old. Changes in recent years in, for example, the percentage of students who are directly certified may have changed certification error rates. To obtain more current estimates, the Food and Nutrition Service (FNS) recently initiated a second APEC study.
Underreporting of SNAP Participation in the ACS
A large body of research literature has documented substantial underreporting in household surveys of benefits from programs such as SNAP. Czajka and Denmead (2008:170) summarize the literature, noting that “as a rule surveys underreport numbers of participants in means tested programs….”
To evaluate underreporting of SNAP benefits in the ACS and its potential impact on school meals eligibility estimates, the panel compared the estimated number of individuals aged 5-17 in households reporting SNAP benefits on the ACS with the estimated number of individuals aged 5-17 receiving SNAP benefits according to the SNAP Quality Control (SNAP QC) file for the same period. The latter is an administrative data set containing detailed demographic, economic, and SNAP eligibility and benefit information for an annual sample of more than 45,000 SNAP households that is representative at the state level. Additional detail on the SNAP QC data and our analysis can be found in Appendix G.
Our analysis revealed that for the country as a whole, the ACS underestimates the number of individuals aged 5-17 in households receiving SNAP benefits by a statistically significant 4.4 percent. Our analysis also suggests, however, that the magnitude of underreporting likely varies across states and, therefore, probably across school districts. Relative to SNAP QC estimates, we found large, statistically significant underestimates by the ACS for California (–15 percent), Delaware (–33 percent), New Mexico (–25 percent), and Tennessee (–15 percent). In contrast, we
found relatively small, statistically insignificant differences—including some overestimates—for several states, such as Arizona (0.6 percent), Arkansas (1.7 percent), the District of Columbia (–0.7 percent), Indiana (1.9 percent), Minnesota (0.5 percent), and Wisconsin (–1.8 percent). Because SNAP eligibility and benefit rules are the same nationwide, differential underreporting of SNAP benefits must be at least partially attributable to SNAP households with differing characteristics having different propensities to report their participation in the program. Areas with more households having a higher propensity not to report participation will then have higher rates of underreporting. Therefore, the observed variation in underreporting across states suggests that a simple, uniform correction probably would not be effective in eliminating most of the difference between the ACS and CCD estimates for most districts. Furthermore, even if accurate state-level corrections could be applied, it appears unlikely that they would substantially eliminate ACS-CCD differences for all or most school districts because such corrections would not address variations in underreporting across districts within a state associated, for example, with variation among districts in the characteristics of households and reporting propensities. Finally, a correction for SNAP underreporting will substantially reduce the average difference between BRRs estimated from the ACS and administrative data only if it moves large numbers of students from the full-price category to the free or reduced-price category. According to the SNAP QC data, however, fewer than 0.1 percent of individuals aged 5 to 17 in SNAP households live in a household with gross income that exceeds 185 percent of the poverty line.11
Eligibility Determined from Annual Rather Than Monthly Income
The ACS collects data on annual income and annual receipt of program benefits. However, eligibility for the school meals programs is based on current monthly income and current participation. Moreover, once a student has been certified as eligible for free or reduced-price school meals, that student is eligible for the rest of the school year and for the first month of the next, even if the student’s family income increased beyond the eligibility limits.
The panel used 2004 Survey of Income and Program Participation
____________
11 Although correcting for underreporting would shift students from the reduced-price category to the free category, this would have a relatively small effect on the BRR. For example, a seemingly large adjustment that raises the percentage free-eligible from 60 percent to 70 percent while lowering the percentage reduced-price-eligible from 15 percent to 5 percent increases the BRR by only about $0.04.
(SIPP) data to compare eligibility estimates based on monthly income with those based on annual income. Detail on the SIPP data, the preparation of the data files, and the analysis are presented in Appendix G. SIPP is the only source of nationally representative monthly income data based on following the same people over time. The SIPP monthly income data were collected in 4-month waves, that is, through interviews conducted every 4 months. This interviewing schedule may obtain smoother, that is, less variable income data than would be obtained with monthly interviews if respondents, for example, tend to report 4-month averages or provide the most recent monthly amount for all 4 months. Although the panel is not aware of evidence that this occurs, it is a potential limitation of the SIPP monthly income data for our analysis and could cause the differences between eligibility estimates based on monthly and annual income to be understated.
As discussed in further detail in Appendix G, the Census Bureau implemented several enhancements in the 2004 SIPP panel, including dependent interviewing, to improve the accuracy of income reporting. With the collection of earnings data being tied specifically to spells of employment, a change in income—attributable, for example, to the loss of a job—that is sufficiently large to affect eligibility status for the school meals programs is likely to be captured in the SIPP even if the timing of the change is not exactly correct because of “seam bias.” (Seam bias occurs when changes are more likely to be reported between rather than within waves.) Thus, we expect that our analysis of SIPP data provides a reasonably accurate basis for assessing the effect of using annual rather than monthly income to determine eligibility for the school meals programs, although the effect could be understated if there is still a propensity among SIPP respondents to misreport the timing of changes in income.
Table 4-7 shows selected results of this analysis. The first data column provides the BRR based on monthly income, and the second provides the BRR based on annual income. Both sets of estimates take into account categorical eligibility for free meals due to SNAP or TANF participation. The differences between BRRs due to computing eligibility based on annual instead of monthly income are shown in the third column. The average difference over all students is –$0.14. The last data column gives the ratio of the BRR based on annual income to the BRR based on monthly income. Results are shown for several groups of students defined by education of householder, metropolitan versus nonmetropolitan area, and census region.
Across groups defined by education of householder, which is likely to be a proxy for socioeconomic status, the difference in the BRR ranges from –$.09 to –$0.16 (but not monotonically), and the ratio of the BRR based on annual income to the BRR based on monthly income decreases
TABLE 4-7 BRRs Based on Monthly and Annual Income Estimates: Bias and Ratio
|
|
||||
| Group | Monthly BRR ($) | Annual BRR ($) | Bias (Annual/ Monthly) ($) | Ratio Annual/ Monthly |
|
|
||||
| All Students | 1.23 | 1.09 | –0.14 | 0.89 |
| Education of Householder | ||||
| No high school degree | 2.11 | 2.02 | –0.09 | 0.96 |
| High school graduate | 1.49 | 1.35 | –0.14 | 0.91 |
| Some college | 1.18 | 1.02 | –0.16 | 0.86 |
| College graduate | 0.72 | 0.58 | –0.14 | 0.80 |
| Metro vs. Nonmetro Area | ||||
| Metro | 1.20 | 1.06 | –0.14 | 0.89 |
| Nonmetro | 1.36 | 1.20 | –0.16 | 0.88 |
| Census Region | ||||
| New England | 0.98 | 0.86 | –0.12 | 0.88 |
| Middle Atlantic | 1.17 | 1.05 | –0.12 | 0.90 |
| East North Central | 1.18 | 1.05 | –0.13 | 0.89 |
| West North Central | 1.06 | 0.93 | –0.14 | 0.87 |
| South Atlantic | 1.24 | 1.09 | –0.15 | 0.88 |
| East South Central | 1.46 | 1.35 | –0.11 | 0.92 |
| West South Central | 1.43 | 1.27 | –0.16 | 0.89 |
| Mountain | 1.21 | 1.07 | –0.14 | 0.88 |
|
|
||||
NOTE: BRR = blended reimbursement rate.
SOURCE: Prepared by the panel using the 2004 Survey of Income and Program Participation.
monotonically from 0.96 for households in which the householder has no college degree to 0.80 for households with a college-educated house-holder.12 Across census regions, the difference due to using annual rather than monthly income varies from –$0.11 to $0.16.
Although using annual rather than monthly income surely contributes to the ACS’s underestimation of BRRs, it probably does not explain all of the average differences observed between ACS and administrative estimates. In Table 4-7, students in households in which the householder does not have a high school degree have, at 81 percent, the highest percentage eligible for free or reduced-price meals. By that measure, this group most resembles a district that might be interested in adopting the AEO. How-
____________
12 The percentage of students eligible for free meals is highest at 69 percent for households in which the householder has no high school degree and drops markedly to 15 percent as the education of the householder increases to college graduate.
ever, the underestimation of the BRR due to using annual income for that group is relatively small at –$0.09 (4 percent) compared with the average ACS-CCD difference of –$0.30 to –$0.40 documented above. Moreover, it appears unlikely that a simple, uniform adjustment of estimates based on annual income would substantially reduce ACS-CCD differences for school districts because, as suggested by the results in Table 4-7, the effect of using annual rather than monthly income will likely vary as socioeconomic conditions and the composition of households vary across districts. Even if the true effect is somewhat larger than we estimated because of the reporting issues described above, it still would not account for all—or nearly all—of the observed average difference between ACS estimates and administrative data. Furthermore, any misreporting of monthly changes in income probably varies across households of different types and thus across districts with different populations, strengthening our conclusion that a simple global correction, especially one based on SIPP data, would be of limited effectiveness.
Limitations of Using ACS Data to Count Students Who Do Not Live in Traditional Housing
Some of the differences observed between ACS and administrative estimates may be attributable to the challenges that arise in counting homeless students, students living in migrant labor camps, and other students who do not live in traditional housing and are categorically eligible for free meals. Although most of these students would be represented in the ACS group quarters data, such estimates are reliable at the state level, not at finer levels of geographic detail, such as school catchment areas or school districts (see Appendix G).13 Thus, the panel chose to have data for the group quarters population excluded from the estimates we requested from the Census Bureau and to obtain instead estimates that pertain only to the household population. If large enough numbers of students are thereby excluded, the ACS estimates will understate enrollment and the percentage eligible for free meals.14
In operating the school meals programs, school districts receive, where relevant, lists of homeless students from the homeless liaison and lists of migrant students from the Migrant Education Program. Such students then are certified as eligible for free meals. If there were a non-negligible number of migrant students, for example, in a district that wanted to implement the AEO and if the Migrant Education Program
____________
13 The reason pertains to the group quarters sample design in the ACS (see National Research Council, 2012).
14 The percentages eligible for reduced-price and full-price meals will be overstated.
could specify how many migrant students lived in migrant labor camps and how many in traditional housing, a simple adjustment to the ACS estimates based on the household population could be used to include the students living in migrant labor camps among those estimated as being eligible for free meals.15 ACS estimates could be similarly adjusted based on a list of homeless students.16
The effect on ACS estimates of excluding students living in migrant labor camps and homeless and other such students likely varies widely among districts, and the panel is not aware of the availability of data on counts of migrant or homeless students for all school districts in the nation. We had data on migrant students from two of our case study districts. In Omaha, the average number of migrant students was about 200, just over 1 percent of the students eligible for free meals. In Pajaro Valley, the number of migrant students was 7,125 (63 percent of students eligible for free meals) in 2005-2006, but declined to 1,618 (15 percent) in 2009-2010. Most of these migrant students likely lived in traditional housing, but some may not have. According to data provided to the panel by the Shenandoah Valley (Virginia) Migrant Program, 17 of its 135 migrant students (12.6 percent) lived in labor camps last school year. In general, although the data available to us for analyzing the issue of students living in nontraditional housing were limited, school districts will know if they have substantial numbers of migrant and homeless students and can obtain official counts from the appropriate liaisons. Such counts could be used to adjust ACS estimates of eligible students on a district-by-district basis rather than as a component of a statistical program producing eligibility estimates for all districts in the country, and this is our recommended approach in Chapter 5.
Migrant children typically are present in a school district for only a portion of a year. In Pajaro Valley, for example, migrant students are present only from May to October. Those who live in traditional housing units will be represented in the ACS in proportion to the time they spend in the district—about 50 percent in Pajaro Valley. However, the October certification numbers from the district will include all migrant students, contributing to the large observed undercount of students eligible for free
____________
15 Assume that the district establishes that k categorically eligible children do not live in traditional housing units and the total enrollment is E. If the ACS estimate for percentage free-eligible is pf and for percentage reduced-price-eligible is pr, then the estimate for the total number of students eligible for free meals is pf * (E – k) + k, the estimated number of students eligible for reduced-price meals is pr * (E – k), and the estimated number eligible for full-price meals is (1 – pf – pr) * (E – k).
16 Such adjustments could cause students to be double counted if they lived in traditional housing some of the time and were included in the population estimates used to weight the ACS data.
or reduced-price meals by the ACS relative to the data from the district. Mobility of students, if related to eligibility for school meals, will contribute to systematic differences between ACS and administrative estimates.
Effects of Families’ Exercising School Choice Opportunities
To use the ACS to derive school meals program eligibility estimates, one must assign students to schools and districts based on the addresses of their homes. While such an approach is valid for most students, it may introduce error when students have options to attend not only their neighborhood schools but also other public schools. Private school attendance is not a concern because the ACS data distinguish between public and private school students. Among public school students, however, students may choose to attend charter, magnet, or open enrollment schools instead of their neighborhood schools at different rates based on income, with, for example, students from more affluent families exercising such options more frequently than students from less affluent families. This will affect not only the ACS eligibility estimates for some neighborhood schools but also the estimates for an entire district if, for example, the local charter schools are not part of the district.
For purposes of assessing the effects of public school choice on the AEO, it is important to distinguish between intra- and interdistrict choice. Many districts may find the AEO appealing at the district level, in which case intradistrict choice plans will have no effect. Whether students who are eligible for free or reduced-price meals are disproportionately drawn to schools of choice, such as open enrollment, magnet, or district charter schools, will not affect the overall percentage of these students in the district. As a result, school choice will not pose a problem for ACS eligibility estimates. However, if students leave the district, for example, to attend an independent charter school or are part of another interdistrict choice plan, and if students eligible for free or reduced-price meals differentially choose these options, ACS estimates will misrepresent the percentage of students eligible for free or reduced-price meals attending district schools. A similar issue arises if a district is interested in adopting the AEO in only some schools within the district. In this case, both intra- and interdistrict choice are potentially problematic, as the ACS estimates of the percentage of eligible children in any school based on residence may misrepresent actual attendance.
The available data with which to address this issue of school choice are limited. However, the panel obtained and analyzed data for two districts in very different situations: the District of Columbia Public Schools (DCPS) and the Omaha Public Schools. DCPS had 140 public schools in 2008-2009, while 60 independent public charter schools drew students
from the same area. Thirty-six percent of all public school students who resided in the District of Columbia attended a charter school that was not part of DCPS. Thus, DCPS offers an opportunity to examine the potential effects of interdistrict choice on ACS estimates. Available administrative data from DCPS indicate that assigning all public school students to their catchment area schools based on residence understates the free and reduced-price meals eligibility percentage by about 6.5 percentage points relative to the percentage based on actual enrollment. Thus, in addition to sampling and other errors associated with estimating catchment area eligibility percentages, we estimate that the ACS could underestimate the districtwide free and reduced-price eligibility percentage by as much as 6.5 percentage points as a result of public school choice. Moreover, school choice could introduce potentially meaningful errors at the school level. Fully 31 percent of the DCPS schools would be misclassified relative to the 75 percent free or reduced-price meals eligibility level we identified as a possible threshold for adoption of the AEO. Because such a large share of public school students residing in the District of Columbia attend schools outside the DCPS system, DCPS likely is indicative of a relatively large impact of school choice, although not necessarily an upper bound on that impact.
Omaha Public Schools, one of the panel’s case study districts, is an open enrollment district. The district provided us with data for school year 2008-2009 on the number of students enrolled in each school versus the number who lived in the school’s catchment area, as well as data on the number of students eligible for free or reduced-price meals by enrollment versus catchment area residence. We used these data to make several comparisons: (1) administrative estimates based on actual school enrollment versus administrative estimates based on catchment area enrollment, that is, the enrollment that would have occurred if all students attended their catchment area schools (errors in the latter are attributable to failure to take open enrollment into account); (2) administrative estimates based on catchment area enrollment versus ACS estimates (errors in the latter are associated with sampling and other ACS errors); and (3) administrative estimates based on actual enrollment versus ACS estimates (errors in the latter reflect ACS sampling and other errors, as well as errors due to the inability to take open enrollment into account). We summarize these comparisons by noting the differential categorization of schools as having less than or at least 75 percent of their students eligible for free or reduced-price meals.
If catchment area rather than actual enrollments are used, 15.6 percent of schools are misclassified. When we compare ACS estimates with administrative estimates based on catchment area enrollment, 11 percent of schools fall below the 75 percent threshold according to the ACS when
in fact they are above the threshold according to the administrative estimates, while 4 percent of schools are above the threshold according to the ACS but below according to the administrative data. Accounting for open enrollment misclassification as well as other errors by comparing ACS estimates with administrative estimates based on actual enrollment, we find that the ACS misclassifies 22.7 percent of schools—16 percent are incorrectly classified as below the threshold and 6.7 percent as above the threshold.
More generally, as reported in detail in Appendix G, the panel’s analyses suggest that school choice is not sufficiently pervasive to cause concern regarding use of the ACS to estimate free or reduced-price eligibility in most public schools and school districts. In an important subset of schools and districts, however, attendance at noncatchment area schools occurs frequently enough that these districts should carefully consider whether this condition could contribute to large differences between estimates based on residence, such as those from the ACS, and estimates based on actual enrollment. At the district level, this could occur when a substantial portion of students have exercised the ability to choose schools that are not part of the district, such as charter schools in independent districts. At the school level, this could occur when a relatively large percentage of students have chosen to attend noncatchment area schools.
Use of a Statistical Model to Adjust for Differences Between ACS and Administrative Estimates
The panel’s analyses suggest that there are at least several potentially important sources of differences between ACS and administrative estimates, and the contributions of these sources are likely to vary substantially among districts. The effects of school choice and of students living in nontraditional housing, for example, will tend to be highly localized and variable, with many districts having no effects at all and others having moderate to large effects. Thus, a simple, uniform adjustment that increases each district’s BRR, for example, by a given additive or multiplicative quantity appears unlikely to be an effective approach for largely eliminating the contribution of one of these sources of ACS-administrative differences. Moreover, even if an adjustment for one source were effective, at least several other adjustments would still be necessary.
An alternative approach would be to develop a predictive statistical model that related the observed ACS-CCD difference for a district to the characteristics of that district as measured in the CCD and other district-level data sources with national coverage. To distinguish systematic relationships from the effects of sampling variability, this model would be estimated from data for a large collection of districts, such as
all districts in the country or all high and very high FRPL districts. After the model had been estimated, a predicted ACS-CCD difference would be derived from the model for each district and used to adjust the district’s ACS estimate. For example, $0.35 would be added to a district’s BRR if the model predicted, based on the district’s characteristics, that the ACS would underestimate the district’s BRR by $0.35.17
Although time and resources did not permit a thorough assessment of the potential effectiveness of using a predictive model to adjust for ACS-CCD differences, the panel was able to conduct some exploratory analyses. For these analyses, we used data for all very high FRPL districts to estimate a model that related differences between ACS 5-year BRR estimates and CCD BRR estimates to a rich set of predictors from the CCD. This set included the state in which the district was located, the district’s total enrollment, several predictors reflecting the district’s composition by the race and ethnicity of enrolled students, several predictors measuring the rate at which the district’s students attend nonneighborhood schools within the district, and several predictors measuring the district’s proximity to charter schools that are not part of the district.
When specifying the set of potential predictors, an issue that arises concerns the use of predictors based on the free and reduced-price meals certification data contained in the CCD. Should such predictors be included in the model? Although they might contribute substantially to the model’s predictive ability, administrative data on these predictors would not be available for a district after it adopted the AEO. Thus, the predictors could not be used to derive an adjustment for ACS estimates on an ongoing basis.18 As discussed in Chapter 5, however, an adjustment could be determined when the district first adopted the AEO and used thereafter without updating. In light of this issue, the panel estimated models that included predictors based on school meals certification data in the CCD (“FRPL predictors”), as well as models that excluded such predictors.
The results of our exploratory assessment of predictive models indicate that a relatively simple model without any FRPL predictors explains about 40 percent of the variability across districts in ACS-CCD differences according to either an R2 or adjusted R2 goodness-of-fit statistic.19 Adding
____________
17 The difference between the district’s ACS and CCD estimates might be substantially different from $0.35 as a result of sampling error and systematic effects not captured by the model.
18 A similar issue pertains to districts that have adopted Provision 2 or 3 and are no longer in the base year.
19 The R2 statistic ranges from 0 to 1 and is often expressed as a percentage (from 0 to 100 percent). If all the predictors in a model are uncorrelated with whatever we are trying to predict, R2 will be 0. In contrast, R2 will be 100 percent if the predictors can perfectly predict
a large number of interaction and quadratic terms increases the adjusted R2 from about 0.40 to about 0.56. Not surprisingly, adding FRPL predictors substantially enhances the predictive ability of the model. Although a simple model with FRPL predictors explains only about three-fifths of the variability in ACS-CCD differences, a model with many interaction and quadratic terms has an adjusted R2 of nearly 0.75.20
Although even a well-developed predictive model might not be able to account for almost all of the variability in the differences between ACS and administrative estimates across districts, our exploratory results suggest that such a model might still be able to play a useful role in adjusting ACS estimates. This potential role of a predictive model is addressed in Chapter 6.
PRECISION, INTERTEMPORAL STABILITY, TIMELINESS, AND RELATIVE PERFORMANCE OF ESTIMATES
Precision, Intertemporal Stability, and Timeliness
Estimates generally become more precise, that is, less subject to sampling variability, as the number of observations on which they are based becomes larger. In the ACS, samples generally are larger for areas with larger populations. Furthermore, for a given area, a 5-year estimate is based on a larger sample than a 3-year estimate, which is based on a larger sample than a 1-year estimate, assuming that the area is large enough to have 1- and 3-year estimates. Although a 5-year estimate is more precise because it is based on more data (a larger sample), it also is less timely because it is based on older data (from the last 5 years rather than the last 1 or 3 years). Thus as noted earlier, there is a tradeoff between precision and stability on the one hand and timeliness and responsiveness to real change on the other. If stability is achieved by
whatever we are trying to predict. R2 necessarily increases as linearly independent predictors are added to a model, and it necessarily reaches 100 percent when the number of linearly independent predictors equals the number of observations for which we are making predictions, although it can reach 100 percent with a smaller number of predictors. The adjusted R2 statistic corrects for the loss in degrees of freedom—the number of observations minus the number of predictors—as predictors are added to the model. The adjusted R2 statistic is generally preferred to the (unadjusted) R2 statistic because the adjusted R2 statistic does not necessarily increase when a poor predictor is added to the model.
20 For some models, the unadjusted R2 is greater than 0.9. However, the number of predictors in those models is very large relative to the number of districts included in the analysis. The analysis of models without FRPL predictors included 1,433 districts, while, as a result of missing data on the FRPL predictors, the analysis of models with such predictors included 1,366 districts. The simplest model estimated had 73 predictors and the most complex between 700 and 800 predictors.
sacrificing responsiveness to real changes in socioeconomic conditions, a district may be under reimbursed when conditions have deteriorated, as in the recent “Great Recession,” and overreimbursed when conditions have improved. Yet excessive volatility can hamper effective planning and program administration.
The analyses the panel could conduct to explore these issues in our evaluation of the ACS estimates were limited by the available data. Although we had five sets of 1-year estimates, they were available only for the large districts. Three-year estimates were available only for the large and medium districts, and there were just three sets of such estimates. For small districts, we had only 5-year estimates, and for those districts as well as the larger districts, we had just one set of 5-year estimates. Furthermore, each set of estimates spanned only a 5-year period, limiting our ability to assess the effects of, for example, a different trend in the percentage of students eligible for free or reduced-price meals.21 In light of these data limitations, we focused our analyses on the 1-year ACS estimates, relying on modeling assumptions to derive many of our results pertaining to 3- and 5-year estimates. Because the 1-year estimates were available for large districts only, such an approach may limit the ability to generalize some of our results to medium and small districts. We included both high and very high FRPL large districts in our analyses. Appendix F presents our technical approach to these analyses in more detail.
To assess the stability of estimates over time, we calculated standard deviations of detrended year-to-year changes. As noted earlier, administrative estimates have no sampling variation, but they do vary from year to year because of real changes in socioeconomic conditions that affect eligibility and participation rates (as well as variation in nonsampling error, such as certification error). Thus, we expect CCD estimates to vary over time, and we obtained a standard deviation of the year-to-year change in the CCD BRR of nearly $0.13 for large districts, which is 7.6 percent of the average BRR for such districts. For medium districts, the standard deviation is about $0.13 (7.9 percent of the average BRR), and for small districts, it is nearly $0.17 (10.3 percent of the average BRR).
Like CCD estimates, ACS estimates vary over time because of real changes in socioeconomic conditions, as well as variation in nonsampling error, although the sources of the latter are probably more numerous and variable for ACS than for CCD estimates. Unlike CCD estimates, ACS estimates also will vary because of sampling error. According to the panel’s calculations, the standard deviation of year-to-year change for ACS 1-year BRR estimates is about $0.19 for large districts, while the standard devia-
____________
21 As documented above, this fraction was rising during the 5-year period. It rose by 3.4 and 6.9 percentage points among the very high and high FRPL districts, respectively.
tions for the ACS 3- and 5-year estimates are, respectively, $0.07 and $0.05. These are 11.3 percent, 4.3 percent, and 2.9 percent, respectively, of the average BRR for large districts.22 For medium districts, the standard deviations of year-to-year change for the ACS 3- and 5-year estimates are $0.13 and $0.07, respectively, which are 7.9 and 4.2 percent, respectively, of the average BRR. The standard deviation of year-to-year change for the ACS 5-year estimates is $0.15 (9.3 percent of the average BRR) for small districts.
These results suggest that, relative to the intertemporal changes normally experienced by a district as reflected in administrative data, the typical large district would likely experience less variability if it used 3- or 5-year ACS estimates but greater variability if it used 1-year ACS estimates.23 The typical medium district would experience about the same variability as is normal if it used 3-year ACS estimates and less variability than is normal if it used 5-year ACS estimates. The typical small district would experience somewhat less than normal variability if it used 5-year ACS estimates. In other words, for the typical district in each size category, the ACS can provide estimates that are as stable as estimates based on districts’ administrative procedures.
It is important to emphasize that these estimates of intertemporal variability pertain to a typical district in each size category, that is, a district with the median enrollment among the districts in that category. Although it appears that ACS 5-year estimates are likely to be sufficiently stable for even a typical small district, it is possible that such estimates will fluctuate excessively for the smallest small districts. To determine whether there may be a size threshold below which the ACS 5-year estimates are too unstable, we fit a model relating the estimated variability of a district’s ACS BRR estimate to the district’s enrollment (as described in detail in Appendix F). From this model, we derived Table 4-8, which shows how the standard deviation of the 1-year change in ACS 5-year estimates (say, between an estimate for 2005-2009 and an estimate for 2006-2010) would vary with enrollment. The table also displays the coefficient of variation (CV), which is the standard deviation relative to an average BRR of $1.65. Figure 4-5 graphs the estimated relationship between the CV and enrollment.24
As expected, variability falls as enrollment increases and rises as enrollment decreases. According to Table 4-8, a district with only 100 stu-
____________
22 To facilitate comparisons across estimates, we used the average BRR from the CCD for calculating these relative standard deviations. The ratio of a standard deviation to a mean is often called the “coefficient of variation” (CV).
23 The “typical” large district is at the median enrollment among large districts.
24 The relationship is approximately linear when we plot the inverse of the enrollment and the squared CV.
TABLE 4-8 Intertemporal Variability of ACS 5-Year Estimates, by Enrollment
| Variability of 1-Year Change in ACS 5-Year Estimates of BRR | ||
| Enrollment | Standard Deviation ($) | Coefficient of Variation (%) (relative to BRR of $1.65) |
| 100 | 0.34 | 20.5 |
| 200 | 0.25 | 15.1 |
| 400 | 0.18 | 11.2 |
| 800 | 0.14 | 8.3 |
| 1,600 | 0.10 | 6.3 |
| 3,200 | 0.08 | 4.8 |
| 6,400 | 0.06 | 3.8 |
| 12,800 | 0.05 | 3.2 |
NOTE: ACS = American Community Survey; BRR = blended reimbursement rate.
SOURCE: Prepared by the panel.
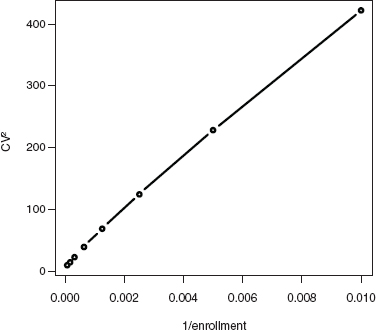
FIGURE 4-5 Intertemporal variability of ACS 5-year estimates: Squared coefficient of variation of year-to-year change in blended reimbursement rate versus inverse of enrollment.
NOTE: CV = coefficient of variation.
SOURCE: Prepared by the panel using data in Table 4-8.
dents has a standard deviation of $0.34, while a district with nearly 13,000 students has a standard deviation of just $0.05. As noted above, the standard deviation of the year-to-year change in the CCD BRR for the typical small district is $0.17, and the CV is 10.3 percent. However, the CV is 11.6 percent for a typical small district with enrollment below the median for small districts.25 According to Table 4-8, this CV of 11.6 percent is slightly higher than the CV of the year-to-year change in ACS 5-year estimates for a district with an enrollment of 400. This implies that for districts with enrollments of 400 or higher, ACS 5-year estimates will probably be as stable as or more so than the districts’ administrative estimates.26
Of course, some of the stability of the ACS 5-year estimates is achieved by averaging the most recent data with older data and thereby sacrificing some timeliness when socioeconomic conditions are improving or deteriorating substantially. Below, we consider measures of accuracy that reflect both the precision and stability of estimates on the one hand and their timeliness on the other.
Relative Performance
The analyses discussed above focused on the 1-, 3-, and 5-year direct ACS estimates and on comparisons of those estimates with estimates based on administrative (CCD) data. In addition to the direct estimates, however, the Census Bureau derived and provided ACS model-based estimates of the percentages of students eligible for free and reduced-price meals using an adaptation of the Small Area Income and Poverty Estimates (SAIPE) models and methods, as described in Chapter 3 and Appendix C. Although model-based estimates are subject to the same disclosure review process as other estimates produced by the Census Bureau, the use of statistical models helps preserve the confidentiality of survey responses and thus the privacy of respondents. Therefore, model-based estimates are available for every year for nearly every school district. Because such estimates are available for every year, they may be especially useful to small districts, which otherwise have only 5-year estimates
____________
25 The CV is 8.7 percent for districts above the median.
26Figure 4-5 could be used to provide more specific results for individual districts considering whether to adopt the AEO. The inverse of a district’s actual enrollment and the square of the CV based on its actual BRRs calculated from its administrative data could be plotted on the graph. If the plotted point were above the curve, the district might experience less intertemporal variability—that is, greater stability—with ACS estimates than it has been experiencing with administrative estimates. However, if the plotted point were below the curve, the ACS estimates might be less stable than the administrative estimates. This analysis could be performed by the AEO Calculator proposed in Chapter 5.
that potentially respond very slowly to changing socioeconomic conditions. Accordingly, our empirical evaluation of the model-based estimates focused on their performance for small districts.
Table 4-9 displays average differences between ACS model-based estimates and CCD estimates for small districts, as well as the average differences between 5-year ACS direct estimates and CCD estimates for those districts. The table is similar to the previously presented tables (Tables 4-1 through 4-4) that displayed average differences between ACS direct estimates and CCD estimates.27
For the model-based estimates, we can average the average differences across the 5 years. This average of averages for the BRR is about –$0.22 for the high FRPL districts, which is roughly 10 percent higher than the average difference for the ACS 5-year estimates. For the very high FRPL districts, however, the average of the average differences for the model-based BRR estimates is –$0.54, 20 to 25 percent greater than the average difference for the ACS 5-year estimates. Examination of the first two rows of estimates in Table 4-9 suggests that the performance of the model used in deriving estimates of the percentage of students eligible for free meals needs further assessment and improvement.
The objective of model-based estimation is to improve accuracy through the use of statistical models to “borrow strength” across geographic areas (or other estimation domains, such as time periods) in order to improve precision and reduce random error. In the process, the use of such models may introduce (additional) bias—that is, persistent, systematic error—in the estimates for individual areas, but the loss in accuracy due to modeling bias should be offset by the gain in accuracy due to increased precision. Moreover, the biases for individual areas should largely average out across areas in general and certainly if estimates at one level of geography are benchmarked to estimates at a higher level of geography, as is standard practice. The panel found, however, that the average of the average differences between ACS model-based estimates and CCD estimates across all small very high FRPL districts is substantially greater than the average difference between ACS 5-year direct estimates for 2005-2009 and CCD estimates for 2009-2010. This troubling result, coupled with the encouraging finding that the model-based estimates are more stable than the ACS 5-year estimates, led us to recommend in Chapter 6 that further research on model-based estimation for the development of eligibility estimates for the schools meals programs be undertaken if FNS decides to proceed with implementing the AEO. In our
____________
27 The ACS model-based estimates for 2005 and 2006, for example, were compared with CCD estimates for 2005-2006 and 2006-2007, respectively. The ACS 5-year estimates for 2005-2009 were compared with CCD estimates for 2009-2010.
| Model-Based Estimates | ||||||
| Estimand | 5-Year Estimates | 2005 | 2006 | 2007 | 2008 | 2009 |
| Very High FRPL Districts | ||||||
| Percentage free | -22.20 | -23.60 | -23.88 | -24.59 | -24.76 | -26.35 |
| Percentage reduced price | 3.75 | 1.52 | 1.17 | 1.93 | 0.64 | 2.64 |
| Percentage free or reduced price | -18.45 | -22.08 | -22.70 | -22.66 | -24.11 | -23.71 |
| BRR, $ | -0.44 | -0.52 | -0.53 | -0.54 | -0.56 | -0.56 |
| High FRPL Districts | ||||||
| Percentage free | -10.22 | -8.20 | -8.44 | -9.06 | -9.70 | -11.42 |
| Percentage reduced price | 2.15 | 0.37 | 0.01 | -0.10 | -0.79 | 0.05 |
| Percentage free or reduced price | -8.08 | -7.83 | -8.42 | -9.16 | -10.49 | -11.37 |
| BRR, $ | -0.20 | -0.18 | -0.20 | -0.21 | -0.24 | -0.27 |
NOTES: All differences are statistically significant (different from zero) at the 0.01 level, except for the differences pertaining to the model-based estimates of percentage reduced price for 2006, 2007, and 2009 for high FRPL districts. ACS = American Community Survey; BRR = blended reimbursement rate; CCD = Common Core of Data; FRPL = free or reduced-price lunch.
SOURCE: Prepared by the panel.
analyses of the stability of estimated BRRs, we found that the standard deviation of year-to-year change in model-based estimates is about $0.13 (8 percent relative to the average BRR) for small districts. This is less than the standard deviation of roughly $0.15 (9.3 percent of the average BRR) that we estimated for ACS 5-year estimates for small districts, presented earlier.
Based on these results of our empirical evaluation and our review of the available documentation, we concluded that the ACS model-based estimates are not ready for use in an AEO at present. From the beginning, we knew that the time and resources available to the Census Bureau for developing and evaluating models and estimation procedures were limited and that the estimates the Census Bureau provided might represent a proof of the concept that model-based estimation could be a useful approach in the future. Appendix C documents the research done by the Census Bureau and indicates specifically where additional research might prove valuable.
If the model-based estimates are not yet suitable for use, small districts have no alternative to using the 5-year estimates.28 However, medium districts have not only 5-year estimates but also 3-year estimates, while large districts have 1-, 3-, and 5-year estimates. From the empirical analyses of 1-year estimates for large districts described briefly above and in detail in Appendix F, the panel calculated root mean squared errors (RMSEs) for the different direct estimators for large and medium districts, relying on modeling assumptions for some of the calculations given the limited data available to us.29 We found that if the bias (that is, systematic difference) associated with the particular trend observed during the 5-year period spanned by the estimates is ignored, the RMSEs for the 1-, 3-, and 5-year estimators of BRRs are $0.170, $0.135, and $0.124, respectively, for large districts. Thus the longer the time span covered by an estimator, the lower is its RMSE (because it is more stable). When the bias associated with the specific observed trend is included, the respective RMSEs are $0.170, $0.152, and $0.164. During this particular period, the trend was sufficiently strong that the 5-year estimates have a higher RMSE than the 3-year estimates, and the RMSE for the 5-year estimates is nearly as high
____________
28 Nonetheless, as noted above, BRRs based on ACS 5-year estimates are likely to be more stable than BRRs based on administrative certification percentages for many small districts.
29 Mean squared error (MSE) is a commonly used measure of the total error (that is, the dif ference, taking account of both bias and variance, between an estimate [e.g., an ACS 1-year estimate] and what the “true” quantity would be without error). For an unbiased estimate, MSE is equivalent to the variance. RMSE is a commonly used measure of the total error that is expressed in the same units as the quantity being measured instead of squared units.
as the RMSE for the 1-year estimates.30 For medium districts, the RMSEs for 3- and 5-year estimates are $0.168 and $0.147, respectively, when the bias from the trend is ignored and $0.179 and $0.173, respectively, when it is not. As expected, the additional bias due to lack of timeliness is greatest for the 5-year estimates because they average data over a longer period of time, and as documented above, there was a substantial increase during the 5-year period in the percentage of students certified for free or reduced-price meals.
Another consideration in evaluating estimates is the time lag between their reference period and when they would be used to determine reimbursements under the AEO. Although most of our analyses compare, for example, ACS estimates that include 2009 in the reference period—i.e., the 2009, 2007-2009, and 2005-2009 estimates—with SY 2009-2010 administrative estimates, AEO claiming percentages based on those particular ACS estimates would be used 2 years later—for SY 2011-2012.31 Because no such lag is associated with administrative estimates, the lag in the ACS estimates is an additional source of error, specifically, a timeliness bias. For the 3- and 5-year ACS estimates, the lag bias adds to the timeliness bias associated with averaging the most recent data with older data. But the lag bias also pertains to the 1-year estimates even though they do not have the timeliness bias associated with averaging over multiple years of data.
Based on the limited data available to the panel and the modeling assumptions described in Appendix F, we estimated RMSEs that take into account the 2-year time lag between the most recent reference year of a set of ACS estimates and the year when the estimates would be used to establish AEO claiming percentages. For 1-year estimates for large districts, taking the lag into account increases the RMSE by 51 percent, from $0.170 to $0.256.32 For 3-year estimates, taking the time lag into account increases the RMSE from $0.152 to $0.205 (35 percent) for large districts and from $0.179 to $0.214 (20 percent) for medium districts.33 These results demonstrate that, as expected, the estimated error for the 3-year estimates is less affected by the time lag than is the estimated error for the 1-year estimates. The reason is that averaging over time causes estimates to be more stable and thus more highly correlated over time, reducing the error associated with the time lag. For this reason, we also expect the additional error from the time lag to be even smaller for
____________
30 Taking the trend into account does not change the RMSE for 1-year estimates because those estimates do not average across years.
31 The sets of estimates for 2009 were released in late 2010 and early 2011.
32 The latter RMSE is conditional on the specific trend observed over the years for which we had estimates. Had there been no trend, the time lag would have contributed no error.
33 All of these RMSEs are conditional on the specific trend observed over the years for which we had estimates.
5-year estimates than for 3-year estimates. We had only one set of 5-year estimates available to us, however, and could not calculate RMSEs for 5-year estimates that include the error attributable to a 2-year time lag. Nonetheless, because the RMSE for 5-year estimates for medium districts is less than the RMSE for 3-year estimates when the time lag is ignored, we would expect the advantage of the 5-year estimates to be even greater if we could take the time lag into account. Thus, medium districts should generally prefer the 5-year estimates to the 3-year estimates. In contrast, although large districts should generally prefer 3-year estimates to 1-year estimates, whether such districts should prefer 3- or 5-year estimates is less clear. When the time lag is ignored, the 3-year estimates appear to strike the most effective compromise between precision and stability on the one hand and responsiveness to change on the other. If the time lag could be taken into account, however, the 5-year estimates might have a smaller RMSE. As demonstrated above, the 5-year estimates are more stable, an important consideration for many districts.34
Under the AEO, the purpose of using the ACS is to obtain estimates for claiming reimbursement for meals served when application, certification, and other procedures are no longer conducted and meals are provided free of charge to all students. The ACS provides estimates of eligible students based on the data on income and SNAP and welfare program participation collected by the survey, although as documented earlier in this chapter, the ACS eligibility estimates are substantially different, on average, from administrative certification estimates. The ACS does not collect data on participation by students in the school meals programs, yet it is participation that is the basis for reimbursement of districts for the meals they serve under traditional operating procedures or Provisions 2 and 3.
In our earlier depiction of the school meals programs (refer back to Figure 2-1 in Chapter 2), the ACS provides estimates (with error) of the distribution denoted by “ET: All Students—True Eligibility,” whereas administrative data on enrolled students by certification status provide the distribution denoted by “CO: Approved Students—Observed.” Neither distribution, however, reflects the participation patterns of students that are reflected in the distribution of meals served, which is “MO: Meals Served—Observed under Traditional Approach.” Moreover, neither that distribution nor either distribution of students may accurately reflect the changes in participation patterns that might occur when meals were
____________
34 Large districts also have the option of creating their own 2-year or 4-year estimates.
offered free of charge to all students under the AEO, as denoted by “MU: Meals Served—Universal Free Meals (Unobserved).”
Implementing the AEO and offering free meals to all students would lower the price of purchasing a meal for students previously paying the reduced price and, especially, for those previously paying full price. Therefore, given standard economic assumptions about the role of prices in the demand for school meals (that school meals are a normal good for which demand increases when the price decreases), implementing the AEO would be expected to increase participation among all students not already approved to receive free meals. In addition, the availability of free school meals for all students might increase participation among those previously eligible for free meals—as well as those previously paying a reduced price or full price—because it would reduce the family’s burden of applying for benefits and remove any perceived stigma associated with participating in the program. Furthermore, participation might increase if eliminating the need to ascertain the eligibility status of students as they received or purchased meals allowed cafeteria lines to move more quickly so that it was easier to eat a meal during the allotted time for lunch.35 Thus, we would expect participation rates and the distribution of meals served under the AEO to be different from participation rates and the distribution of meals served under traditional operating procedures.
This likelihood could have important implications for establishing accurate claiming percentages—ones that accurately reflect MU, the distribution of meals served when meals are offered free of charge to all students.36 Offering free meals to all students might increase participation rates among students formerly paying full price much more substantially than it increased participation rates among students formerly paying a reduced price or nothing. Then, even if the distribution of meals served under traditional operating procedures (MO) were substantially different from the distributions of eligible and certified students (ET and CO, respectively), the new distribution of meals served under the AEO might be fairly similar to, say, the current distribution of certified students. Alternatively, the distribution of meals served might still be substantially different from the distributions of eligible and certified students.
This section presents the panel’s analyses of participation. The results indicate that the role of participation and the distinctions between the different distributions of students and the different distributions of meals
____________
35 Attendees at the workshop sponsored by the panel mentioned slow cafeteria lines as a factor limiting participation in some schools.
36 As shown in Chapter 5, meals served claiming percentages can be expressed in terms of the product of eligibility percentages and participation rates.
served are important to consider in assessing and, potentially, implementing the AEO.
As documented in Chapter 2 (see Table 2-4), National School Lunch Program (NSLP) participation rates vary substantially at the national level across the free, reduced-price, and full-price categories. Over the past 6 years, the participation rate among students approved for free meals has been at least 1.7 times the rate among students paying full price. The implication is that the distribution of meals served across categories (MO in Figure 2-1) is very different from the distribution of students across categories (CO in Figure 2-1). According to Tables 2-1 and 2-3 in Chapter 2, about half of all enrolled students were approved to receive free or reduced-price meals in 2010, but they were served about 65 percent of all NSLP school lunches.
The data available to the panel for more detailed analyses of participation were limited. Data from form FNS-10 were available only at the state level, and we were not successful in obtaining district-level data for all districts in a state. However, we did have the district- and school-level data provided by our case study districts. This section focuses on several results that are illustrated effectively by our analyses of SY 2008-2009 district-level administrative data for the case study districts. An advantage of using administrative data for not only meals served but also certified students is that the role of participation is highlighted more clearly than it would be if we used ACS eligibility estimates. The latter are subject to sampling error, and as demonstrated earlier in this chapter, are systematically different from the administrative estimates of certified students.
Table 4-10 shows that participation rates in the case study districts—as in the nation as a whole—are much higher for students certified for free or reduced-price meals than for those paying full price. Thus, comparing the distributions of certified students and meals served, we see that the percentage of meals served to students paying full price is smaller—by 9 to 18 percentage points—than the percentage of students paying full price.
When assessing whether and how to adopt the AEO, it is important to note that these substantially different distributions would, if used to establish claiming percentages, imply very different reimbursement rates. Table 4-10 presents BRRs based on both distributions—that of certified students and that of meals served. We see that the BRRs based on meals served—that is, the BRRs that reflect participation—are substantially greater than the BRRs based just on the distribution of certified students. The differences between the two BRRs for each district range from roughly $0.20 to $0.40 or 10 to 19 percent—about as large as the average differences between BRRs based on ACS eligibility estimates and administrative certification estimates. Thus, failing to take participation into
| Claiming Percentages (%) | Claiming Percentages (%) | ||||||||
| Participation Rates (%) | Certified Students | Meals Served | |||||||
| District | Free | Reduced Price | Full Price | Free | Reduced Price | Full Price | Free | Reduced Price | Full Price |
| Austin, Texas | 86 | 72 | 34 | 56 | 8 | 37 | 73 | 8 | 19 |
| Chatham County, Georgia | 75 | 72 | 48 | 59 | 9 | 32 | 67 | 10 | 23 |
| Norfolk, Virginia | 77 | 71 | 43 | 48 | 11 | 41 | 59 | 12 | 29 |
| Omaha, Nebraska | 92 | 84 | 61 | 50 | 11 | 39 | 58 | 12 | 30 |
| Pajaro Valley, California | 68 | 52 | 23 | 59 | 9 | 32 | 77 | 9 | 14 |
| BRRs | |||||
| District | Certified Students ($) | Meals Served ($) | Difference ($) | Percentage Difference | |
| Austin, Texas | 1.71 | 2.12 | -0.41 | -19 | |
| Chatham County, Georgia | 1.80 | 2.01 | -0.21 | -10 | |
| Norfolk, Virginia | 1.59 | 1.87 | -0.29 | -15 | |
| Omaha, Nebraska | 1.64 | 1.84 | -0.20 | -11 | |
| Pajaro Valley, California | 1.81 | 2.22 | -0.41 | -19 | |
NOTE: BRRs = blended reimbursement rates.
SOURCE: Prepared by the panel.
account when establishing claiming percentages under the AEO might cause districts to be underreimbursed by large amounts.
One solution to this potential problem that could be implemented for all districts in the country and would require only data that are readily available in national data files would be to derive claiming percentages by using not only estimates of the distribution of students for each district but also national or state participation rates. Table 4-11 compares such BRRs based on national participation rates with the BRRs based on each district’s actual participation rates (that is, the BRRs based on meals served). Table 4-12 presents the results for BRRs based on state participation rates, and Table 4-13 includes all of the BRRs from the previous three tables. To supplement results for the case study districts, Table 4-14 presents state-level BRRs based on the distribution of certified students, national participation rates applied to each state’s distribution of certified students, and each state’s actual participation rates applied to its distribution of certified students (which equals the BRR derived from the actual distribution of meals served).
These tables indicate that taking participation into account—even using a fairly crude approach—typically produces a BRR that is closer to the actual value based on meals served than is a BRR that ignores participation. For the particular school year that we considered, this is true for all the case study districts and most of the states. Because participation rates vary across districts and states, however, a crude approach does not always work well, and sometimes does not work at all. Considering the Austin school district, for example, we see that while the BRR based on the distribution of certified students is low by 19 percent according to Table 4-10, the BRR that incorporates state participation rates is more accurate but still low by 14 percent (see Table 4-12). For some states, such as Delaware and Texas, a BRR that ignored participation would lead to underreimbursement, while a BRR based on national participation rates would lead to a larger overreimbursement. Although limited to states and just a few districts, these findings suggest that a one-size-fits-all approach for taking account of participation might not work well.
As discussed above, we cannot assess the effects of participation under traditional operating procedures only. We must also consider the potential implications of changes in participation rates when meals are offered free of charge to all students under the AEO. Before doing so, however, we should note that the effects of participation as reflected in the difference between the distribution of students and the distribution of meals served generally are smaller as the percentage of students certified for free or reduced-price meals becomes larger. Although this percentage is not terribly high for each case study district as a whole (for reasons explained in the discussion of our selection of case study districts
| Participation Rates | ||||||
| District (%) | National (%) | |||||
| District | Free | Reduced Price | Full Price | Free | Reduced Price | Full Price |
| Austin, Texas | 86 | 72 | 34 | 75 | 67 | 43 |
| Chatham County, Georgia | 75 | 72 | 48 | 75 | 67 | 43 |
| Norfolk, Virginia | 77 | 71 | 43 | 75 | 67 | 43 |
| Omaha, Nebraska | 92 | 84 | 61 | 75 | 67 | 43 |
| Pajaro Valley, California | 68 | 52 | 23 | 75 | 67 | 43 |
| Claiming Percentages (based on meals served) | ||||||
| District Participation Rates (%) | National Participation Rates (%) | |||||
| District | Free | Reduced Price | Full Price | Free | Reduced Price | Full Price |
| Austin, Texas | 73 | 8 | 19 | 67 | 8 | 25 |
| Chatham County, Georgia | 67 | 10 | 23 | 69 | 9 | 22 |
| Norfolk, Virginia | 59 | 12 | 29 | 59 | 12 | 29 |
| Omaha, Nebraska | 58 | 12 | 30 | 61 | 12 | 27 |
| Pajaro Valley, California | 77 | 9 | 14 | 69 | 9 | 21 |
| BRRs | ||||
| District | Actual ($) |
Illustrative ($) |
Difference ($) |
Percentage Difference |
| Austin, Texas | 2.12 | 1.98 | –0.15 | –7 |
| Chatham County, Georgia | 2.01 | 2.05 | 0.04 | 2 |
| Norfolk, Virginia | 1.87 | 1.87 | –0.01 | 0 |
| Omaha, Nebraska | 1.84 | 1.91 | 0.07 | 4 |
| Pajaro Valley, California | 2.22 | 2.05 | –0.17 | –8 |
NOTE: BRRs = blended reimbursement rates.
SOURCE: Prepared by the panel.
in Chapter 3), there are schools within each case study district that have very high percentages. Table 4-15 presents illustrative results from 30 such schools that have been sorted from lowest to highest percentage of students certified for free or reduced-price meals.37 When this percentage is 85 or higher (and sometimes when it is lower), the difference between
____________
37 These 30 schools are not all of the schools with very high percentages of students certified for free or reduced-price meals. Rather, they are a subset chosen to illustrate the differences in BRRs across different values of this certification percentage and different sets of participation rates. The schools are not identified in the table to preserve confidentiality.
| Participation Rates | ||||||
| District (%) | State (%) | |||||
| District | Free | Reduced Price | Full Price | Free | Reduced Price | Full Price |
| Austin, Texas | 86 | 72 | 34 | 68 | 66 | 54 |
| Chatham County, Georgia | 75 | 72 | 48 | 84 | 75 | 58 |
| Norfolk, Virginia | 77 | 71 | 43 | 83 | 74 | 45 |
| Omaha, Nebraska | 92 | 84 | 61 | 88 | 78 | 67 |
| Pajaro Valley, California | 68 | 52 | 23 | 66 | 60 | 25 |
| Claiming Percentages (based on meals served) | ||||||
| District Participation Rates (%) | State Participation Rates (%) | |||||
| District | Free | Reduced Price | Full Price | Free | Reduced Price | Full Price |
| Austin, Texas | 73 | 8 | 19 | 61 | 8 | 31 |
| Chatham County, Georgia | 67 | 10 | 23 | 66 | 9 | 25 |
| Norfolk, Virginia | 59 | 12 | 29 | 60 | 12 | 28 |
| Omaha, Nebraska | 58 | 12 | 30 | 56 | 11 | 33 |
| Pajaro Valley, California | 77 | 9 | 14 | 75 | 10 | 15 |
| BRRs | ||||||
| District | Actual ($) | Illustrative ($) | Difference ($) | Percentage Difference | ||
| Austin, Texas | 2.12 | 1.83 | –0.29 | –14 | ||
| Chatham County, Georgia | 2.01 | 1.98 | –0.04 | –2 | ||
| Norfolk, Virginia | 1.87 | 1.89 | 0.02 | 1 | ||
| Omaha, Nebraska | 1.84 | 1.78 | –0.06 | –3 | ||
| Pajaro Valley, California | 2.22 | 2.20 | –0.03 | –1 | ||
NOTE: BRRs = blended reimbursement rates.
SOURCE: Prepared by the panel.
the BRRs based on the distribution of certified students and the distribution of meals served tends to be small in percentage terms, although it can still be as large as $.20 per meal.
In light of the evidence that taking participation into account is potentially important, the panel explored crude approaches based on national and state participation rates because they require only data readily available in national data files and could be implemented as part of a process for producing estimates for all districts in the country. Although a one-size-fits-all method is attractive for its simplicity, it is not necessary to take such an approach if a more tailored alternative offers significant
TABLE 4-13 Alternative BRRs for Case Study Districts
| BRRs ($) | ||||
| Adjusted Using | ||||
| District | Certified Students | National Participation Rates | State Participation Rates | Actual Meals Served |
| Austin, Texas | 1.71 | 1.98 | 1.83 | 2.12 |
| Chatham County, Georgia | 1.80 | 2.05 | 1.98 | 2.01 |
| Norfolk, Virginia | 1.59 | 1.87 | 1.89 | 1.87 |
| Omaha, Nebraska | 1.64 | 1.91 | 1.78 | 1.84 |
| Pajaro Valley, California | 1.81 | 2.05 | 2.20 | 2.22 |
| Difference from Actual Meals Served BRRs ($) | ||||
| Adjusted Using | ||||
| District | Certified Students | National Participation Rates |
State Participation Rates |
|
| Austin, Texas | –0.41 | –0.15 | –0.29 | |
| Chatham County, Georgia | –0.21 | 0.04 | –0.04 | |
| Norfolk, Virginia | –0.29 | –0.01 | 0.02 | |
| Omaha, Nebraska | –0.20 | 0.07 | –0.06 | |
| Pajaro Valley, California | –0.41 | –0.17 | –0.03 | |
NOTE: BRRs = blended reimbursement rates.
SOURCE: Prepared by the panel.
advantages. With respect to the issue of taking participation into account, districts know their own participation rates (at least for the prior school year) and could use them in combination with ACS eligibility estimates to develop AEO claiming percentages. Although such participation rates have the advantage of being specific to each district, a potentially important limitation is that they would not reflect the effects on participation of offering free meals to all students. That is, they would not reflect the differences between the MO and MU distributions depicted in Figure 2-1.
The panel was unable to identify reliable, broadly applicable data that might be used to predict accurately for individual districts the effects on participation of offering free meals to all students. In fact, we found little information to inform analyses that might illustrate the potential effects of providing universal free meals under the AEO. Therefore, to gain some sense of how the BRRs of the case study districts might be affected by changing participation rates, we simply assumed that the rates for the free and full-price categories would increase by 5 and 10 percentage points, respectively, while the rate for the reduced-price category would rise to
within 3 percentage points of the new rate for the free category. The results of this purely illustrative analysis are shown in Table 4-16. The first three data columns display the districts’ actual SY 2008-2009 participation rates under traditional operating procedures. The next three columns reflect the assumed changes in participation rates due to adoption of the AEO and the offer of free meals to all students. After several columns displaying the resulting claiming percentages and BRRs, the last two columns indicate that the effects on BRRs might be fairly small, at least compared with differences between BRRs based on ACS estimates and those based on administrative estimates or BRRs that take participation into account (even crudely) and those that do not take participation into account. Similarly, for schools in the case study districts—specifically, the 30 schools with very high percentages of students certified for free or reduced-price meals—these same increases in participation rates under the AEO would have only a small effect on BRRs (see Table 4-17). Of course, a district or school could experience larger changes in participation rates and, therefore, larger effects on its BRR due to adoption of the AEO.
Another way to examine these results is to consider whether the changes in participation rates induced by offering free meals to all students under the AEO might bring the distribution of meals served close to the distribution of certified/eligible students. If that were to occur, claiming percentages could be based on the distribution of certified/eligible students, and it would not be necessary to take participation into account. Tables 4-18 (for the case study districts) and 4-19 (for schools within the districts) present BRRs from the previous tables and compare the BRRs based on the distribution of meals served—both pre- and post-AEO— with those based on the distribution of certified students. As expected in light of the previous comparisons, the post-AEO meals-served BRRs generally are only a little closer to the certified-students BRRs than are the pre-AEO meals-served BRRs. Although both meals-served BRRs are close to the certified-students BRR for some of the schools with very high percentages of students certified for free or reduced-price meals, the difference between the post-AEO meals-served BRR and the certified-students BRR is substantial for other schools and each of the districts as a whole. In such instances, the post-AEO meals-served BRR and the certified-students BRR would be equal only if the offer of free meals under the AEO induced a very substantial increase in the participation rate among students formerly paying full price so that their participation rate would be roughly equal to that for students who had already been receiving free meals.38
The panel’s analyses focused on the BRR, which is the average reim-
____________
38 This would increase the percentage of meals served to students formerly paying full price and lower the meals-served BRR to the level of the certified-students BRR.
TABLE 4-14 Alternative BRRs for States
|
|
||||||||
| Actual Participation Rates (%) |
BRRs ($) | Difference from Actual Meals Served BRR ($) |
||||||
| State | Free | Reduced Price |
Full Price |
Certified Students |
Adjusted Using National Participation Rates |
Actual Meals Served |
Certified Students |
Adjusted Using National Participation Rates |
|
|
||||||||
| Alabama | 84 | 75 | 57 | 1.49 | 1.79 | 1.69 | -0.20 | 0.09 |
| Alaska | 66 | 66 | 25 | 1.22 | 1.53 | 1.76 | -0.54 | -0.23 |
| Arizona | 86 | 74 | 35 | 1.37 | 1.67 | 1.83 | -0.47 | -0.16 |
| Arkansas | 84 | 74 | 49 | 1.53 | 1.82 | 1.80 | -0.28 | 0.01 |
| California | 66 | 60 | 25 | 1.51 | 1.80 | 1.99 | -0.48 | -0.19 |
| Colorado | 75 | 64 | 26 | 0.97 | 1.26 | 1.53 | -0.56 | -0.27 |
| Connecticut | 83 | 73 | 40 | 0.96 | 1.24 | 1.34 | -0.38 | -0.10 |
| Delaware | 70 | 73 | 61 | 1.38 | 1.69 | 1.46 | -0.08 | 0.22 |
| District of Columbia | 72 | 61 | 41 | 1.74 | 2.00 | 2.00 | -0.26 | 0.00 |
| Florida | 78 | 65 | 31 | 1.41 | 1.71 | 1.89 | -0.48 | -0.18 |
| Georgia | 84 | 75 | 58 | 1.50 | 1.80 | 1.70 | -0.20 | 0.09 |
| Hawaii | 62 | 56 | 48 | 1.24 | 1.54 | 1.37 | -0.13 | 0.17 |
| Idaho | 80 | 71 | 54 | 1.31 | 1.61 | 1.51 | -0.20 | 0.10 |
| Illinois | 76 | 63 | 39 | 1.37 | 1.68 | 1.73 | -0.36 | -0.06 |
| Indiana | 67 | 58 | 65 | 1.40 | 1.70 | 1.41 | -0.01 | 0.29 |
| Iowa | 80 | 77 | 63 | 1.02 | 1.31 | 1.14 | -0.12 | 0.17 |
| Kansas | 81 | 74 | 55 | 1.16 | 1.46 | 1.37 | -0.21 | 0.09 |
| Kentucky | 76 | 79 | 79 | 1.64 | 1.91 | 1.62 | 0.02 | 0.29 |
| Louisiana | 76 | 67 | 61 | 1.67 | 1.94 | 1.78 | -0.11 | 0.16 |
| Maine | 72 | 62 | 40 | 1.14 | 1.44 | 1.46 | -0.32 | -0.02 |
| Maryland | 77 | 67 | 31 | 1.04 | 1.33 | 1.52 | -0.48 | -0.19 |
| Massachusetts | 78 | 65 | 40 | 0.99 | 1.28 | 1.34 | -0.35 | -0.05 |
| Michigan | 75 | 67 | 34 | 1.19 | 1.50 | 1.63 | -0.44 | -0.13 |
| Minnesota | 73 | 84 | 57 | 1.00 | 1.28 | 1.13 | -0.14 | 0.15 |
| Mississippi | 85 | 75 | 51 | 1.77 | 2.03 | 2.00 | -0.23 | 0.02 |
| Missouri | 80 | 73 | 55 | 1.27 | 1.58 | 1.48 | -0.21 | 0.10 |
| Montana | 77 | 67 | 43 | 1.09 | 1.39 | 1.40 | -0.31 | -0.01 |
| Nebraska | 88 | 78 | 67 | 1.10 | 1.40 | 1.24 | -0.14 | 0.16 |
| Nevada | 65 | 51 | 23 | 1.25 | 1.55 | 1.79 | -0.54 | -0.23 |
| New Hampshire | 79 | 67 | 45 | 0.76 | 0.99 | 1.00 | -0.24 | 0.00 |
| New Jersey | 80 | 67 | 36 | 1.06 | 1.35 | 1.48 | -0.42 | -0.13 |
| New Mexico | 74 | 67 | 49 | 1.77 | 2.02 | 1.96 | -0.19 | 0.06 |
| New York | 74 | 66 | 40 | 1.37 | 1.68 | 1.70 | -0.32 | -0.02 |
| North Carolina | 78 | 68 | 43 | 1.40 | 1.70 | 1.72 | -0.32 | -0.02 |
| North Dakota | 100 | 80 | 66 | 0.86 | 1.13 | 1.04 | -0.18 | 0.09 |
| Ohio | 79 | 71 | 40 | 1.13 | 1.44 | 1.50 | -0.37 | -0.07 |
| Oklahoma | 72 | 69 | 50 | 1.53 | 1.82 | 1.73 | -0.20 | 0.09 |
| Oregon | 72 | 61 | 31 | 1.30 | 1.60 | 1.74 | -0.45 | -0.14 |
| Pennsylvania | 78 | 72 | 47 | 1.08 | 1.38 | 1.35 | -0.27 | 0.03 |
| Rhode Island | 76 | 65 | 28 | 1.17 | 1.47 | 1.71 | -0.54 | -0.23 |
| South Carolina | 81 | 70 | 45 | 1.48 | 1.78 | 1.79 | -0.31 | -0.01 |
| South Dakota | 82 | 78 | 65 | 1.11 | 1.41 | 1.23 | -0.12 | 0.18 |
| Tennessee | 71 | 64 | 50 | 1.53 | 1.82 | 1.72 | -0.19 | 0.11 |
| Texas | 68 | 66 | 54 | 1.77 | 2.02 | 1.88 | -0.11 | 0.14 |
| Utah | 75 | 72 | 50 | 1.03 | 1.32 | 1.24 | -0.21 | 0.08 |
| Vermont | 78 | 67 | 43 | 0.99 | 1.27 | 1.28 | -0.29 | -0.01 |
| Virginia | 83 | 74 | 45 | 1.04 | 1.33 | 1.36 | -0.32 | -0.03 |
| Washington | 76 | 65 | 31 | 1.15 | 1.45 | 1.63 | -0.48 | -0.18 |
| West Virginia | 70 | 63 | 60 | 1.46 | 1.76 | 1.54 | -0.08 | 0.22 |
| Wisconsin | 76 | 73 | 53 | 1.04 | 1.34 | 1.24 | -0.20 | 0.10 |
| Wyoming | 80 | 71 | 53 | 0.98 | 1.26 | 1.19 | -0.20 | 0.08 |
| United States | 75 | 67 | 43 | 1.35 | 1.66 | 1.66 | -0.30 | 0.00 |
|
|
||||||||
NOTE: BRRs = blended reimbursement rates.
SOURCE: Prepared by the panel.
|
|
||||||
| Participation Rates (%) | Claiming Percentages Certified Students |
|||||
| School | Free | Reduced Price | Full Price | Free | Reduced Price | Full Price |
|
|
||||||
| 1 | 98 | 94 | 23 | 65 | 7 | 27 |
| 2 | 96 | 9 | 85 | 63 | 11 | 26 |
| 3 | 85 | 64 | 35 | 65 | 9 | 26 |
| 4 | 96 | 91 | 71 | 59 | 16 | 25 |
| 5 | 96 | 79 | 44 | 68 | 8 | 24 |
| 6 | 91 | 82 | 59 | 57 | 20 | 23 |
| 7 | 63 | 55 | 18 | 67 | 10 | 23 |
| 8 | 74 | 71 | 71 | 68 | 9 | 23 |
| 9 | 93 | 94 | 83 | 64 | 14 | 22 |
| 10 | 45 | 31 | 6 | 72 | 7 | 21 |
| 11 | 57 | 44 | 16 | 74 | 6 | 20 |
| 12 | 96 | 86 | 66 | 76 | 6 | 18 |
| 13 | 89 | 95 | 27 | 75 | 6 | 18 |
| 14 | 89 | 87 | 74 | 68 | 15 | 17 |
| 15 | 77 | 67 | 33 | 77 | 9 | 15 |
| 16 | 99 | 93 | 33 | 80 | 7 | 14 |
| 17 | 97 | 98 | 55 | 83 | 4 | 13 |
| 18 | 90 | 89 | 82 | 83 | 5 | 12 |
| 19 | 82 | 67 | 35 | 78 | 11 | 11 |
| 20 | 96 | 90 | 90 | 84 | 5 | 10 |
| 21 | 62 | 41 | 28 | 77 | 13 | 10 |
| 22 | 70 | 47 | 22 | 82 | 8 | 10 |
| 23 | 95 | 93 | 60 | 88 | 3 | 9 |
| 24 | 92 | 92 | 68 | 84 | 8 | 8 |
| 25 | 86 | 80 | 40 | 87 | 7 | 6 |
| 26 | 95 | 95 | 95 | 89 | 6 | 5 |
| 27 | 94 | 67 | 60 | 88 | 7 | 5 |
| 28 | 90 | 84 | 78 | 86 | 10 | 4 |
| 29 | 84 | 77 | 78 | 89 | 7 | 4 |
| 30 | 90 | 83 | 60 | 87 | 9 | 4 |
|
|
||||||
NOTE: BRRs = blended reimbursement rates.
SOURCE: Prepared by the panel.
| Claiming Percentages Meals Served | BRRs | ||||||
| Free | Reduced Price | Full Price | Certified Students ($) | Meals Served ($) | Difference ($) | Percentage Difference | |
| 83 | 9 | 8 | 1.92 | 2.36 | –0.44 | –19 | |
| 72 | 1 | 27 | 1.94 | 1.97 | –0.03 | –1 | |
| 79 | 8 | 13 | 1.95 | 2.26 | –0.31 | –14 | |
| 64 | 17 | 20 | 1.95 | 2.06 | –0.11 | –5 | |
| 80 | 8 | 13 | 2.01 | 2.27 | –0.26 | –11 | |
| 64 | 20 | 17 | 1.97 | 2.12 | –0.15 | –7 | |
| 82 | 10 | 8 | 2.01 | 2.36 | –0.35 | –15 | |
| 69 | 9 | 22 | 2.02 | 2.03 | –0.02 | –1 | |
| 66 | 15 | 20 | 2.03 | 2.07 | –0.04 | –2 | |
| 90 | 6 | 3 | 2.08 | 2.49 | –0.41 | –17 | |
| 87 | 6 | 7 | 2.10 | 2.41 | –0.31 | –13 | |
| 81 | 5 | 14 | 2.14 | 2.25 | –0.11 | –5 | |
| 86 | 8 | 6 | 2.14 | 2.41 | –0.27 | –11 | |
| 70 | 15 | 14 | 2.14 | 2.20 | –0.06 | –3 | |
| 85 | 8 | 7 | 2.22 | 2.39 | –0.18 | –7 | |
| 88 | 7 | 5 | 2.24 | 2.44 | –0.20 | –8 | |
| 88 | 4 | 8 | 2.27 | 2.39 | –0.12 | –5 | |
| 84 | 5 | 11 | 2.28 | 2.31 | –0.02 | –1 | |
| 85 | 10 | 5 | 2.29 | 2.43 | –0.14 | –6 | |
| 85 | 5 | 10 | 2.33 | 2.34 | –0.01 | –1 | |
| 85 | 10 | 5 | 2.31 | 2.44 | –0.13 | –5 | |
| 91 | 6 | 3 | 2.34 | 2.49 | –0.15 | –6 | |
| 91 | 3 | 6 | 2.37 | 2.44 | –0.07 | –3 | |
| 86 | 8 | 6 | 2.37 | 2.42 | –0.05 | –2 | |
| 90 | 7 | 3 | 2.42 | 2.50 | –0.07 | –3 | |
| 89 | 6 | 5 | 2.45 | 2.45 | 0.00 | 0 | |
| 91 | 6 | 3 | 2.45 | 2.50 | –0.04 | –2 | |
| 87 | 9 | 4 | 2.45 | 2.46 | –0.02 | –1 | |
| 90 | 7 | 4 | 2.47 | 2.48 | –0.01 | 0 | |
| 89 | 8 | 3 | 2.47 | 2.50 | –0.03 | –1 | |
|
|
|||||||
|
|
||||||
| Participation Rates | ||||||
| Actual, Pre-AEO (%) | Illustrative, Post-AEO (%) | |||||
| District | Free | Reduced Price | Full Price | Free | Reduced Price | Full Price |
|
|
||||||
| Austin, Texas | 86 | 72 | 34 | 91 | 88 | 44 |
| Chatham County, Georgia | 75 | 72 | 48 | 80 | 77 | 58 |
| Norfolk, Virginia | 77 | 71 | 43 | 82 | 79 | 53 |
| Omaha, Nebraska | 92 | 84 | 61 | 97 | 94 | 71 |
| Pajaro Valley, California | 68 | 52 | 23 | 73 | 70 | 33 |
| Claiming Percentages (based on meals served) | ||||||
| Actual, Pre-AEO (%) | Illustrative, Post-AEO (%) | |||||
| District | Free | Reduced Price | Full Price | Free | Reduced Price | Full Price |
| Austin, Texas | 73 | 8 | 19 | 69 | 9 | 22 |
| Chatham County, Georgia | 67 | 10 | 23 | 65 | 9 | 26 |
| Norfolk, Virginia | 59 | 12 | 29 | 56 | 12 | 32 |
| Omaha, Nebraska | 58 | 12 | 30 | 56 | 12 | 32 |
| Pajaro Valley, California | 77 | 9 | 14 | 72 | 10 | 18 |
| BRRs | ||||||
| District | Actual, Pre-AEO ($) | Illustrative, Post-AEO ($) | Difference ($) | Percentage Difference | ||
| Austin, Texas | 2.12 | 2.05 | –0.07 | –3 | ||
| Chatham County, Georgia | 2.01 | 1.96 | –0.05 | –3 | ||
| Norfolk, Virginia | 1.87 | 1.81 | –0.07 | –4 | ||
| Omaha, Nebraska | 1.84 | 1.80 | –0.04 | –2 | ||
| Pajaro Valley, California | 2.22 | 2.13 | –0.09 | –4 | ||
NOTE: AEO = American Community Survey (ACS) Eligibility Option; BRRs = blended reimbursement rates.
SOURCE: Prepared by the panel.
bursement rate per meal. However, another potentially important consideration is that any changes in participation rates under the AEO could impact the total reimbursement received by a district by affecting not only the BRR but also the total number of meals served. Thus, a district would have to assess the cost implications of a change in the scale of food service operations. A large increase in the total number of meals served might require, for example, that more staff be hired or that the kitchen facilities be expanded.
The panel’s evaluations of the ACS-based eligibility estimates encompassed a wide range of issues. The main results of our analyses include the following:
- ACS estimates are systematically different from administrative estimates for high and very high FRPL districts.
- BRRs based on ACS estimates of eligible students are substan-tially less than BRRs based on CCD estimates of certified students for high and very high FRPL districts, on average.
- Average ACS-CCD differences are larger for very high FRPL districts than for high FRPL districts.
- There are several potentially important sources of systematic differences between ACS and administrative estimates, and the effects of these sources are likely to vary across districts.
- A statistical model can explain a substantial fraction—but far from all—of the variability across districts in the differences between ACS and administrative estimates.
- Relative to the inter temporal changes in BRRs normally expe-rienced by a district, as reflected in the administrative data on certified students, the typical large district would likely experience less variability if it used 3- or 5-year ACS estimates but greater variability if it used 1-year ACS estimates.39 The typical medium district would experience about the same variability as normal if it used 3-year ACS estimates and less variability than normal if it used 5-year ACS estimates. The typical small district would experience somewhat less than normal variability if it used 5-year ACS estimates.
- For districts with enrollments of 400 or higher, ACS 5-year estimates would probably be as stable or more so than the districts’ administrative estimates. The 5-year estimates might be less stable than administrative estimates for smaller districts.
- For small very high FRPL districts, average differences between model-based ACS estimates and CCD BRR estimates are substantially larger than average differences between ACS 5-year estimates and CCD estimates.
- Based on overall accuracy and consideration of error due to both variability and bias, the 5-year estimates would likely be more accurate than the 3-year estimates for medium districts. For large
____________
39 As noted previously, a typical school in a category has an enrollment at about the median enrollment for schools in the category.
| Participation Rates | Claiming Percentages Based on Meals Served | ||||||||
| Actual, Pre-AEO (%) | Illustrative, Post-AEO (%) | Actual, Pre-AEO | |||||||
| School | Free | Reduced Price | Full Price | Free | Reduced Price | Full Price | Free | Reduced Price | Full Price |
| 1 | 98 | 94 | 23 | 100 | 97 | 33 | 83 | 9 | 8 |
| 2 | 96 | 9 | 85 | 100 | 97 | 94 | 72 | 1 | 27 |
| 3 | 85 | 64 | 35 | 90 | 87 | 45 | 79 | 8 | 13 |
| 4 | 96 | 91 | 71 | 100 | 97 | 81 | 64 | 17 | 20 |
| 5 | 96 | 79 | 44 | 100 | 97 | 54 | 80 | 8 | 13 |
| 6 | 91 | 82 | 59 | 96 | 93 | 69 | 64 | 20 | 17 |
| 7 | 63 | 55 | 18 | 68 | 65 | 28 | 82 | 10 | 8 |
| 8 | 74 | 71 | 71 | 79 | 76 | 73 | 69 | 9 | 22 |
| 9 | 93 | 94 | 83 | 98 | 95 | 92 | 66 | 15 | 20 |
| 10 | 45 | 31 | 6 | 50 | 47 | 16 | 90 | 6 | 3 |
| 11 | 57 | 44 | 16 | 62 | 59 | 26 | 87 | 6 | 7 |
| 12 | 96 | 86 | 66 | 100 | 97 | 76 | 81 | 5 | 14 |
| 13 | 89 | 95 | 27 | 94 | 91 | 37 | 86 | 8 | 6 |
| 14 | 89 | 87 | 74 | 94 | 91 | 84 | 70 | 15 | 14 |
| 15 | 77 | 67 | 33 | 82 | 79 | 43 | 85 | 8 | 7 |
| 16 | 99 | 93 | 33 | 100 | 97 | 43 | 88 | 7 | 5 |
| 17 | 97 | 98 | 55 | 100 | 97 | 65 | 88 | 4 | 8 |
| 18 | 90 | 89 | 82 | 95 | 92 | 89 | 84 | 5 | 11 |
| 19 | 82 | 67 | 35 | 87 | 84 | 45 | 85 | 10 | 5 |
| 20 | 96 | 90 | 90 | 100 | 97 | 94 | 85 | 5 | 10 |
| 21 | 62 | 41 | 28 | 67 | 64 | 38 | 85 | 10 | 5 |
| 22 | 70 | 47 | 22 | 75 | 72 | 32 | 91 | 6 | 3 |
| 23 | 95 | 93 | 60 | 100 | 97 | 70 | 91 | 3 | 6 |
| 24 | 92 | 92 | 68 | 97 | 94 | 78 | 86 | 8 | 6 |
| 25 | 86 | 80 | 40 | 91 | 88 | 50 | 90 | 7 | 3 |
| 26 | 95 | 95 | 95 | 100 | 97 | 94 | 89 | 6 | 5 |
| 27 | 94 | 67 | 60 | 99 | 96 | 70 | 91 | 6 | 3 |
| 28 | 90 | 84 | 78 | 95 | 92 | 88 | 87 | 9 | 4 |
| 29 | 84 | 77 | 78 | 89 | 86 | 83 | 90 | 7 | 4 |
| 30 | 90 | 83 | 60 | 95 | 92 | 70 | 89 | 8 | 3 |
NOTE: AEO = American Community Survey (ACS) Eligibility Option; BRR = blended reimbursement rate.
SOURCE: Prepared by the panel.
| Illustrative, Post-AEO | BRR | ||||||
| Free | Reduced Price | Full Price | Actual Pre-AEO ($) | Illustrative Post-AEO ($) | Difference ($) | Percentage Difference | |
| 80 | 9 | 11 | 2.36 | 2.29 | –0.07 | –3 | |
| 64 | 11 | 25 | 1.97 | 1.96 | 0.00 | 0 | |
| 75 | 10 | 15 | 2.26 | 2.20 | –0.05 | –2 | |
| 62 | 17 | 21 | 2.06 | 2.03 | –0.03 | –1 | |
| 77 | 9 | 14 | 2.27 | 2.22 | –0.04 | –2 | |
| 61 | 21 | 18 | 2.12 | 2.09 | –0.03 | –1 | |
| 78 | 11 | 11 | 2.36 | 2.29 | –0.07 | –3 | |
| 69 | 9 | 22 | 2.03 | 2.05 | 0.02 | 1 | |
| 65 | 14 | 21 | 2.07 | 2.05 | –0.02 | –1 | |
| 84 | 8 | 8 | 2.49 | 2.38 | –0.11 | –4 | |
| 84 | 7 | 10 | 2.41 | 2.34 | –0.07 | –3 | |
| 80 | 6 | 15 | 2.25 | 2.22 | –0.03 | –1 | |
| 85 | 7 | 8 | 2.41 | 2.37 | –0.04 | –2 | |
| 70 | 15 | 15 | 2.20 | 2.18 | –0.02 | –1 | |
| 83 | 9 | 8 | 2.39 | 2.36 | –0.03 | –1 | |
| 87 | 7 | 6 | 2.44 | 2.41 | –0.03 | –1 | |
| 87 | 4 | 9 | 2.39 | 2.36 | –0.02 | –1 | |
| 84 | 5 | 12 | 2.31 | 2.30 | –0.01 | 0 | |
| 83 | 11 | 6 | 2.43 | 2.41 | –0.03 | –1 | |
| 85 | 5 | 10 | 2.34 | 2.34 | 0.00 | 0 | |
| 81 | 13 | 6 | 2.44 | 2.40 | –0.04 | –1 | |
| 87 | 8 | 4 | 2.49 | 2.46 | –0.03 | –1 | |
| 91 | 3 | 6 | 2.44 | 2.43 | –0.01 | –1 | |
| 86 | 7 | 7 | 2.42 | 2.40 | –0.01 | 0 | |
| 90 | 7 | 3 | 2.50 | 2.48 | –0.01 | –1 | |
| 90 | 6 | 5 | 2.45 | 2.46 | 0.01 | 0 | |
| 89 | 7 | 3 | 2.50 | 2.48 | –0.01 | –1 | |
| 87 | 9 | 4 | 2.46 | 2.46 | –0.01 | 0 | |
| 80 | 7 | 4 | 2.48 | 2.48 | 0.00 | 0 | |
| 88 | 9 | 3 | 2.50 | 2.49 | –0.01 | 0 | |
| Blended Reimbursement Rates | Difference from Certified Students BRR | ||||||
| Meals Served | Actual Meals Served, Pre-AEO | Illustrative Meals Served, Post-AEO | |||||
| District | Certified Students ($) | Actual, Pre-AEO ($) | Illustrative, Post-AEO ($) | Difference ($) | Percentage Difference | Difference ($) | Percentage Difference |
| Austin, Texas | 1.71 | 2.12 | 2.05 | 0.41 | 24 | 0.34 | 20 |
| Chatham County, Georgia | 1.80 | 2.01 | 1.96 | 0.21 | 11 | 0.15 | 9 |
| Norfolk, Virginia | 1.59 | 1.87 | 1.81 | 0.29 | 18 | 0.22 | 14 |
| Omaha, Nebraska | 1.64 | 1.84 | 1.80 | 0.20 | 12 | 0.16 | 10 |
| Pajaro Valley, California | 1.81 | 2.22 | 2.13 | 0.41 | 23 | 0.33 | 18 |
NOTE: AEO = American Community Survey (ACS) Eligibility Option; BRR = blended reimbursement rate.
SOURCE: Prepared by the panel.
districts, both 3- and 5-year estimates would likely be more accurate than 1-year estimates. However, whether the 3- or 5-year estimates would be more accurate is less clear. Although some results suggest that the 3-year estimates appear to strike the most effective compromise between precision and stability on the one hand and responsiveness to change on the other, the panel was unable to perform some analyses because the sets of estimates available to us were too limited.
- BRRs based on the distribution of certified students can be substantially less than BRRs based on the distribution of meals served, although changes in participation after adoption of the AEO could reduce these differences.
Based on the panel’s empirical analyses, as well as consultations with experts and reviews of relevant documents, the panel reached the following conclusions:
Conclusion 4-1: A one-size-fits-all approach for benchmarking ACS estimates of students eligible for school meals to administrative estimates to minimize the differences caused by such factors as underreporting of SNAP participation is not possible at present. Further research will be required to determine whether a technically sound and operationally feasible set of procedures for estimating the necessary adjustments to the ACS estimates can be developed. Furthermore, even if such procedures were identified and used, additional adjustments based on a district’s own data might improve the benchmarking of the ACS estimates to administrative estimates.
Conclusion 4-2: Medium districts generally should prefer the 5-year ACS estimates to the 3-year estimates, and large districts generally should prefer either the 3- or 5-year estimates to the 1-year estimates. However, it is not clear whether large districts should prefer the 3- or 5-year estimates.
Conclusion 4-3: Although all districts should thoroughly assess their estimates and the potential implications of adopting the AEO, as discussed in detail in Chapter 5, districts with enrollments below 400 should consider especially carefully whether reimbursements might fluctuate too much if they were based on ACS 5-year estimates.40
____________
40 Many districts fall in this category—about 30 percent of the very high FRPL districts.
| BRR | |||
| Meals Served | |||
| School | Certified Students ($) | Actual, Pre-AEO ($) | Illustrative, Post-AEO ($) |
| 1 | 1.92 | 2.36 | 2.29 |
| 2 | 1.94 | 1.97 | 1.96 |
| 3 | 1.95 | 2.26 | 2.20 |
| 4 | 1.95 | 2.06 | 2.03 |
| 5 | 2.01 | 2.27 | 2.22 |
| 6 | 1.97 | 2.12 | 2.09 |
| 7 | 2.01 | 2.36 | 2.29 |
| 8 | 2.02 | 2.03 | 2.05 |
| 9 | 2.03 | 2.07 | 2.05 |
| 10 | 2.08 | 2.49 | 2.38 |
| 11 | 2.10 | 2.41 | 2.34 |
| 12 | 2.14 | 2.25 | 2.22 |
| 13 | 2.14 | 2.41 | 2.37 |
| 14 | 2.14 | 2.20 | 2.18 |
| 15 | 2.22 | 2.39 | 2.36 |
| 16 | 2.24 | 2.44 | 2.41 |
| 17 | 2.27 | 2.39 | 2.36 |
| 18 | 2.28 | 2.31 | 2.30 |
| 19 | 2.29 | 2.43 | 2.41 |
| 20 | 2.33 | 2.34 | 2.34 |
| 21 | 2.31 | 2.44 | 2.40 |
| 22 | 2.34 | 2.49 | 2.46 |
| 23 | 2.37 | 2.44 | 2.43 |
| 24 | 2.37 | 2.42 | 2.40 |
| 25 | 2.42 | 2.50 | 2.48 |
| 26 | 2.45 | 2.45 | 2.46 |
| 27 | 2.45 | 2.50 | 2.48 |
| 28 | 2.45 | 2.46 | 2.46 |
| 29 | 2.47 | 2.48 | 2.48 |
| 30 | 2.47 | 2.50 | 2.49 |
NOTE: AEO = American Community Survey (ACS) Eligibility Option; BRR = blended reimbursement rate.
SOURCE: Prepared by the panel.
| Difference from Certified Students BRR | ||||
| Actual Meals Served, Pre-AEO | Illustrative Meals Served, Post-AEO | |||
| Difference ($) | Percentage Difference | Difference ($) | Percentage Difference | |
| 0.44 | 23 | 0.37 | 19 | |
| 0.03 | 1 | 0.03 | 1 | |
| 0.31 | 16 | 0.25 | 13 | |
| 0.11 | 6 | 0.08 | 4 | |
| 0.26 | 13 | 0.22 | 11 | |
| 0.15 | 8 | 0.12 | 6 | |
| 0.35 | 17 | 0.28 | 14 | |
| 0.02 | 1 | 0.03 | 2 | |
| 0.04 | 2 | 0.02 | 1 | |
| 0.41 | 20 | 0.30 | 15 | |
| 0.31 | 15 | 0.24 | 11 | |
| 0.11 | 5 | 0.09 | 4 | |
| 0.27 | 13 | 0.24 | 11 | |
| 0.06 | 3 | 0.04 | 2 | |
| 0.18 | 8 | 0.14 | 6 | |
| 0.20 | 9 | 0.17 | 8 | |
| 0.12 | 5 | 0.10 | 4 | |
| 0.02 | 1 | 0.02 | 1 | |
| 0.14 | 6 | 0.11 | 5 | |
| 0.01 | 1 | 0.01 | 1 | |
| 0.13 | 6 | 0.09 | 4 | |
| 0.15 | 7 | 0.12 | 5 | |
| 0.07 | 3 | 0.06 | 2 | |
| 0.05 | 2 | 0.04 | 1 | |
| 0.07 | 3 | 0.06 | 3 | |
| 0.00 | 0 | 0.01 | 0 | |
| 0.04 | 2 | 0.03 | 1 | |
| 0.02 | 1 | 0.01 | 0 | |
| 0.01 | 0 | 0.01 | 0 | |
| 0.03 | 1 | 0.02 | 1 | |
Conclusion 4-4: To develop accurate claiming percentages for use in implementing the AEO, it will be necessary to estimate not only the distribution of eligible students across the free, reduced-price, and full-price categories but also their expected participation rates with all meals being served free of charge.
As documented in this chapter, the panel’s analyses demonstrate that the ACS eligibility estimates, on average, are substantially and systematically different from administrative estimates for high and very high FRPL districts. For all but the smallest districts, however, reimbursements based on ACS estimates might be equally stable over time and often more so than reimbursements based on administrative estimates, and this feature of the AEO might be attractive to districts along with its other benefits. Although a one-size-fits-all approach for benchmarking ACS estimates to administrative estimates is not feasible at present, a tailored approach to using ACS estimates could possibly allow more districts to offer free meals to all students under the AEO. In the next chapter, we propose an approach that FNS might consider for implementing the AEO and that some districts might find attractive if they wished to adopt the AEO in all or some of their schools.


