
3
Evidence of Geographic Variation in Access,
Quality, and Workforce Distribution
In its Phase I report, the Committee on Geographic Adjustment in Medicare Payment (the committee) made several recommendations about changing payment policy to improve the accuracy of the geographic adjustment factors that are used to adjust payments to providers. During Phase II, in keeping with the statement of task, the committee focused on the potential effects of the proposed payment changes on Medicare beneficiaries’ access to high-quality health care in designated shortage areas as a way to reflect defined geographic areas whose residents may be particularly likely to have problems accessing care.
This chapter describes the evidence of geographic differences in access to and quality of care provided to Medicare beneficiaries. It presents an original analysis of data from the Consumer Assessments of Healthcare Providers and Systems (CAHPS) survey suggesting that the effects of geographic adjustment are not associated with consumer-reported performance relating to access and timeliness of care or quality of care in different geographic areas. The chapter then describes the geographic distribution of the workforce that provides health care services to beneficiaries, including physicians, nurse practitioners, and physician assistants. It next discusses some new opportunities to improve access through telehealth and changes in scope of practice, which help to increase productivity and make better use of health professionals who are already part of the workforce. The chapter concludes with the committee’s findings about what the evidence shows about access and quality of care.
In reviewing the evidence of geographic differences in access and quality of care for Medicare beneficiaries, the committee adopted accepted definitions of access and quality as defined by previous Institute of Medicine (IOM) committees (see Box 1-1). The committee recognized that access and quality are closely related concepts, and that the early quality measurement efforts relied on the Donabedian (1966) framework of structure (e.g., organizational factors, practice setting, staffing), process (the delivery of care), and outcomes (e.g., changes in health status) (see Table 3-1 for relevant measures from a Donabedian framework). Quality measurement efforts have now evolved into a highly differentiated set of more than 450 performance
TABLE 3-1 Sample Measures Included in the Evidence Review
| Structure | Process | Outcome | |
| Access | |||
| Supply and distribution |
• No. of practitioners per 10,000 population |
• Waiting time to get an appointment with a new practitioner |
• Population health |
| Geographic |
• Travel time to nearest practitioner • Availability of transportation |
||
| Afford ability |
• Copayment • Cost of transportation • Cost of time off from work |
• Seek care on timely basis |
|
| Quality | |||
| Access |
• Have a usual source of care |
• Waiting time in office before appointment |
|
| Organizational |
• Nurse-to-patient ratio in hospital |
||
| Leadership |
• Presence of infection control program • Adherence to clinical guidelines |
||
| Infrastructure |
• Meaningful use of electronic health record • Videoconferencing |
• Clinical decision support |
|
| Clinical |
• Percent of infections • Percent of post-MI patients who leave with prescription for beta blocker |
• Hospital readmission • Survival 1 year post-MI |
|
| Patient experience |
• Get care when needed |
• Rating of care • Rating of practitioner • Rating of health status |
|
NOTE: MI = myocardial infarction.
SOURCE: Developed by the committee for this report.
measures that are available to the public in a clearinghouse whose clinical quality measures include process, access, outcome, structure, and patient experience (AHRQ, 2012a).
Because of the vast number of studies that have addressed these topics over the years, the committee did a targeted search for recent studies that specifically compared access and/or quality of care for beneficiaries in different geographic areas, including regions of the country, metropolitan and nonmetropolitan areas, and local health systems. Those studies are summarized in the next section.
GEOGRAPHIC VARIATION IN ACCESS TO HEALTH CARE
In the committee’s view, a well-functioning health care system has a foundation of primary care and includes the full continuum of care, from primary to secondary and tertiary care.
Primary care is defined by a 1996 IOM study committee as “the provision of integrated, accessible health care services by clinicians who are accountable for addressing a large majority of personal health care needs, developing a sustained partnership with patients, and practicing in the context of family and community” (IOM, 1996a, p. 1).
This definition describes primary care as neither a discipline nor a specialty. It cannot be understood as a list of problems, tasks, or services or by the credentials of the person providing the services. This function provides and integrates services for most health care problems, in the context in which the user of health care services lives (Green, 2004), and the health outcomes of many people can benefit from primary care management. Respondents from the 2000–2005 Medical Expenditures Panel Survey linked to the National Death Index through 2006 showed a reduction in mortality among those who reported more of three core attributes (comprehensiveness, patient-centeredness, and enhanced access) of primary care at their source of care (Jerant et al., 2012). Racial/ethnic minorities, poorer and less-educated persons, individuals without private insurance, healthier persons, and residents of regions other than the Northeast were reported to have less access to primary care attributes than others (Jerant et al., 2012).
The following sections review what is known about access to primary and specialty care and the quality of care, with an emphasis on underserved areas and racial and ethnic minorities.
Access to Health Care
Generally speaking, the majority of Medicare beneficiaries have good access to care (MedPAC, 2011), when access is defined as services that are readily available and that yield the most favorable outcomes possible (AHRQ, 2010a; IOM, 2010). Market-specific data are limited, but the 2007 National Ambulatory Medical Care Survey found that just over 90 percent of primary care physicians and 94 percent of specialists with at least 10 percent of their practice revenue coming from Medicare were accepting new Medicare patients1 (MedPAC, 2009). The 2011 National Health Interview Survey found that more than 95 percent of Americans aged 65 and older said they had a usual place to go for medical care, which is one of the most frequently used measures of access to care (CDC and NCHS, 2011).
While these findings are generally encouraging, they indicate that significant numbers of beneficiaries still report barriers to accessing care in their own local geographic areas as measured by unwanted delays in getting appointments or in finding a new primary care physician or specialist. A 2003 Medicare Payment Advisory Commission (MedPAC) survey of beneficiaries targeted 11 sites with a history of access problems. Although the survey was not nationally representative, and thus may have been biased, it found that it was harder for beneficiaries to get an appointment with a physician if they were transitioning into Medicare or new to a geographic area, in poor or fair health, had functional limitations, low incomes, and were without supplemental insurance (Lake et al., 2004). The fall 2011 MedPAC beneficiary survey found that 74 percent of beneficiaries age 65 and older who needed an appointment for routine care and 83 percent of those who needed an appointment with a specialist for illness or injury never had
______________
1 The National Ambulatory Medical Care Survey contacts randomly selected nonfederally employed physicians from 15 specialty groups who are involved in direct office-based patient care to ask about ambulatory care. It excludes radiologists, pathologists, and anesthesiologists. Primary care includes general/family practice and internal medicine, and specialties included obstetrics/gynecology, cardiology, ophthalmology, general surgery, orthopedic surgery, psychiatry, and others (NCHS Data Brief No. 41, August 2010).
to wait longer than they wanted (MedPAC, 2012a,b). Only a small proportion of those surveyed were looking for a new physician (6 percent for primary care and 14 percent for a new specialist).
Among the 6 percent of Medicare beneficiaries age 65 and older seeking a new primary care physician, the share of beneficiaries who reported “a big problem” almost doubled in 2011 compared to the 2 previous years (23 percent in 2011 compared to 12 percent in 2010 and 2009); this represented about 1.2 and 0.08 percent of these beneficiaries, respectively (MedPAC 2012b). In comparison, among the 14 percent of beneficiaries age 65 and older seeking a new specialist, the share of beneficiaries who had a “big problem” finding a new specialist was about 7 percent in 2011, compared to 5 percent in the 2 previous years, which represented 1.0 and 0.7 percent of these beneficiaries, respectively.
Out-of-pocket costs can contribute to access problems for beneficiaries. Most Medicare beneficiaries have premium-free coverage for inpatient care in hospitals, skilled nursing facilities, hospice, and home care under Part A, which requires deductibles and copayments for the services used. Beneficiaries who also wish coverage for Part B services, which include physician, laboratory, and home health services, pay an income-related premium for coverage, and deductibles and copayments for services (CMS, 2012b). In 2008, 90 percent of beneficiaries reported having supplemental coverage through employer-sponsored plans, Medicare Advantage2 (Part C), Medigap3 policies, and Medicaid (KFF, 2010a). Beneficiaries who reported annual incomes between $10,000 and $20,000, being in poor health, and being nonelderly disabled people are more likely to lack supplemental coverage (KFF, 2010a). However, beneficiaries with only Medicare coverage are just slightly (3.4 percent) less likely to have a consistent source of care than those who have additional private insurance, according to 2008 data from the National Health Interview Survey (CDC and NCHS, 2011).
In sum, the majority of beneficiaries have a usual source of care and are able to see practitioners when they choose. As the next sections show, where access problems exist, they are generally due to shortages of health professionals in a geographic area or region; specific shortages of local providers who accept Medicare, which may be temporary or persistent; or individual characteristics of beneficiaries, such as the inability to make copayments, lack of transportation, cultural health beliefs, personal preferences, or being members of racial and ethnic minorities.
Geographic Differences in Access
Supply of Health Professionals
An adequate supply of health professionals, a clinically appropriate mix of practitioners, and balanced geographic distribution of these practitioners are necessary to deliver health care to Medicare beneficiaries. The committee reviewed available evidence and had multiple discussions about the degree to which shortages of practitioners in certain geographic areas are due to shortages in the total numbers of clinicians, or whether location decisions are more influenced by factors such as population density that is sufficient to support a medical practice, the prac-
______________
2 Medicare Advantage is health maintenance organization (HMO) or preferred provider organization (PPO)-style health care; includes Parts A and B; and may include extra coverage for vision, hearing, dental, and/or health and wellness programs (Medicare.gov/navigation/medicare-basics/medicare-benefits/part-c.aspx). Premiums and out-of-pocket costs may vary.
3 Medigap policies help pay some of the “gaps” in original Medicare coverage, including copayments and deductibles (CMS, 2012c; Choosing a Medigap Policy, www.medicare.gov/publications/pubs/pdf/02110.pdf).
titioners’ preferences about quality of life, and experience training in a medically underserved metropolitan or nonmetropolitan area. Chapter 4 reviews literature on location decisions and includes a review of the programs and strategies that have been used to recruit practitioners to shortage areas.
Medicare is the largest single source of health coverage in the United States, but because it is part of a multipayer system, local market factors such as prevailing payment rates, supply of practitioners, and percentage of uninsured in the local population may play a significant role in beneficiary access at the local level. In other words, if a local area has a large number of medically underserved individuals, Medicare beneficiaries are also likely to have more problems accessing care.
Health Professional Shortage Areas (HPSAs)
The committee used Health Professional Shortage Area (HPSA) designations to identify underserved areas for its payment simulations, as reported in Chapter 2. An HPSA is an administrative designation by the Health Resources and Services Administration (HRSA) that identifies areas with a low or insufficient primary care workforce (see Box 3-1) (HRSA, 2012). HPSA designations guide the payment policies behind bonus payments for primary care and general surgery and the workforce policies that determine the placements of participants in the National Health Service Corps and other loan repayment programs described in Chapter 4.
As of February 29, 2012, nearly 60 million Americans—approximately 1 out of every 5—live in one of 5,816 designated primary care HPSAs (HRSA, 2012). Although the exact number of HPSAs fluctuates, approximately two-thirds of the primary care HPSAs are in nonmetropolitan areas, and one-third are in metropolitan areas (see Figures 3-1 and 3-2).
As reported in Chapter 2, the committee’s recommendations have little effects on the payments to hospitals in HPSAs and a downward effect of 3 percent or less on the payments to practitioners.
Access in Metropolitan and Nonmetropolitan Areas
Broadly speaking, Medicare beneficiaries in nonmetropolitan and metropolitan areas have similar levels of access to fee-for-service care (AHRQ, 2010b; MedPAC, 2011). Compared to beneficiaries in metropolitan areas, those in nonmetropolitan areas often travel long distances to see practitioners because they tend to live further away from a health care facility (Arcury et al., 2005). However, beneficiaries in metropolitan areas who rely on public transportation may also need to spend a significant amount of time traveling to appointments even when the geographic distances are comparatively shorter. For low-income beneficiaries, particularly those who also have disabilities or mobility challenges, the burden associated with travel may present ongoing challenges for achieving and maintaining access to care. The impact of travel time on access to care, and how many beneficiaries will miss appointments or forego care because of these challenges, is not well studied and needs further attention (Chan et al., 2006).
Metropolitan areas with greater population density are more likely to have racially, ethnically, and economically diverse populations and neighborhoods (Commonwealth Fund, 2012). Thus, metropolitan beneficiaries are disproportionately more likely to be members of racial and ethnic minorities (Balfour and Kaplan, 2002; Fitzpatrick et al., 2004). Compared with residents of large city suburbs, residents of large inner cities had worse access for about 35 percent of
BOX 3-1
Health Professional Shortage Areas (HPSAs): History and Methodology
HPSAs (originally referred to as the Health Manpower Shortage Area) were developed in the 1970s to identify geographic areas eligible to hire physicians under the National Health Service Corps program. Legislation in 1976 allowed special populations and facilities to be designated as HPSAs in addition to geographic areas.
HRSA develops the shortage designation criteria, which may apply to shortages of primary medical care, dental, or mental health providers. By statute, HPSAs are determined by identifying areas where the delivery of primary care would be “rational, have a shortage of primary care professionals, and where primary care professionals surrounding these areas are overutilized, excessively distant, or inaccessible to the population of the area under consideration. A shortage is when an area has either
• a population-to-physician ratio greater than 3,500 people per 1 full-time physician*; or
• a population-to-physician ratio fewer than 3,000 people per 1 physician* and there is
° an unusually high need for primary care services, or
° an insufficient capacity of existing primary care providers.”
The HPSA designation has not been substantially changed since its inception. HRSA presented two proposed rule changes that would modify the process, but they were withdrawn after substantial public input. The Affordable Care Act charged a Negotiated Rulemaking Committee with developing a revision, but a consensus for change could not be reached. The Secretary of the Department of Health and Human Services may, however, take the committee’s recommendations and issue a proposed rule.
Because an agency or organization must apply for HPSA status, many areas with primary care shortages are not designated as HPSAs. A public or private nonprofit organization must first apply to HRSA in order for a county or group of counties to be considered a HPSA. Therefore, many counties with a less than adequate number of primary care professionals may not be designated as a HPSA, if there is insufficient political or administrative power or agreement to do so.
_________________
*When calculating population to physician ratios, physicians—who are practicing within a HPSA because of programs based on HPSA designations—are excluded.
SOURCES: 42 CFR Part 5, Appendix A; also see Shortage Designation: Health Professional Shortage Areas and Medically Underserved Areas/Populations (http://bhpr.hrsa.gov/shortage) (HRSA, 2012).
the 22 measures included in a core set of access measures used by the Department of Health and Human Services (HHS). Residents of micropolitan areas (counties with an urban cluster of 10,000 to 50,000 inhabitants) had worse access for 50 percent of access measures compared with residents of large fringe metropolitan areas (outlying counties in metropolitan areas of more than 1 million inhabitants) (AHRQ, 2010b).
Medicare Participation Rates
Centers for Medicare & Medicaid Services (CMS) data from 2009 show that the national average participation rate for Medicare Part B is 96 percent and varies from a high of 99 percent in Maine, Massachusetts, and Rhode Island to a low of 82 percent in Minnesota (KFF, 2010c).
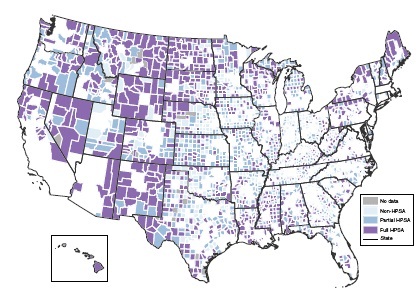
FIGURE 3-1 County designations for nonmetropolitan primary care service shortage areas.
NOTE: HPSA = Health Professional Shortage Area.
SOURCE: ARF, 2009.
An analysis of physician4 responses to the 2008 Health Tracking Physician Survey by the Center for Studying Health System Change reported that 11 percent of metropolitan and 8 percent of nonmetropolitan physicians were not accepting any new Medicare patients (MacKinney et al., 2011). A University of Alaska survey of primary care physicians5 found that almost all physicians in smaller communities were taking new Medicare patients, but that 1 out of 10 primary care physicians had opted out of Medicare, and most of them were in Anchorage, an urban area where private payments are significantly higher (Frazier and Foster, 2009). This lower participation rate in turn creates access problems for beneficiaries who often have a longer wait time before an appointment. Accordingly, MedPAC will continue to monitor the areas in which access disparities have been identified in its previous surveys of beneficiaries.
Access for Racial and Ethnic Minorities
Racial and ethnic minorities consistently face more barriers when trying to access care (AHRQ, 2010b). In its 2011 physician access survey, MedPAC found that members of racial and
______________
4 Responses were from 1,937 physicians from family medicine, general practice, general internal medicine, obstetrics/gynecology, geriatric medicine, and general surgery.
5 A 2008 survey identified all licensed primary care physicians who could see the general population of Medicare patients in Alaska and reached 85 percent of them for interviews (N = 229). Those who were not taking new Medicare patients in 2008 were followed up with another survey in 2009.
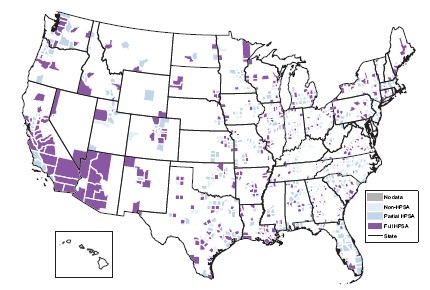
SOURCE: ARF, 2009; HRSA Area Resource File and CMS Hospital Labor Markets.
ethnic minorities experienced more access problems than nonminority beneficiaries whether they had Medicare coverage or were privately insured. The same survey also found that the share of minority beneficiaries who reported problems finding a specialist had increased since its previous survey (MedPAC, 2012a). In the future, MedPAC plans to add survey questions to help improve understanding of the causes of these disparities and to identify possible policy options for improvement.
The MedPAC findings of access disparities for beneficiaries mirror the problems in the larger population, which have been documented since 2003 in a series of reports by the Agency for Healthcare Research and Quality (AHRQ) (2010a,b). Disparities in access to care for Medicare beneficiaries who are members of racial and ethnic minorities cannot be addressed by the Medicare program alone; a coordinated national strategy will be required, and such a strategy is discussed in Chapter 5.
GEOGRAPHIC VARIATION IN QUALITY OF CARE
One of the primary goals of the Medicare program is to ensure that beneficiaries are able to receive medically appropriate, high-quality care when they need it. The quality of care for fee-for-service Medicare beneficiaries has been improving slowly over time for multiple conditions in hospital and outpatient settings (AHRQ, 2010a; Jencks et al., 2003).
HHS measures access to care in terms of the availability of health coverage; availability of
a usual source of care; patient assessments of how easy or difficult it is to gain access to health care; and the successful receipt of services (AHRQ, 2010b). To measure quality, HHS uses a core set of evidence-based quality measures6 to make standardized comparisons of the quality of care for different groups and regions (AHRQ, 2010a,b). Quality measures are typically classified as either process or outcome measures. Process measures may be derived from administrative (e.g., claims), clinical, or survey data that assess performance in the delivery of preventive services, acute care, and chronic disease management (e.g., time in waiting room, availability of medication history at time of the appointment) (AHRQ, 2010a). Outcome measures are often disease specific and include clinical outcomes, such as changes in health status after treatment, as well as patient satisfaction with practitioners and the care experience.
The Relationship of Access and Quality of Care
Access and quality of care are closely related, in that better access to care and higher rates of insurance coverage are closely associated with higher quality of care (Commonwealth Fund, 2012). In geographic areas where more people have health coverage and are better able to access health care, they are also more likely to have a usual source of primary care and to receive higher-quality hospital care, as reflected by receiving more of the recommended care processes and reporting better patient care experiences during hospitalization (Commonwealth Fund, 2012). Areas with very high poverty rates tend to have more people who are uninsured, who go without care because of cost, lack a regular source of primary care, and have worse health outcomes (Commonwealth Fund, 2012).
Disparities in access to and quality of care have not improved over several years of tracking and reporting by HHS. They continue to be a national policy priority (AHRQ, 2010a), as discussed in Chapter 5 of this report. In 2010, an IOM committee assessing the National Health Disparities Report (NHDR) and the National Health Quality Report (NHQR) recommended a harmonization and expansion of both reports (IOM, 2010). The NHDR will include the dimensions of quality covered by the NHQR, and the measurement of quality in both reports will consider care coordination and health systems infrastructure capabilities as “foundational components” that must be in place before any of the objectives in other quality areas can be achieved (IOM, 2010). Chapter 4 includes sections on current efforts for public reporting of performance by hospitals and clinical practitioners.
Geographic Payment Factors and Beneficiary-
Reported Quality in Fee-for-Service Medicare
The committee recognized there is considerable concern, reflected in stakeholder testimony at public sessions,7 that variations in health care quality and access across geographic areas could be influenced by variations in payment rates. In particular, there was concern that lower payment rates in rural and underserved areas could exacerbate quality and access issues in these areas (see Appendix E). Little published research was found that established an empirical foundation for evaluating this concern.
Therefore, the committee conducted an analysis of data collected as part of the 2010 CAHPS survey of Medicare beneficiaries in the traditional Medicare (fee-for-service) sector (see Table 3-2 for a description of CAHPS items used). CAHPS is widely viewed as a good data source
______________
6 The core set of quality measures is available at http://www.ahrq.gov/qual/nhdr10/Core.htm.
for ambulatory (mainly primary) care, and the committee found CAHPS data to be a reasonable choice for the modeling of quality associations with payment factors for physician offices. While a different analysis might have been conducted using hospital quality data and payment factors in a parallel analysis, the committee lacked the resources to do both.
The committee focused on CAHPS measures of access/timeliness of care, experiences with care, and clinical quality (measured by immunizations). The measures were controlled for education, general and mental health status, age, Medicaid dual eligibility, low-income supplement eligibility, and assistance by a proxy in completing the CAHPS questionnaire. The CAHPS measures were supplemented with five clinical measures following specifications of the Health Plan Employer Data and Information System, constructed from a 20 percent sample of fee-for-service Medicare claims from 2009 for breast cancer screening and recommended testing for cardiac patients and diabetics. Rurality was measured by the Rural—Urban Continuum
| Measure | Number of Responses | Overall Rate | Item Text or Description |
| Have personal doctor | 46,505 | 93.1 | A personal doctor is the one you would see if you need a checkup, want advice about a health problem, or get sick or hurt. Do you have a personal doctor? |
| Timely routine care | 37,695 | 62.3 | In the last 6 months, not counting the times you needed care right away, how often did you get an appointment for your health care at a doctor’s office or clinic as soon as you thought you needed? |
| Timely care in illness | 15,349 | 70.7 | In the last 6 months, when you needed care right away, how often did you get care as soon as you thought you needed? |
| Wait<15 minutes | 39,447 | 59.0 | Wait time includes time spent in the waiting room and exam room. In the last 6 months, how often did you see the person you came to see within 15 minutes of your appointment time? |
| Easy specialist appointment | 26,682 | 62.4 | In the last 6 months, how often was it easy to get appointments with specialists? |
| Rating of care overall | 39,417 | 39.0 | Using any number from 0 to 10, where 0 is the worst health care possible and 10 is the best health care possible, what number would you use to rate all your health care in the last 6 months? |
| Rating of doctor | 36,309 | 51.0 | Using any number from 0 to 10, where 0 is the worst personal doctor possible and 10 is the best personal doctor possible, what number would you use to rate your personal doctor? |
| Doctor communication | 36,087 | 59.2 | [Composite of four items] In the last 6 months, how often did your personal doctor explain things in a way that was easy to understand?/ listen carefully to you?/ show respect for what you had to say?/ spend enough time with you? |
| Get needed care | 26,617 | 70.6 | In the last 6 months, how often was it easy to get the care, tests, or treatment you thought you needed through Medicare? |
| Influenza immunization | 46,624 | 68.2 | Have you had a flu shot since September 1, 2009? |
| Pneumovax immunization | 44,054 | 69.1 | Have you ever had a pneumonia shot? This shot is usually given only once or twice in a person’s lifetime and is different from the flu shot. It is also called the pneumococcal vaccine. |
NOTE: CAHPS = Consumer Assessment of Healthcare Providers and Systems.
SOURCE: A. Zaslavsky, developed for this report.
Code (RUCC), while HPSA designations, grouped by county percentages as in the Chapter 2 payment simulations, were used to identify areas with possibly inadequate supply of health care providers. This section summarizes the findings, and details of the analysis are provided in Appendix C of this report.
Do Medicare CAHPS Data Identify Access Issues and Quality Issues Related to Rurality of a County and/or the County’s HPSA Status?
The data do suggest some differences, with metropolitan areas doing better on measures of timeliness of access, on immunizations, and on some of the screening/testing measures, and nonmetropolitan areas scoring higher on communication with doctors and overall satisfaction with physicians. Variations related to HPSA status are weaker, but when significant they are generally consistent with declining quality as the percent of a county designated as a HPSA area increases (with exceptions in the 100 percent HPSA counties).
Are Payment Factors Associated with Beneficiary-Reported Measures of Access to and Quality of Care?
The associations of payment factors with beneficiary reports are statistically significant, especially as reflected in the physician work geographical practice cost index (GPCI). However, these differences do not support concerns from several stakeholders expressed in Phase I testimony that smaller geographic payment adjustments are associated with shortages or lower-quality services. If anything, the results show the opposite to be the case, as higher payment factors are associated with poorer beneficiary-reported quality.
To What Extent Do Variations in Geographic Payments Explain Variations in Access and Quality by Rurality and/or HPSA Status?
No evidence of this was found in this analysis of the CAHPS data. Introducing either the GPCI or the physician practice geographical adjustment factor (GAF) measure as an explanatory variable had almost no effect on estimated access and quality differences along the RUCC or HPSA coverage dimensions.
Would Use of the New Adjustment Factor Methodologies Proposed in the Committee’s First Report Increase or Decrease Payments in Areas with Generally Better or Worse Current Quality of Care, as Reflected in CAHPS Survey Responses?
The evidence on this point is mixed. One reason for this is that, while the switch to Consolidated Metropolitan Statistical Areas instead of whole states (as recommended by the committee) would tend to reduce payments to nonmetropolitan areas, these areas score better on some CAHPS measures and worse on others.
While this analysis of CAHPS data contributes to the sparse existing literature on the relationship between levels of payment and geographic variation in quality, the findings should be viewed only as suggestive, for several reasons. For example, the CMS’s GAF and GPCI are defined for only 89 payment areas, which implies that each area is a state or a large and pos-
sibly heterogeneous portion of a state; the coarseness of the payment factor variables limited the variation required to even cross-sectionally identify their associations with quality outcomes. On the other hand, the very fact that in states (or large substate areas) the current physician services payment factors do not vary between urban and rural (or HPSA and non-HPSA) counties implies that payment factors could not be responsible for observed quality differences along those dimensions within those areas.
While there is much regional variation in quality, this analysis used only two county-level variables (RUCC and HPSA) of particular policy interest to categorize geographic areas. While appropriate techniques were used to model unexplained variation, further research might reveal other variables that would cause a reinterpretation of the effects that were observed here. Furthermore, the criteria used to define HPSAs are complex; while counties were categorized by the percentage of population covered by HPSA designation, there were no available data on the bases for designation typical for each category, much less for individual counties, nor could health system performance be distinguished in the HPSA and non-HPSA areas in the partially designated counties. It is also important to note that HPSAs are by definition areas in which nonmarket interventions (such as bonus payments) are implemented to correct perceived failures of the health professional market. Such adjustments might have changed the relationships between payment and supply of health personnel that would have existed without these interventions. Another possibility is that nonmarket interventions that affect HPSAs may be positively correlated with market factors, given the ability of applicants to select their locations. Nonetheless, some trends in the data were suggestive of unmet needs in areas with moderate to high HPSA coverage.
Finally, most CAHPS measures are subjective by their very nature as patient-reported data. CAHPS contains very few measures of clinical quality, and beneficiary responses to the CAHPS may be affected by regional differences in reporting tendency due to differences in culture or expectations regarding care. In these analyses, case mix was adjusted across areas using models similar to those used in national comparative CAHPS reporting. While CAHPS measures have received some validation relative to more “objective” clinical measures (Schneider et al., 2001), there is no practical alternative measure to patient reports for many health system characteristics. However, patterns for claims-based measures did not contradict the findings from CAHPS measures.
While these are important cautions for drawing conclusions from our analysis of CAHPS data, the most important finding for the purposes of this report relates to relationships that we did not find in the data. Specifically, there was little evidence in the analysis to suggest that revisions in the geographic adjustment factors proposed by the committee would systematically favor either areas now experiencing superior or inferior patient-reported performance relating to access/timeliness of care or quality. This analysis, however, must be viewed as suggestive and not as definitive; other data sets and methods might have yielded different insights (e.g., Fenton et al., 2012).
Variation in Quality Across Geographic Areas
Geographic Regions
Strong regional patterns of performance have been observed. New England and Western and Pacific Northwestern states tend to perform better on most quality measures, although
New England communities have high costs and high rates of potentially avoidable hospital use (AHRQ, 2010a; Commonwealth Fund, 2012). Many communities across the upper Midwest also have consistently strong performance; simultaneously, some integrated delivery systems and multispecialty practices in that region have made chronic care management a core competency, although these integrated models are not exclusive to that region (Commonwealth Fund, 2012). Areas in the south, particularly along the Gulf Coast, tend to perform poorly on many of the core measures. When health system data are aggregated at the state level, many states show substantial variation across local areas (Commonwealth Fund, 2012).
The economic climate in a local area does not seem to consistently predict quality of care. Performance varies as much within low-poverty areas as it does within high-poverty areas (Commonwealth Fund, 2012). However, individuals whose incomes are below the federal poverty level receive worse care than higher-income people for 80 percent of the core measures used in the annual national quality and disparities reports produced by AHRQ (2010a).
Metropolitan and Nonmetropolitan Areas
There is a considerable degree of variation in quality of care within local metropolitan and nonmetropolitan areas, and there is no strong evidence to suggest clear differences in quality of care between metropolitan and nonmetropolitan areas in aggregate (AHRQ, 2010a; Commonwealth Fund, 2012). However, in using more refined rural-urban classifications,8 HHS has found that compared to residents of large city suburbs, residents of central metropolitan areas receive poorer care for 25 percent of the core measures of quality, and residents of micropolitan and noncore areas receive poorer care for 30 percent of the core measures of quality9 (AHRQ, 2010b).
Residents in large inner cities are disproportionately more likely to be racial and ethnic minorities. Using the same core set of quality measures, African Americans received worse care than whites for about 40 percent of the core measures. and Hispanics received worse care than whites for about 60 percent of the core measures (AHRQ, 2010b).
An analysis of national data for more than 3.1 million hospitalized Medicare fee-for-service recipients who were discharged between 2006 and 2008 found that African American patients were more likely to be readmitted for three common conditions (acute myocardial infarction, congestive heart failure, and pneumonia). The gap was related both to race and to the site where care was received, either minority-serving10 or non-minority-serving hospital (Joynt et al., 2011).
Summary
It is apparent that there are geographic pockets with persistent access and quality problems and that many of those problems are more likely to be experienced by beneficiaries who are members of racial and ethnic minorities. The committee’s analysis of CAHPS data yielded little evidence that Medicare payment policy drives differences in quality of care received by beneficiaries; however, the analysis did suggest that metropolitan areas tended to do better on
______________
8 The NHQR and NHDR both use four classifications of metropolitan (large central, large fringe, medium, and small) and two categories of nonmetropolitan (micropolitan and noncore) for comparison purposes.
9 See National Healthcare Quality Report, 2009, for a list of core quality 365 measures (http://www.ahrq.gov/qual/nhdr09/Core.htm).
10 The researchers determined the proportion of each hospital’s Medicare patients who were African American and classified those in the highest decile of proportion of African American patients as minority-serving institutions.
measures of timeliness of access to care, while nonmetropolitan areas scored higher on communication with physicians and overall satisfaction with physicians. The CAHPS findings also suggested that consumer-reported quality declines as the percentage of a county designated as a HPSA area increases.
As will be discussed in Chapter 4, health professionals may choose to set up practice in more affluent areas of the metropolitan and suburban areas rather than where the majority of underserved populations live and work. Because the committee’s approach to geographic adjustment in Medicare fee-for-service payment is based on labor markets that are much larger than neighborhoods, the committee concluded that geographic adjustment cannot be targeted to address access and quality issues at the local level. In other words, adjustments for underserved and shortage areas are important but should be addressed by another policy mechanism that is targeted to areas of particular need, and not by the process of geographic adjustment to payments.
WORKFORCE DISTRIBUTION AND SUPPLY
A total of 60 million Americans, or about 1 in 5, live in geographic areas that are designated as primary care shortage areas (HRSA, 2012). Improving this situation will be difficult with an anticipated overall shortage of physicians being predicted for the coming decades (Baker Institute, 2012; Kirch et al., 2011). According to the Bureau of Labor Statistics (BLS), between 2008 and 2018 the health care sector is projected to grow by nearly 23 percent, with more than 3 million new jobs being created (Bipartisan Policy Center, 2011; see Figure 3-3). However, only a small proportion of these jobs are clinical and will be distributed in shortage areas. For example, the greatest concentration of the primary care workforce is currently in metropolitan areas, while the majority of HPSAs—about 65 percent—are located in rural areas (HRSA, 2012).
The traditional view of delivering efficient and high-quality care calls for distributing the growing workforce to underserved areas (CRS, 2010). To this end, many rural and urban primary care training programs and broader workforce policies have used a variety of strategies to increase the supply of rural health professionals, including scholarships, loan repayment incentives, specialized training, and targeted recruiting (HRSA, 2012; Ricketts and Randolph, 2007).
Although less published information is available about recruiting practitioners for the 34 percent of HPSAs in metropolitan underserved areas, there are some indications that the best predictors of an individual choosing to practice in these urban areas are being a member of an ethnic minority, having a National Health Service Corps obligation to repay, and having had training in urban areas (HRSA, 2012; Rabinowitz et al., 2000). These factors will be discussed in greater detail in Chapter 4.
Most policy makers and practitioners agree that delivering efficient, quality health care to beneficiaries not only depends on an adequate supply of clinicians and administrative and technical support personnel but also on developing an appropriate mix and the proper distribution of personnel (Berwick et al., 2008; CRS, 2011). Although the general public may think about the health care workforce as comprised of physicians and nurses, it encompasses a much broader range of health professions. According to MedPAC (2011), half of the health professionals in Medicare’s clinical registry are physicians, and the other half include nurse practitioners (NPs), physician assistants (PAs), pharmacists, podiatrists, chiropractors, physical therapists, psychologists, and many other categories of professionals who are licensed and regulated by states and who can bill Medicare independently or as part of a medical practice (MedPAC, 2011).
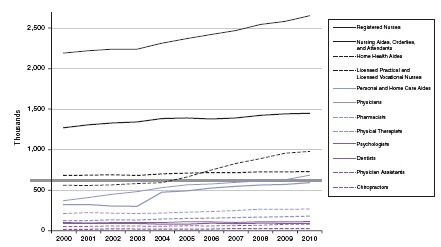
FIGURE 3-3 National occupational employment estimates, 2000–2010, for selected professions.
NOTES: Dental categories were changed in 2004 to incorporate two categories: “dentist, general” and “dentist, all other specialties.” “Physicians” work in one or more of several specialties, including, but not limited to, anesthesiology, family and general medicine, general internal medicine, general pediatrics, obstetrics and gynecology, psychiatry, and surgery (Bureau of Labor Statistics, http://www.bls.gov/oco/ocos074.htm). In 2004, the category “Physicians and surgeons, all other” was added (Bureau of Labor Statistics, Standard Occupational Classification Category 29-1060. Subcategory 29-1069 covers all physicians and surgeons not separately listed http://www.bls.gov/soc/2000/soc_j0a0.htm). “Psychologists” include clinical, counseling, and school psychologists. In 2004, the category “Psychologists, all others” was added. “Registered Nurses” includes advanced practice registered nurses.
SOURCE: Bipartisan Policy Center, 2011. Occupational Employment Statistics, Bureau of Labor Statistics; in thousands. Produced by Deloitte Center for Health Solutions, ©2012 Deloitte Development LLC.
An emerging view of the workforce asks whether the appropriate response to shortages is to continue to try to move clinicians into those shortage areas, or whether access is sufficient if beneficiaries travel to see clinicians in surrounding areas. Another view, discussed later in this chapter, would promote access to clinicians via telehealth, using communications technology in addition to face-to-face clinical encounters.
Data and Data Sources on the Health Care Workforce
The extent to which policy makers can assess the current supply and distribution of the health care workers is limited by the lack of current data and by conflicting data from different sources. Most studies determining the number and geographic distribution of the health care workforce focus on a few key professions—physicians, nurses, dentists, mental health professionals, and a few other health professionals—but not the entire health care workforce (Baker Institute, 2012; Bipartisan Policy Center, 2011). Although studies on these selected professions have published information and projections about the supply of various types of providers, most
have been conducted by professional associations and interest groups that base their projections on assumptions and perspectives that apply primarily to their discipline. Specific data tend to be collected by profession, such as the American Medical Association (AMA) Master File (for physicians), the HRSA National Sample of Registered Nurses, and the American Academy of Physician Assistants (AAPA) Physician Assistant Masterfile. While these are valuable sources for those professions, the differences in methods and timeliness of data collection make it difficult to make cross-professional comparisons by linking datasets.
Estimating the size of the current primary care workforce is fraught with data problems. The BLS Occupational Employment Statistics (OES) data provide a single source of comparable data across states for certain key professions, including nurses and employed physicians (self-employed physicians are not included). However, there is no consensus over the exact number of practicing physicians and no single national registry or inventory that provides a current accurate count of totals or even local supply (The Lewin Group, 2010). Estimates of the total physician workforce range from 850,085 (Young et al., 2010) to 972,376 (Smart, 2011). The differences depend on mode of data collection as well as definitions of active status (i.e., part-time practice). Estimates regarding the total primary care workforce also vary, ranging from a total of approximately 295,00011 (AHRQ, 2012b) to 378,000 (Kaiser Commission on Medicaid and the Uninsured, 2011). In these estimates, physicians make up approximately 75 percent of the total, NPs represent about 20 percent, and PAs make up the rest (see Figure 3-4) (AHRQ, 2011b,c).
Regardless of the source of data used, the supply and distribution of primary care providers and specialists have been found to vary from region to region, and between metropolitan and nonmetropolitan areas (Bodenheimer and Pham, 2010; Rosenthal et al., 2005). The extent to which patients travel across geographic boundaries to see clinicians is not well documented.
A recent microsimulation study projected the need for an additional 8,000 nurse practitioners and 2,400 physician assistants in primary care, particularly in areas with low physician supply (Baker Institute, 2012; Dall, 2010). Across medical specialties, shortages of 85,000 to 200,000 have been forecast by 2020 by different groups (Cooper et al., 2002; Council on Graduate Medical Education, 2005; Dill and Salsberg, 2008).
In general, residents of metropolitan areas have better geographic access to physicians, but information on access to different specialists is limited. Nearly all medical specialties are growing, but a cross-sectional study using alternative measures of geographic access to physicians in 23 states found that smaller-sized specialties, such as pathologists, urologists, ophthalmologists, and otolaryngologists are more unevenly distributed than larger specialties, such as cardiology (Rosenthal et al., 2005). The study also found that distance to the nearest physician is an important criterion for analysis, given that patients will cross county lines or travel to metropolitan areas to seek care (Rosenthal et al., 2005). An additional discussion of patient travel is found in Chapter 4.
The ratio of practitioners to the population is often used as an indicator of practitioner supply to standardize comparisons across regions. These ratios, however, are usually simply calculated based on person counts, not full-time equivalents (FTEs) or services able to be provided. The emphasis in workforce policy has traditionally been on alleviating shortages to improve access to care, and supply is generally thought to be associated with the amount of care provided, whether or not the care is necessary and appropriate. Overuse of services, meaning the provision of services that are not medically necessary, is also considered to be a quality problem (AHRQ,
______________
11 Based on an estimated 209,000 physicians, 56,000 NPs, and 30,000 PAs.
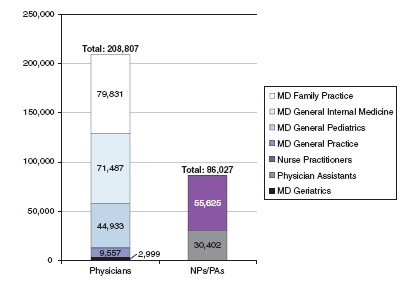
FIGURE 3-4 Number of primary care professionals.
SOURCE: AHRQ, 2011b,c.
2010a). However, the relative supply of practitioners is not directly related to either access to care or to the quality of care provided (Goodman and Grumbach, 2008).
Geographic Distribution of Physicians
Primary Care Physicians
The distribution of primary care physicians has been identified as a policy problem for many years, and a previous IOM report specifically identified primary care shortages in rural areas and inner cities (IOM, 1996a). That study recommended that state and federal agencies monitor the supply of and requirements for primary care physicians as well as primary care NPs and PAs. It also called for studies of integrated health care systems to include underserved rural and inner- city areas, and attract physicians, NPs, and PAs through “financial incentives, relationships, and telecommunications capabilities” (IOM, 1996a).
After that report was published, the overall percentage of physicians choosing to practice general medicine increased by only 2 percent in approximately 10 years (Auerbach et al., 2011; Morgan and Hooker, 2010). From 1995 to 2005, the number of primary care physicians per capita increased 12 percent compared with a 5 percent increase for specialty care physicians per capita (GAO, 2008). In 2005, there were 90 primary care physicians per 100,000 people and 189 specialty care physicians per 100,000 people (GAO, 2008). Between 2004 and 2009, almost half (45.4 percent) of all counties experienced an increase in their population without a relative increase in the primary care ratio. Forty-one counties lost all primary care physicians,
and a total of 130 counties (4.2 percent) had no primary care physicians in either year (see Figure 3-5).
Census and AMA data showed there were roughly twice as many physicians per 100,000 people in urban areas than in rural areas in 2005—209.6 compared with 113 (Fordyce et al., 2007). While nearly 1 out of 5 Americans resides in a rural area, fewer than 1 in 10 physicians practice in rural areas (0). As of 2010, about 13 percent of primary care physicians practiced in rural areas (see Figure 3-6) (AHRQ, 2011d). The distribution of rural physicians is also uneven, with practitioner to population ratios varying from 58.5 per 100,000 in small areas to as few as 35.7 per 100,000 in isolated rural areas (Fordyce et al., 2007).
It is estimated that the growth rate of physicians will be slower than most other health care professions (Auerbach et al., 2011) (see Figure 3-3). Between 2004 and 2009, 1,559 counties (50.2 percent) saw their population-to-physician ratio decrease. This included 31 counties that had no physicians in 2004 and had at least one in 2009. Ninety-four counties (3.0 percent) had no physicians in either year (see Figure 3-5). Figure 3-6 shows the distribution of primary
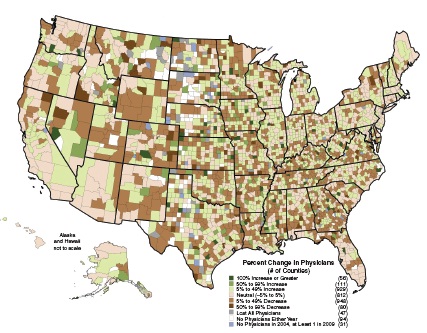
FIGURE 3-5 Change in physicians per 100,000 population, 2004–2009.
NOTE: Data include nonfederal, nonresident, clinically active physicians less than 70 years old.
SOURCE: Produced by American College of Surgeons Health Policy Research Institute, Cecil G. Sheps Center for Health Services Research, University of North Carolina at Chapel Hill, using data from AMA Physician Masterfile, 2004 and 2009.
SOURCE: AHRQ, 2011d.
care physicians among urban and nonurban areas, and Figure 3-7 shows the national changes in the distribution of primary care physicians from 2004 to 2009.
General Surgeons
Although the total number of general surgeons has only slightly declined, the general surgeon-to-population ratio has dropped in both rural and urban areas. Between 1981 and 2005 there was less than a 5 percent decrease in the total number of general surgeons, while the number of general surgeons per 100,000 people decreased by more than 25 percent. Although the urban areas have experienced the greatest drop in general surgeon-to-population ratio, rural areas still have significantly fewer general surgeons per 100,000 people (see Figure 3-8) (Christian Lynge et al., 2008).
There is no agreement about whether there is an overall shortage of general surgeons, a maldistribution, or both (Neuwahl et al., 2011). The declining general surgeon-to-population ratios may be an indication that more surgeons are specializing. However, there have been reports that practice patterns are different in metropolitan and nonmetropolitan areas, and that nonmetropolitan surgeons have a broader scope of practice. For example, the American Board of Surgery reported that nonmetropolitan surgeons do more procedures in a year and have a greater variety of cases than their metropolitan counterparts (Ritchie et al., 1999). However, a more recent study found rural surgeons have a more focused practice (King et al., 2009), suggesting that practice patterns may be changing. A national survey of surgeons found that metropolitan surgeons reported significantly greater volume for general, laparoscopic, and vascular surgery, and nonmetropolitan surgeons reported higher volumes for endoscopy, gynecology, obstetrics, and urology (Heneghan et al., 2005). General surgeons in nonmetropolitan areas also provide trauma and critical care and may be viewed as the economic driver for small nonmetropolitan hospitals, which also serve as key employers in those areas (Dickson, 2011; Hart et al., 1994; Heneghan et al., 2005).
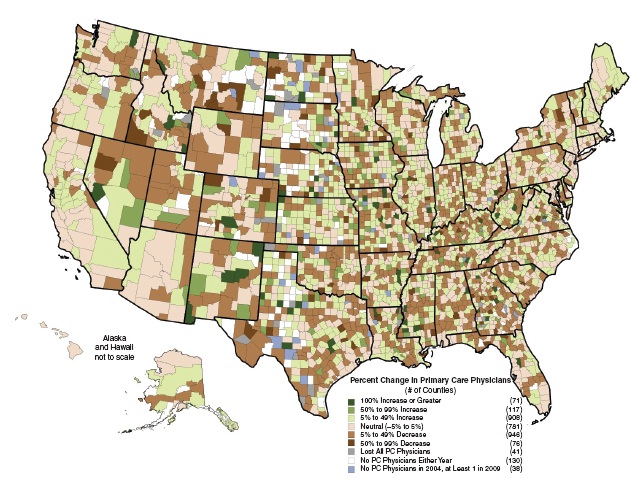
FIGURE 3-7 Change in primary care physicians per 100,000 population, 2004–2009.
NOTE: Data include nonfederal, nonresident, clinically active physicians less than 70 years old reporting a primary specialty classified by the American College of Surgeons Health Policy Research Institute as “primary care.” PC = primary care.
SOURCE: Produced by American College of Surgeons Health Policy Research Institute, Cecil G. Sheps Center for Health Services Research, University of North Carolina at Chapel Hill, using data from AMA Physician Masterfile, 2004 and 2009.
Geographic Distribution of Registered Nurses and Nurse Practitioners
Registered Nurses
Registered nurses (RNs) are the largest occupational group in health care, and 2.7 million RNs were employed in the United States in 2010 (BLS, 2012a). The states with the lowest population ratio of nurses are generally located in the south central, mountain state, southwest, and northwest regions of the United States, with higher ratios in the north central and northeast (see Figure 3-9). Between 2002 and 2009, the number of FTE RNs ages 23-26 increased by 62 percent (Auerbach et al., 2011), which indicates that younger health professionals may be entering the workforce and helping to offset shortages created by the numbers of nurses who are retiring.
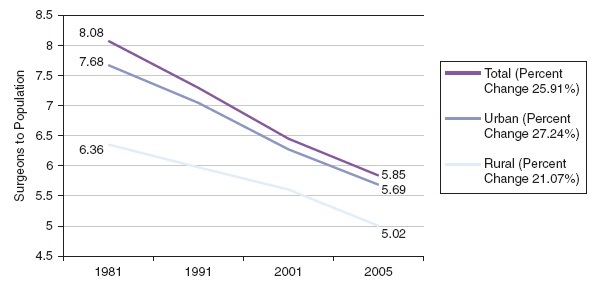
FIGURE 3-8 Change in general surgeons-to-population ratios.
SOURCE: Christian Lynge et al., 2008.
Nurse Practitioners
NPs are registered nurses who have completed graduate-level education and clinical training12 to provide a wide range of preventive and acute health care services, including primary, specialty, and subspecialty care (AANP, 2012; ACNP, 2012). They are licensed in all states and the District of Columbia and practice under the laws and regulations of the state in which they practice, with prescription privileges in 49 states. NPs diagnose and treat many common acute and chronic health problems; provide care management, health education and counseling; and refer to other health professionals as needed (AANP, 2012). They also are part of care teams in outpatient medical specialty practices, where they help to improve access and reduce wait times (UCSF Center for the Health Professions, 2009).
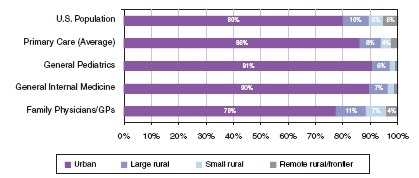
Two recent reports have been published regarding the numbers of NPs practicing in rural and urban areas, both using the National Provider Identifier (NPI)13 file from 2010. One report identified primary care practitioners including physicians, NPs, and PAs (AHRQ, 2012b). Based on NPI numbers, primary care physicians were more likely to practice in rural areas than non-primary care specialists. Within primary care, family physicians and general practitioners were distributed more closely to the U.S. population and were found to be more likely than either general internists or pediatricians to practice in rural areas (Table 3-3). In this same report, NPs and PAs were found to be more likely than physicians to practice in rural areas (16 vs. 9 percent), and primary care NPs and PAs were much more likely to be rural than physicians (28 and 18 percent, respectively) (AHRQ, 2011d, Table 2). This rural distribution of NPs and PAs, although higher than all primary care physicians, was more similar to family physicians (22 percent). NP distribution is very state dependent and highly correlated with state scope-of-practice laws, which will be discussed later in this chapter. NP practice choices also will be discussed below.
______________
12 Most NPs have master’s degrees and many have doctorates.
13 A National Provider Identifier is a unique 10-digit identification number issued to health care providers in the United States as required under the Health Insurance Portability and Accountability Act of 1996 (HIPAA).
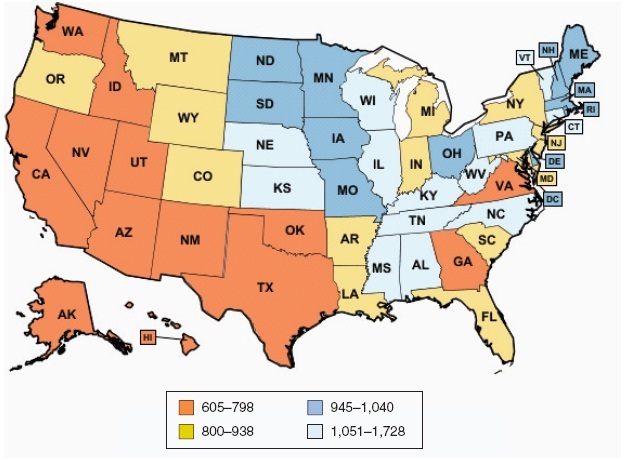
FIGURE 3-9 Registered nurses per 100,000 population, 2011.
NOTES: The number of registered purses per 100,000 population was calculated using the population estimates provided by the U.S. Census Bureau as of July 1, 2011. U.S. total estimate excludes the territories. Estimates for detailed occupations do not sum to the totals due to rounding. Estimates do not include self-employed workers. The Occupational Employment Statistics survey is a semiannual mail survey measuring occupational employment and wage rates for wage and salary workers in nonfarm establishments in the United States. For further details please see http://www.bls.gov/oes/2009/may/methods_statement.pdf. Definitions: registered nurses include advance practice nurses such as nurse practitioners, clinical nurse specialists, certified nurse midwives, and certified registered nurse anesthetists; employment refers to the number of workers who can be classified as full- or part-time employees, including workers on paid vacations or other types of paid leave.
SOURCES: KFF, 2010b. Calculations based on the Bureau of Labor Statistics, State Occupational Employment and Wage Estimates, May 2011, available at http://www.bls.gov/data/#employment; and U.S. Census Bureau 2011 Population Estimates, available at http://www.census.gov/popest/.
The second recent study, conducted by the University of Washington Rural Health Research Center, addresses only NPs and does not differentiate across specialties (primary care versus other specialties) (Skillman et al., 2012). Thus, the number of NPs in the AHRQ report is smaller than in the Skillman et al. report. However, both reports are likely to be undercounts because many NPs do not have NPIs yet. Skillman and colleagues (2012) examined the distribution of advanced practice registered nurses across the United States and examined factors associated with choosing a rural practice location. NP data are based on all 106,113 NPs with NPIs (versus only primary care NPs).
TABLE 3-3 Geographic Distribution of Primary Care Health Care Professionals, 2010
| All | Primary Care | ||||||||
| Geography | NP | PA | Physicians | NP | PA | Family Medicine | General Internal Medicine | General Pediatrics | U.S. Pop. |
| Urban | 84.3% | 84.4% | 91.0% | 72.1% | 75.1% | 77.5% | 89.8% | 77.6% | 80% |
| Large Rural | 8.9% | 8.8% | 6.5% | 11.0% | 11.6% | 11.1% | 6.7% | 9.6% | 10% |
| Small Rural | 3.9% | 3.7% | 1.7% | 7.7% | 6.9% | 7.2% | 2.4% | 7.3% | 5% |
| Isolated | 2.8% | 3.0% | 0.7% | 9.1% | 6.3% | 4.2% | 1.1% | 5.5% | 5% |
| Rural, Frontier | |||||||||
NOTE: NP = nurse practitioner; PA = physician assistant.
SOURCE: AHRQ, 2011d.
HRSA’s 2008 National Sample Survey of RNs reported a total of 158,348 NPs, and the American Academy of Nurse Practitioners reported 140,000 practicing NPs in 2011 (AANP, 2012). In each of the past 2 years there have been about 10,000 NP graduates with about 9,000 of those prepared in primary care (AACN/NONPF 2010 and 2011 graduation and enrollments). Using data from Skillman and colleagues, of the 106,113 NPs, 84.4 percent were practicing in urban areas and 15.2 percent in rural areas. The ratio of NPs to 10,000 population in urban areas was 3.6 and in rural areas 2.8. Two states reported higher ratios in rural areas than urban areas—New Hampshire (7.7) and Alaska (5.2). The range of NPs per state was from 33 (Nevada) to 812 (Mississippi). Of the rural NPs, a majority (57.5 percent) were practicing in large rural areas, about a quarter (26 percent) were in small rural areas, and another 16.4 percent were in isolated small rural areas (see Figures 3-10 and 3-11 for distribution of NPs across urban and rural areas).
Skillman and colleagues (2012) found two factors among those available for study from the NPI data set associated with NPs practicing in rural areas: the degree of practice autonomy in the state (this approached significance, P = .06) and NP gender. Male NPs were more likely to choose rural practices (P < .0001). While the authors call for further studies to better understand the role of state regulation in NP location choice, they suggest that undoing restrictive state regulations be considered as a strategy to encourage rural practice. Another recommendation from the study was to recruit more men into NP programs since they are more likely to practice in rural areas.
Geographical Distribution of Physician Assistants
PAs provide diagnostic, therapeutic, and preventive services as delegated by a physician and often are part of a care team (Hooker and Everett, 2012). In underserved areas where physicians are only available 1-2 days per week, PAs may be the primary clinical practitioners (BLS, 2012b). Approximately 30-40 percent of PAs work in primary care, with higher proportions in primary care in rural areas (Hooker and Everett, 2012).
Over the past 30 years, the number of PAs has been growing, and an estimated 81,000 certified PAs currently practice in the United States, nearly a fourfold increase since 1991 (see Figure 3-12) (Larson and Hart, 2007). PAs are more likely to work in urban areas, but in some
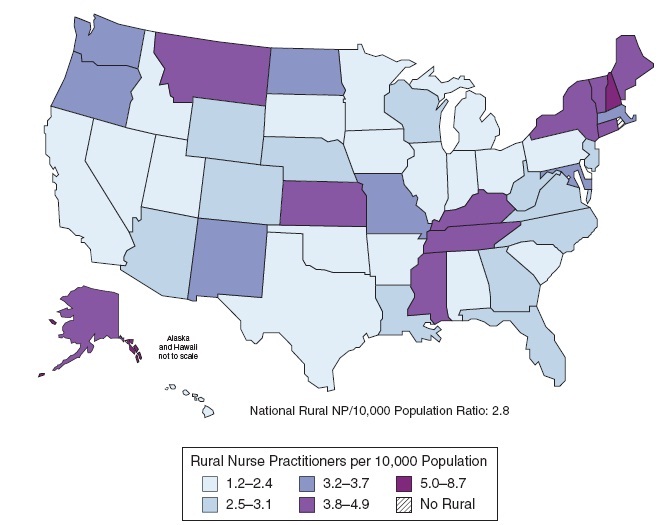
FIGURE 3-10 Rural per capita supply of nurse practitioners by state, 2010.
NOTE: Map date: November 2011. NP = nurse practitioner.
SOURCE: Skillman et al., 2012. Data sources: March 2010 National Plan and Provider Enumeration System data file, 2011 Neilson/Claritas Population Estimates.
nonmetropolitan areas in California and Washington state, the ratio of PAs and NPs to the general population is higher than that of physicians (Grumbach et al., 2003). Still, 20 percent of all counties in the United States (627 counties) have no practicing PAs (see Figure 3-13). Most of those counties are located in nonmetropolitan or small metropolitan areas (Hooker and Everett, 2012; Sutton et al., 2010).
EXPANDING OPPORTUNITIES TO IMPROVE ACCESS
Recent Developments in the Use of Telehealth Services
One very promising and rapidly developing strategy to improve access to care for beneficiaries is to provide practicing clinicians with new resources and technology tools that enable them to reach more patients. Traditionally, telemedicine has been defined as using information and
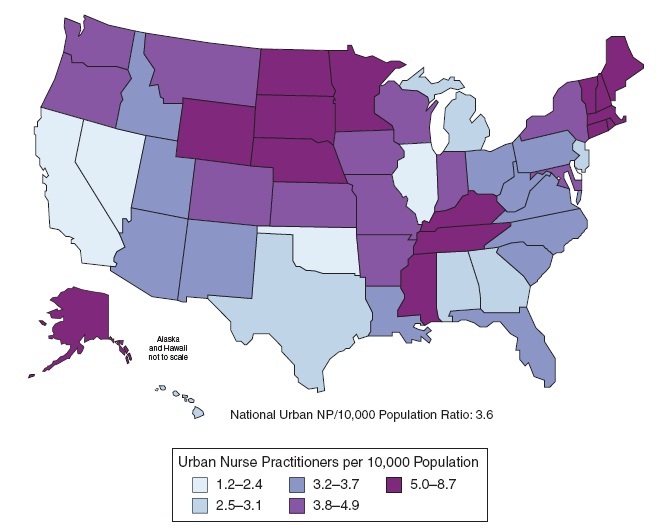
FIGURE 3-11 Urban per capita supply of nurse practitioners by state, 2010.
NOTE: Map date: November 2011. NP = nurse practitioner.
SOURCE: Skillman et al., 2012. Data sources: March 2010 [National Plan and Provider Enumeration System data file, 2011 Neilson/Claritas Population Estimates.
communication technologies to exchange personal health information and provide health care when distance separates the patients and providers (Hersh et al., 2006; IOM, 1996b). Among the more familiar telemedicine applications are specialist referral services and remote consultations, in which videoconferencing or teleconferencing abilities enable primary care physicians and/or community-based medical teams to consult with specialists who are working at other locations. Table 3-4 summarizes the current Medicare payments for telehealth.
Increasingly, the term telehealth is replacing telemedicine terminology with expanded definitions that refer to the use of technology-enabled delivery of services to facilitate the monitoring, diagnosis, treatment, management, care, and education of patients who are at a distance from the providers. Telehealth services are delivered through an increasing number of mechanisms such as videoconferencing, transmission of images, patient portals, consumer health education, remote monitoring of vital signs, and nursing call centers, and it is evolving toward remote provision of rehabilitation.
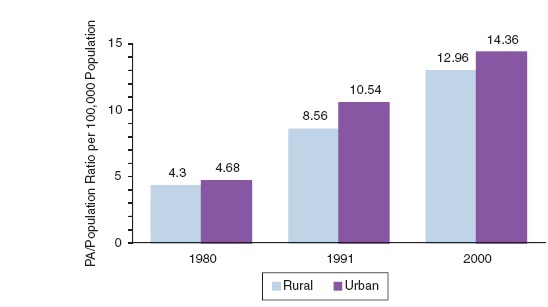
FIGURE 3-12 Growth of PAs per 100,000 population.
NOTE: PA = physician assistant.
SOURCE: Larson and Hart, 2007.
As of October 2011, 13 states support telehealth technology to make payments consistent between health care services delivered in person and via telehealth. The most recent measure, approved in California in 2011, expands opportunities for telehealth with the specific goals of addressing inadequate provider distribution through increased use of telehealth services to help “reduce costs, improve quality, change the conditions of practice, and improve access to health care, particularly in rural and other medically underserved areas.”14 Before the California bill was passed, 12 states had already required all health benefit plans (i.e., except Medicare) to pay for covered services provided through telehealth. Nearly 50 recognized medical subspecialties now use telehealth services, ranging from teleradiology to teledermatology, teleophthalmology, telemental health, and telecardiology (Dixon et al., 2008).
“Store and forward” technologies, also referred to as asynchronous applications, are another prominent and popular type of service. These technologies are used to connect primary care providers and specialists via high-speed, high-definition communications systems without requiring the patient to be physically present. The applications enable specialists in one location to read and interpret images such as X-rays, retinal scans, high-resolution photos of dermatologic lesions and other images, and to report their findings in a timely manner to the health professionals requesting those services for their patients.
More than half of all Medicare beneficiaries have chronic medical conditions such as diabetes, arthritis, and kidney disease for which regular monitoring is becoming part of the standard of care. Patient monitoring, in which electronic devices are used to remotely collect and send real-time clinical data to a monitoring service, is increasingly being used to replace office or clinic visits or to supplement the use of visiting nurses (Hersh et al., 2006; Jones and Brennan, 2002). An increasing body of evidence shows that telemedicine/telehealth care management of beneficiaries with chronic diseases, such as diabetes and congestive heart failure, can help reduce access barriers related to geographic distance, weather, disability, lack of transportation,
_____________
14 California Assembly Bill 415, 2011.
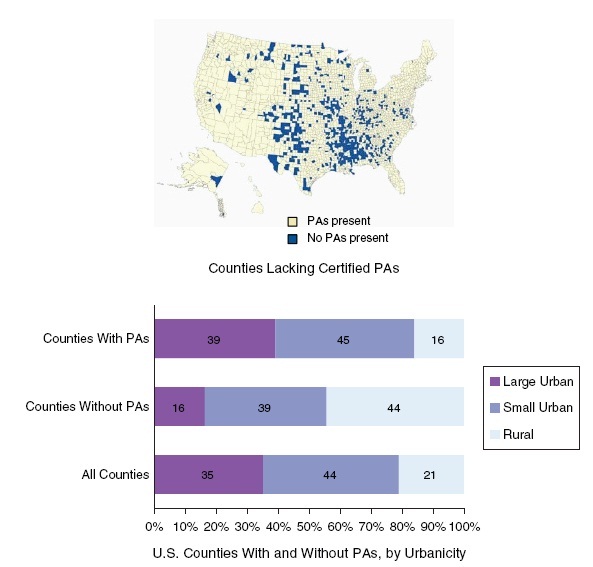
FIGURE 3-13 Counties with no PAs. NOTE: PA = physician assistant.
SOURCE: Sutton et al., 2010.
or shortages of practitioners in rural areas and other medically underserved urban areas (Chan et al., 2006; Chou et al., 2007; Gellis et al., 2012; Palmas et al., 2008; Wootten et al., 2011). Because Medicare beneficiaries are particularly vulnerable to these barriers, expanded use of telemedicine-based care management services offers current opportunities for improving access (Jones and Brennan, 2002; Palmas et al., 2008).
Telehealth screenings offered in urban community settings offer an additional resource for improving access and health outcomes for at-risk individuals. A study of 341 participants at urban soup kitchens in New Jersey showed that high-resolution ophthalmic screenings (for offsite second-opinion image evaluation) provided effective detection of vision-threatening disease for high-risk individuals (Shahid et al., 2012). Positive findings were identified for 105 (31 percent) of individuals, of whom 78 percent were African American, 73 percent male, and 62 percent smokers. These positive screenings resulted in detection of glaucoma (34 percent),
TABLE 3-4 Medicare Payments for Telehealth Services
| Who Does Medicare Reimburse? | Where Can Services Be Furnished? | What Services Does Medicare Pay For? |
|
• Physicians • Nurse practitioners • Physician assistants • Nurse midwives • Clinical nurse specialists • Clinical psychologists • Registered dietitians or nutrition professionals |
• Office of a physician or practitioner • Hospitals • Critical access hospitals (CAHs) • Rural health clinics • Federally Qualified Health Centers • Renal dialysis centers in hospitals or CAHs • Skilled nursing facilities • Community mental health centers |
• Initial inpatient consultations or follow-up inpatient telehealth consultations for beneficiaries in hospitals • Office/outpatient visits, subsequent hospital care services (1 visit every 3 days at most) • Subsequent nursing facility services (1 visit every 30 days at most) • Kidney disease education services • Diabetes self-management training services • Health and behavior assessment and intervention • Individual psychotherapy • Pharmacologic management • Psychiatric diagnostic interview examinations • End-stage renal disease related services • Medical nutrition therapy • Neurobehavioral status examinations |
SOURCE: CMS, 2012a.
cataract (21 percent), diabetic retinopathy (5 percent), and other findings. Community-based services such as these offer a particularly valuable service for low-income, homeless, and other medically underserved groups who, for a variety of reasons, face barriers to access.
Quality and Patient Satisfaction
Clinical differences in quality of care and patient experience are currently a major area of focus for reducing hospitalization readmission rates as a national policy goal. As discussed earlier in this chapter, hospital readmissions were estimated to cost Medicare $17.5 billion in 2004 (Jencks et al., 2009). Poor coordination of care following discharge from the hospital is among the recognized preventable causes of readmission (CRS, 2010).
Posthospitalization home monitoring with health coaching offers a mechanism for reducing readmissions, and in one study it was found to reduce rehospitalization by 72 percent (Weintraub et al., 2005). In a review of several telehealth technologies, the Veterans Health Administration found that they reduced the number of hospital bed days by 25 percent and hospital admissions by 19 percent (Darkins et al., 2008). These and other strategies for reducing readmission rates contribute to improved quality of care and patient satisfaction. Payment for remote telemonitoring services is required in 13 states, with outcomes showing that these services help to reduce readmissions (Duckett, 2011). A New York state study of diabetic patients also found that telemedicine/telehealth case management resulted in significant clinical improvements compared to usual sources of care and enabled the clinical teams to detect and remediate medically urgent circumstances more effectively (Izquierdo et al., 2007).
Expanding Infrastructure for Telehealth
While the lack of technology infrastructure has been previously identified as a barrier to adopting telehealth services, public investments are helping to steadily expand the availability of broadband access in rural communities. In 2006, for example, the Federal Communications Commission (FCC) established the Rural Health Care Pilot Program to encourage the develop-
ment and use of broadband networking services by health care providers serving rural communities throughout the nation. The goals of the initiative recognize that broadband networks can significantly improve rural Americans’ access to health care information, consultation, and other telehealth services. In November 2007, the FCC selected 69 entities to participate in the pilot program. Entities eligible for support include (but are not limited to) not-for-profit hospitals, rural health care clinics, community health centers, postsecondary institutions offering health care instruction, including teaching hospitals and medical schools. Total funding for the 69 selected participants is approximately $417 million over 3 years (FCC, 2012).
The American Recovery and Reinvestment Act of 2009 (ARRA) made a historic investment in health information technology by providing billions of dollars in incentive payments for certain Medicare (and Medicaid) providers who adopt and become meaningful users of certified electronic health records (ONC, 2012). The primary goal of these and other federal major investments is to build the infrastructure and technical capacity to support the exchange of health information—whether through videoconferencing, home monitoring, remote reading of images, or other means—as tools for improving access and quality of care (Mostashari, 2010).
Although initial investments in special hardware and software for telemedicine/telehealth can be significant, especially for small groups or those in geographic locations where the technology infrastructure for broadband (Web-based communications) is not yet available, recent infrastructure investments are reducing previous barriers. The rapid increase in the availability of consumer electronics such as smartphones, the proliferation of free and low-cost health-related “apps,” the increase in web-based tools for conferencing via laptops, and many other consumer friendly devices have also made telehealth far more technically accessible for beneficiaries, caregivers, and family members. While there are still some areas of the country where broadband is not available, and some beneficiaries many not have Internet access, the infrastructure required to support telehealth has been rapidly expanding.
Medicare Payment Provisions for Telehealth
It is important to emphasize that payment limitations are significant barriers to broader expansion and use of telehealth services. Medicare does, however, pay for telehealth services when provided by qualified providers to beneficiaries in rural areas (CMS, 2012a). Specifically, Medicare pays for a limited number of Part B services furnished at a distant site by physicians, NPs, PAs, clinical nurse specialists, and others, but only if the originating site is located in a rural HPSA or a county outside of a metropolitan statistical area (MSA).
Notwithstanding the transportation and mobility burdens faced by many elderly and disabled beneficiaries, individuals and facilities in medically underserved metropolitan areas are not eligible for Medicare payment for telehealth services. In commenting on the new CMS rules for accountable care organizations, the American Telemedicine Association called for a waiver to the current requirements so that 35 million beneficiaries in metropolitan areas could access video conferencing, and to permit telehealth services originating from a beneficiary’s home, a hospice, or anywhere else a beneficiary might be located (ATA, 2011).
Under current payment provisions, an interactive telecommunications system must be used and permit real-time communication between the practitioner at the distant site and the beneficiary at the originating site. For these services, the use of a telecommunications system substitutes for an in-person encounter. Currently, as shown in Table 3-4, Medicare telehealth services include initial inpatient consultations; follow-up inpatient consultations for beneficiaries
in hospitals or skilled nursing facilities, office, or other outpatient visits; certain patient educational services (including kidney disease management and diabetes self-management); and a limited number of other services. Payment for asynchronous “store and forward” services is provided only in federal telehealth demonstration projects in Alaska and Hawaii and is otherwise not reimbursed (CMS, 2012a).
Under current payment provisions, originating sites include the office of an eligible practitioner, hospitals, rural health clinics, federally qualified health centers, hospital-based or critical access hospital-based renal dialysis centers, skilled nursing facilities, and community mental health centers. Originating sites are also paid a facility fee, which is separately billable under Part B. Services provided in other locations, including home health and hospice settings, are not eligible for reimbursement.
Credentialing of Health Care Providers
In May 2011, CMS reduced a significant barrier to providing telehealth services related to the credentialing of the practitioners by allowing the originating site’s credentials to be recognized by the receiving site. Previously, CMS regulations had required that the facility receiving the telehealth services follow the same credentialing procedures as it would with its local practitioners. This was not only duplicative, but also burdensome on small facilities. These new CMS regulations are expected to expedite approvals of practitioners and reduce expensive and often cumbersome credentialing processes.
Conflicting scope-of-practice requirements in different states have also made credentialing difficult for some clinicians who were providing telehealth services to out-of-state facilities. The new requirements simplify the process by allowing the receiving hospitals and other facilities to rely on the credentialing and privileging decisions of other institutions. This change was described by CMS administrator Donald M. Berwick as “an innovative practice in delivering care to all patients, especially those in rural or remote parts of the country” (CMS Office of Public Affairs, 2011).
Expanding Opportunities in Telehealth
Although it is beyond the statement of task for this committee to identify best practices in telehealth, or to detail recent changes in state laws, opportunities clearly exist for expanding the use of telehealth technologies to improve access and quality of care for beneficiaries in settings and locations where services are needed. For example, as mentioned above, reimbursement for asynchronous “store and forward” technologies (i.e., involving the secure sharing and reading of images) is currently permitted only in federal demonstration programs in Alaska or Hawaii. Improving access to these services offers both an opportunity to expand the geographic reach of providers in a growing number of specialties and a valuable resource for primary care providers seeking those services for their patients. Expanded use of telemonitoring services, including home health monitoring, is another example that is proving successful in helping providers remain “connected” to their patients when they are at home or at a distance (Duckett, 2011). As described earlier in this section, although initial evidence of improved outcomes and patient satisfaction is positive, Medicare does not currently provide reimbursement for remote monitoring (also referred to as telemonitoring), nor does it include home health settings as approved “originating sites” for care—only as receiving sites (CMS, 2012a).
Finally, although Medicare does provide reimbursement for a limited number of telehealth services, this reimbursement is provided for services only when they are presented from an originating site located in a rural HPSA or in a county outside of an MSA. No reimbursement for services is provided for beneficiaries living in urban health professions shortage areas or for those who face other barriers to access, yet who may not live in a formally designated HPSA. Expanding the current list of authorized locations (e.g., to include urban health profession shortage areas) and sites of care (e.g., to include home health settings) offers further opportunities to improve access and to help ensure that the right care is provided, at the right time, and in the right place.
While there are significant concerns about the costs of the initial investments in the technology, technical challenges in using it, the security of personal health information transmitted over the Internet, the qualifications of the remote providers billing Medicare, the potential for legal liability issues, and potential competition with providers located at a geographic distance from beneficiaries, the benefits to patients of remote monitoring seem increasingly clear and worth further exploration. The Center for IT Leadership reported that savings owing to reduced transportation costs and face-to-face visits could potentially cover the cost of implementing telehealth (Dixon et al., 2008), and the New England Healthcare Institute (2009) estimated an annual national cost savings of up to $6.43 billion in reduced hospital readmission. AHRQ and HRSA have been funding telehealth research projects for several years (Dixon et al., 2008), and additional opportunities for demonstrations could be developed through the CMS Center for Medicare and Medicaid Innovation.
Scope of Practice
As the number of Medicare recipients increases due to demographic changes in the population, beneficiaries will have increasing needs to access primary and specialty care from qualified providers. Previous sections of this chapter documented the geographic variation in practice locations for certain primary care practitioners, showing that advanced practice RNs and NPs are more likely than physicians to provide primary care services and to choose to practice in shortage areas (AHRQ, 2011a,c; IOM, 2011; Skillman et al., 2012). Traditionally, discussions of workforce supply in primary care have focused on how to recruit and retain physicians into primary care rather than specialty care and to provide incentives for physicians to practice in underserved areas (Salinsky, 2010). As discussions of new care models have evolved, more attention is being paid to the functions and roles of members of care teams and to the nature and extent of their collaborations and working relationships. A particular area of concern and disagreement is whether physicians must always provide direct, onsite supervision to advanced practice RNs or nurse practitioners, physician assistants, pharmacists, and other licensed health professionals (National Health Policy Forum, 2011).
The scope of practice of various health professions is often seen solely as a disagreement over professional autonomy between physicians and other health professionals, but it is also a regulatory and payment policy issue (Safriet, 2011). The current scope-of-practice laws, credentialing requirements, and payment policies may be considered overly restrictive by health professionals who have been trained to provide certain services but who are prohibited from doing so by state laws or by payment policies. For example, states vary extensively on the independent authority of nurse practitioners to diagnose, order tests, and make referrals (UCSF Center for the Health Professions, 2007). Sixteen states and the District of Columbia have passed
laws granting full plenary authority for nurse practitioners to practice under their own license without requiring physician supervision or collaboration. The IOM (2010) report The Future of Nursing recommended a joint federal and state effort to establish standard practice acts, and a Josiah Macy Foundation report on primary care recommended removal of regulatory barriers inhibiting NP options (Cronenwett and Dzau, 2010).
Because the focus of this report is on geographic adjustment factors and how they affect both metropolitan and nonmetropolitan providers and access to care, it is important to note that issues related to scope of practice present some unique challenges for physicians, nurses, and other practitioners. Physicians in nonmetropolitan primary care practices, for example, may actually need to practice at a broader level than their metropolitan counterparts. NPs practicing in rural areas may find themselves the sole provider in a community, needing to practice to the fullest extent of their educational preparation, yet limited by a particular state’s requirement of physician supervision that may be very difficult to achieve (Baker Institute, 2012; Safriet, 2011) (see Box 3-2).
Scope-of-practice issues and payment policies are also related. For some years now, Medicare Part B services provided by NPs are paid 85 percent of the amount physicians receive under the Medicare Fee Schedule for the same visit code. NPs may bill “incident to” a physician and receive 100 percent of the physician rate, but this assumes physician supervision and requires that the patient must have been seen first by a physician.
There are exceptions to these payment rules under federal programs. Rural Health Centers funded by CMS actually require an NP or PA to be part of the rural practice, and reimbursement is not differentiated or based on provider type. Federally Qualified Health Centers, under HRSA’s Bureau of Primary Care, also have unique policies for practice and billing for primary care services which are not provider specific, but based on the service. Some of the new performance-based payment initiatives and care delivery models designed to improve the efficiency of health care delivery and care management also may also affect the mix of health care practitioners. For example, the primary care bonus payment to NPs and PAs only occurs when they are supervised by a physician. These new initiatives should be evaluated to determine their impact on interprofessional collaboration and health outcomes for beneficiaries (Baker Institute, 2012).
Most Medicare beneficiaries have reasonably good access to care and most have a usual source of care. However, those who need to find a new primary care practitioner or specialist have some challenges. Minority beneficiaries in the most recent MedPAC beneficiary survey reported more problems finding specialists than in previous years, and that is a source for concern and additional monitoring in future surveys.
Quality of care for Medicare beneficiaries has been improving slowly over the past several years, but as is true with the rest of health care, it is still notable for wide geographic variation as well as racial and ethnic disparities in outcomes. Previous studies have identified strong regional patterns of performance, but the committee’s recommendations are focused at the profession and practitioner levels. Analysis of CAHPS data conducted for this report found that metropolitan areas tended to do better on measures of timeliness of access to care, while nonmetropolitan areas scored higher on communication with physicians and overall satisfaction with physicians. There was little evidence in the analysis to suggest that the committee’s Phase I recommendations, if implemented, would have a systematic impact that would either favor or disadvantage
BOX 3-2
State Variations in Nurse Practitioners’ Scope of Practice
The issue of restrictive state practice influencing where NPs practice is unique to NPs in that there is such wide variation by state as to regulation. Currently 16 states and the District of Columbia (see below) allow full plenary authority to NPs, meaning that they have independent authority to practice and to write prescriptions in clinical practice. These states tend to be inclusive of large rural areas (e.g., Alaska, Hawaii, Iowa, North Dakota, Oregon, and Washington). However, there are states with significant rural areas and provider shortages that have very restrictive regulations for NPs (e.g., Georgia and Alabama) where such regulations may be impacting the workforce and numbers of potential providers.
Additionally, findings indicate that states with more progressive regulations actually have higher enrollments in NP programs compared to those with more restrictive laws (Kalist and Spurr, 2004). The more restrictive states also lose potential NPs to states that have more progressive practice acts and regulations that govern NP practice (Wing et al., 2005). The jurisdictions granting full plenary authority to NPs are
| • Alaska | • New Hampshire |
| • Arizona | • New Mexico |
| • Colorado | • North Dakota |
| • District of Columbia | • Oregon |
| • Hawaii | • Rhode Island |
| • Idaho | • Vermont |
| • Iowa | • Washington |
| • Maine | • Wyoming |
| • Montana |
SOURCE: AANP, 2011.
geographic areas based on their current levels of performance related to access and timeliness of care or quality. However, quality measurement is not a definitive science, and much more needs to be learned about the relationships between payment and quality.
It seems apparent that there are geographic pockets with persistent access and quality problems for Medicare beneficiaries, and that many of these pockets are in medically underserved rural and inner metropolitan areas. However, geographic adjustment of Medicare payment is not an appropriate approach for addressing problems in the supply and distribution of the health care workforce. The geographic variations in the distribution of physicians, nurses, and physician assistants and local shortages that create access problems for beneficiaries need to be addressed through other means.
1. Racial and ethnic minorities and low-income individuals face more barriers when trying to access care and receive a lower quality of care.
2. Health Professional Service Areas are the prevailing standard for representing underserved areas and thus are useful for comparing access, quality, and workforce supply across
geographic areas. Racial and ethnic minorities tend to be overrepresented in Health Professional Service Areas.
3. The available evidence does not show a strong positive relationship between changes in the level of payment and quality of care at the geographic level.
4. The geographic areas used for payment adjustment are large relative to the locations of specific underserved populations. Thus, geographic payment adjustment is a blunt instrument for resolving these more localized disparities and is not sufficiently targeted to be an appropriate use of resources.
5. General surgeons tend to have different patterns of practice in metropolitan and nonmetropolitan areas. Those in nonmetropolitan areas tend to provide more trauma and critical care for small hospitals.
6. Adequate access to primary care services is essential to a well-functioning health care system.
7. Nurse practitioners and physician assistants comprise major portions of the primary care workforce. They also provide a great deal of subspecialty and procedural care that also benefits beneficiaries.
8. Access to high-quality primary and specialty care for beneficiaries in medically underserved metropolitan and nonmetropolitan areas would be improved by increasing the availability and use of telehealth technologies.
9. The supply of and access to primary care services in underserved areas could be improved if state licensing and credentialing laws were consistent and allowed the full primary care workforce to practice to their full scope of educational preparation.
AANP (American Academy of Nurse Practitioners). 2011. Collaboration/supervisory language in state practice acts and regulations for nurse practitioners. http://www.aanp.org/images/documents/state-leg-reg/StateRegulatoryMap.pdf (accessed August 8, 2012).
AANP. 2012. FAQs about nurse practitioners. http://www.aanp.org/NR/rdonlyres/A1D9B4BD-AC5E-45BF-9EB0-DEFCA1123204/4710/2011FAQswhatisanNPupdated.pdf (accessed January 12, 2012).
ACNP (American College of Nurse Practitioners). 2012. What is a nurse practitioner? http://www.acnpweb.org/i4a/pages/index.cfm?pageid=3479 (accessed March 14, 2012).
AHRQ (Agency for Healthcare Research and Quality). 2010a. National healthcare quality report. http://www.ahrq.gov/qual/qrdr10.htm (accessed October 12, 2011).
AHRQ. 2010b. National healthcare disparities report. Rockville, MD: AHRQ.
AHRQ. 2011a. Primary care workforce facts and stats: Overview. Rockville, MD: AHRQ.
AHRQ. 2011b. Primary care workforce facts and stats: No. 1. The number of practicing primary care physicians in the United States. AHRQ Publication No. 12-P001-2-EF, October 2011. http://www.ahrq.gov/research/pcwork1.htm (accessed August 8, 2012).
AHRQ. 2011c. Primary care workforce facts and stats: No. 2. The number of nurse practitioners and physician assistants practicing primary care in the United States. AHRQ Publication No. 12-P001-3-EF, http://www.ahrq.gov/research/pcwork2.htm (accessed November 18, 2011).
AHRQ. 2011d. Geographic distribution of health care professionals, 2010. Table 2. http://www.ahrq.gov/research/pcwork3.htm (accessed August 8, 2012).
AHRQ. 2012a. National quality measures clearinghouse. http://www.qualitymeasures.ahrq.gov/ (accessed December 12, 2011).
AHRQ. 2012b. Primary care workforce facts and stats. Distribution of the U.S. primary care workforce. AHRQ Publication No. 12-P001-4-EF. http://www.ahrq.gov/research/pcworkforce.htm (accessed on January 14, 2012).
Arcury, T. A., W. M. Gesler, J. S. Preisser, J. Sherman, J. Spencer, and J. Perin. 2005. The effects of geography and spatial behavior on health care utilization among the residents of a rural region. Health Services Research 40(1):135-155.
ARF (Area Resource Files). 2009. http://arf.hrsa.gov/ (accessed August 17, 2012).
ATA (American Telemedicine Association). 2011. Telemedicine priorities for the Centers for Medicare and Medicaid Services innovation. http://www.americantelemed.org/i4a/pages/index.cfm?pageID=3286 (accessed May 27, 2012).
Auerbach, D. I., P. I. Buerhaus, and D. O. Steiger. 2011. Registered nurse supply grows faster than projected amid surge in new entrants ages 23-26. Health Affairs 30(12):2286-2292.
Baker Institute for Public Policy of Rice University. 2012. Health reform and the health care workforce. Baker Institute Policy Report, No. 51. March. Houston, TX: Rice University.
Balfour, J. L., and G. A. Kaplan. 2002. Neighborhood environment and loss of physical function in older adults: Evidence from the Alameda County study. American Journal of Epidemiology 155(6):507-515.
Berwick, D. M., T. W. Nolan, and J. Whittington. 2008. The triple aim: Care, health and cost. Health Affairs 27(3):759-769.
Bipartisan Policy Center. 2011. The complexities of national health care workforce planning. http://bipartisanpolicy.org/library/report/complexities-national-health-care-workforce-planning (accessed August 17, 2012).
BLS (Bureau of Labor Statistics). 2012a. Registered nurses: 2010-11 Occupational outlook handbook. http://www.bls.gov/oco/ocos083.htm (accessed March 10, 2012).
BLS. 2012b. Physician assistants: 2010-11 Occupational outlook handbook. http://www.bls.gov/ooh/Healthcare/Physician-assistants.htm (accessed March 10, 2012).
Bodenheimer, T., and H. H. Pham. 2010. Primary care: Current problems and proposed solutions. Health Affairs 5:799-805.
CDC (Centers for Disease Control and Prevention) and NCHS (National Center for Health Statistics). 2011. Early release of selected estimates based on data from the january-june 2011 National Health Interview Survey. Figure 2.2. Hyattsville, MD: NCHS.
Chan, L., L. G. Hart, and D. C. Goodman. 2006. Geographic access to health care for rural Medicare beneficiaries. Journal of Rural Health 22(2):140-146.
Chou, A. F., A. F. Brown, R. E. Jensen, S. Shih, G. Pawlson, and S. H. Scholle. 2007. Gender and racial disparities in the management of diabetes mellitus among Medicare participants. Women’s Health Issues 17:150-161.
Christian Lynge, D., E. H. Larson, M. J. Thompson, R. A. Rosenblatt, and L. G. Hart. 2008. A longitudinal analysis of the general surgery workforce in the United States, 1981-2005. Archives of Surgery 143(4):345-350.
CMS (Centers for Medicare and Medicaid Services). 2012a. Telehealth services. Rural health fact sheet series. Medicare Learning Network. https://www.cms.gov/Outreach-and-Education/Medicare-Learning-Network-MLN/MLNProducts/downloads/TelehealthSrvcsfctsht.pdf (accessed March 25, 2012).
CMS. 2012b. Medicare costs. http://www.medicare.gov/cost/ (accessed February 12, 2012).
CMS. 2012c. Medicare Advantage (Part 3). http://www.medicare.gov/navigation/medicare-basics/medicare-benefits/part-c.aspx (accessed February 12, 2012).
CMS Office of Public Affairs. 2011. Medicare finalizes a new rule for telemedicine services to keep beneficiaries in rural and remote areas dialed in through telemedicine. CMS, May 2.
Commonwealth Fund. 2012. Rising to the challenge: Results from a scorecard on local health system performance. The Commonwealth Fund Commission on a High Performance Health System. http://www.com-monwealth.org (accessed March 20, 2012).
Cooper, R. A., T. E. Getzen, H. J. McKee, and P. Laud. 2002. Economic and demographic trends signal an impending physician shortage. Health Affairs 21(1):140-154.
Council on Graduate Medical Education. 2005. Physician workforce guidelines for the United States, 20002020, sixteenth report. Health Resources and Services Administration. http://www.hrsa.gov/advisorycommittees/bhpradvisory/cogme/Reports/sixteenthreport.pdf (accessed July 8, 2012).
Cronenwett, L., and V. J. Dzau. 2010. Chairman’s summary of the conference. In Who will provide primary care and how will they be trained?, edited by B. Culliton. Duraham, NC: Josiah Macy Jr. Foundation.
CRS (Congressional Research Service). 2010. Medicare hospital readmissions: Issues, policy options, and PPACA. CRS Report for Congress, 7-7500. http://www.ncsl.org/documents/health/Medicare_Hospital_Readmissions_and_PPACA.pdf.
Dall, T. 2010. Effect of increased insurance coverage under health care reform on the demand for primary care and specialist physicians. Presented at AAMC Physician Workforce Conference, May 7. Washington, DC.
Darkins, A., P. Ryan, R. Kobb, L. Foster, E. Edmonson, B. Wakefield, and A. E. Lancaster. 2008. Care coordination/home telehealth: The systematic implementation of health informatics, home telehealth, and disease management to support the care of veteran patients with chronic conditions. Telemedicine and e-Health 14(150):1118-1126.
Dickson, J. J. 2011. Innovations in expanding capacity and access. Testimony to IOM Committee on Geographic Adjustment, Panel on Workforce, Access, and Innovation: Policy Levers for Geographic Adjustment in Medicare Payment, September. http://www.iom.edu/~/media/Files/Activity%20Files/HealthServices/GeographicAdjustment/September%2022/Dickson.pdf (accessed July 8, 2012).
Dill, M. J., and E. S. Salsberg. 2008. The complexities of physician supply and demand: Projections through 2025. Washington, DC: Center for Workforce Studies, Association of American Medical Colleges.
Dixon, B. E., J. M. Hook, and J. J. MacGowan. 2008. Using telehealth to improve quality and safety: Findings from the AHRQ Health IT Portfolio. AHRQ Publication No. 09-0012-EF. Rockville, MD: AHRQ. http://psnet.ahrq.gov/resource.aspx?resourceID=9337 (accessed May 15, 2012).
Donabedian, A. 1966. Evaluating the quality of medical care. Milbank Memorial Fund44(3 Suppl):166-206.
Duckett K. 2011. Innovations in expanding primary care capacity: Moving away from visit-based care for Medicare beneficiaries. Testimony to IOM Committee on Geographic Adjustment in Medicare Payment, September.
FCC (Federal Communications Commission). 2012. Rural Health Care Pilot Program. http://www.ncbi.nlm.nih.gov/pubmed/22241810 (accessed May 24, 2012).
Fenton, J. J., A. F. Jerant, K. D. Bertakis, and P. Franks. 2012. The cost of satisfaction: A national study of patient satisfaction, health care utilization, expenditures, and mortality. Archives of Internal Medicine 172(5):405-411.
Fitzpatrick, A. L., N. R. Powe, L. S. Cooper, D. Ives, and J. A. Robbins. 2004. Barriers to health care access among the elderly and who perceives them. American Journal of Public Health 94(10):1788-1794.
Fordyce, M. A., F. M. Chen, M. P. Doescher, and L. G. Hart. 2007. 2005 Physician supply and distribution in rural areas of the United States. Final Report #116. Prepared by University of Washington Rural Health Center study for HRSA. Seattle, WA: University of Washington.
Frazier, R., and M. Foster. 2009. How hard is it for Alaska’s Medicare patients to find family doctors? UA Research Summary No. 14. Institute of Social and Economic Research, University of Alaska. http://www.iser.uaa.alaska.edu/Publications/researchsumm/UA_RS14.pdf (accessed June 20, 2011).
GAO (Government Accountability Office). 2008. Primary care professionals: Recent supply trends, projections, and valuation of services. GAO-08-472T. http://www.gao.gov/new.items/d08472t.pdf (accessed December 11, 2011).
Gellis, Z. D., B. Kenaley, J. McGinty, E. Bardelli, J. Davitt, and T. Ten Have. 2012. Outcomes of a telehealth inervention for homebound older adults with heart or chronic respiratory failure: A randomized controlled trial. Gerontologist, May 25 [epub ahead of print]. http://www.ncbi.nlm.nih.gov/pubmed/22241810 (accessed May 27, 2012).
Goodman, D. C., and K. Grumbach. 2008. Does having more physicians lead to better health system performance? Journal of the American Medical Association 299(3):335-337.
Green, L. A. 2004. Is primary care worthy of physicians? An ecological perspective. In The future of primary care, edited by J. Showstack, A. A. Rothman, and S. B. Hassmiller. San Francisco, CA: Jossey-Bass.
Grumbach, K., L. G. Hart, E. Mertz, J. Coffman, and L. Palazzo. 2003. Who is caring for the underserved? A comparison of primary care physicians and nonphysicians in California and Washington. Annals of Family Medicine 1(2):97-104.
Hart, L. G., M. J. Pirani, and R. Rosenblatt. 1994. Most rural towns lost physicians after their hospital closed. Rural Development Perspectives 10(1):17-21.
Heneghan, S. J., J. Bordley, P. A. Dietz, M. S. Gold, P. L. Jenkins, and R. J. Zuckerman. 2005. Comparison of urban and rural general surgeons: Motivations for practice location, practice patterns, and education requirements. Journal of the American College of Surgeons 201:732-736.
Hersh, W., D. H. Hickam, S. M. Severance, T. L. Dana, K. P. Krages, and M. Helfland. 2006. Telemedicine for the Medicare Population: Update. Prepared by Oregon Health Sciences University Evidence-based Practice Center for the Agency for Healthcare Research and Quality. http://archive.ahrq.gov/downloads/pub/evidence/pdf/telemedup/telemedup.pdf (accessed August 10, 2012).
Hooker, R. S., and C. M. Everett. 2012. The contributions of physician assistants in primary care systems. Health and Social Care in the Community 20(1):20-31.
HRSA (Health Resources and Services Administration). 2012. Shortage designations: Health Professional Shortage Areas and medically underserved areas/populations. http://bhpr.hrsa.gov/shortage/ (accessed February 12, 2012).
IOM (Institute of Medicine). 1996a. Primary care: America’s health in a new era. Washington, DC: National Academy Press.
IOM. 1996b. Telemedicine. Washington, DC: National Academy Press.
IOM. 2010. Future directions for the national healthcare quality and disparity reports. Washington, DC: The National Academies Press.
IOM. 2011. Geographic adjustment in Medicare payment: Phase I: Ensuring accuracy. Washington, DC: The National Academies Press.
Izquierdo, R., S. Meyer, J. Starren, R. Goland, J. Teresi, S. Shea, and R. S. Weinstock. 2007. Detection and remediation of medically urgent situations using telemedicine case management for older patients with diabetes mellitus. Therapeutics and Clinical Risk Management 3(3):485-489.
Jencks, S. F., E. D. Huff, and T. Cuerdon. 2003. Change in the quality of care delivered to Medicare beneficiaries, 1998-99 to 2000-2001. Journal of the American Medical Association, January 15. http://www.ahqa.org/pub/media/159_989_4077.CFM (accessed August 8, 2012).
Jerant, A., J. J. Fenton, and P. Franks. 2012. Primary care attributes and morality: A national person-level study. Annals of Family Medicine 10(1):34-41.
Jones, J. F., and P. F. Brennan. 2002. Telehealth interventions to improve clinical nursing of elders. Annual Review of Nursing Research 20:293-322.
Joynt, K. E., E. J. Orav, and A. K. Jha. 2011. Thirty-day readmission rates for Medicare beneficiaries by race and site of care. Journal of the American Medical Association 305(7):675-681.
Kaiser Commission on Medicaid and the Uninsured. 2011. Research brief: Insurance coverage and access to care in primary care shortage areas. http://www.kff.org/insurance/upload/8161.pdf (accessed August 17, 2012).
Kalist, D. E., and S. J. Spurr. 2004. The effect of state laws on the supply of advanced practice nurses. International Journal of Health Care Finance and Economics 4(4):271-281.
KFF (Kaiser Family Foundation). 2010a. Medicare chartbook, 4th ed. http://facts.kff.org/chartbooks/Medicare%20Chartbook,%20Fourth%20edition,%202010.pdf.
KFF. 2010b. Registered nurses per 100,000 population, 2010. http://www.statehealthfacts.org/comparemapdetail.jsp?typ=1&ind=439&cat=8&sub=103&sortc=1&o=a (accessed January 10, 2012).
KFF. 2010c. Percent of physicians and other practitioners participating in Medicare Part B, by state, 2009. In Medicare Chartbook, 4th ed. http://facts.kff.org/chart.aspx?cb=58&sctn=163&ch=1740 (accessed June 19, 2012).
King, J., E. P. Fraher, T. C. Ricketts, A. Charles, G. F. Sheldon, and A. A. Meyer. 2009. Characteristics of practice among rural and urban general surgeons in North Carolina. Annals of Surgery 249(6):1052-1060.
Kirch, D. G., M. K. Henderson, and M. J. Dill. 2011. Physician workforce projections in an era of health care reform. Annual Review of Medicine 63:435-445.
Lake, T. G., M. Gold, A. Ciemnecki, M. Sinclair, N. Diaz-Tena, C. Lamothe-Galette, and S. Limpa-Amara. 2004. Results from the 2003 targeted beneficiary survey on access to physician services among Medicare beneficiaries. MPR Reference No. 8923-410. Cambridge, MA: Mathematica Policy Research.
Larson, E. H., and L. G. Hart. 2007. Growth and change in the physician assistant workforce in the United States, 1967-2000. Journal of Allied Health 36(3):121-130.
The Lewin Group. 2010. The status of data sources to inform health workforce policy and supply adequacy. Prepared for the Office of the Assistant Secretary for Planning and Evaluation, HHS. Falls Church, VA: The Lewin Group.
MacKinney, A. C., L. Xu, and K. J. Mueller. 2011. Medicare beneficiary access to primary care physicians—better in rural, but still worrisome. Rural Policy Research Institute Center for Rural Policy Analysis. http://www.public-health.uiowa.edu/rupri/publications/policybriefs/2011/Phys%20Exit%20Brief%20FINAL.pdf (accessed August 17, 2012).
MedPAC (Medicare Payment Advisory Commission). 2009. Report to the Congress: Medicare payment policy. Washington, DC: MedPAC.
MedPAC. 2011. Report to the Congress: Medicare payment policy. Washington, DC: MedPAC.
MedPAC. 2012a. Report to the Congress: Medicare payment policy. Washington, DC: MedPAC.
MedPAC. 2012b. Errata sheet. Corrected version of Figure 2-1. http://www.medpac.gov/documents/Mar12_Ch4_ERRATA_page95.pdf (accessed August 8, 2012).
Morgan, P. A., and R. S. Hooker. 2010. Choice of specialties among physician assistants in the United States. Health Affairs 29(5):887-892.
Mostashari, F. 2010. Aging in place: The national broadband plan and bringing health care technology home. Statement before Senate Special Committee on Aging and U.S. House of Representatives. http://www.hhs.gov/asl/testify/2010/04/t20100422e.html (accessed August 12, 2011).
National Health Policy Forum. 2011. Expanded scope of practice: A response to demand for primary care? Forum Session Announcement, November 4, 2011. Washington, DC: National Health Policy Forum http://www.nhpf.org/library/forum-sessions/FS_11-04-11_ScopeofPractice.pdf (accessed November 4, 2011).
Neuwahl, S., T. C. Ricketts, and K. Thompson. 2011. The geographic distribution of general surgeons: Comparisons across time and specialties. American College of Surgeons Health Policy Research Institute. http://www.acshpri.org/documents/ACSHPRI_FS8.pdf (accessed February 12, 2012).
New England Healthcare Institute. 2009. Research update: Remote physiological monitoring. http://www.nehi.net/publications/36/remote_physiological_monitoring_research_update (accessed August 17, 2012).
ONC (Office of the National Coordinator for Health Information Technology). 2012. Electronic health records and meaningful use. http://healthit.hhs.gov/portal/server.pt?open=512&objID=2996&mode=2 (accessed March 25, 2012).
Palmas, W., J. Teresi, R. S. Weinstock, and S. Shea. 2008. Acceptability to primary care providers of telemedicine in diabetes case management. Journal of Telemedicine and Telecare 14:306-308.
Rabinowitz, H., J. J. Diamond, J. J. Veloski, and J. A. Gayle. 2000. The impact of multiple predictors on generalist physicians’ care of underserved populations. American Journal of Public Health 90(8):1225-1228.
Ricketts, T. C., and R. Randolph. 2007. Urban-rural flows of physicians. Journal of Rural Health 23(4):277-285.
Ritchie, W. P., R. S. Rhodes, and T. W. Biester. 1999. Work loads and practice pattern of general surgeons in the United States, 1995-97. Annals of Surgery 230:533-543.
Rosenthal, M. B., A. Zaslavsky, and J. Newhouse. 2005. The geographic distribution of physicians revisited. Health Services Research 40(6 Pt.1):1931-1952.
Safriet, B. 2011. Federal options for maximizing the value of advanced practice nurses in providing quality, cost-effective care. In The Future of Nursing. Washington, DC: The National Academies Press.
Salinsky, E. 2010. Health care shortage designations: HPSA, MUA and TBD. National Health Policy Forum Background Paper No. 75. Washington, DC: The George Washington University.
Schneider, E. C., A. M. Zaslavsky, B. E. Landon, T. Lied, S. Sheingold, and P. D. Cleary. 2001. National quality monitoring of health plans: The relationship between enrollees’ reports and the quality of clinical care. Medical Care 39(12):1313-1325.
Shahid, K., A. M. Kolomeyer, N. V. Nayak, N. Salameh, G. Pelaez, A. S. Khouri, T. T. Eck, and B. Szirth. 2012. Ocular telehealth screenings in an urban community. Telemedicine and E Health 18(2):95-100.
Skillman, S., L. Kaplan, M. Fordyce, P. McMenamin, and M. Doescher. 2012. Understanding advanced practice registered nurse distribution in urban and rural areas of the United States using National Provider Identifier data. http://depts.washington.edu/uwrhrc/uploads/RHRC_FR137_Skillman.pdf (accessed March 6, 2012).
Smart, D. 2011. Physician characteristics and distribution in the US, 2011 edition. Chicago, IL: American Medical Association.
Sutton, J., C. Ramos, and J. Lucado. 2010. US physician assistant (PA) supply by state and county in 2009. Journal of the American Academy of Physician Assistants, September.
UCSF (University of California, San Francisco) Center for the Health Professions. 2007. Chart overview of nurse practitioner scope of practice in the U.S. http://futurehealth.ucsf.edu/Content/29/2007-12_Overview_of_Nurse_Practitioner_Scopes_of_Practice_In_the_United_States_Chart.pdf (accessed August 8, 2012).
UCSF Center for the Health Profesions. 2009. Physician assistants and nurse practitioners in specialty care: Six practices make it work. Oakland, CA: California Healthcare Foundation. http://www.chcf.org/publications/2009/06/physician-assistants-and-nurse-practitioners-in-specialty-care-six-practices-make-it-work (accessed June 20, 2012).
Weintraub, A. R., C. Kimmelstiel, D., Levine, D., Venesy, D., Levin, A., Lorell, B., Konstam, M. A. 2005. A multicenter randomized controlled comparison of telephonic disease management vs. automated home monitoring in patients recently hospitalized with heart failure: Span CHF II Trial. Journal of Cardiac Failure 11:720.
Wing, P., E. O’Grady, and M. Langelier. 2005. Changes in the legal practice environment of nurse practitioners. American Journal of Nurse Practitioners 9(2):25-39.
Wootten, R., K. Bahaadinbeigy, and D. Hailey. 2011. Estimating travel reduction associated with the use of telemedicine by patients and healthcare professionals: Proposal for quantitative synthesis in a systematic review. BMC Health Services Research 11:185. http://www.biomedcentral.com/1472-6963/11/185 (accessed September 25, 2011).
Young, A., H. Chaudhry, J. Rhyne, and M. Dugan. 2010. A census of actively licensed physicians in the United States, 2010. Journal of Medical Regulation 96(4):10-20.
This page intentionally left blank.


