
Climate information is being used by a vast array of organizations within the public and private sectors, with decisions based on climate information being made every day. Users of climate information include national security planners, infrastructure decision makers, public policy makers, insurance companies, water managers, agricultural managers, and more. Each of these communities has different needs for climate data from numerical simulations, with different time horizons and different tolerances for uncertainty. Many user groups want very highly spatially resolved information about the likely range of climate variability and extreme events such as droughts, floods, or heat waves, while others are looking for data on long-term trends. Some concrete examples of current users of climate information are farmers, city planners, water managers, and insurance companies, and details about their use of climate information are described in Box 1.1.
BOX 1.1 EXAMPLES OF CLIMATE DATA USERS
Climate data are needed by many individuals and companies. Below are several representative examples of individuals and organizations who use climate data, why they need them, how they are used, and what the payoff is.
Farmers
Farmers have always been close to weather and climate, as their economic success depends on the right timing of planting, irrigation, and harvesting and the right choice of crops for the local climate. In their day-to-day decision making about irrigation, farmers depend heavily on short-term weather forecasts, which give them information not only about temperature and precipitation but also about soil moisture levels that are crucial for many crops. One concrete example is corn farming—a $15.1 billion business in the United Statesa—which is very sensitive to drought and low soil moisture. Decisions made on the time scales of weeks to seasons rely on short-term and seasonal forecasts of the soil moisture, which have become invaluable tools to help farmers decide on irrigation needs during drought conditions; it is estimated that by 2015 improved weather forecasts will allow the agriculture sector to save $61 million on irrigation water costs (Centrec Consulting Group, 2007). On time scales of seasons to years, forecasts of El Niño/La Niña conditions help farmers to decide when to plant and harvest their crop, with an estimated economic benefit on the order of $500 million to $950 million per year from the seasonal El Niño/La Niña forecast for the U.S. agricultural sector (Chen et al., 2002). On even longer time scales, the changing climate is shifting growing seasons and regions. Farmers are directly
impacted because many of them have specialized in growing specific crops, which in turn are often highly specialized for the climatic conditions they tolerate (see Figure 1). Longer-term regional climate projections of precipitation, temperature, and soil moisture will allow farmers to decide which crops to focus on in the future and to prepare for investments in new technologies needed to successfully grow new crops.
Mayors of Large Cities
One of the main concerns about climate change is associated with the projected increase in the frequency, duration, and intensity of heat waves. According to the National Weather Service (NWS),“heat is the number one weather-related killer in the U.S.,” b claiming more lives each year than floods, lightning, tornadoes, and hurricanes combined. Heat waves also increase the peak demand for electricity, with the potential for blackouts and the high economic cost associated with them. (Estimates for the August 2003 blackout that affected numerous cities in the United States and Canada ranged from $4 billion to $10 billion [U.S.-Canada Power System Outage Task Force, 2004]). Using a heat index that considers absolute temperature and humidity to assess how hot it really feels, the NWS forecasts extreme heat events several days in advance. This allows city officials to prepare for heat waves by warning the public, instituting energy-saving programs, and designating community cooling centers, reducing some of the negative impacts of heat waves
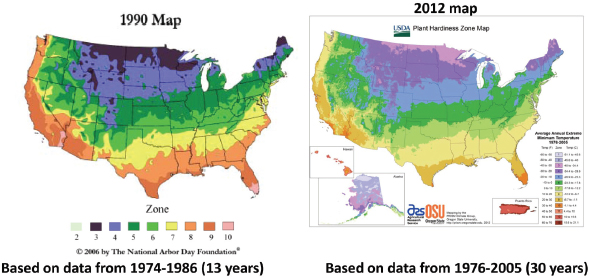
FIGURE 1 U.S. Department of Agriculture plant hardiness zone maps are used extensively by gardeners and growers to determine which plants are most likely to thrive at a location. Maps are based on the average annual minimum winter temperature, divided into 10°F zones. The map on the left is based on data from 19741986, and the map on the right is based on data from 1976-2005. The more recent map (right) is generally one half-zone warmer than the previous map (left). SOURCES: http://arborday.org/media/map_change.cfm; http://planthardiness.ars.usda.gov/PHZMWeb/AboutWhatsNew.aspx (both accessed October 11, 2012).
and saving lives. In the longer term, climate projection data allow mayors and other planners to develop adaptation strategies (NPCC, 2010) to help plan for some of the negative impacts of these changes. These adaptation strategies include programs to increase the energy efficiency of buildings, investments in power grid infrastructure, and zoning changes to mandate the planting of street trees in heat-stressed neighborhoods. Improved climate data (Figure 2) can help cities make more informed decisions on long-term infrastructure investments that will help to protect the health and economic interests of their constituents.
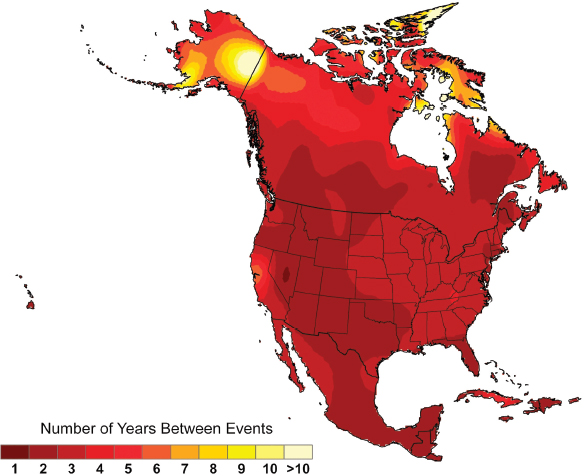
FIGURE 2 Heat waves are projected to occur more frequently in the future. Map shows the projected frequency of extreme heat for later in the century (2080-2099 average). Extreme heat refers to a day so hot that it occurred only once every 20 years in the past, and the projections show that extreme heat will occur every 1-3 years in much of the United States by the end of the century.
Hydropower System Managers
The Federal Columbia River Power System generates more than 76,000 gigawatt-hours (GWh) of electricity per year, accounting for about 30 percent of the electricity used by the more than 15 million people in the Pacific Northwest and having an estimated worth of approximately $4 billion per year (BPA, 2010). To continue generating power at this level, river managers like those for the Columbia River power system need to make both short- and long-term decisions regarding how much water to store (compared to natural flow), which requires climate data to predict and adapt to future changes in river flow. The climate data most needed by river power management are temperature, precipitation, and wind, with information preferably at high spatial resolutions of 1-10 km and with daily or higher frequency. Current climate data are only available at much lower resolutions, but even these data have been useful in projecting seasonal changes, such as increased winter runoff but less spring/summer runoff. Managers also use longer-term projections of climate change to make decisions on modifying existing infrastructure and/or acquiring additional infrastructure (for example, Figure 1.2). Managers such as those who monitor the Columbia River desire more reliable and higher-resolution climate data to help with planning and ultimately their ability to continue to supply power to millions of Americans (Figure 3).
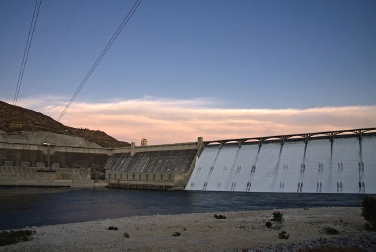
FIGURE 3 Managers of hydropower systems such as those of the Federal Columbia River Power System require climate information for both short-term operational decisions and long-term infrastructure planning. SOURCE: Steven Pavlov, http://commons.wikimedia.org/wiki/File:Grand_Coulee_Dam_in_the_evening.jpg (accesed June 8, 2012).
Insurance Companies
Insurance companies provide insurance to people and businesses against the impacts of natural disasters. Insurance rates for weather- and climate-related disasters such as floods, high winds, droughts, etc., are based on the expected occurrence of those events. To realistically assess the probabilities of weather- and climate-related natural disasters, insurance companies have been using climate data on past weather events for many years to develop specific risk models for different regions and operations (e.g., transportation, farming, and construction). Weatherand climate-related losses have increased rapidly in recent years (Figure 4), with record-breaking
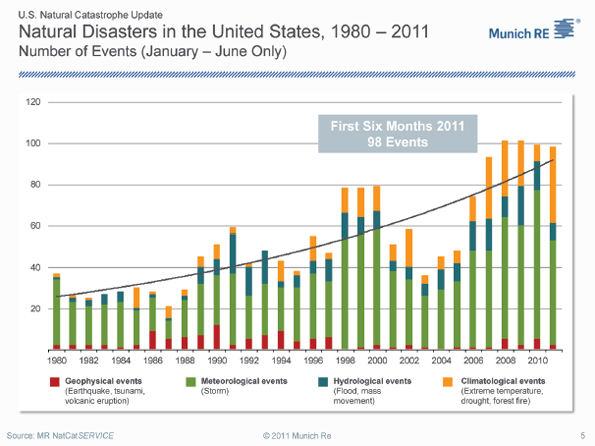
FIGURE 4 Annual occurrence of natural disasters in the United States, broken down by origin as of 2010, shows that the past may no longer be a reliable guide to the future. Record-breaking insured losses from weather- and climate-related disasters of over $50 billion were recorded in 2011. SOURCE: Munich RE; http://www.munichre.com/app_pages/www/@res/pdf/media_relations/ press_dossiers/hurricane/2011-half-year-natural-catastrophe-review-usa_en.pdf (accessed September 14, 2012).
insured losses of more than $50 billion in 2011.c More and more large insurance and reinsurance companies are recognizing that climate change poses an enormous challenge to their business. Accurately reflecting changed risks and actively and profitably managing climate change impacts, rather than withdrawing from high-risk markets, is a major challenge for the insurance industry. To address it, new kinds of climate data are required, focusing on projections rather than historical observations. High-quality regional climate projections of variables such as sea level, temperature, precipitation, wind, and extreme events will be crucial for the insurance industry to rise to this challenge, so insurers can continue to provide disaster coverage for people and businesses in the United States and use their past experience with risk mitigation (e.g., fire and earthquake building codes) to help prevent losses of lives and property (Mills and Lecomte, 2006).
National Security Sector
National security planners and decision makers use climate information and forecasts over a broad range of time scales. The February 2010 Quadrennial Defense Review notes that climate change will play a significant role in the future security environment for the United States (Gates, 2010). Concurrently, the U.S. Department of Defense and its military services are developing policies and plans to understand and manage the effects of climate change on military operating environments, missions, and facilities (NRC, 2011c). It has been estimated that $100 billion of naval facilities are at risk from sea-level rise of 3 feet or more (NRC, 2011c) (Figure 5). The national security risks associated with a changing climate have also recently been assessed in a report by the Center for American Progress (Werz and Conley, 2012). The Navy would like to use climate model outputs for information related to increasing Arctic maritime activity, water and resource scarcity, and the impact of sea-level rise on installations (NRC, 2011c). In order to use climate model projections to inform its decisions, the Navy would need high-spatial-resolution regional climate models on decadal time scales, uncertainty quantification of the models, and probability distribution functions in the model output. The Navy is a “good example of a stakeholder that has very specific needs in applications related to its infrastructure and operations, disease, civil instability, migration, water resources, and energy” (NRC, 2011c).
The Building Community
The built environment (buildings, communications, energy, industrial facilities, transportation, waste, water, and associated natural features) shelters and supports most human activities and constitutes a large portion of the nation’s wealth (Figure 6). It has important roles in reduction of greenhouse gas emissions and in measures to help society adapt economically, environmentally, and socially to climate change. The building community includes professionals—including architects, engineers, geologists, landscape architects, and planners—as well as owners, investors, facilities managers, contractors, manufacturers of building materials, health and safety regulators, and stakeholders served or affected by the built environment (nearly everyone).
The building community uses climate information, particularly on extremes, to ensure that buildings are safe, functional, and resilient. Historically, the extreme environments used in assess-

FIGURE 5 The amphibious assault ship USS Kearsarge (LHD 3) pulls away from its berth at Naval Station Norfolk. An estimated $100 billion worth of naval facilities are at risk from sea-level rise of 3 feet or more. SOURCE: http://www.navy.mil/view_single.asp?id=125450 (accessed June 6, 2012).
ment and design of the built environment have not been based on climate or weather models. Rather, extreme environments have been defined by statistics of historical records, albeit to within observation and sampling errors. With climate and weather changing, historical records no longer are adequate predictors of future extremes. However, advanced modeling capabilities potentially can provide useful predictions of extreme environments.
Often decisions about buildings and other infrastructure are made for very long time scales—decades and beyond. When looking at building decisions related to material choices, siting, and building design, there are any number of questions related to climate, including: How heavy are future rains and/or snowfalls likely to be? What range of temperatures is likely? What will average precipitation rates mean for the water table? Will it flood? Adaptation of the built environment to climate change is particularly important because it has significant resource implications. The U.S. Department of Commerce estimates total construction spending in the United States to be more than $820,000 million annually.d

FIGURE 6 Construction of the Sovereign, Atlanta, Georgia. The building community uses climate information to make decisions about building materials, siting, and building design. These types of infrastructure decisions can have implications for decades. As the climate changes, information from climate models is being used as a guide to future climate conditions. SOURCE: Conor Carey, http://commons.wikimedia.org/wiki/File:Sovereign-Atlanta.jpg (accessed June 6, 2012).
___________________
awww.epa.gov/oecaagct/ag101/cropmajor.html (accessed October 11, 2012).
bhttp://www.nws.noaa.gov/os/heat/index..html (accessed November 30, 2012).
cwww.noaa.gov/extreme2011/ (accessed October 11, 2012).
dwww.census.gov/construction/c30/c30index.html (accessed October 11, 2012).
Over the next several decades climate change and its myriad consequences will be further unfolding and likely accelerating (NRC, 2011a). Probable impacts from climate change, including sea-level rise, a seasonally ice-free Arctic, large-scale ecosystem changes, regional droughts, and intense flooding events, will increase demand for climate information. The value of this climate information is large. One of the more prominent places to see this is through the impacts of extreme climate and weather events; extreme climate and weather events are one of the leading causes of economic and human losses, with total losses between 1980 and 2009 exceeding $700 billion (NCDC, 2010) and damages from more than 14 weather- and climate-related disasters totaling more than $50 billion in 2011 alone.1 Climate change is affecting the occurrence of and impacts from extreme events, such that the past is not necessarily a reliable guide for the future, which further underscores the value of climate information in the future.
An example of the value of climate information on shorter time scales comes from the flooding throughout the Upper Midwest in the spring and summer of 2011. Extensive rainfall in the spring and summer of 2011 led to flooding of the Mississippi and Missouri rivers. Prior to that spring, climate predictions showed increased risk of flooding throughout much of the Upper Midwest as a result of above-average snowpack melting and precipitation levels (Figure 1.1), allowing government authorities to plan ahead. According to the National Oceanic and Atmospheric Administration (NOAA), these climate predictions allowed the government to coordinate “with local, state and federal agencies before and during the flooding, so that emergency officials could make important decisions to best protect life and limit property damage.”2 Such decisions included evacuations and destruction of levees in some locations to allow excess waters to flow into floodways.
In looking at longer time scales, climate models can provide information on projected rainfall runoff for the coming decades (Figure 1.2). Some areas of the United States, such as the Southwest, are projected to see decreases in average rainfall, while some areas, like the Northeast, will see increases. Such changes will have major implications for future water supplies, crop yields, and wildfire risks, among other effects. This type of projected information allows counties and states to plan ahead for these conditions, including decisions regarding infrastructure. However, the relationship between regional drought and predictable patterns of climate variability is complicated, so users of climate information must understand and deal with considerable predictive uncertainty.
___________________
1http://www.noaa.gov/extreme2011/ (accessed October 11, 2012).
2http://www.noaa.gov/extreme2011/mississippi_flood.html (accessed October 11, 2012).
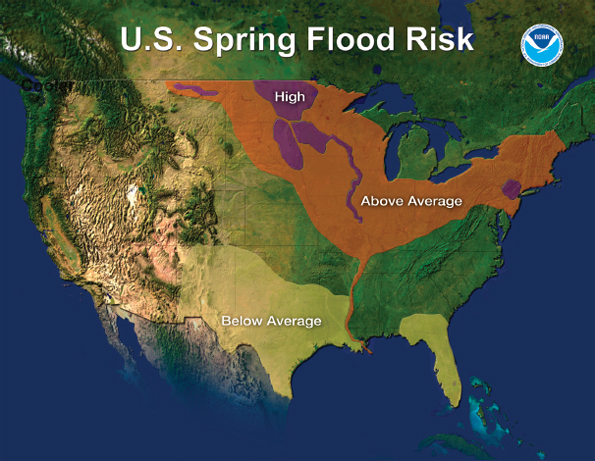
FIGURE 1.1 The spring flood risk outlook from NOAA’s National Weather Service for 2011. Extensive flooding of Mississippi and Missouri rivers occurred in 2011. SOURCE: http://www.noaa.gov/extreme2011/mississippi_flood.html (accessed October 11, 2012).
WHAT IS A CLIMATE MODEL?
Information about the future of the climate system comes from computer models that simulate the climate system. Climate models are mathematical representations of physical, chemical, and biological processes in Earth’s climate system (Figure 1.3). Computer models are a part of everyday life—there are models that forecast weather, simulate how to fly an airplane, predict tides, and aid in drug discovery. Models are used to study processes that are inherently complex, require large amounts of information, or are impractical to study directly. They are essential tools for understanding the world and allow climate scientists to make projections about the future.
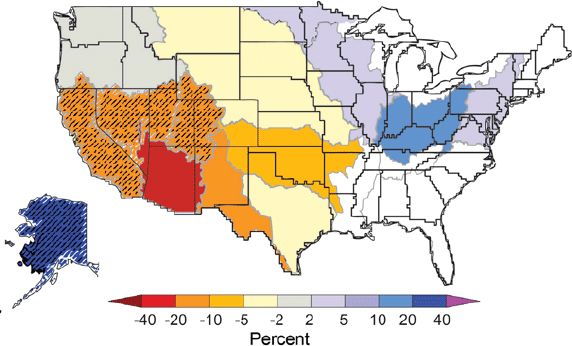
FIGURE 1.2 Longer-time-scale climate projections can assist in long-term planning. The figure shows projected changes in annual average runoff for 2041-2060 relative to a 1901-1970 baseline by water resource region, based on analyses using emissions that fall between the lower and higher emissions scenarios. Lower average runoff is expected in the Southwest and greater runoff is projected for the Northeast. Colors indicate percentage changes in runoff, with hatched areas indicating greater confidence due to strong agreement among model projections. SOURCE: USGCRP, 2009.
The many different kinds of climate models are all derived from fundamental physical laws such as Newton’s laws of motion and the chemistry and thermodynamics of gases, liquids, solids, and electromagnetic radiation. These are supplemented by empirical relationships determined from observations of complex processes such as ice crystal formation in clouds; turbulent mixing, and waves in both air and water; biological processes; sea-ice growth; and glacier movement.
The main components within a climate model include
• atmosphere (simulates winds, temperatures, clouds and precipitation, turbulent mixing, transport of heat, water, trace chemicals and aerosols around the globe),
• land surface (simulates surface characteristics such as vegetation, snow cover, soil water, rivers, ice sheets, and carbon storage),
• ocean (simulates temperature, current movements and mixing, and biogeochemistry), and
• sea ice (simulates thickness, fractional cover, ice drift, effects on radiation and air-sea heat and water exchanges).
In climate models, the globe is divided into a three-dimensional grid of cells representing specific geographic locations and elevations. Current global models that run simulations over thousands of years typically use resolutions with 100- to 200-km grid cells. The equations for each component of the climate system are calculated on a global grid for a set of climate variables (e.g., temperature, precipitation). Weather forecasts are now routinely issued out to a week or more in advance, but weather forecasts are intrinsically limited by chaos for periods beyond 1-2 weeks. The atmospheric part of a climate model is functionally identical to a weather forecast model, but the climate model is run far longer to simulate interactions between atmosphere, land, ocean, and cryosphere on time scales of months to millennia. In these projections, individual simulated weather systems are not expected to match reality; only statistics of the
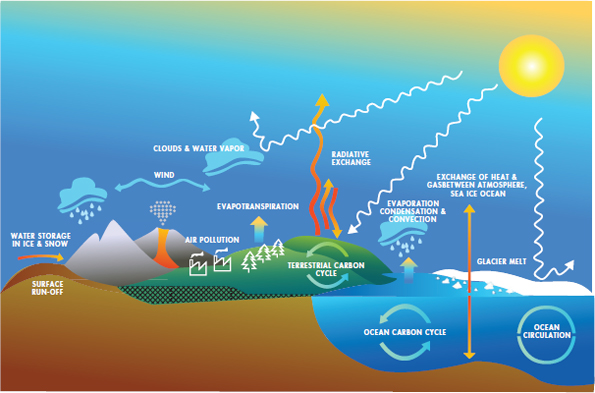
FIGURE 1.3 Climate models are mathematical representations of the physical, chemical, and biological processes in the Earth system. SOURCE: Marian Koshland Science Museum.
simulated weather such as the mean and year-to-year range of annual rainfall can be predicted or compared with observations.
Climate models are computationally intensive; in fact, increases in computational power over the past 50 years have been a major driver in the advancement of climate models. The development of modern-day climate models can be traced back to the first hand-calculated numerical prediction of weather in the 1920s. However, it was not until the prevalence of electronic computers in the 1960s that the extensive numerical demands of even a minimal description of weather systems were met. The possible grid size of a climate model is dependent upon the available power of the computer used to run the model. A finer spatial resolution requires a larger number of grid cells and a shorter integration time step and therefore more computation time to perform the simulation. Likewise, a coarser resolution has fewer grid points and provides less detailed results and a less faithful representation of the effects of small-scale features such as mountains or coastlines (GFDL, 2011). Figure 1.4 shows how a climate model with 50-km horizontal grid spacing can simulate annual mean precipitation over the complicated mountainous terrain of the western United States much more accurately than can the same model run at 300-km or 75-km resolution (to note, practical considerations mean that the greater computational expense of running at higher resolution reduces the number of realizations that can be generated).
WHAT IS THE CURRENT STATE OF CLIMATE MODELING?
Climate modeling activity is extensive both in the United States and internationally. Climate models have advanced over the decades to become capable of providing much useful information that can be used for decision making today. But there are and will continue to be large uncertainties associated with climate information, which users will have to understand and incorporate into their decision making.
Climate Modeling in the United States
Climate modeling activities that examine the entire planet are referred to as “global models,” and those that focus on specific parts of the globe are called “regional models.” Global modeling activities are generally larger and more resource-intensive efforts. The current U.S. organizational structure for global climate modeling has multiple centers that develop and use climate models in largely independent efforts. These institutions coincide primarily with U.S. funding agencies: the National Science Foundation (NSF) and Department of Energy (DOE) support the National Center
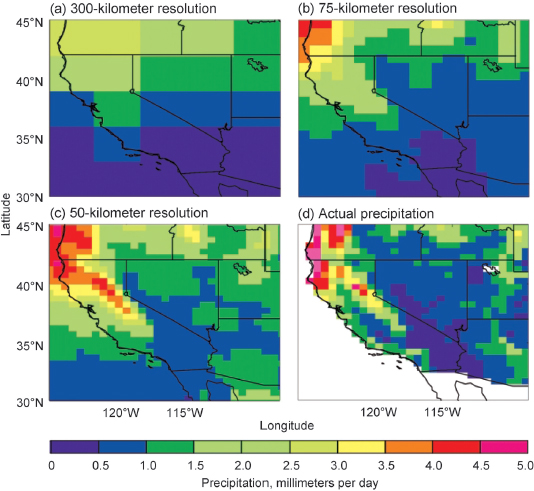
FIGURE 1.4 Annual-mean precipitation in the western United States simulated by a climate model with three different resolutions (300, 75, and 50 km) compared with observational data (VEMAP) at 50-km resolution. The higher-resolution model (c) shows better agreement with observations (d). SOURCES: Walter, 2002, based on Figure 13 in Duffy et al., 2003.
for Atmospheric Research (NCAR), NOAA supports the Geophysical Fluid Dynamics Laboratory (GFDL) and the National Centers for Environmental Prediction (NCEP), and the National Aeronautics and Space Administration (NASA) supports efforts at both the Goddard Institute for Space Studies and the Goddard Space Flight Center. Global climate models are run on supercomputers and use data storage facilities housed both inside and outside the labs (Figure 1.5). Many of these climate models, especially those centered at NCAR, rely on computer code derived through major collaborations with outside developers from other national and international labs and academia.
The largest climate modeling efforts at NCAR and GFDL involve the full-time efforts of more than 100 Ph.D.-level scientists, software engineers, and other support staff and budgets on the order of $10 million or more, as does NCEP’s operational weather and climate forecasting effort.
Regional climate modeling activities in the United States are even less centralized. There are many regional modeling activities, both within and outside the United States, with more focus on developing regional climate change scenarios for specific regions, but efforts on model development, evaluation, and analysis are limited compared to the global modeling efforts. This is natural given that there are many regions and local issues of concern. In the United States, most regional modeling is focused around a few basic modeling codes such as the Weather Research and Forecasting model, but each group typically customizes important details of such a model to its own region and applications. Regional climate models are often run on small, cheap, widely available computer clusters rather than supercomputers.
Although the federal government is a key player in climate model operation and development, academia and the private sector also have important roles. A few
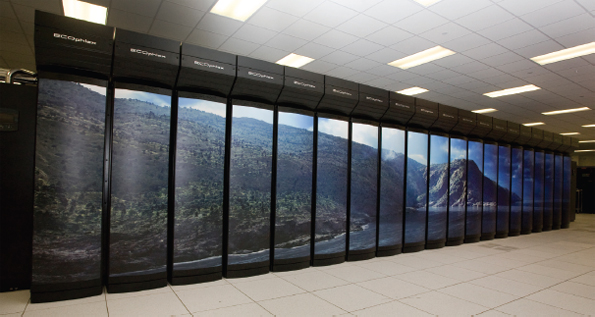
FIGURE 1.5 Global climate models are run on supercomputers, like the NOAA climate research supercomputer Gaea at Oak Ridge National Laboratory in Tennessee (pictured). It has a peak speed of 1.1 petaflops (more than 1,000 trillion calculations per second). SOURCE: ORNL photos/Jay Nave (http://blogs.knoxnews.com/munger/2011/12/noaas-petascale-computer-for-c.html).
universities run their own climate modeling centers, albeit on smaller scales than the large modeling centers listed above. University-based research plays a crucial role in efforts to better understand processes in the climate system that can lead to improved parameterizations in models. It also advances theoretical understanding of the climate system, often with the aid of models and model output from the large centers. The universities also train graduate students that may eventually work with global and regional climate models. The private sector is an emerging player in climate modeling. Many consulting firms analyze climate model output to assess likelihood of key climate change variables at the regional scale. Overall, such ill-defined boundaries make it difficult to estimate (or even define) the size of the U.S. climate modeling enterprise, in either dollars or personnel.
Climate Modeling Internationally
Many other countries are also engaged in large climate modeling efforts. There are major global climate modeling centers in Canada, England, France, Germany, China, Japan, Australia, Norway, and Russia. The Earth Simulator supercomputer in Japan has been over the past few years a noteworthy cutting-edge platform for ultra-high-resolution climate simulations. Regional climate modeling efforts are more widespread internationally, including in several Latin American and European countries. Several global weather forecasting centers (e.g., NCEP in the United States, the UK Met Office and the European Centre for Medium-Range Weather Forecasts in England) are also involved in seasonal and longer-term climate forecasting, provide gridded “reanalyses” of the global state of the atmosphere every 6-12 hours over the past 25-50 years that are widely used (with caveats) by climate researchers, and have improved their weather models in ways that also benefit climate simulation.
Important international activities related to climate modeling are the Intergovernmental Panel on Climate Change (IPCC) and the Coupled Model Intercomparison Project (CMIP) (see Figure 1.6). The IPCC was established in 1988 by the World Meteorological Organization (WMO) and the United Nations Environment Programme to conduct assessments of the scientific basis for understanding the risk of human-induced climate change, its potential impacts, and options for adaptation and mitigation (IPCC, 1998; WMO, 1988). The IPCC Fourth Assessment Report (AR4) reports utilized publications based on the outputs from the CMIP3 project (discussed below) contributed by 23 different climate models from 16 research groups around the world to come to their conclusions (Meehl et al., 2007). Because of the extensive nature of an intergovernmental climate assessment, producing the IPCC reports is an inherently difficult task
and involves thousands of people with different expertise, cultures, interests, and expectations.
Another important international activity is CMIP. It was established in 1995 under the auspices of the Working Group on Coupled Modeling. CMIP sponsors international comparisons of climate models, of which the last two, CMIP3 and CMIP5, have been coordinated with the IPCC Fourth and Fifth Assessment Reports (AR4 and AR5), respectively. The comparisons use standardized specifications of model inputs and standardized output formats agreed on by an international committee, and an extensive suite of model outputs is archived and made publically available for the science and applications communities. The DOE-funded Program for Climate Model Diagnosis
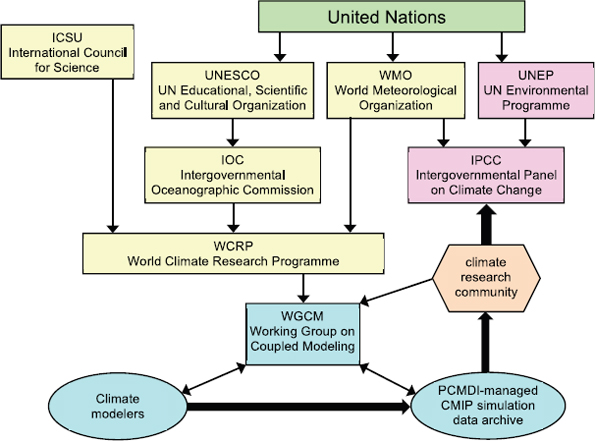
FIGURE 1.6 This figure shows the relationship among IPCC, CMIP, and PCMDI with respect to the larger climate research community. CMIP and IPCC are managed by separate organizations within the United Nations but are coordinated in the timing of their activities. SOURCE: Taylor et al., 2012.
and Intercomparison (PCMDI) at Lawrence Livermore National Laboratory has been instrumental in developing CMIP, including archiving, analysis, and quality control of model output, although CMIP now has broad international institutional support. CMIP has developed into a vital community-based infrastructure in support of climate model diagnosis, validation, intercomparison, documentation, and data access.
What Can Climate Models Do Well?
Climate models have evolved into remarkably sophisticated tools for addressing a diverse range of scientific and societally relevant issues. Their fidelity can be assessed by comparing them statistically with such observations (Box 1.2) as the mean seasonal cycle, seasonal extremes of temperature, rain and snowfall, and other routinely measured quantities around the globe, as well as statistics of the El Niño-Southern Oscillation and other important forms of climate variability and the observed changes of climate over the past century and across previous eras. The evolution of climate models over the past 50 years and the diversity of models used for different purposes and across different space and time scales are discussed in more detail in Chapter 3.
Climate models skillfully reproduce important, global- to continental-scale features of the present climate, as assessed in more detail by IPCC (2007c, Chapter 11). For instance, over most parts of the globe, the simulated seasonal-mean surface air temperature is within 3°C of observations (IPCC, 2007c), compared to an annual cycle that can exceed 50°C in places, and simulated seasonal-mean precipitation has typical errors of 50 percent or less on regional scales of 1,000 km or larger that are well resolved by these models (Pincus et al., 2008). In the oceans, projected seasonal-mean sea-surface temperatures are within 1-2°C of those observed over most of the globe, and major ocean current systems like the Gulf Stream are correctly positioned (IPCC, 2007c). The simulated seasonal patterns of sea-ice extent, snow cover, and cloudiness are also in broad agreement with observations (IPCC, 2007c; Pincus et al., 2008). Swings in Pacific sea-surface temperature, winds, and rainfall associated with El Niño are simulated by a number of climate models with fairly realistic amplitude, location, and period (AchutaRao and Sperber, 2006; Neale et al., 2008). Other forms of natural climate variability, such as the year-to-year range of seasonally averaged temperature or rainfall over regions of 1,000 km or larger in size and their spatial patterns of year-to-year variability, are also simulated reasonably well (Gleckler et al., 2008). Simulation of the statistics of extreme hot and cold spells has also improved (IPCC, 2007c), especially in models using grid spacings of less than 100 km. In many ways climate models have become remarkably accurate tools for simulating observable statistical aspects of the Earth system (see Chapter 3 for more details of historical model improvements).
Climate models do have well-known limitations for simulating the current climate, stemming from both the coarseness of their grid spacing and the challenge of encapsulating the complex physical interactions between all parts of the climate system. For instance, the grid of current climate models cannot represent fine-scale details of mountain ranges important for simulating snowpack, rainfall, and glaciation in such regions, details of coastal processes such as oceanic upwelling or tidal currents, or hurricanes and severe thunderstorms. Tropical rainfall and many cloud processes rely on interactions between very small scale air motions and other processes such as condensation or freezing that are also not straightforward to represent in current climate models. Other limitations include a lack of fully coupled land-ice or ocean biogeochemistry models in many simulations, which are areas of active research but which are just starting to be included in climate simulations. Furthermore, credible simulations of some processes, such as the formation of continental ice sheets, would require model runs of tens of thousands of years that are not yet feasible on current computers.
The main concern among scientists, decision makers, and the interested public is the extent to which climate projections can be trusted based on model simulations for the next decades, the next century, and beyond. Here the crucial problem is that human greenhouse gas and aerosol emissions are quickly moving the climate outside its natural range over at least the past few million years, so it is doubtful that the past can act as a guide to the future. Furthermore, theory, observations, and climate models all point to strong positive internal feedbacks within the climate system that increase its response to changes in its composition. How can we be sure our best climate models can reliably simulate not only the current climate, but also how human influences (presupposing we know what they will be) will change climate?
The best indicators are (i) the ability of models to simulate observed climate change of the past 150 years and especially the more rapid and more comprehensively measured changes of the past 30 years, and (ii) the spread in projections made using different climate models or model versions, both taken in the context of paleoclimate observations and simulations that suggest circumstances that may favor abrupt or rapid changes in climate regime. Comparisons of multiple state-of-the-art models against one another (and observations) advance understanding of the climate system and help build trust in model projections. Intermodel differences provide a lower bound on the uncertainty of climate projections. They may miss sources of error common to all current models; one might hope that, as climate models become more comprehensive, the likelihood of such errors diminishes as long as the model components and their interactions are carefully tested against observations. Chapter 10 of
BOX 1.2 HOW DO CLIMATE MODELS GET EVALUATED?
As the IPCC report Climate Change 2007: The Physical Science Basis notes, “there is considerable confidence that climate models provide credible quantitative estimates of future climate change, particularly at continental scales and above” (IPCC, 2007c). There are three primary reasons for this confidence: (1) As noted above, the fundamentals of a climate model are based on established physical laws, such as laws of conservations of energy, mass, and momentum. (2) Climate model simulations are routinely and extensively assessed by being compared with observations of the atmosphere, ocean, cryosphere, and land surface (Figure 1). (3) Climate models are able to reproduce features of past climates and climate changes (e.g., the warming of the past century, and the mid-Holocene warming of the Northern Hemisphere 6,000 years ago).
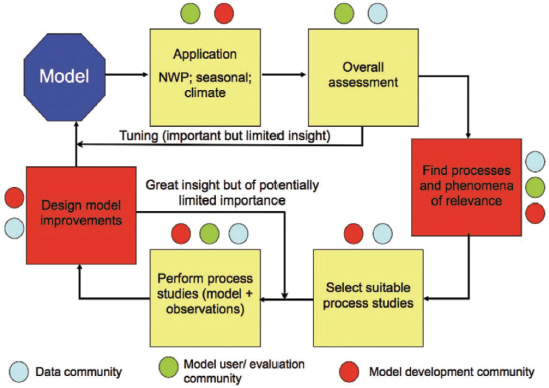
FIGURE 1 Climate model development and testing involves multiple stages and the contributions of the model development community, the model user/evaluation community, and the data community. SOURCE: Jakob, 2010.
Current climate models are calibrated during their development process to match observations within reasonable uncertainty ranges. However, the warming to date due to greenhouse gas increases has been partially compensated by an uncertain amount of cooling caused by human-induced enhancement of light scattering by aerosols and by their effect on clouds; this compensation has been estimated to be from 20 to 70 percent (with 90 percent confidence) based on a range of observational and model-based studies (IPCC, 2007d). Over the 21st century, global aerosol emissions are expected to not increase further, but greenhouse gas emissions are likely to accelerate for at least the next few decades, so this compensation will become less significant. Because of the uncertain cooling by aerosols the current warming cannot be used to constrain the “climate sensitivity.” Thus, the simulated 21st-century global-average warming varies across the international suite of climate models with a range of approximately 30 percenta as is further discussed in Chapter 4.
Models provide quantitative estimates of future climate change, but with significant sources of uncertainty—lack of knowledge, or imperfect knowledge about specific quantities or the behavior of a system. These include the uncertainty in the “forcing” on the climate system from future greenhouse gas and aerosol emissions, as well as natural processes such as volcanic eruptions and solar variability, used as inputs to climate models; the uncertainty in the climate system response to this forcing; the uncertainty from natural internal variability of the climate system; the uncertainty from incomplete representations of known but complicated and small-scale processes (such as cumulus clouds) and of poorly understood processes (such as ice nucleation in clouds); and the uncertainty from “unknown unknowns” (see Chapter 6 for more information on uncertainty).
___________________
a More specifically, the interquartile range is 30 percent of the mean, where the interquartile range is a measure of statistical dispersion, and measures the difference between the 75th percentile and the 25th percentile of the data.
IPCC (2007c) discusses some other strategies that are also used to estimate or bound model uncertainties.
Figure 1.7 shows which aspects of climate can be most robustly predicted, separated by phenomenon and time scale, based on such assessments. In general, climate models more robustly predict trends at larger space and time scales, and they predict temperature trends more reliably than precipitation trends. They all project a reduction in summer sea-ice extent, but not as large as that observed in recent years. They robustly predict the contribution to global sea-level rise from heat uptake in the oceans, but most do not include a representation of ice-sheet melt and the disintegration of the tongues of large glaciers that may considerably accelerate sea-level rise over the next century. They agree that the polar regions will become wetter and that the subtropics will become drier, but they do not agree on which regions of the subtropics will experience strong drying. As climate models become more comprehensive and their grid scale becomes finer, they can provide meaningful projections of more parts of the climate response and their possible feedbacks on the overall climate system, but this does not necessar-
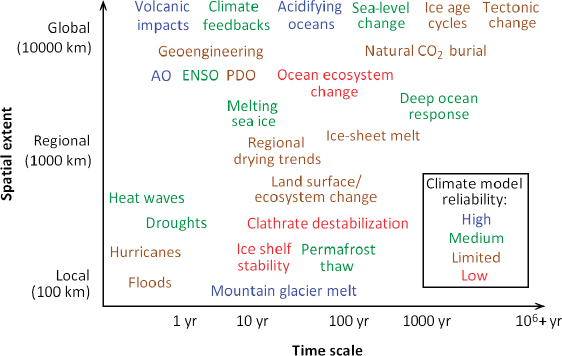
FIGURE 1.7 Time and space scales of key climate phenomena. Color coding shows relative reliability of climate model simulations of these phenomena (or their statistics in the present climate, for climate variability/extremes).
ily reduce projection uncertainty about some aspects of climate change. Indeed, global climate sensitivity, defined as the global warming simulated by a climate model in response to a sustained doubling of atmospheric CO2 concentrations, still shows a similar 30 percent spread3 across leading models as it did 20 years ago.
Climate Information Delivery to Users
Although a number of aspects of the climate system can be projected with some degree of confidence, this climate information may not be useful for making decisions. As climate models have become more ambitious, so have their users. Many users of climate model outputs need to make decisions on how or whether to respond to climate change, in some cases within institutions where the reality or importance of climate change is not universally acknowledged. Users consider the information from the climate models a valuable commodity, but they are not always sure what data are available to them or how to best use them to inform their decisions. The research community, both by limited capacity and by culture, is often hard pressed to respond to the desires of the user community for new types of model output at high time and space resolution. Quantifying uncertainty in climate projections is still a multifaceted research problem, making communication of relevant uncertainties with diverse user groups challenging, especially when these uncertainties are perceived to be discouragingly large or the climate model output is only part of a modeling chain.
WHY THIS STUDY?
With many studies and reports showing that there will likely be significant impacts as a result of climate change (IPCC, 2007a,b,c; NRC, 2010a,b,d,e, 2011a), now is an appropriate time to examine the capabilities of the nation’s climate modeling enterprise to ensure that it is advancing adequately. The modeling community has already developed plans to make continued progress over the next 3-5 years. However, both the climate science and applications communities would enormously benefit from a major advance in improving the usefulness of climate projections, especially on regional space scales and decadal time scales and including trends in extreme events. Is this possible? Is this likely? How can the United States best position itself to advance and better use climate models? What resources and planning will that take? The need has arisen for a forward-looking, comprehensive, strategic assessment of how best to improve the United States’ capabilities to simulate past, present, and future climate on local to global scales and at decadal to centennial time scales.
___________________
3 This is a 30 percent interquartile spread; see previous footnote for definition of interquartile.
In recognition of this need, the Committee on a National Strategy for Advancing Climate Modeling was tasked by NOAA, NASA, DOE, NSF, and the intelligence community to produce a high-level assessment, providing a strategic framework to guide progress in the nation’s climate modeling enterprise over the next 10-20 years (see Appendix A for the full statement of task).
STRUCTURE OF THIS REPORT
In response to the statement of task for this committee (Appendix A), this study has built upon recent efforts to engage and coordinate the national and international climate modeling community, recent NRC and interagency reports that have made recommendations about both U.S. climate modeling and its role in the broader and more diverse climate research and applications communities, and recent actions and progress by federal agencies and other domestic groups. Ultimately, the report attempts to provide a coherent set of recommendations understandable to nonexperts (Box 1.3 includes the definition of a number of key terms), and to set out a comprehensive, unified, and achievable vision for climate modeling for the next decade and beyond that can form the basis of a national strategy that advances climate models, climate observations,4 and user needs.
To obtain advice from a broad spectrum of climate modelers, researchers using climate model output, and the diverse and growing community of users of climate model outputs and projections, the committee convened a 50-person community workshop to engage with leaders from the modeling and user communities. During day-long open sessions at four other meetings, the committee heard from other stakeholder groups, both nongovernmental and from various levels of government, that are trying to use climate projections for long-term planning (Appendix B has more detail on the information-gathering process). The presentations and discussions encompassed global and regional models, downscaling, computing and data, user needs and education, the role of the private sector, and cultivating a coordinated national modeling and user community that spans many goals and applications.
___________________
4 One cannot consider advancing climate modeling without attention to the supporting climate observations, both space-based and in situ, needed to initialize, force, and validate climate models, as well as for monitoring climate variability and change. The United States currently does not have a coordinated climate observing system, or a strategy that could lead to a coherent system, across both in situ and remotely sensed observations. As noted in the report Improving the Effectiveness of U.S. Climate Modeling (NRC, 2001b): “the lack of a suitable sustained observing system for climate limits progress in climate modeling.” This statement still rings true today, and therefore this report only discusses observations at a high level.
The committee was charged with examining “decadal to centennial” time scales (Appendix A) but decided to extend the report to also touch on shorter time scales, including intraseasonal to interannual (ISI) time scales, even though ISI climate prediction has recently been assessed by another NRC report (NRC, 2010c). Four motivations for this were the following: (1) Seasonal to interannual prediction is a valuable test of climate models, because phenomena that evolve on this time scale like El Niño have been well observed for more than 25 years, during which they have gone through enough cycles to allow the seasonal prediction skill of climate models to be tested and compared. (2) Decadal prediction of climate is a natural extension of interannual climate prediction, because it also requires a detailed initial knowledge of the ocean state. (3) For many users, simulation of climate variability about the long-term trends we project is also very important; ISI simulations observationally test aspects of the skill of climate models in predicting this variability. (4) Currently, ISI climate prediction is a nexus between U.S. operational weather and climate forecasting at short time scales (e.g., as performed at NCEP) and research-oriented climate modeling at long time scales. Hence, it may be a fruitful arena to explore closer interactions between the operational and research modeling communities.
This report is structured in three sections. In addition to the introduction in this chapter, this first section reviews the history of previous reports as context for this report (Chapter 2). Building on that background material, the second section of the report examines a number of the issues that are currently facing the U.S. climate modeling community. These issues include climate model hierarchy, resolution, and complexity (Chapter 3); scientific frontiers in climate modeling (Chapter 4); integrated climate observations (Chapter 5); characterization, quantification, and communication of uncertainty (Chapter 6); the climate model development workforce (Chapter 7); the relationship of U.S. climate modeling efforts with international efforts (Chapter 8); and operational climate prediction systems (Chapter 9).
This final section of the report examines several key issues in the U.S. climate modeling enterprise where the committee presents its primary recommendations and an overarching national strategy for advancing climate modeling in the United States over the next two decades. These issues include the challenges and opportunities related to computational infrastructure (Chapter 10), unified climate modeling (Chapter 11), interfacing with the trained climate model user and educational communities (Chapter 12), and optimizing U.S. institutional arrangements (Chapter 13). A number of specific recommendations are presented throughout the text. These recommendations are synthesized into an overarching strategy in the final chapter of the report (Chapter 14).
BOX 1.3 DEFINITION OF KEY TERMS
Boundary conditions: External data input into climate models that define conditions that are fixed relative to the dynamic elements of those models. In the case of Earth system models, the boundary conditions define the orbit of Earth, the land/ocean cover, the height of the mountains, drainage basins and paths of rivers, and the radiation from the sun, among other things. See also Forcings.
Climate models and Earth system models: Climate models are computer codes that encapsulate the physical laws governing the motions and cycles of energy and water in the atmosphere, ocean, and land surface, including sea ice and snow. Earth system models are climate models that additionally incorporate representations of the chemical and biological processes that control the cycling of human-produced and natural aerosols, as well as biogeochemical substances including carbon, nitrogen, and sulfur. Some Earth system models also represent ice sheets and climate-induced changes in the distribution of different types of vegetation.
Climate predictions and projections: Climate predictions are model simulations that are started from our best estimate at the state of the climate system at a particular time. Climate projections, on the other hand, are simulations started from a statistically representative initial state. Both predictions and projections are made using estimates of future values of the forcings. The goal of projection is to look at the statistics of the simulated climate and how they change; the goal of prediction is to forecast the evolution of the actual climate state, including variations in El Niño or the Atlantic meridional overturning circulation.
Common modeling framework: A group of programs that provides a high-performance, flexible software infrastructure, which enables climate models to run on very large parallel computers and that supports coupling diverse, modular climate model components.
Data assimilation: The process of making best use of observational data to provide an estimate of the state of the system that is compatible with a given model and that is better than could be obtained using just the data or the model alone.
Forcings: External data input into climate models that drive climate variations and change (e.g., greenhouse gas concentrations, volcanic aerosols, and solar irradiance variations).
Model fidelity: The measure of agreement between the statistical distributions of a climate variable or group of variables as simulated by a model compared with observations (e.g., the seasonal and geographical root-mean-square difference between simulated and observed rainfall over 1980-2010).
Model forecast skill: The typical accuracy of a forecast, e.g., as measured by the agreement between realistically initialized model predictions of some variable (e.g., winter-mean surface air temperature over Kansas based on model predictions from 6 months before) and their corresponding verifications over some period. The relation of fidelity to skill is similar to that between prediction and projection. In particular, model fidelity (correctly predicting the statistical distribution of this quantity) need not imply model skill (skillfully predicting warm winters when they are observed).a
Multimodel ensemble: A set of simulations from several different models, forced by the same external forcing. Considerable evidence suggests that an average over simulations from different models produces a better match to observational climatological distributions than similar-sized averages of simulations from any single model.
Perturbed physics experiments: Multiple simulations from the same models using a plausible range of parameters or representations of physical processes. These simulations make it possible to analyze the sensitivity of simulation results to some of the choices made in model development.
Operational climate prediction: Distinct from climate model research and development, operational climate prediction is a regularly scheduled, user-driven, product-oriented process that conforms to a specified schedule of generation and delivery of products and that depends on dedicated computing and information delivery resources with failsafe contingency plans.
Parameterization: The process of representing the effects of processes other than resolved-scale fluid motion (e.g., cumulus cloud dynamics and microphysics; land-surface or sea-ice modeling; or transfer of heat, salt, and nutrients in unresolved oceanic eddies) in a climate model by using the resolved fields whose time evolution is predicted by the model.
Reanalysis: The process of reassimilating historical observations of atmospheric and oceanic quantities such as temperature, pressure, wind, humidity, current, and salinity using fixed stateof-the-art models and data assimilation techniques to produce long time series of global fields.
Regional climate models: Climate models that are restricted to a portion of the globe so as to reduce the computational cost and thereby increase the spatial resolution, and which use the output of a coarser-resolution global climate model at their boundaries. Such models are often used in “downscaling,” the process of representing global climate model output at the relatively small spatial scales that are more relevant to decision makers. Regional climate models sometimes include greater scientific complexity that can inform particular applications and decision makers.
Seamless prediction: Viewing weather and climate prediction as problems that share common processes and dynamics and that can be addressed using modeling approaches that span a broad range of time scales and spatial resolutions.
Tuning: The process of adjusting the values of parameters used in climate models to achieve the best fit to observations in a dependent control data set. The values are adjusted only within the range of observational uncertainty of those parameters.
Uncertainty: Lack of knowledge or imperfect knowledge about specific quantities or the behavior of a system.
Unified modeling across time scales: The ultimate realization of seamless prediction whereby a single climate model is used to predict the weather, seasonal climate, and decadal climate change.
___________________
a There is some evidence that model fidelity and prediction skill are related (see DelSole and Shukla, 2010).


