
Human Geography
and Water Resources
Water use and scarcity are functions of water supply and demand. This chapter focuses on the demand for water, with an emphasis on the social factors affecting water use and availability: population growth, distribution, and migration; types and distribution of water use including irrigation; clean water and sanitation access; infrastructure; and institutions. Finally it includes a discussion of methods for measuring and managing water scarcity.
POPULATION DISTRIBUTION
AND MIGRATION
The study region includes some of the most densely populated areas on Earth as well as some of the least densely populated regions, with a stark increase in population density as one moves from the mountains to the ocean. As of 2010, India alone was home to about 1.2 billion people, while Bangladesh and Pakistan each contained about 149 million and 174 million people, respectively. Nepal had a smaller population of about 30 million, while Bhutan was home to about 726,000 people (United Nations, 2011a).
The water dependencies and vulnerabilities of populations living in lower-lying areas will be quite different from the dependencies and vulnerabilities of populations in higher-lying ones. However, demographic compositional data are collected through national censuses and surveys and are reported by administrative units, such as provinces and states, which typically do not conform neatly to geographic features of interest, such as river basins or zones of elevation. By using a spatial population model of gridded population counts, though, it is possible to at least estimate the current population of each country living in the watersheds of interest in this study. This can be further segmented into coarse elevation zones (low, below 1,000 m; high, above 4,000 m; and moderate, between 1,000 and 4,000 m). In this report, the Committee uses both Global Rural Urban Mapping Project (GRUMP) (CIESIN, 2004) and Landscan (2010) population data to estimate populations at risk, relying on the former when estimating urban populations1 and the latter when estimating population distribution per se.
Nepal and Bhutan are wholly contained within the Ganges and Brahmaputra river basins, and most of Pakistan is found within the Indus Basin. Bangladesh lies within the Ganges, Brahmaputra, and Meghna basins; and India has territory within all of these basins, though much of India’s land area also falls outside the main study watersheds (Figure 3.1). Note, as discussed in Chapter 1, that the population density of the Himalayan Endorheic basins is very small, and therefore the Committee focused the discussions in this chapter on the Indus and Ganges/Brahmaputra basins. Estimates of the shares of national populations living in these basins are presented in Table 3.1.
In 2010, approximately 195 million people lived in the Indus Basin, with 16 percent of them (31.9 million) living at elevations above 1,000 m (Table 3.2). In contrast, nearly all (97 percent) of the more than
_________
1 GRUMP data rely primarily on nighttime lights to delineate urban areas and therefore provide a cross-nationally consistent basis by which to measure urban areas (Balk, 2009).
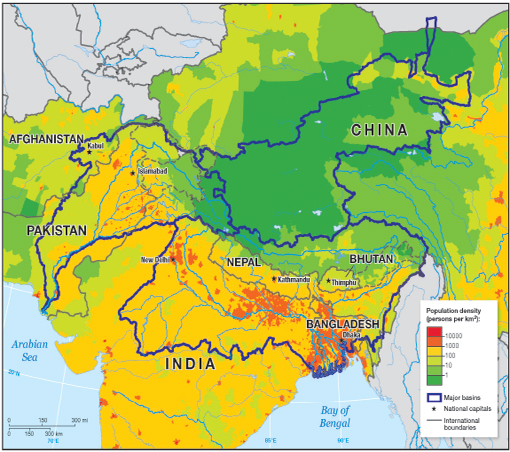
FIGURE 3.1 Population distributions in the HKH region. Population data were taken from the Global Rural/Urban Population Mapping Project. Dashed lines indicate disputed political boundaries, following the guidance issued by the U.S. State Department, and this Committee takes no position on these boundary disputes.
TABLE 3.1 Shares of National Populations Living in Hindu-Kush Himalayan Region Water Basins
| Country | Basin | Population in Basina | National Populationb | National Population Living in Basins (%) |
| Afghanistan | Indus | 10,636,154 | 31,412,000 | 33.9 |
| Bangladesh | Gang/Brahm | 103,326,928 | 148,692,000 | 69.5 |
| Bhutan | Gang/Brahm | 699,847 | 726,000 | 96.4 |
| China | Gang/Brahm | 1,712,145 | ||
| Indus | 35,585 | 1,348,932,000 | 0.13 | |
| India | Gang/Brahm | 466,738,395 | ||
| Indus | 36,074,708 | 1,224,614,000 | 38.1 | |
| Nepal | Gang/Brahm | 28,951,851 | 29,959,000 | 96.6 |
| Pakistan | Indus | 148,104,460 | 173,593,000 | 85.3 |
| a Landscan (2010). | ||||
| b United Nations (2011a). | ||||
600 million people in the Ganges/Brahmaputra Basin live at elevations below 1,000 m.2 Most of those living below 1,000-m elevation are in India (79 percent) and Bangladesh (18 percent; Table 3.3). Even in Nepal, where 29 million people live in this basin, almost two-thirds live below 1,000-m elevation. Even in mountainous Bhutan, more than one-quarter of its population in the Ganges/Brahmaputra basin lives at an elevation below 1000 m.
On a global scale, the countries of this region encompass some of the world’s poorest and least developed areas, alongside areas that are also experiencing rapid economic growth. The region is characterized by relatively low shares of the population living in cities.
_________
2 In Bangladesh, furthermore, nearly 60 percent of the population lives within 10 m of sea level and contiguous to the seacoast.
3 One thing that makes Asia stand out, particularly the subregions dependent on the water resources of the Indus and Ganges/ Brahmaputra deltas, is the number of extremely large cities, or the phenomenon of urban “giganticism” (Preston, 1979).
TABLE 3.2 Population in the Ganges/Brahmaputra and Indus Basins, by Elevation and Country
| Country/Basin | <1,000 m | 1,000 to 4,000 m | >4,000 m | |
| Afghanistan | Population in Indus Basin | 1,701,185 | 8,901,679 | 33,290 |
| Share of basin population living in elevation zone | 16.0% | 83.7% | 0.3% | |
| Bhutan | Population in Ganges/Brahmaputra Basin | 193,974 | 496,887 | 8,986 |
| Share of basin population living in elevation zone | 27.7% | 71.0% | 1.3% | |
| Bangladesh | Population in Ganges/Brahmaputra Basin | 103,326,928 | – | — |
| Share of basin population living in elevation zone | 27.7% | 71.0% | 1.3% | |
| Bangladesh | Population in Ganges/Brahmaputra Basin | 103,326,928 | — | — |
| Share of basin population living in elevation zone | 100.0% | — | — | |
| China | Population in Ganges/Brahmaputra Basin | 1,433 | 866,630 | 844,082 |
| Population in Indus Basin | — | 1,084 | 34,501 | |
| Share of basin population living in elevation zone | 0.08% | 49.6% | 50.3% | |
| India | Population in Ganges/Brahmaputra Basin | 459,157,952 | 7,502,996 | 77,447 |
| Population in Indus Basin | 26,539,558 | 9,431,329 | 103,821 | |
| Share of basin population living in elevation zone | 96.6% | 3.4% | 0.04% | |
| Nepal | Population in Ganges/Brahmaputra Basin | 19,239,788 | 9,604,421 | 107,634 |
| Share of basin population living in elevation zone | 66.5% | 33.2% | 0.4% | |
| Pakistan | Population in Indus Basin | 134,747,024 | 13,159,600 | 197,836 |
| Share of basin population living in elevation zone | 91.0% | 8.9% | 0.1% | |
| Total population in Ganges/Brahmaputra Basin | 581,920,075 | 18,470,934 | 1,038,149 | |
| Total population in Indus Basin | 162,987,767 | 31,493,692 | 369,448 | |
| TOTAL | 744,907,842 | 49,964,626 | 1,407,597 | |
| SOURCE: Data from Landscan (2010). | ||||
In 2000, Pakistan had the greatest percentage—one-third—of its population living in cities. Despite relatively low levels of urbanization, this region is home to some of the world’s largest cities: Dhaka (Bangladesh), Delhi (India), Kolkata (India), Mumbai (India), Karachi (Pakistan), Lahore (Pakistan).3 Cities are growing rapidly, with rates of urban growth that exceed those historically found in the West. In all countries in this region, the average annual rate of change of the urban population exceeds 2 percent, in Nepal and Bhutan, the rates exceed 4 percent per year (United Nations, 2011b). Nevertheless, the pace of urbanization in this region is not historically unusual (NRC, 2003a). Urbanization may also affect water demand. Wealthier and more urban populations, for example, have different dietary possibilities and preferences than their rural
TABLE 3.3 Urban Population Projections as Percent of Total Population, by Country 2010-2050.
| 2010 | 2015 | 2020 | 2025 | 2030 | 2035 | 2040 | 2045 | 2050 | |
| Bangladesh | 28.07 | 30.80 | 33.89 | 37.35 | 41.045 | 44.84 | 48.69 | 52.57 | 56.415 |
| Bhutan | 34.71 | 38.54 | 42.40 | 46.23 | 49.97 | 53.62% | 57.22 | 60.75 | 64.17 |
| India | 30.01 | 31.72 | 33.89 | 36.56 | 39.75 | 43.30 | 46.93 | 50.58 | 54.23 |
| Nepal | 18.62 | 21.58 | 24.78 | 28.18 | 31.74 | 35.47 | 39.38 | 43.42 | 47.56 |
| Pakistan | 35.90 | 37.67 | 39.88 | 42.53 | 45.62 | 49.07 | 52.54 | 55.98 | 59.37 |
SOURCE: Based on data from United Nations (2011b).
counterparts, and changes in diet (e.g., toward consuming more meat) can have implications for agricultural water demand.
Rural dwellers tend to be poorer than their urban counterparts, but there is also substantial urban poverty and slum-dwelling in this region. Water supply and wastewater services in cities and towns are often underdeveloped, and many cities in the region are located in areas of high flood potential, exacerbated by poor urban drainage during monsoons (Moser and Satterthwaite, 2008). Urban poverty itself often exacerbates the development of systems for delivery of water and sanitation, as well as access to those resources when such systems are in place ( Johnstone, 1997).
Nevertheless, cities serve as major magnets for migrants. Most migration takes place within country, between cities themselves, and between rural areas and cities. International migration is a small share of total migration, although some borders are effectively more fluid than others (e.g., between Bangladesh and India).4
Although temporary migration has long been a strategy used by families and households to accommodate climate variability (especially flooding), there is little evidence that climate change or other environmental factors (with the possible exception of long-term drought) result in major migration flows (McLeman and Smit, 2006; Tacoli, 2009). To the contrary, many countries in the region are known for their high adaptive capacity. Yet, theoretically it is possible that long-term changes to cropland and losses of livelihood could make it more difficult to earn a living from farming. Such “livelihood fragility” could affect migration over a much longer time span, albeit through a pathway that is less direct than a single climate-related event or change in the environment (Raleigh, 2011).
Migrants tend to be younger and better educated than those who do not move, and it is these nonmovers who may be regarded as most vulnerable. A recent study found that migration has implications not just for the mover but for those left behind: “Poorer households are likely to be ‘trapped’ in circumstances where they are at once more vulnerable to environmental change and less able to move away from it” (GO-Science, 2011). That said, those who migrate are by no means better off than the native population in their places of destination. New migrants often do not have access to land, housing, safe water and sanitation, or public services (e.g., schooling or health care).
Projected Demographic Trends
Key population-related questions of interest for this study include whether certain watersheds and elevation zones will experience higher rates of population growth than others, and how the demographic composition of those specific areas will change. Existing demographic methods, however, do not allow one to make such fine-grained projections. That being said, one thing that we do know about the distribution of future population is that countries in this region will become increasingly urbanized (Table 3.3) and that cities (which are predominantly at lower altitudes) will continue to absorb migrants in search of economic and other opportunities. Migration has the potential to serve as an adaptive strategy to environmental change—even as the cities that receive the migrants cope with their own set of economic challenges and environmental stresses and vulnerabilities (Hardoy et al., 2001). However, many complex factors beyond environmental change contribute to migration.
Country-level population projections are limited by the fact that they do not have any population-environment interactions or feedback loops built in. This will matter more as projections are made further into the future. Nevertheless, it can be said with substantial confidence that the populations of the countries in this region will grow considerably over the next few decades. India alone is projected to add nearly half a billion people to its population between 2010 and 2050 (Table 3.4). Larger populations will result in increased demand for water and may exacerbate problems of resource scarcity and vulnerability. Over the longer term, though, rates of population growth are projected to become smaller over time (see Table 3.5). The slowing of population growth will be driven by declines in fertility rates, which are in turn caused by, among other things, rising standards of living, decreases in childhood mortality rates, and better access to family planning.
_________
4 The bulk of international migrants from Bangladesh, Bhutan, India, Nepal, and Pakistan stay within the region (DRC, 2007).
TABLE 3.4 Population Projections by Country (thousands) 2010-2050
| 2010 | 2015 | 2020 | 2025 | 2030 | 2035 | 2040 | 2045 | 2050 | |
| Bangladesh | 148,692 | 158,317 | 167,256 | 175,195 | 181,863 | 187,103 | 190,934 | 193,44 | 194,353 |
| Bhutan | 726 | 784 | 829 | 867 | 899 | 924 | 943 | 956 | 962 |
| India | 1,224,614 | 1,308,221 | 1,386,909 | 1,458,958 | 1,523,482 | 1,579,802 | 1,627,029 | 1,664,519 | 1,692,008 |
| Nepal | 29,959 | 32,581 | 35,164 | 37,653 | 39,943 | 41,977 | 43,749 | 45,257 | 46,495 |
| Pakistan | 173,593 | 189,648 | 205,364 | 220,609 | 234,432 | 246,789 | 257,778 | 267,240 | 274,875 |
SOURCE: Based on data from United Nations (2011b).
Types of Water Use
There are many ways to measure water use, and care must be taken when comparing different metrics. The most common type of water use measurement, and the subject of this report, is the quantity of water withdrawn or consumed for human purposes from surface water or groundwater. This type is sometimes called “blue water” use (Falkenmark and Rockstrom, 2006; Hoekstra et al., 2011). Water withdrawal is defined as the amount of water withdrawn from surface water or groundwater for some human use. Some of this water may be returned to surface water or groundwater after use. Water consumption is typically defined as the amount of water withdrawn from surface water or groundwater that is not returned to the system, usually because it is lost to evapotranspiration, incorporated into a final product, or contaminated too badly to be reused.
“Green water” use is defined as the amount of rainwater used by natural vegetation, land cover, and agricultural production primarily through rain-fed crops (Hoekstra et al., 2011). Both green water and blue water (irrigation water) are used for agricultural production in the HKH region. If agricultural development replaces natural land cover with crops with a higher level of evapotranspiration than natural vegetation, it follows that a conversion from natural land cover to crops will decrease the amount of runoff that makes its way into surface water or groundwater.
For water to be useful, it must be available when and where it is needed. Issues of water timing are often critical for both blue and green water use. For instance, many climates have a rainy period when available water exceeds human demand and a dry period when human demand exceeds available water. Because of the mismatch between the natural hydrological cycle and human needs for water, infrastructure is often built to help societies manage water; for example, many times reservoirs are constructed to store water during wet periods for use during dry periods. Similarly, ground-water is often used in the HKH region when surface supplies are insufficient because of seasonality of water flows or short-term droughts.
Water must also be of sufficient quality to be of use, and different water uses require different qualities. Some industrial and urban water uses require high-quality waters; agriculture often uses lower quality waters. When water is highly polluted because of high salinity or concentrations of human or industrial wastes, water quality can become the limiting factor for water availability—in some parts of the HKH region, pollution may reduce overall water availability. Sometimes “gray water” use is also measured. In the water
TABLE 3.5 Population Growth Rates, by Country, 2010-2050
| 2010-2015 | 2015-2020 | 2020-2025 | 2025-2030 | 2030-2035 | 2035-2040 | 2040-2045 | 2045-2050 | ||
| Bangladesh | 6.47% | 5.65% | 4.75% | 3.81% | 2.88% | 2.05% | 1.26% | 0.52% | |
| Bhutan | 7.99% | 5.74% | 4.58% | 3.69% | 2.78% | 2.06% | 1.38% | 0.63% | |
| India | 6.83% | 6.01% | 5.19% | 4.42% | 3.70% | 2.99% | 2.30% | 1.65% | |
| Nepal | 8.75% | 7.93% | 7.08% | 6.08% | 5.09% | 4.22% | 3.45% | 2.74% | |
| Pakistan | 9.25% | 8.29% | 7.42% | 6.27% | 5.27% | 4.45% | 3.67% | 2.86% | |
SOURCE: Based on data from United Nations (2011b).
footprint system of water use accounting, gray water is defined as the amount of water needed to safely dilute a contaminant or problematic compound to a concentration at which the water will be usable for some purpose, which is increasingly important at a river basin scale (Hoekstra et al., 2011; note that this is a different concept from municipal gray water, or sullage).
Any alterations to the water quantity or quality also have the potential to negatively affect freshwater biodiversity or the natural ecosystem services they provide. Often, a certain minimum environmental flow is calculated for a watershed and its watercourses, which if left in surface water and groundwater will be sufficient to maintain freshwater biodiversity and crucial ecosystem processes (Poff et al., 2010). Necessary environmental flows vary significantly between basins depending on the hydrology and ecology.
Key Trends in Water Use
In general, the Committee found water use is greater relative to natural runoff in the Indus Basin than in the Ganges/Brahmaputra Basin, consistent with the findings of other studies (e.g., UNEP, 2008). At a national level, water use relative to availability is lowest in Bhutan and Nepal, intermediate in Bangladesh and India, and greatest in Pakistan.
National-Level Water Use Statistics
Comprehensive and consistent data on water availability and water use are not available for the HKH region, or most other regions of the world (Gleick, 2011). One of the primary sources of data for gross water availability and withdrawals is the Aquastat database maintained by the Food and Agriculture Organization of the United Nations (FAO, 2011). Aquastat data come from a variety of sources, estimates, and surveys, including national-level estimates submitted by national governments. Because of the lack of water availability and water use data, the Aquastat database contains the most widely used estimates of these quantities and is used here to assess broad patterns and trends, but should not be considered scientifically rigorous. As discussed earlier in this chapter, Bangladesh, Bhutan, India, Nepal, and Pakistan have substantial portions of their area contained within the watersheds that make up the study area. National-level water availability and use data are also available for China, but they are not considered here except in the context of the portions of the HKH watersheds shared by China.
One rough measure of water supply is the per-capita availability of water (the total average renewable water supply of a region divided by the population of that region). Another is the ratio of water withdrawals (as an indicator of demand for water) to renewable water availability (as an indicator of water supply). Of the five countries, Bhutan has the largest supply of water, both relative to water withdrawals and on a per-capita basis. Total internal renewable water supply is 78 billion m3 yr-1, and because Bhutan is located high in the Himalayas, there is no significant flow into the country from elsewhere. Total per-capita available water remains high but has fallen slightly over time with population, from 174,000 m3 person-1 yr-1 in 1992 to 109,000 m3 person-1 yr-1 in 2009 as its population has grown. Total water withdrawals were 0.34 billion m3 yr-1 in 2009, or around 470 m3 person-1 yr-1.
As a downstream nation, Bangladesh has greater reliance on external water supplies relative to water withdrawals (Figure 3.2). Total internal renewable water supply is about 100 billion m3 yr-1, supplemented by another 1.1 trillion m3 yr-1 of water that flows in from outside the country. Total per-capita available water has fallen from approximately 10,000 m3 person-1 yr-1 in 1992 to 7,700 m3 person-1 yr-1 in 2008. Total water withdrawals were 36 billion m3 yr-1 in 2008, or around 220 m3 person-1 yr-1.
India’s water withdrawals are closer to water availability than most other countries in the region (Figure 3.2). Total internal renewable water supply is 1,400 billion m3 yr-1, supplemented by another 640 billion m3 yr-1 of water that flows in from outside the country. Total per-capita available water has fallen from 2,100 m3person-1 yr-1 in 1992 to 1,600 m3person-1 yr-1 in 2008. Total water withdrawals are increasing from 500 billion m3 yr-1 in 1990 to 760 billion m3 yr-1 in 2010, or from around 560 m3 person-1yr-1 in 1990 to 640 m3 person-1 yr-1 in 2010. India contains several large watersheds and these national average figures hide significant regional variations. In some basins, total water demands are approaching, or may have reached, the limits of renewable water availability. In other basins, water use already depends on nonrenewable extraction of groundwater resources, which is unsustainable in the long run.
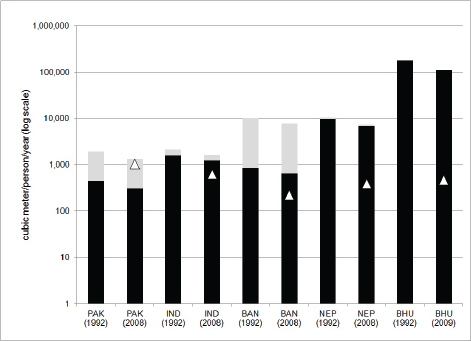
FIGURE 3.2 Available per-capita water and per-capita water withdrawal for countries in the study region. Countries are arranged from greater relative water stress (left) to less relative water stress (right). Note the logarithmic scale on the y-axis. Available per-capita water is shown as a stacked bar-chart for two points in time, showing the portion of available water that originates within a country (internal, black) or that originates in headwaters located in another country (external, gray). The per-capita withdrawal information is shown as a white triangle for the most current time point. PAK= Pakistan, IND= India, BAN= Bangladesh, NEP= Nepal, and BHU= Bhutan. For Nepal, per-capita withdrawal information was available only for the year 2002. For India, per-capita withdrawal information was linear interpolated between the years 2002 and 2010, to estimate the value in 2008. SOURCE: Based on data from FAO (2011).
Nepal has a substantial supply of water in both absolute terms and relative to water withdrawals, on a per-capita basis (Figure 3.2). Total internal renewable water supply is about 200 billion m3 yr-1, supplemented by another 12 billion m3 yr-1 of water that flows in from outside the country. Total per-capita available water has fallen from approximately 10,500 m3person-1 yr-1 in 1992 to 7,300 m3 person-1 yr-1 in 2008 because of population growth. Total water withdrawals were 10 billion m3 yr-1 in 2000, or around 390 m3 person-1 yr-1 in 2002.
Pakistan’s internal water supplies are very limited relative to water withdrawals, on a per-capita basis (Figure 3.2). Total internal renewable water supply is only 55 billion m3 yr-1, supplemented by another 180 billion m3 yr-1 of water that flows in from outside the country. Population growth has reduced total per-capita available water, which has fallen from 1,900 m3 person-1 yr-1 in 1992 to 1,300 m3 person-1 yr-1 in 2008. Total water withdrawals have increased from 160 billion m3 yr-1 in 1990 to 180 billion m3 yr-1 in 2008, but on a per-capita basis have fallen from around 1,300 m3 person-1 yr-1 in 1990 to 1,000 m3 person-1 yr-1 in 2008. Pakistan would not be able to meet its water withdrawal demand without external water resources, primarily from rivers that flow from India into the Indus, as allocated by the Indus Waters Treaty.
National water availability and use data for China are uninformative for this study, because they are dominated by regions of the country outside the HKH study area. Nevertheless, China is the upstream nation on major watersheds of the HKH region; the Tibetan Plateau encompasses the origins of the Ganges (whose headwaters are mostly in India), the Brahmaputra (which joins the Ganges in Bangladesh), and the Indus Rivers. Thus, China can influence the long-term regional management of these rivers. In addition, the Chinese government has announced plans for “leapfrog development” in the Tibetan Plateau, including improving the economic status of farmers and herders and providing services such as education, health, and
social security—with the express purposes of achieving stability and national unity (Xinhua News, 2010). Mining, which requires water (see Xiang [2010] for a study of mining effects on river water quality in Tibet), and hydroelectric dams are part of planned development in the Tibetan region (Watts, 2010). In addition, Chinese plans to divert some regional water resources from the south to its northern regions will also play a role in future regional water politics (Turner, 2011). Further analysis of how climate factors, including glacial retreat, may influence Chinese needs for water and Chinese water policies is needed.
Water for Irrigation
In most countries, the largest sector of water use is the agricultural sector, which withdraws, and consumes through evapotranspiration, large quantities of water for irrigation. The general trend throughout the study area is for increased irrigation water withdrawals to put increasing strain on hydrological supplies of available water. See Box 3.1 for a historical overview of early and modern irrigation systems.
Irrigated area in the study region is shown in Figure 3.3. According to the Global Map of Irrigated Area (Siebert et al., 2007), which is nominally for around the year 2000, irrigation is widespread in the Indus Basin, with a total of 15 million ha equipped for irrigation, the vast majority of which is in Pakistan. However, the national- and basin-level data are rough estimates. According to FAO Aquastat data, Pakistan had about 16 million ha equipped for irrigation in 1990, which had risen to 20 million ha by 2008. Total Pakistan agricultural water withdrawal went from 150 billion m3 yr-1 in 1991 to 170 billion m3 yr-1 in 2008, or from 9,600 m3 ha-1 yr-1 in 1991 to 8,600 m3 ha-1 yr-1 in 2008.
Another useful large-scale dataset (Hoekstra and Mekonnen, 2011) provides estimates of water con-
BOX 3.1 Early and Modern Irrigation Systems
The history of irrigated agriculture in the region goes back to Harappan civilization during the Bronze Age in the greater Indus Basin and adjacent areas. Early irrigators relied on shallow wells, flood inundation canals, and simple diversions from adjacent streams to water farmlands in arid and semiarid regions. With time and the advent of canals, surface waters could be delivered to arable lands that were less proximate to surface-water courses. Canal irrigation expanded most dramatically in South Asia during the 19th and 20th centuries. Canals also allowed irrigators some control over the timing and quantity of water applied to cropland. Groundwater initially became a source of irrigation supply with the development of simple water lifting devices powered by humans and animals. The use of groundwater for irrigation allowed lands to be irrigated in dry seasons during drought periods when surface supplies were diminished or absent altogether
The Persians were early groundwater innovators who developed the Qanat or Karez system of tapping and conveying groundwater. This system required the drilling of multiple wells into alluvial water-bearing formations in foothill environments and then constructing a tunnel that conveyed water underground to elaborate surface-water distribution systems on the plains. This clever system, which is still used in some locations in the Middle East and South Asia (Mustafa, 2011), permitted the extraction of groundwater by gravity and avoided the need to lift the water from the wells. This system required a high level of community cohesion to operate effectively
Much later electrical and diesel pumps were developed that allowed water to be lifted from wells in substantial quantities. Early pumps were limited in the depth from which they could lift water but the later development of modern submersible pumps allowed the pumping of groundwater from great depths. Simultaneously, small inexpensive pumps were developed that allowed growers to lift water to irrigate small farm acreage (Shah, 2009).
Again, historically water was applied through simple flood irrigation technologies where fields were flooded at times of high water Flood irrigation was replaced in many parts of the world by furrow and basin irrigation that allowed the grower more control over the timing and quantities of water application. Over the last 75 years of the 20th century, closed conduit irrigation systems were increasingly developed and employed. These systems, which include various types of sprinklers and, later, drip and sprinkler irrigation systems, allow water to be applied with great precision. These systems are particularly well adapted to irrigate loose agricultural soils where control of infiltration rates is very important in determining irrigation efficiency, and have substantial additional potential. By contrast, surface application systems such as furrows and basins are best suited for farming operations on tight soils where infiltration rates are low and tend to be more constant, particularly where precision land leveling and watercourse improvements were adopted. Modern irrigation technology has resulted in more extensive and more efficient irrigation, particularly when linked with institutional and management reforms. Yet, in many instances, such as South Asia, it has increased the pressure on both surface water and groundwater sources and even threatened the long-term sustainability of the basic water resource (e.g., because of soil and water salinity; CAST, 1988; cf. extensive publications on irrigation in South Asia by the International Water Management Institute).
sumption by basin for irrigation of different crops. Around 120 billion m3 yr-1 of irrigation water were estimated to be consumed through evapotranspiration in the Indus. Total consumptive water use for irrigation is approximately 100 billion m3 yr-1 for the Ganges, much greater than the 1.4 billion m3 yr-1 for the Brahmaputra. More than a third of irrigation water consumed is used for wheat, with rice taking just under a third of the remaining water. Compared with the other basins in the study area, a relatively large amount of irrigated water consumption in the Indus Basin is for cotton production, along with rice, sugarcane, and wheat. In the Brahmaputra Basin, by comparison, around 75 percent of irrigated water was used to grow rice.
Irrigation is very common in the Ganges and less common in the Brahmaputra Basin. The overall Ganges/Brahmaputra Basin supported 29 million ha of area equipped for irrigation around the year 2000, primarily in India but also in Bangladesh. Nepal has much more limited irrigated area because of its climate and topography. According to Aquastat data, India had a total of 62 million ha equipped for irrigation in 2001, which had risen to 66 million ha by 2008. Total Indian agricultural water withdrawal increased from 560 billion m3 yr-1 in 2000 to 690 billion m3 yr-1 in 2008, or from 9,000 m3 ha-1 yr-1 in 2000 to 10,400 m3 ha-1 yr-1 in 2008. Bangladesh had 5 million ha equipped for irrigation in 2008. Total Bangladeshi agricultural water withdrawal was 32 billion m3 yr-1 in 2008, or around 6,300 m3 ha-1 yr-1. Assuming the average Indian application rate of 9,000 m3 ha-1 yr-1 in 2000 is accurate for the irrigated area in the Ganges/Brahmaputra Basin, total withdrawals in 2000 were 260 billion m3 yr-1.
There is very little irrigation in the upstream nations of the Himalayan plateau region (Figure 3.3). The only exception seems to be near Koko Nor (Qinghai) Lake in the Tibetan Plateau and the far northern portions of the study area, which includes parts of northwest Gansu Province of China. Because this small amount of irrigated area is dwarfed by irrigated areas elsewhere in China, the Aquastat statistics on overall irrigation in China are not informative.
Groundwater and surface water are frequently substitutes for each other. There are many historical examples in which emerging shortages in surface-water supplies have been offset by increased reliance on groundwater and vice versa. It would not be unreasonable, therefore, to consider further ground-water development and use as a potential response to surface-water shortfalls that might ultimately occur because of changes in the rates and magnitudes of glacial melt.
Today, groundwater use is the focus of what Shah (2009) characterizes as a “colossal anarchy.” The need to feed a growing population and agricultural markets has resulted in intense pressure to farm arable land as extensively and intensively as possible. In India, this has caused a transition away from the established large-scale irrigated agriculture that relied on water deliveries through canals and irrigation systems that were managed in a more centralized bureaucratic way. The combination of land scarcity, the availability of small, inexpensive pumps that can be used to extract groundwater, and subsidized electricity has led to a situation in which approximately 22 million farmers in India, for example, are pumping groundwater in an individualistically competitive fashion to intensively irrigate relatively small plots of land. The resultant levels of groundwater overdraft are significant. Thus, for example, Rodell et al. (2009) estimated that between 2002 and 2008, groundwater extraction in three Indian states (Rajasthan, Punjab, and Haryana) exceeded recharge by 18 billion m3 yr-1 (Rodell et al., 2009). This estimate is consistent with the empirical data referred to in the previous chapter that documents the magnitude of groundwater overdraft. It is clear that current levels of groundwater overdraft cannot be sustained and efforts to “tame the anarchy” have not been especially successful to date (Shah, 2009).
Groundwater is managed in accord with the dictates of irrigated agriculture. As in other parts of the world, the price of water includes no scarcity value for the water itself and consists solely of the costs of extraction. Even extractive costs are at levels less than their true value (or cost) because the cost of the energy has been subsidized in various ways by governments. This results in an array of water prices that significantly understate the real value of the water, sending, in turn, false signals to consumers about its relative scarcity. That is, the prevailing prices signal irrigators that water is more plentiful than it is in fact. The consequence is that cropping patterns are not always appropriate and the quantities of water applied are more than they would be if the water was appropriately priced.
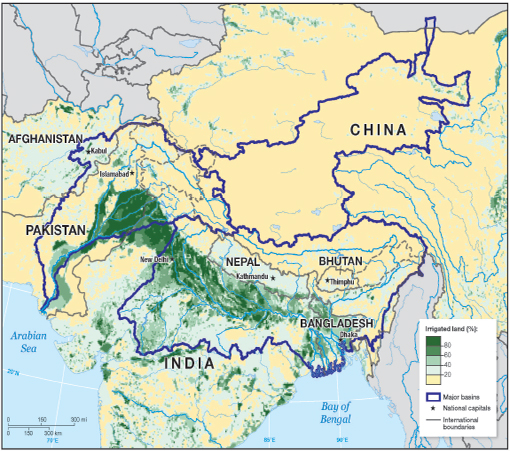
FIGURE 3.3 Fraction of the land equipped for irrigation in the HKH region. Irrigation is widespread in both the Indus and Ganges/ Brahmaputra basins. A relatively large amount of irrigated water consumption in the Indus Basin is for cotton production. In the Brahmaputra Basin, by comparison, irrigation water use is dominated by rice production, while in the Ganges Basin, irrigated water is used primarily for wheat production.
At least two factors militate against bringing extractions into some reasonable balance with recharge. First, the sheer numbers of extractors mean that the transaction costs associated with any of the conventional forms of groundwater regulation such as pump taxes (prices) and supervised pumping quotas would be enormous and would outweigh any likely benefits of such regulation. Second, groundwater extractors could collectively represent a significant political force that would resist any attempts by government to require or induce reductions in the quantities of groundwater extracted or energy subsidized. An additional and potentially problematic feature of this situation is that successful efforts at groundwater regulation, whether by pricing, pump quotas and other means such as the control of complementary inputs, would condemn large numbers of people who currently survive by irrigating small plots with groundwater to poverty (Shah, 2009). Thus, India’s groundwater economy is very likely to become a source of additional demands for surface water as elements of the groundwater resource become economically exhausted. Indeed, the consequences of such economic exhaustion are thought to be so severe that a contested plan has been proposed to link the Himalayan rivers with the peninsular rivers of India, which would allow the import of some 200 km3 annually to southern and western India to offset the effects of overdraft (Shah, 2009; Supreme Court of India, 2012; cf Iyer, 2012).
Water Use in Other Sectors
In most countries, the sector that makes the most withdrawals after agriculture is the municipal and industrial sector. In some regions, withdrawals for
electric power production and cooling are predominant, though urban withdrawals are increasingly significant. Figure 3.4 shows the location of the major cities within the study area. Most major cities in Pakistan are within the Indus Basin or draw their water from the Indus (e.g., Karachi). Kabul, Afghanistan, is also in the upper headwaters of the basin. Aquastat data estimate 2.5 billion m3 yr-1 of withdrawals for municipal purposes in Pakistan in 1991, rising to 9.7 billion m3 yr-1 in 2009, or from around 20 m3 person-1 yr-1 in 1992 to 54 m3 person-1 yr-1 in 2008. However, the per-capita statistics from Aquastat divide municipal water use by the total population of the country, not just that of urban dwellers.
Another dataset, the Global Rural/Urban Mapping Project (GRUMP) database (CIESIN, 2004), maps cities for the region. The version of this dataset developed for McDonald et al. (2011a) was used, which considered only urban agglomerations of more than 50,000 people. This dataset estimates 41.5 million urban dwellers in Pakistan in 2000. Dividing the Aquastat value for municipal withdrawal in 2000 of 6.4 billion m3 yr-1 by just this urban population, that is a use rate of 154.2 m3 urbanite-1 yr-1. The GRUMP database shows 34.3 million urban dwellers in the Indus Basin, which with the above use rate would imply 5.3 billion m3 yr-1 of municipal withdrawals in the Indus Basin in 2000. This approach, however, ignores cities that are outside the Indus Basin but draw water from it through canals (cf. McDonald et al., 2011b).
The majority of the 87.9 million urban dwellers in cities > 50,000 in the Ganges Basin in 2000 were in India (69.6 million), with some in Nepal (2.6 million) or Bangladesh (15.6 million). Total urban population in India in 2000 was 234.9 million in cities > 50,000, and Aquastat lists total municipal withdrawals in 2000
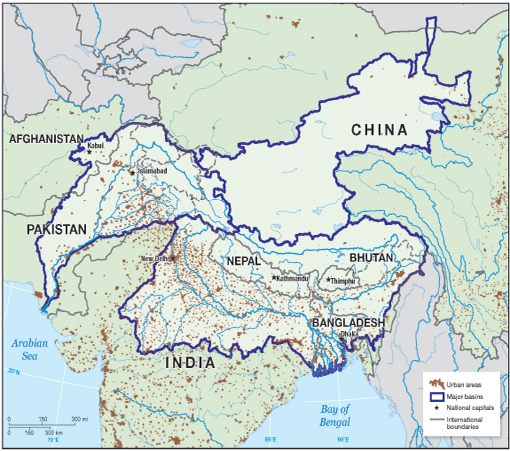
FIGURE 3.4 Major urban areas in the HKH region. Urban water withdrawals are increasingly significant, and the locations of urban areas provide a rough estimate of the locations of most municipal and industrial water withdrawals.
as 42 billion m3 yr-1, which implies a use rate of 179 m3 urbanite-1 yr-1. This would imply that total municipal withdrawals from the Ganges/Brahmaputra Basin in India in 2000 were 12.4 billion m3 yr-1. Total urban population in Bangladesh in 2000 was 23.2 million in cities > 50,000, and Aquastat lists total municipal withdrawals in 2008 as 3.6 billion m3 yr-1, which implies a use rate of 155 m3 urbanite-1 yr-1. This would imply that total municipal withdrawals from the Ganges/ Brahmaputra Basin in Bangladesh in 2000 were 2.4 billion m3 yr-1. Finally, the entire urban population of Nepal is within the Ganges/Brahmaputra Basin, and so Aquastat’s estimate of total municipal withdrawals in 2000 as 0.20 billion m3 yr-1 can be assumed to be all from the Ganges/Brahmaputra Basin. Bhutan’s total municipal withdrawals in 2008 was 0.017 billion m3 yr-1 are all from the Brahmaputra Basin.
The other major sector making water withdrawals is industry, whose spatial distribution generally follows that of urban areas. Industrial withdrawals from the Ganges/Brahmaputra in India are unknown, and country-level industrial water statistics for India as a whole can be misleading, because a significant proportion of India’s industrial capacity is in other river basins. Nevertheless, India is likely the largest industrial water user in the Ganges/Brahmaputra Basin. Nepal’s industrial withdrawals of 0.40 billion m3 yr-1 in 2000 are all taken from the Ganges Basin, while Bhutan’s industrial withdrawals of 0.003 billion m3 yr-1 in 2008 are all taken from the Brahmaputra Basin. Similarly, a large portion of Bangladesh’s 0.77 billion m3 yr-1 in 2008 are taken from the Ganges or the Brahmaputra basins. Relatively little industrial activity happens in China in the Brahmaputra basin. The majority of Pakistan’s 1.4 billion m3 yr-1 of industrial withdrawals in 2008 was likely from the Indus Basin.
Water is also used to produce hydroelectricity in the region (see Figure 3.5). Although this water use is typically considered as nonconsumptive, large dams lose water to evaporation, and new dam construction will increase this consumptive use. The Committee does not provide estimates of these demands here, but notes that changes in the hydrological cycle in the Himalayas will have implications for power production and increases in temperatures will increase consumptive losses from reservoir surfaces. The Brahmaputra is the least dammed of all the major rivers in the study area, with the significant exception of the Yamzho Yumco dam in China. In contrast, both the Ganges and the Indus have a number of large dams and proposals for many more. In addition, China has plans for extensive expansion of dams on the Mekong, Salween, Irrawaddy, and other regional rivers, and Pakistan (along with donors) has long-standing plans to further dam the Indus. All of these plans have been extensively criticized for their potential disruptions.
The operation of a dam or system of dams almost always entails complex issues and trade-offs that must be anticipated. This is true because river inflows, the input to reservoir storage, are subject to hydrological variability and are thus rarely constant from year to year. It is also true because dams are rarely built to satisfy a single purpose and the allocation of reservoir outflows needs to be balanced over time and between purposes depending upon available storage. Consider a dam that holds storage for both flood control and to provide irrigation water for nearby farmlands. Common practice is to release water and draw down the storage pool in advance of the rainy and/or snowmelt season to provide storage for flood flows, thereby lessening the chances of downstream flooding. However, if the reservoir drawdown occurs in circumstances where irrigation water is unneeded and the anticipated floods fail to occur, water that could have been stored for the next irrigation season is lost. This problem requires management regimes that recognize the inherent conflicts between the purposes for which the reservoir is managed. The problems become considerably more complicated when there is more than one dam to be operated conjointly and/or there are multiple purposes to be served (Yeh and Becker, 1982). There are few river basins where there is sufficient water everywhere, all the time, to serve fully all of the various purposes and activities that require water. Typically, the resulting problems are managed by specifying a set of operating criteria under which releases from reservoirs are governed by inflows in the current and recent years, the time or season of the year, the demands for water to serve different purposes, and any legal or administrative constraints. Operating criteria will usually require revision from time to time in response to changing hydrology as well as new laws and regulations that require new management regimes (Benson, 2008). Constraints of water scarcity will likely become more intense in the future and will also
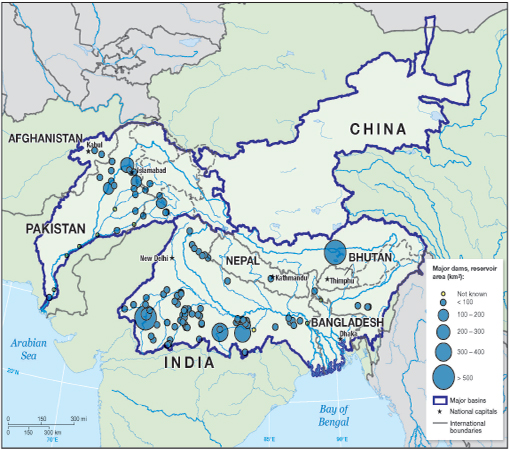
FIGURE 3.5 Dams listed in the GRAND database are shown in blue. Note that this database is not complete, and newer or smaller dams may be missing from this figure. The Brahmaputra is the least dammed of the major rivers in the study region. In contrast, both the Ganges and the Indus are highly dammed.
be manifested in times and places where they have not appeared before (Milly et al., 2008).
Projected Water-Use Trends
Water use may change in the HKH region, with implications for water scarcity. Generally, water use seems to be increasing over time in both the Indus and Ganges/Brahmaputra Basins, a trend that will likely continue over the next several decades. This alone would increase physical water scarcity without changes in human water-use practices. For instance, in India one estimate is that by 2050 Indian demands will exceed all available sources of supply, regardless of climate change (World Bank, 2006). Human water-use practices will also change. Construction of dams and other infrastructure will change water-use patterns. Rising standards of living are also likely to increase water use.
This section begins by presenting information on how water use may change for irrigation, municipal use, and industrial use. This information whenever possible is presented relevant to specific basins (i.e., Indus, Ganges/Brahmaputra), but national-level statistics for the five countries (i.e., Bangladesh, Bhutan, India, Nepal, and Pakistan) in the study area are also used. Generally, much of the focus is on water use by India, Pakistan, and Bangladesh, because Bhutan and Nepal have relatively small water withdrawals. Next is a discussion of how changes in water use will affect metrics of water scarcity in the region. The effects of climate change on water availability will be discussed in a narra-
tive fashion; the Committee did not develop quantitative scenarios of how hydrological flows will change in each of the basins in response to climate change. The potential changes in water supply discussed earlier in this chapter could also affect water use.
Water for Irrigation
Trends in irrigation water use vary throughout the region. In some countries, irrigated crop area has been increasing, which increases water use. At the same time, in some countries average irrigation rates (m3 ha-1 yr-1) have been decreasing because of more efficient applications of irrigation water or changes in the kinds of crops produced. Future trends in irrigation water use are difficult to predict and depend on (among other things) changes in farming practices, government policies toward irrigation, and the magnitude and direction of the effect of climate change on evapotranspirative demand of crops.
In the Indus Basin, approximately 15 million ha of cropland was equipped for irrigation in 2000 (Siebert et al., 2007), mostly in Pakistan. Aquastat (FAO, 2011) statistics show that between 1990 and 2008, area equipped for irrigation in Pakistan increased by 1.3 percent annually, up to 20 million ha, the vast majority of which is in the Indus Basin. If this trend continues, by 2030, Pakistan would have 25 million ha and by 2050 there would be 30 million ha. At the same time, between 1990 and 2008, the irrigation rate fell by 0.5 percent annually, to 8,600 m3 ha-1 yr-1. Assuming this trend continues, by 2030, Pakistan’s irrigation rate would fall to 7,500 m3 ha-1 yr-1 and by 2050 would reach 6,500 m3 ha-1 yr-1. The net result of such a scenario for Pakistan would be an increase in agricultural withdrawals from 170 billion m3 yr-1 in 2008 to 190 billion m3 yr-1 in 2030 and 195 billion m3 yr-1 in 2050. Assuming that in the future a similar fraction of water withdrawals is consumed, water consumption under such a scenario would increase from around 120 billion m3 yr-1 in 2000 to 128 billion m3 yr-1 in 2030 and 132 billion m3 yr-1 in 2050.
Whether such a scenario would be feasible depends on whether there is enough water available to meet this increased need, whether there is adequate arable land to allow continued expansion of irrigated area, and whether Pakistan can make the necessary investments in improving irrigation efficiency. Scenarios of future agricultural water use developed by Archer et al. (2010) are similar, and the authors stressed the necessity of increased water storage to allow for a continued increase in agricultural withdrawals. Moreover, agricultural withdrawal and consumption could be significantly reduced if Pakistan increased the productivity of agricultural water use, which would permit them to expand production without substantial increases in demand for water, through on-farm and basin efficiency improvements, changes in irrigation technology and management, changes in crop types, or other practices.
The overall Ganges/Brahmaputra Basin had 29 million ha of area equipped for irrigation in 2000 (Siebert et al., 2007), primarily in India and to a lesser extent Bangladesh. Nepal and Bhutan have much more limited irrigated area because of their climate and topography, a trend likely to persist into the future. India’s irrigated area increased by 0.9 percent annually between 2001 and 2008, with some of the increase in the Ganges Basin and some of it elsewhere in the country. Over the same time period, India’s irrigation rate has increased by around 2 percent annually, from 1995 to 2008, Bangladesh’s irrigated area, which is in both the Ganges and Brahmaputra basins, increased by 2.3 percent annually. Time-series data for Bangladesh on irrigation rate are unavailable, although in 2008 it appeared to be lower than Indian rates, at around 6,300 m3 ha-1 yr-1. Other pertinent data reveal that about 75 percent of total land cultivated in Bangladesh is irrigated by groundwater (Zahid and Ahmed, 2006) and that groundwater has been decreasing (Shamsudduha et al., 2009). Thus, irrigation in Bangladesh has been increasing, with noticeable effects on groundwater depletion.
Because the vast majority of irrigated area in the Ganges/Brahmaputra is in India, changes in irrigation practices in India will drive changes in the Ganges/ Brahmaputra area. If the irrigated area in the overall Ganges/Brahmaputra continues expanding at the same rate as irrigated area is currently expanding in India, by 2030 there would be 39 million ha of area equipped for irrigation and by 2050 some 48 million ha. It is not clear whether there is enough room in the crowded Ganges basin for such a continued expansion, nor is it clear that there is sufficient water. If India’s irrigation
rate remains at 2008 levels of around 10,400 m3 ha-1 yr-1, such a scenario would increase agricultural water withdrawals in the Ganges/Brahmaputra from 260 billion m3 yr-1 in 2000 to 400 billion m3 yr-1 in 2030 and nearly 500 billion m3 yr-1 in 2050. It seems unlikely that there is enough water in the Ganges to support this level of withdrawal, particularly in the dry months (see discussion below).
This scenario for the Ganges/Brahmaputra is similar to one developed by the 2030 Water Resources Group (2009), which predicted that, if current trends continue, by 2030 Indian agricultural withdrawals would have nearly doubled from current levels. This report also notes that changes in the agricultural sector’s water use also represents the most cost-effective way to reduce India’s water withdrawals, especially implementation of measures that increase yields from India’s cropland without increasing water applied as irrigation. Similarly, Cai et al. (2010) found that if less productive areas in India were to achieve the same water productivity as more productive areas, agricultural withdrawals could be reduced by 31 percent without reducing agricultural production.
Municipal Water Use
Trends in the municipal sector are consistent across countries, with an increasing urban population resulting in an increase in municipal withdrawals. Trends in the use rate (m3 urbanite-1 yr-1) are generally not available as time series, although economic development is likely to increase this use rate over time.
In 2000, the GRUMP database (CIESIN, 2004) shows 34 million urban dwellers in the Indus Basin (cities > 50,000 people). The vast majority of these urbanites are in Pakistan, where the average urban use rate was around 150 m3 urbanite-1 yr-1, a relatively high rate, which with the above use rate would imply over 5 billion m3 yr-1 of municipal withdrawals in the Indus Basin in 2000. For Pakistan as a whole, urban population is projected to increase by 3.1 percent per year between 2000 and 2030, or by 2.8 percent per year between 2000 and 2050 (United Nations, 2011b). If this rate of urban population growth holds for the Indus Basin as a whole, population might grow to nearly 85 million urban dwellers (cities > 50,000 people) by 2030 and 140 million urban dwellers (cities > 50,000 people) by 2050. Assuming the urban use rate of water stays the same, expected population growth implies an increase in municipal water use to 13 billion m3 yr-1 of municipal withdrawals in the Indus Basin in 2030 and 22 billion m3 yr-1 of municipal withdrawals in the Indus Basin in 2050.
In 2000, there were 88 million urban dwellers in cities > 50,000 in the Ganges/Brahmaputra Basin, primarily in India (70 million) and to a lesser extent Bangladesh (16 million) (CIESIN, 2004). India had an urban use rate of 179 m3 urbanite-1 yr-1, and Bangladesh had an urban use rate of 155 m3 urbanite-1 yr-1. For India, urban population is projected to increase by 2.4 percent per year between 2000 and 2030, or by 1.7 percent per year between 2000 and 2050. Bangladesh is forecast to have similarly rapid urban population growth, increasing by 3.1 percent per year between 2000 and 2030, or by 2.1 percent per year between 2000 and 2050. Assuming these urban population growth rates, and that urban use rate stays the same, India’s municipal withdrawals from the Ganges/Brahmaputra Basin would grow from 12 billion m3 yr-1 in 2000 to 26 billion m3 yr-1 in 2030 and 29 billion m3 yr-1 in 2050. Similarly, Bangladesh’s municipal withdrawals from this basin would grow from just over 2 billion m3 yr-1 in 2000 to 6 billion m3 yr-1 in 2030 and 7 billion m3 yr-1 in 2050. Municipal withdrawals for Nepal and Bhutan will likely increase as well, driven by increases in urban population in these countries, although their municipal withdrawals will continue to be a very small proportion of the municipal withdrawals in the Ganges/ Brahmaputra Basin.
This scenario of growth in municipal water demand in the Ganges/Brahmaputra Basin appears consistent with the scenarios developed for India by the 2030 Water Resources Group (2009). That report predicted municipal demand would double from 2000 to 2030, a slightly slower rate of growth than in the Committee’s scenario of growth developed specifically for the Ganges.
Industrial Water Use
Industrial water use appears likely to increase over time, driven by increases in population and economic development. In the Aquastat database, there is little consistent trend in industrial water use per capita, with
some countries increasing and some countries decreasing. However, even if water use per capita stays constant at 2008 levels, it appears likely industrial water use will continue to rise because of fast rate of population growth in many of these countries.
The majority of Pakistan’s 1.4 billion m3 yr-1 of industrial withdrawals in 2008 was likely from the Indus Basin, and if industrial water use per capita stays the same might rise to 2.3 billion m3 yr-1 in 2030 and 3 billion m3 yr-1 in 2050. India’s industrial withdrawals in the Indus are unknown, but are likely smaller than Pakistan’s, because few major Indian cities are located in the Indus Basin.
Trends in India’s industrial withdrawals from the Ganges/Brahmaputra are unknown, but are likely increasing over time. One study by the 2030 Water Resources Group (2009) suggests that industrial withdrawals for all of India will quadruple, reaching 196 billion m3 yr-1 in 2030. A large portion of Bangladesh’s 0.8 billion m3 yr-1 of industrial withdrawal in 2008 was taken from the Ganges/Brahmaputra Basin and, if industrial water use per capita stays the same, might rise to 1.1 billion m3 yr-1 in 2030 and 1.2 billion m3 yr-1 in 2050. Similarly, Nepal’s industrial withdrawals of 0.4 billion m3 yr-1 in 2000 are all taken from the Ganges Basin, and if industrial water use per capita stays the same might rise to 0.6 billion m3 yr-1 in 2030 and 0.7 billion m3 yr-1 in 2050. Bhutan uses a relatively trivial amount of water for industrial purposes, a trend that is likely to continue.
Trends in Water Scarcity
As discussed in Chapter 3, we primarily pre sent simple metrics of physical water scarcity. This approach is driven by the limited data available for more sophisticated measures that take into account, for example, economic water scarcity or water quality issues. However, we stress that these other issues may be important and deserve future study. Levels of water stress in the future will also be affected by adjustments to human behavior or technological interventions to make existing water use more efficient, both of which are difficult to predict.
Even without climate change affecting water availability in the study area, many countries would have a significant challenge providing enough water to meet their needs under traditional projections. In this section, the Committee explores how some metrics of water scarcity will change with increases in population and water use as well as with climate change. Because quantitative scenarios of how the hydrological cycle will be affected by climate change were beyond the scope of this report, most of the discussion of climate change is narrative, describing the likely direction of change.
As noted earlier, the simplest way to define physical water scarcity is to take the amount of water in a region and divide by the population. One common set of thresholds defines regions with more than 1,700 m3 person-1 yr-1 as “water sufficient,” while those below this threshold have some degree of water stress (<1,700 m3 person-1 yr-1), chronic scarcity (<1,000 m3 person-1 yr-1), or absolute scarcity (<500 m3 person-1 yr-1) (Falkenmark, 1989; Falkenmark and Lindh, 1974; Falkenmark and Widstrand, 1992; Falkenmark et al., 1989). Using this metric, with population growth (ignoring potential changes in water availability) Pakistan will move from water stress in 2000 (1,400 m3 person-1 yr-1) to chronic scarcity in 2030 (900 m3 person-1 yr-1) and 2050 (700 m3 person-1 yr-1), even without factoring in climatic changes to regional hydrology. Any reductions in flow in the Indus caused by climate change would further intensify this scarcity. The next driest country by this metric is India, which stays classified as water stressed but moves from 1,600 m3 person-1 yr-1 in 2009 to 1,300 m3 person-1 yr-1 in 2030 and 1,200 m3 person-1 yr-1 in 2050. By this simple measure, and ignoring potential changes in water availability, Bangladesh, Bhutan, and Nepal remain classed as water sufficient through 2050.
Another way to define physical scarcity is the ratio of water use to water availability. By this metric, and ignoring potential changes to water availability, the Indus Basin seems the most likely of any of the study area basins to face problems of water scarcity (Figure 3.6). Significant increases in irrigation water use in this basin, particularly during the dry months of November to March, may result in essentially all flow in these months being used for irrigation. Increased irrigation water use in the Ganges, particularly in the dry period of November to May, may likewise result in essentially all flow in these months being used for irrigation (Figure 3.7). One potential response by policy makers would be to attempt to increase storage during the monsoon season so that water would be available for irrigation during the dry season. Even with increases in irrigation water use by Bangladesh, the Brahmaputra
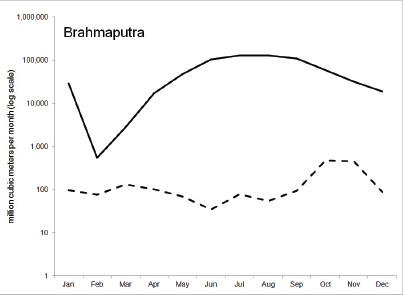
FIGURE 3.6 Natural runoff (solid line) and blue water consumed (dashed line) per month for the Brahmaputra. Note that the y-axis is a log scale. The Brahmaputra has very little water scarcity, except in February and March, although water consumption still does not exceed natural runoff during those months. The large spike in natural runoff in the period June to September corresponds to the monsoon period. SOURCE: Based on data from Hoekstra and Mekonnen (2011).
Basin seems less likely to be water stressed according to this metric, except for a brief dry period in February and March (Figure 3.6).
The picture that emerges is nevertheless one in which water scarcity, be it generalized or seasonal, will intensify in the coming decades. Climate change will also influence the extent and severity of intensifying
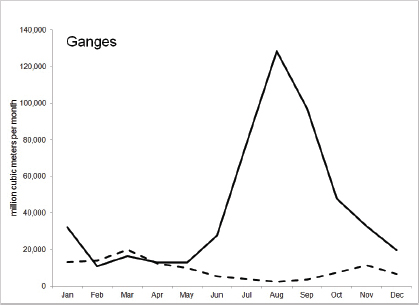
FIGURE 3.7 Natural run-off (solid line) and blue water (dashed line) consumed per month for the Ganges. The Ganges has very little water scarcity, except in February and March, when water consumption exceeds natural runoff. The large spike in natural runoff in August corresponds to the monsoon period. SOURCE: Based on data from Hoekstra and Mekonnen (2011).
scarcity. It follows, then, that one means of addressing potential changes in hydrological circumstances that are uncertain is to ensure that current water management practices are as effective and equitable as possible. This means making all efforts to increase and maintain the productivity of water that is currently available. Such productivity increases need to be sought for both consumptive and in-stream uses. Thus, for example, employment of more rational water pricing practices and the development of flexible schemes of water allocation that will allow droughts and unanticipated shortfalls to be managed in both a timely and effective way could strengthen the capacity of the region to manage its water resources more effectively in the face of climate change and other hydrological uncertainties.
CLEAN WATER AND SANITATION ACCESS
A basic measure of water development and conditions is access to improved drinking water and sanitation systems, as measured by the United Nations on a regular basis. This measure forms the standard by which the water-related Millennium Development Goals were set. Political and social stability is affected by the societal capacity to cope with and adapt to large- and small-scale changes in water availability that may result from glacial retreat and other impacts of climate change on the hydrological system. This societal capacity, often called vulnerability or resilience, depends on conditions that promote human well-being generally. The water-related aspects commonly measured include water availability or scarcity (discussed in the next section) and clean water and sanitation, which are important for human health and general well-being.
Countries in Africa have the most serious problems in terms of the fraction of population without access to these basic water services, but Asia has the largest absolute number of people without access (hundreds of millions), with a wide divergence among countries and within countries. Table 3.6 shows the fraction of the populations in countries of the region with access to “improved drinking” water systems and “improved sanitation” systems, as of 2008 (WHO/UNICEF, 2010). As these data show, urban dwellers are typically more reliably served than rural dwellers, and access to water is typically higher than access to sanitation. However, national-level estimates of improved water and sanitation, even when stratified by urban and rural residence, tend to mask considerable spatial variation in access. Data from the nationally representative Demographic and Health Surveys (DHS),5 for example, suggest that there is greater variation in access to clean water and sanitation in rural districts than urban districts. It is possible, in principle, to use these data to create district-level mappings of access to clean water and sanitation. This could provide finer-grained insight into the geographic distribution of water-related need and vulnerability, including by river basin and proximity to the Himalayas.
TABLE 3.6 Share of Population with Access to Improved Drinking Water and Sanitation, by Country
| Improved Drinking Water | Improved Sanitation | |||||
| Urban | Rural | Total | Urban | Rural | Total | |
| Afghanistan | 78 | 39 | 48 | 60 | 30 | 37 |
| Bangladesh | 85 | 78 | 80 | 56 | 52 | 53 |
| Bhutan | 99 | 88 | 92 | 87 | 54 | 65 |
| China | 98 | 82 | 89 | 58 | 52 | 55 |
| India | 96 | S4 | SS | 54 | 21 | 31 |
| Nepal | 93 | 87 | 88 | 51 | 27 | 31 |
| Pakistan | 95 | 87 | 90 | 72 | 29 | 45 |
SOURCE: Data from WHO/UNICEF (2010).
With the preceding analysis in mind, it is not surprising that there are many different ways to measure water scarcity. Water scarcity can occur when problems of water quantity, water quality, or timing mean there is not enough water to meet people’s wants. Scarcity in the physical sense is often defined in terms of arbitrary but useful criteria such as those discussed in the next paragraph. Economic scarcity is customarily defined in terms of the cost of making water available and a willingness to pay. One significant manifestation of economic scarcity is the economic exhaustion of groundwater, which contrasts with physical exhaustion, as explained in Box 3.2. In this section, we focus on simple measures of physical water scarcity, primarily because they are easy to estimate from available data.
_________
5 Data available at http://www.measuredhs.com/data/available-datasets.cfm.
BOX 3.2 Economic Exhaustion 0f Groundwater
Groundwater is an important element of hydrological systems throughout the world. It is known to be a significant, if not completely understood, part of the hydrology of the Himalayas, the Ganges Plain to the south, and the southern Peninsula of India (Bookhagen, 2012; Shah, 2009). Over time, extractions of water from an aquifer must be roughly equal to recharge if the aquifer is to remain economically viable. Overdraft is the situation in which extractions exceed recharge. Overdraft itself is not problematic as long as periods of intermittent overdraft are punctuated with periods in which recharge exceeds extractions and the aquifer recovers. Over such periods of time the aquifer is in equilibrium. Circumstances characterized by persistent overdraft are not sustainable in the sense that extraction cannot be economically viable indefinitely. Where extractions are consistently greater by volume than recharge, the water table falls and the elevation from which water must be extracted grows.
The costs of groundwater extraction include the costs of needed energy and those costs are highly sensitive to the depths from which the groundwater must be pumped. As the water table is drawn down through overdraft the costs of extraction rise. Ultimately, these costs rise to the point where it is no longer economically feasible to continue pumping and the extractor or extractors in question cease to pump. In some instances this will allow the aquifer to recover as recharge then exceeds extraction. There are other instances where the storage capacity of the aquifer is altered (consolidated) or rates of recharge are very small or nonexistent, that it is no longer economical for any extractor to withdraw water. Atthis point the aquifer is said to be economically exhausted. Economic exhaustion is not necessarily identical to physical exhaustion, however, because pumping depths from which extractions are no longer economically feasible can be significantly smaller than the pumping depths that would prevail if all of the water in the aquifer were extracted. These latter circumstances constitute physical exhaustion (Glennon, 2002; NRC, 1997).
Such an approach, however, should not be taken to imply that other facets of water scarcity are not also extremely important to human livelihoods.
Perhaps the most common metric of physical water scarcity, and certainly the simplest to calculate, is to take the average amount of water in a region and divide by the population (Falkenmark, 1989; Falken-mark and Lindh, 1974; Falkenmark and Widstrand, 1992; Falkenmark et al., 1989). These indexes usually define regions with more than 1,700 m3 person-1 yr-1 as water sufficient, while those below this threshold had some degree of water stress (<1,700 m3 person-1 yr-1), chronic scarcity (<1,000 m3 person-1 yr-1), or absolute scarcity (<500 m3 person-1 yr-1). By this simple measure, Bangladesh, Bhutan, and Nepal are classed as water sufficient, and Pakistan and India are classed as water stressed. As noted above, these national averages hide important regional differences. Additionally, the thresholds are somewhat arbitrary, and this measure of water scarcity does not account for water that flows across a border and it ignores different uses of water in different climates.
Another common, but more descriptive, way to consider physical water scarcity is to look at the ratio of water withdrawals or consumption to total water available, which is defined as natural streamflow by Hoekstra and Mekonnen (2011). Figure 3.6 shows estimates of natural runoff and water consumption for the Brahmaputra basin, on a monthly time step. This river has very little water scarcity, except in February and March, and even then, water consumption does not exceed natural runoff. The large spike in water available in the period June to September corresponds to the monsoon period of the year.
The Ganges basin (Figure 3.7) has a similar annual pattern, but water consumption exceeds natural runoff for February and March. There is also a sharper peak in natural runoff in the single month of August.
Finally, the Indus Basin (Figure 3.8) has a much higher percentage of the natural runoff consumed over the whole year than the Ganges or the Brahmaputra basin, with the percentage highest in the period October to March. However, water consumption does not exceed natural runoff in any month for the Indus, in contrast with the Ganges.
More sophisticated measures of water scarcity are available in the literature. Sometimes measures of scarcity explicitly set aside a portion of available flow as an environmental flow (EF). Sometimes issues of water quality are also considered, which can be a limiting factor for many applications (McDonald et al., 2011a). Similarly, measures of water scarcity sometimes incorporate information on how well water is actually delivered to people. In many cities, for instance, a substantial fraction of people live in neighborhoods without consistent access to safe drinking water, simply because infrastructure is absent (UN-HABITAT, 2006).
Because data are sparse, it is not clear how increased glacial melt will affect total runoff. However, it could
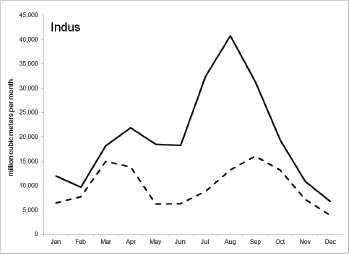
FIGURE 3.8 Natural runoff (solid line) and blue water consumed (dashed line) per month for the Indus. A higher percentage of the natural runoff is consumed than for the Ganges or the Brahmaputra basin, with the percentage highest in the period October to March. Water consumption does not exceed natural runoff in any month for the Indus. SOURCE: Based on data from Hoekstra and Mekonnen (2011).
affect the timing of runoff, which would in turn affect the ratio of water consumption to natural runoff. For example, in the Brahmaputra, if the change in runoff due to glacial melt occurs in February and March, there would be a larger change in the ratio. If the runoff were to change during the monsoon peak between June and September, there could also be issues with flooding.
WATER MANAGEMENT, INSTITUTIONS,
AND HYDROCLIMATE CHANGE
The water-use patterns described above are mediated by institutions at multiple levels in the region — from international to national, state, and local water management, and from mountain headwaters to plains and coastal environments. In addition to multiple levels of management, water institutions span a range of subsectors from irrigation to domestic, industrial, and environmental uses that often have separate agencies housed under different ministries, and whose perspectives vary on hydroclimate change. Although a full description, let alone discussion, of these complex water management systems lies beyond the scope of this report, this section highlights patterns in the relationships between climate change and water management in South Asia. Institutions that focus more on disasters (e.g., devastating floods, droughts, and GLOFs), vis-à-vis water management more broadly, are addressed under the rubric of environmental security in Chapter 4.
Increasing International Assessment
Considerable progress has been made in assessing water resources implications of climate change in South Asia at international and national levels of analysis over the past decade. Some advances have come about through regional intergovernmental organizations (IGOs) such as the South Asian Association for Regional Cooperation (SAARC6), whereas others stem from multilateral donor-sponsored initiatives. Regional IGOs such as SAARC are devoting increasing attention to climate change, extreme events, and disaster risk reduction (e.g., SAARC; cf also Regional Integrated Multi-Hazard Early Warning System for Africa and
_________
Asia [RIMES],7 which is an association of country hydrometeorological agency directors in the greater Indian Ocean region). Water management remains a sensitive topic that has historically been addressed through bilateral relations, although a 2012 SAARC-Chamber of Commerce and Industry conference dealt with climate, energy, and water, and SAARC is increasingly active in addressing hydroclimate disaster preparedness.
Comparative international water resources analysis is also advancing through the work of the South Asia Water Initiative which convenes countries in the region to analyze water management issues related to climate change (SAWI, 2011). The World Bank has conducted substantial analytical studies of water management and climate risk in several countries and basins in the region (Pahuja et al., 2010; Sadoff and Rao, 2011; Yu, 2010). These studies are helping increase awareness, analysis, and cooperation.
Among international nongovernmental organizations contributing to these advances, the Asia-Pacific Network for Climate Change organized an early study of water resources impacts of climate change in South Asia (APN, 2004). More recently, ICIMOD has supported cooperative international programs on snow and ice hydrology in the Himalayan region (e.g., ICIMOD’s INDUS8 and HKH-HYCOS9 programs). Other international nongovernmental organizations (NGOs) have undertaken comparative case study analyses of water management in the context of climate change across the region (e.g., ISET, 2008; Moench and Dixit, 2004; see also the International Water Management Institute [IWMI] website10).
Formulation of National Water and
Climate Policies
Several countries have articulated national water policies related to climate change. In 2012, India issued a new Draft Water Policy that includes numerous references to and a major section on adaptation to climate change (Government of India, 2012). The Ministry of Water Resources (2009-2011) earlier published a two-volume work that compiled Comprehensive Mission Documents for a National Water Mission Under National Action Plan on Climate Change (Government of India, 2009). Following a summary of recommendations, it presented supporting documents on the current policy context of water management, surface water, ground-water, and basin planning for climate change.
Bangladesh has joint concerns about the coastal hazards of climate change, inflows from major international rivers and tributaries, and domestic hydroclimate risks. To address these issues Bangladesh created an interagency Institute of Water Modeling chaired by the Ministry of Water Resources as a center of climate change modeling, and a Climate Change Cell11 for adaptation and mitigation programs including irrigation agriculture under the Ministry of Environment.
The Government of Pakistan established a Global Change Impact Study Centre (GCISC) that prepared 16 research reports, including one on Climate Change Implications and Adaptations of Water Resources in Pakistan (Ali et al., 2009), which included a section on policy needs. The GCISC studies contributed to a Planning Commission Task Force Report on Climate Change. The federal cabinet adopted a climate change policy that has substantial water resources provisions and a new Ministry on Climate Change in 2012. These national actions occur at a time of constitutional devolution of authority for environment, agriculture, and other sectors to the provinces and political uncertainty.
Nepal has been an early leader in scientific assessments of climate change on water resources management (Gyawali, 2011). Nepal created a National Adaptation Programme of Action followed by a Nepal Climate Change and Development Portal,12 which has a national branch of the Climate Action Network, youth alliances, and NGO associations. These efforts occurred within what has become a larger context of constitutional and governance uncertainties.
Bhutan has placed growing emphasis on climate change and hosted the SAARC meeting on climate change at Thimpu in 2010. Its water policy is situated under its Ministry of Agriculture, though it
_________
7http://www.rimes.int/about_overview.php.
8http://www.icimod.org/?q=265.
9 See http://www.icimod.org/?q=264.
10 See http://www.iwmi.cgiar.org/Topics/Climate_Change/default.aspx.
also has a substantial hydropower program under its Department of Energy.
Afghanistan is concentrating on reestablishing hydrological monitoring and water resources planning after a prolonged interruption. Water policy is addressed in the Ministry of Agriculture, Irrigation, and Land, which raises an interesting point of comparison across countries where water and climate policies are variously situated in ministries of agriculture, water resources, and environment.
Uneven Subnational, State, and Local Water
Management Capacity
Recent decades have witnessed trends toward devolution of water governance from national or concurrent jurisdiction to state and local levels (i.e., the “subsidiarity principle” in the Dublin Statement on Water and Sustainable Development, 199213). Irrigation departments in India and Pakistan are situated at the state and provincial level of government. In the case of Pakistan, although some recent annual plans for the provinces refer to climate change, provincial budgets and department plans for 2012 do not yet include major climate change adaptation analyses, programs, or policies analogous to those being developed at the national level.
In comparison with government, however, the past generation of social science research on local irrigation management by farmers in South Asia underscores their keen perception of and adjustments to hydro-climate variability (see, e.g., numerous IWMI field research studies of irrigation in South Asia;14 IUCN, 2008; Kreutzmann, 2000).
It seems reasonable to summarize that at this time international and national water organizations are making significant advances toward water resources assessments of climate change that include snow and ice hydrology. National water agencies are devoting increasing emphasis to climate impact and adaptation assessment. It is less clear how these assessments affect management, policy, and interagency water coordination. Similarly, while devolution of water governance to states and districts is associated with increasing references to climate change in water sector planning documents at those levels, the actual implications for budgeting, management, and governance are less evident. The largest cities in South Asia are developing climate adaptation plans that include water systems, but the rapidly growing proportion of secondary and tertiary cities show limited evidence, capacity, or higher-level support for addressing hydroclimate effects on water supply, drainage, or wastewater management. At local scales of irrigation management, however, there is substantial practical experience with hydroclimate adjustment. The robustness of these local forms of adaptation in relation to longer-term and larger-scale trends in climate variability associated with snow and ice hydrology is less well known.
Key features of the human geography of the HKH region were identified at the workshop by the breakout groups on Hydrology; Water Supply, Use, and Management; and Demography and Security. Starting from those concepts, the Committee used its expert judgment, reviews of the literature, and deliberation to develop the following conclusions:
• Rural and urban poor may be most at risk, in part because the poor are least likely to be able to retrofit, move, or rebuild as needed when faced with risks. However, the environment is not the only driving factor for migration and other adjustments.
• Social changes in the region have at least as much of an effect on water demand as environmental factors do on water supply, leading to stress. Existing stress could be exacerbated by climate change in the future.
• Future population growth in specific watersheds or elevation zones is uncertain, but there is certainty that the region will become increasingly urbanized.
• Water resources management and provision of clean water and sanitation is already a challenge in the countries that share the Himalayan watersheds. The adequacy and effectiveness of existing water management institutions is a reasonable, if coarse, indicator of how the region is likely to cope with changes in water supply.
_________
13http://www.wmo.int/pages/prog/hwrp/documents/english/icwedece.html.
• Changes in seasonal streamflow could have significant impacts on the local populations by altering water availability patterns and affecting water management decisions and policies for irrigation, municipal, industrial, and environmental use.
• Average aggregate water-use data provide crude estimates of water supply, demand, and scarcity Increasing the detail, consistency, and accessibility of water-use data (along with streamflow and aquifer data as discussed in Chapter 2) are key priorities for sound regional water assessment.
• Water management assessments have advanced over the past 5 to 10 years, although their implementation in water policies and programs is less clear; to date, there is limited penetration to lower levels of governance or support for local water managers who face the greatest risk.
• Water use has been increasing over time in both the Indus and Ganges/Brahmaputra basins, and this trend will continue for the next several decades, with irrigation by far the largest use.


