
“We need to recognize that the decision to allow pre-code buildings to stay unretrofitted against local hazards means that the portion of our population that live and work in those buildings face higher than average risks than the populations that are in the newer buildings. [We] need to work to change the dynamic that the areas of town that are most affordable are also the areas facing greater hydrological, geological and ecological risks.
” Citizen from King County, Washington, 2011
Understanding, managing, and reducing disaster risks provide a foundation for building resilience to disasters. Risk represents the potential for hazards to cause adverse effects on our lives; health; economic well-being; social, environmental, and cultural assets; infrastructure; and the services expected from institutions and the environment (Figure 2.1). The perceptions of and choices made about risk shape how individuals, groups, and public- and private-sector organizations behave, how they respond during and after a disaster event, and how they plan for future disasters. Most people have some sense of what risk means to them. However, when pressed to identify or assess disaster risk, or determine how to select among available options for managing it, “risk” becomes more difficult to articulate.
This chapter focuses on the importance of understanding risk and risk management as essential steps toward increasing resilience to hazards and disasters. This chapter examines how hazards are identified and how disaster risks are assessed and perceived. Based on this understanding, the chapter summarizes a range of options to mitigate and manage risk. Some of the characteristics of individual and collective decision-making processes—what we know and how we know it—are also described, as are challenges and opportunities that decision makers face in managing risk. Challenges in managing risk due, for example, to inadequate data, to misperceptions of or biases in risk information, to insufficient commitment to use risk management tools, or to lack of communication among stakeholders are also identified. The chapter concludes with several key themes that serve as a foundation for managing risk and increasing disaster resilience for a community, a business, a state, or the nation. Although the chapter directs its discussion of risk and risk management toward general situations using evidence from the published literature, the committee recognizes the importance of the actual practice of risk management. The chapter therefore also draws upon examples from the field
and from the standpoint of key decision makers and organizations concerned with addressing disaster risk and increasing resilience.
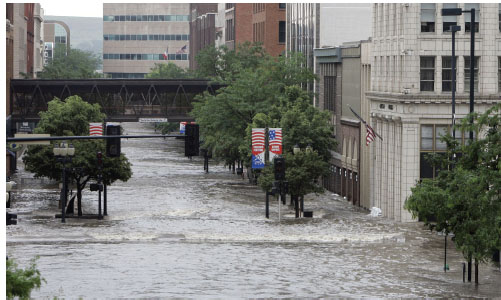
FIGURE 2.1 Floodwaters rise through downtown Cedar Rapids, June 2008, when the Cedar River finally crested at 31.12 feet, more than 19 feet above the flood stage. Source: AP photo/Jeff Robertson.
Disaster risk comprises four elements: hazard, exposure, vulnerability, and consequence (International Bank for Reconstruction and Development/World Bank, 2010) (Box 2.1). Hazard refers to the likelihood and characteristics of the occurrence of a natural process or phenomenon that can produce damaging impacts (e.g., severe ground shaking, wind speeds, or flood inundation depths) on a community.1 Exposure refers to the community’s assets (people, property, and infrastructure) subject to the hazard’s damaging impacts. Exposure is calculated from data about the value, location, and physical dimensions of an asset; construction type, quality, and age of specific structures; spatial distribution of those occupying the structures; and characteristics of the natural environment such as wetlands, ecosystems, flora, and fauna that could either mitigate effects from or be impacted by the hazard.
______________
1 The term “community” throughout the report is used very broadly to incorporate the full range of scales of community organization—from the scale of a neighborhood to that of a city, county, state, multistate region, or the entire nation. Where a specific kind of community is intended, the chapter adds the appropriate descriptor.
Vulnerability is the potential for harm to the community and relates to physical assets (building design and strength), social capital (community structure, trust, and family networks), and political access (ability to get government help and affect policies and decisions). Vulnerability also refers to how sensitive a population may be to a hazard or to disruptions caused by the hazard. The sensitivity can affect the ability of these populations to be resilient to disasters (NRC, 2006b; Cutter et al., 2003, 2008). Vulnerability is projected by the presence and effectiveness of measures taken to avoid or reduce the impact of the hazard through physical or structural methods (e.g., levees, floodwalls, or disaster-resistant construction) and through nonstructural actions (e.g., relocation, temporary evacuation, land-use zoning, building codes, insurance, forecasts, and early warning systems), or construction-related and nonconstruction-related methods.2
BOX 2.1
What Is Disaster Risk?
For the purpose of the report, we have adopted a broad definition of risk. The definition presented in this chapter draws common elements from among a range of existing definitions and the communities that provide them. Most definitions take into account elements of hazard (what could happen to trigger damage), exposure (what is at stake), vulnerability (the level of sensitivity to a hazard), and consequences (the impact or damage caused by the hazard). We refer to disaster risk as the potential for adverse effects from the occurrence of a particular hazardous event, which is derived from the combination of physical hazards, the exposure, and vulnerabilities (Peduzzi et al., 2009; IPCC, 2012). Similarly, we use the term disaster risk management (or simply risk management) to include the suite of social processes engaged in the design, implementation, and evaluation of strategies to improve understanding, foster disaster risk reduction, and promote improvements in preparedness, response, and recovery efforts (IPCC, 2012).
Consequences are the result of the hazard event impacting the exposure in a region or community, taking into account the degree of the community’s vulnerability. Consequences can be immediate (e.g., the loss of human lives, injuries, damaged buildings, businesses), or long term (e.g., environmental
______________
2 The terms structural and nonstructural as they are applied in this report reflect the use of these terms in the flood, hurricane, tsunami, and to a lesser degree, the earthquake arena. Within the emergency management community, the terms are used interchangeably to describe certain mitigation measures. Although the report is consistent in its use of these terms and not outside the norm, nonstructural mitigation has a very specific meaning in engineering circles (it only refers to contents and other building elements not related to structural strength). For the purposes of this report, the committee uses the terms “structural” and “construction-related” and their opposites interchangeably.
damage or physical and mental health impacts), and influence the overall well-being and quality of life for the community (Heinz Center, 2000). Consequences may also extend far beyond the area immediately affected by the hazard— cascading impacts on a supply chain, for example, may have a national or global effect. Lastly, consequences may be mitigated by such measures as insurance, continuity, and recovery plans by businesses and governments, and actions by the state and community such as well-enforced building codes and land-use planning. These measures, put into place either individually or in concert with one another, can greatly reduce the potential losses and facilitate a much speedier recovery from future disaster events, thereby contributing to increasing resilience.
Risk management is a process that examines and weighs policies, plans, and actions for reducing the impact of a hazard or hazards on people, property, and the environment. Ideally, risk is managed in the most effective and equitable way subject to available resources and technical capabilities. Under the best circumstances, risk management includes risk reduction strategies that draw upon scientific, engineering, social, economic, and political expertise. An important aspect of risk management is providing realistic expectations as to what can be accomplished using specific strategies and the relative costs and benefits of undertaking proposed measures (see also Chapter 3). Managing expectations is also important because disaster risks cannot be eliminated completely even with the most appropriate and successful risk management strategies. Importantly also, some tools or actions that can reduce short-term risk may increase long-term risk, requiring careful evaluation of the risk management strategies employed. Although some residual risk will always require attention, risk management can help build capacity to become more resilient to disasters, particularly when everyone in a community is engaged in managing risk (Box 2.2; see also Chapter 5).
The Risk Management Process
Risk management is a continuous process that begins with establishing goals, values, and objectives of the affected and interested parties in the public and private sectors as well as citizen groups and nongovernmental organizations (NGOs) (Keeney, 1992; Sayers et al., 2012) (Figure 2.2). For an affected community, the basis for goal setting begins with questions such as:
• What risks are we facing?
• What risks are we willing to tolerate?
• What risks are not acceptable under any circumstances?
BOX 2.2
Role of Emergency Managers in Risk Management and Disaster Resilience
Although progressive emergency managers anticipate future disasters and take preventive and preparatory measures to build disaster-resistant and disaster-resilient communities, many people are of the opinion that the general field of emergency management does not yet give enough attention to prevention and mitigation activities. Traditionally, emergency managers have confined their activities to developing emergency response plans and coordinating the initial response to disasters. In the future, emergency managers may need to become more strategic in their thinking about disasters in order to help communities respond to the risks they face. The role of the emergency manager necessitates a high degree of technical competence, but is increasingly evolving to include the roles of a manager and a policy advisor who oversee community-wide programs to address risk in all phases of the emergency management cycle. This cycle envelops the characteristics of resilience—to assist communities in preparing and planning for, absorbing, recovering from, and successfully adapting to adverse events. As key actors in risk management and increasing resilience in communities, emergency managers are required to understand how to assess hazards and reduce vulnerability, and to seek the support of public officials and the enforcement of ordinances that reduce vulnerability.
The goals and objectives of the community reflect the values of the key interested parties, current laws, public-sector institutional arrangements at the local, state and federal levels, and existing programs and policies (e.g., the National Flood Insurance Program [NFIP], the California Earthquake Authority, or homeowners insurance offered by the private sector).
Once goals, values, and objectives are established by the nation, state, and/or a community, the next step in the disaster risk management process is to identify the hazards (e.g., earthquakes, floods, hurricanes, tornadoes, droughts, ice storms and blizzards, wildfires, landslides, volcanic eruptions, infectious diseases, terrorism, biohazards) and determine whether exposure to them can cause adverse impacts to property, people, and the environment. Assessing risk, the next step in the process, is an assessment of the potential impacts associated with these hazards. Risk assessment provides estimates of potential losses to lives and property and some estimate of annual likelihood of occurrence. Sensitivity analysis—part of risk assessment—estimates the efficacy of specific programs and policies in reducing or managing the risk associated with the hazard. Risk management strategies and decisions specify the types of information collected by different interested parties in the community and how these data are perceived and used in formulating strategies and programs for managing risk. One of the key factors in risk strategy implementation is determining which risks are acceptable or tolerable and which ones are not;
those that are not tolerable thus require management or mitigation (NRC, 2010). The potential consequences of hazards, including losses or disruptions, coupled with the perceptions of risks and consequences play into which risk strategies are used and how they are implemented.
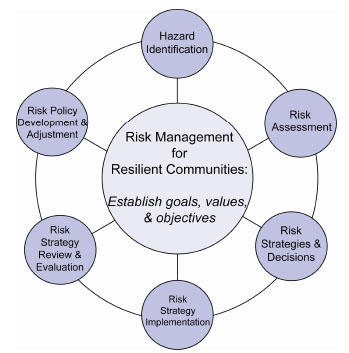
FIGURE 2.2 Continuous and reinforcing process of disaster risk management as a foundation for building resilient communities. Central to the risk management process is the collective evaluation by the community members—including individuals, emergency managers, governing officials, the private sector, and NGOs—of community goals, values, and objectives for the risk management strategy and for community resilience. The entire process, divided for convenience of discussion into six steps, encompasses the ability to identify and assess the local hazards and risks (steps 1 and 2), to make decisions as to which strategies or plans are most effective to address those hazards and risks and implement them (steps 3 and 4), and to review and evaluate the risk management plan and relevant risk policies (steps 5 and 6). The continuity of the process allows a community effectively to “enter” risk management at any point in the “cycle,” though identification of basic hazards and assessment of risks is of primary importance.
The last two steps in the disaster risk management process are to continuously review and evaluate risk strategies and to adjust or develop risk management policies. Although often overlooked, these steps are important, particularly as new opportunities arise, as policies are enacted, or as community goals shift. In designing and evaluating strategies for risk management, new information or data are also important to take into account. Such information may include, for example, knowledge of increased building development in known hazard areas that could increase the exposure to the hazard; the potential impacts of climate change that could affect the intensity or frequency of the hazard; and new and more accurate measurements of key parameters such as
precipitation, geological activity along faults, or coastal erosion that influence the way in which a hazard is understood and addressed. Recent disasters in the community or elsewhere can provide lessons and new points of useful information. By recognizing and reviewing risk strategies and available (and sometimes new) data on hazards and their impacts, adjustments can be made to overcome deficiencies and improve the existing set of policies, institutional arrangements, and strategies to develop new ones, allowing the risk management cycle to begin again. Emergency managers use risk management principles described in this cycle to establish priorities for the communities within their jurisdiction (Box 2.3).
BOX 2.3
Emergency Managers as Risk Management Practitioners
The following is extracted from the document “Principles of Emergency Management” (IAEM, 2007) and identifies some of the principles of emergency management that relate to the role of emergency managers as practitioners of risk management:
Emergency managers generally employ risk management principles such as hazard identification and risk analysis to identify priorities, allocate resources and use resources effectively. . . . Setting policy and programmatic priorities is therefore based upon measured levels of risk to lives, property, and the environment. The National Fire Protection Association (NFPA) 1600 states that emergency management programs should identify and monitor hazards, the likelihood of their occurrence, and the vulnerability to those hazards of people, property, the environment, and the emergency program itself. The Emergency Management Accreditation Program (EMAP) Standard echoes this requirement for public sector emergency management programs. . . . Emergency managers are seldom in a position to direct the activities of the many agencies and organizations involved in emergency management. In most cases, the people in charge of these organizations are senior to the emergency manager, have direct line authority from the senior official, or are autonomous. Each stakeholder brings to the planning process their own authorities, legal mandates, culture and operating missions. The principle of coordination requires that the emergency manager, or other actors responsible for risk management and increasing resilience, gain agreement among these disparate agencies as to a common purpose, and then ensure that their independent activities help to achieve this common purpose.
Note: Information on NFPA 1600 is available at
http://www.nfpa.org/newsReleaseDetails.asp?categoryid=488&itemId=46745&cookie%5Ftest=1; EMAP information is available at http://www.emaponline.org/.
Foundation for Risk Management
Two elements provide the foundation for managing risks: identifying the hazards that affect the community and assessing the risks that such hazards pose (see Figure 2.2). Both are based on scientific information. Because these two steps provide the cornerstone for risk management, we provide more detail on the current methods for hazard identification and disaster risk assessment.
Hazard Identification
As noted earlier, hazard identification determines the types and characteristics of potential disasters facing a community or region (Box 2.4). For example, earthquake hazard is a combination of the likelihood of earthquake occurrence (location, magnitude, and recurrence rate of all future damaging earthquakes impacting a region) and ground motion predictions that are used to calculate the spatial distribution of shaking intensity for these future events. In a similar way, a hurricane hazard can be described by the spatial distribution of its projected path and wind speed and central pressure along that path. Assessing the likelihood of earthquake- and weather-related events typically is based on analysis of - both the historical and geological record of events, knowledge of the physical processes leading to the occurrence of a disaster, and real-time data collection and monitoring of natural (geological, atmospheric, oceanic) phenomena. Although historical records are important, limits exist on the extent to which generalizations can be made about how physical phenomena will evolve in the future. For example, expected changes in climate bring into question how to interpret historical data in characterizing the intensity and magnitude of future hurricanes and floods (Milly et al., 2008), and may increase the costs and losses associated with severe storms and extreme events in the years to come (Karl et al., 2009; NRC, 2011a; IPCC 2012).
BOX 2.4
Cedar Rapids, Iowa: Hazard Identification
In May and early June 2008, tornadoes and floods struck Iowa. The largest single tornado in the state in a 30-year period, an EF-5,a struck the town of Parkersburg, Iowa, 85 miles northwest of Cedar Rapids on May 25 and caused millions of dollars in damage, eight deaths, and the mobilization of significant state and local emergency response resources.
In early June, as the effects of the tornadoes were still being evaluated and absorbed, the residents and decision makers of Cedar Rapids were monitoring information about the potential for major flooding of the Cedar River which passes through the city center. The water levels in the Cedar and nearby Iowa Rivers and their tributaries had risen throughout the spring because the agricultural land that covers 74 percent of the state, still saturated from the
heavy winter snowmelt and without crop cover, together with an extensive network of subsurface clay drainage tile systems, contributed extensive runoff into the rivers. The high river levels were exacerbated by heavier-than-average precipitation during the spring (Bradley, 2010; Krajewski and Mantilla, 2010). Having endured record floods in 1993 when the Cedar River crested in Cedar Rapids at 22.5 feet (the river’s flood stage is 12 feet), most citizens, officials, emergency personnel, businesses, and museums held some expectation that they would not risk another “100-year flood” in 2008. When the Cedar River eventually crested (see Figure 2.1) at more than 31 feet, it was well above what would characterize a “500-year” flood event.b
Hazard identification is more than just historical experience with hazard events; it includes the identification of potential sources of disaster to the community and the likelihood and expected impacts of future events. Cedar Rapids has multiple sources of natural hazards: floods, severe weather (thunderstorms and hail; severe winter weather), tornadoes and severe wind storms, and heat waves. Cedar Rapids (Linn County) is also located 9 miles downstream from the Duane Arnold Energy Center, a commercial nuclear power facility, and is within the emergency planning zone for that facility, adding a direct human-made hazard to the area.
The city and county have a risk mitigation strategy in place for the nuclear power facility: the city’s emergency planners, hospital personnel, and citizens drill four times a year along established evacuation routes. These drills, including the relocation of essential medical facilities and personnel proved essential during the response to the flooding of the Cedar River into the city in the second week of June 2008. According to the health personnel and emergency responders with whom the committee spoke in their visit to Cedar Rapids, the preparation and planning involved in preparing for that single, human-induced hazard played a large role in the fact that no lives were lost to a different hazard that evolved into a disaster during the flooding in 2008.
a “EF” equates to the Enhanced Fujita scale, which is a tornado rating based on estimated wind speeds and damage. The scale ranges from EF-0 to EF-5. At EF-5, wind speeds are estimated to exceed 200 mph for 3-second gusts (http://www.crh.noaa.gov/arx/efscale.php).
b The 100-year floodplain is the boundary of the flood that has a 1 percent chance of being equaled or exceeded in any given year; the 500-year floodplain has a 0.2 percent chance of being equaled or exceeded in any given year.
Sources: Panelists in the committee’s field trip and workshop in Cedar Rapids and Iowa City (see Appendix B for list of panelists); www.linncounty-ema.org;http://www.crh.noaa.gov/Image/dmx/Iowa%20Tornado%20Statistics%201980-2008%20Graph.pdf.
Data and characterization of weather-related events and other natural hazards such as earthquakes, floods, or wildfires are made by federal agencies such as the U.S. Geological Survey (USGS), National Oceanic and Atmospheric Administration (NOAA), Federal Emergency Management Agency (FEMA), U.S. Army Corps of Engineers (USACE), National Aeronautics and Space Administration (NASA), and U.S. Forest Service, each of which has
responsibility for collecting data and monitoring these phenomena (see Chapter 6 for more detailed description of these federal roles and Appendix C for some of the kinds of data that these agencies collect and monitoring that they conduct). Much of this information is provided to communities in data tables or in the form of maps.
One example of a quantitative hazard assessment for a specific hazard is well illustrated by the USGS National Seismic Hazard Mapping Project, recognized both nationally and internationally as the authoritative analysis of earthquake hazard in the United States. The USGS process includes solicitation of input parameters from regional experts, a logic-tree approach to capture the range of scientific uncertainty in input parameters, transparency regarding all input data and methodology, and online accessibility to a wide array of digital hazard maps and derivative products.3 One of the major strengths of the USGS Seismic Hazard Maps is that they are probabilistic; that is, they provide estimates of ground-shaking levels at different return periods for the full array of potential future earthquakes and take into account each earthquake’s rate of occurrence.
Many communities address their potential hazards in a qualitative way, such as by defining high-, moderate-, and low-hazard zones, or through scenarios of likely or worst-case events, but only a probabilistic hazard assessment quantitatively captures potential events and their impacts together with their likelihood of occurrence. Probabilistic hazard assessment draws from historical data but also from longer-term records of past events from the geological record. The USGS’s probabilistic hazard is used to develop outputs of earthquake ground motion for designing buildings and structures that accord, for example, with the 2012 International Building Code.4 For example, most building codes in the United States are based on the USGS’s estimate of the ground motion level with a 10% probability of exceedance in 50 years. This corresponds to ground motions with a 475-year return period, or the highest shaking level expected from any nearby earthquake source that is likely to occur over the next 475 years.,5 Probabilistic hazard is also the input used in risk assessment to compute probable losses at different return periods and is thus used to determine insurance premiums for relatively low likelihood but high-impact events.
The largest federal hazard mapping program is NFIP’s flood insurance rate maps, produced for the community level. These maps identify areas subject to flooding from events of varying intensity based on elevation, channel morphology and streamflow, and watershed conditions. Elevation data are based on topographic features using digital elevation models. The flood risk information is based on hydrological and hydraulic analyses, historical data, and
______________
3See http://earthquake.usgs.gov/hazards/.
4 https://geohazards.usgs.gov/secure/designmaps/us/
5See USGS FAQs: http://earthquake.usgs.gov/learn/faq/?faqID=223.
watershed characteristics as they affect runoff. Although the flood mapping process and inputs are well known, actually making accurate flood maps and maintaining the information are complex (NC, 2009). Limitations in our understanding of floodplain boundaries, needed improvements in predictive and probabilistic flood models (riverine and storm surge), and enhanced topographic accuracy (NRC, 2007a, 2009) render the timely production of flood maps a costly but essential proposition for communities and the federal government (Box 2.5).
BOX 2.5
A College Campus Benefits from Flood Maps After Hurricane Irene (2011)
The Russell Sage College Campus in Troy, New York, sits within two blocks of the Hudson River, north of Albany. On August 28, Hurricane Irene had passed through the area. Although Monday, August 29 was clear and sunny, the Hudson River was rising. The disaster management team at the college used FEMA flood maps to estimate the risk of campus flooding, which would necessitate the evacuation of all personnel and students who had just arrived to begin the fall semester. Although the start of the academic year had to be delayed, the river stopped rising just below the level at which the campus would have flooded. Only the basements of two low-lying buildings were affected. The flood maps were essential in preventing an unnecessary evacuation.
In some states, the federal and state agencies work together to develop authoritative zoning maps to identify areas subject to multiple levels of hazards for a variety of perils such as landslides, liquefaction, and surface fault rupture. Also, new technologies are making possible increasingly higher resolution and more sophisticated and detailed hazard identification maps such as the characterization and monitoring of wildfire activity (Figure 2.3).
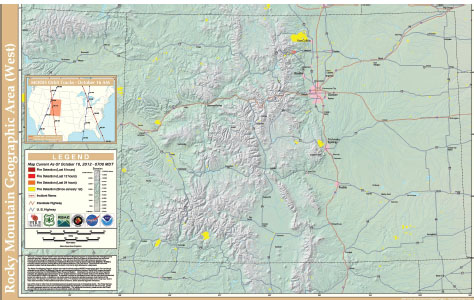
FIGURE 2.3 Active wildfire map of part of the Rocky Mountain area showing wildfires (yellow) from the U.S. Forest Service Remote Sensing Applications Center. The Active Fire Mapping Program is a satellite-based fire detection and monitoring program that provides near real-time detection and characterization of wildland fire conditions for the continental United States, Alaska, Hawaii, and Canada. Detectable fire activity in the United States and Canada is mapped and characterized by the program. High temporal image data collected by NASA’s Moderate Resolution Imaging Spectroradiometer (MODIS) are the primary remote sensing data source of this program at present. MODIS provides multiple daily observations of the United States and Canada, which is ideal for continuous operational monitoring and characterization of wildland fire activity. Such data and maps are essential for those fighting the fires, as well as for city and town officials, and individual homeowners. Source: U.S. Forest Service, Remote Sensing Application Center.
Risk Assessment
The risk assessment process combines the physical characteristics of potential hazards obtained through hazard identification with data on exposure, vulnerability, and mitigation measures. Risk assessment involves estimating the likelihood of specific events occurring, their potential consequences, and the uncertainties surrounding these estimates.
At the simplest level, a community can overlay maps of high, medium, and low hazard (as described above) on maps of exposure (properties at risk) to estimate disaster risk. A more rigorous approach would include an additional layer of structural vulnerability (susceptibility to damage from impacts from that hazard) to determine the riskiest regions in a community (those with high vulnerability, large exposure, and high hazard) and the effects of mitigation measures. Many communities now use geographic information systems (GIS) to map the location, type, and value of community assets. GIS provides the ability to store and manage vast amounts of spatially referenced information and thus has become an ideal environment for conducting cost-effective hazard and risk assessments.
Risk assessment was greatly improved by the confluence of two developments in the last several decades: development of scientifically based probabilistic hazard assessment (quantifying the rate of occurrence and magnitude of hazard events and their impacts; Cornell, 1968) and advances in information technology and GIS (Cutter, 2001; NRC, 2007b; Emrich and Cutter, 2011). Taking advantage of these developments, a new risk management industry developed in the late 1980s and early 1990s and created computer-based models for quantifying probabilistic catastrophe risk and loss potential at different return periods. These so called probabilistic “cat models” (catastrophe models) now form basis for determining premiums for natural hazard insurance (Grossi and Kunreuther, 2005).
FEMA has produced a freely available catastrophe modeling tool, HAZUS, to provide communities with the capability to run scenarios or actual events (earthquake, flood, and hurricane wind) impacting the community in order to estimate losses (e.g., property damage, casualties, infrastructure disruption, and displaced households) for planning or post-disaster recovery operations (see Chapter 3, Figure 3.4 for HAZUS example).6 Catastrophe models such as HAZUS present an opportunity for community leaders, regulators, and emergency management agencies to design risk management strategies by comparing potential losses with and without mitigation measures in place for specific scenarios, so called deterministic (as opposed to probabilistic) risk. Such applications require upgrading of the default HAZUS building and infrastructure inventories to get meaningful local loss results. Additional improvements in the direct and indirect economic loss modules would also be relevant to translate these losses into business interruption losses for direct customers and indirect losses up and down the supply chain. A HAZUS study for an earthquake scenario that involved an earthquake of magnitude 7.7 striking in the middle of the country near New Madrid, Missouri, was recently released. The study invested considerable effort in populating the public infrastructure database in HAZUS and determining appropriate infrastructure fragility relationships in order to more accurately determine potential impacts to the infrastructure network (Elnashai et al., 2009). Similarly, the state of North Carolina is in the process of developing detailed exposure data on the inveantory (location and construction type) for all structures in all communities as a means for improving the accuracy of the input data for the HAZUS loss model.
______________
DECISION MAKING UNDER RISK AND UNCERTAINTY
Decisions on risk-reduction and mitigation strategies are a function of the roles and responsibilities of decision makers, the influences on these decision makers, and the policy options available to them. Given different backgrounds and inherent conditions, communities faced with the same challenge may develop entirely different portfolios of risk reduction measures. As mentioned previously, actions that can reduce short-term risk can potentially increase long-term risk. For example, elevating homes in a coastal area above currently predicted storm surge levels may encourage continued development in an area that is subject to a variety of other hazards such as wind storms, coastal erosion, flooding, and hurricanes for which home elevation alone may not adequately reduce the long-term risk. Another example, detailed later in this chapter is building of levees or other structures that are designed to prevent floodwaters, storm surges, or other hazards from reaching areas that are at risk. In the short term, the presence of the levee may reduce risk to the local hazard; however, if the upper limit to the capability of these structures is ever exceeded, the consequences to those with homes or businesses behind the levee can be catastrophic (Tobin, 1995; Burby, 2006; Cutter et al., 2012; NRC, 2012). Decision making for risk management that helps to increase disaster resilience includes analysis of costs and potential benefits; the significant challenges lie in recognizing that benefits, whether economic or otherwise, are not necessarily equally distributed among those incurring the costs. This topic is explored in more detail in Chapter 3.
The key actors in managing disaster risk include the public sector at local, state, and federal levels who conduct and design hazard management programs; residents and businesses in hazard-prone areas; those who provide ways to mitigate losses prior to a disaster (e.g., developers, insurers, banks, and NGOs); those who provide services to those affected by the disaster during the recovery period (e.g., emergency managers, fire, police, hospitals, and NGOs); and the research community that provides analysis of risk, hazards, and disasters. Some of the responsibilities, challenges, and opportunities facing these key interested parties are captured in Table 2.1.
TABLE 2.1 Responsibilities, Challenges, and Opportunities of Key Interacting Parties in Risk Management
| Interested Party | Responsibility | Challenges | Opportunities |
| Federal government | Provides, and in some cases operates, protection structures for communities; supports NFIP; provides disaster assistance | No comprehensive or coordinated approach to disaster risk management | Stemming the growth in outlay of post-disaster recovery funds |
| State and local governments | Ensure public health and safety in use of land, zoning, land-use planning, enforcement of building codes, development of risk management strategies | Reluctance to limit development; difficulty in controlling land use on privately owned land | Reaping benefits of multiple ecosystem services by investing and strengthening natural defenses |
| Homeowners and businesses in hazard-prone areas | Take action to reduce vulnerability and increase resilience of property | May be unaware of or underestimate the hazards that they face | Creating demand for disaster- resistant or retrofitted structures that have increased value |
| Emergency managers | Oversee emergency preparedness, response, recovery, and mitigation activities | More focused on immediate disaster response than risk management | Reorientation of training and roles to balance focus toward prevention and overall disaster resilience |
| Construction and real estate | Incorporate resilience into designs; inform clients of risk | Actions may increase cost and reduce likelihood of sales | New opportunities in niche market |
| Banks and financial institutions | Require hazard insurance | No incentives to require insurance | Reduce overall risk in their portfolios |
| Private insurers and reinsurers | Offer hazard insurance at actuarial rates; identify risks | Limits may be placed on rate structures | Greatly expanded and risk-reduced market by offering incentives such as premium reductions for retrofit measures |
| Capital markets | Catastrophe bonds” and other alternative risk transfer instruments | Availability limited due to globalized financial markets | Large resource base and new investment opportunities that could be directed in an anticipatory way |
| Insurance rating agencies | Identify stability of insurers | May negatively impact insurer position | Transparency to enable informed decisions on the part of consumers |
| Researchers | Collect, analyze, and communicate data, forecasts, and models about risk, hazards, and disasters | Insufficient or dispersed datasets; understanding how to share scientific information with broad audiences | Increased forecasting capability and improved data- based models of physical processes leading to disasters |
aCatastrophe bonds (“cat bonds”) are risk-linked financial tools that can be used by insurancecompanies to cover the potential risk of a major catastrophe and the premiums that would have to be paid by the insurance company if the disaster or catastrophe was to occur. Insurance companies are required by state law to have capital on hand to cover routine losses, but for higher losses, they may buy reinsurance or issue cat bonds. The insurance companies issue cat bonds through an investment bank to investors. The insurance company will use the funds from the bond issuance to pay insurance claims if a catastrophe occurs; if the catastrophe does not occur within a specified time interval (usually some number of years), the insurance company pays the amount of the bond with interest to each investor. See Kunreuther and Michel-Kerjan (2011, Chapter 8).
bank to investors. The insurance company will use the funds from the bond issuance to pay insurance claims if a catastrophe occurs; if the catastrophe does not occur within a specified time interval (usually some number of years), the insurance company pays the amount of the bond with interest to each investor. See Kunreuther and Michel-Kerjan (2011, Chapter 8)
Empirical and experimental research by economists, geographers, psychologists, and other social scientists reveals systematic biases that decision makers pursue with respect to their perception of risk, their experiences, and the actions they choose to take in advance of a disaster and after an event occurs (Slovic et al., 1978; Slovic, 1987, 2000; Kunreuther et al., 2012). Those behavioral features most influential in the development of risk management policies include (see also Box 2.6):
• Risk perception. Psychological and emotional factors that define risk perception have an enormous impact on behavior (Magat et al., 1987; Huber et al., 1997; Slovic, 2000).
• Status quo bias. There is a tendency to maintain current behavior rather than seek new options. If given an opportunity to postpone an investment for a month or a year, there will be a tendency to delay the outlay of funds (Samuelson and Zeckhauser, 1988).
• Myopic behavior. There is a tendency for individuals to be myopic when making decisions with respect to preparing for disasters. By focusing on short-term returns, they fail to invest in risk-reducing measures that could be justified financially when comparing costs and expected returns over the expected life of the property (Kunreuther et al., 2012).
• Simplified decision rules. In making choices with respect to protection against low-probability risks such as natural disasters, individuals often use decision processes that involve simplified heuristics and rules of thumb rather than undertaking more systematic evaluations of alternatives such as rigorous benefit-cost analyses (Camerer and Kunreuther, 1989; Kahneman and Tversky, 2000).
• Reframing likelihood data. Communicating risk information is of fundamental importance but such information is not always successfully transmitted to decision makers who most need it. By reframing information on the likelihood of an extreme event occurring, it may capture the attention of decision makers rather than being below the threshold level of concern. For example, if a flood with a return period of 100 years was presented as having a greater than one in five chance of occurring in the next 25 years, then key stakeholders may have an interest in taking steps to reduce the potential losses (Kunreuther et al., 2001; Galloway et al., 2006).
BOX 2.6
Lessons from the Field: Behavioral Basis for Decision Making
Risk perception and purchasing flood insurance: Personal experience with flooding in Cedar Rapids led to those residents closest to the river to take measures to protect their property by purchasing flood insurance, by moving their possessions off the ground floor, and sandbagging. However, on the west side of the city, which has a higher percentage of elderly, lower-income, and disabled residents, only a limited number of homes (information shared with the committee indicated about 10 percent of residents) had flood insurance (Figure).
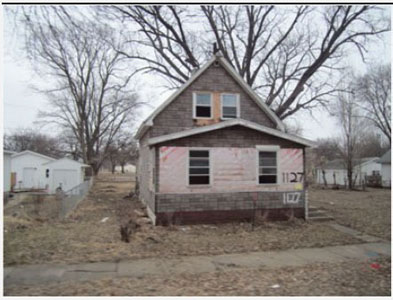
FIGURE. One of the homes on the neighborhood on the west side of the Cedar River in Cedar Rapids that was inundated by floodwaters. Although many homes have been rebuilt to more flood-resistant standards in this neighborhood through concerted community and city effort, many homes remain damaged and uninhabited. Cedar Rapids continues to perform more than 1,200 acquisitions and has demolished about 900 structures. More than 200 structures remain damaged and uninhabited.
Photo source: John. H. Brown Jr./The National Academies.
Status quo bias: This bias is illustrated by the relative lack of preparedness demonstrated by the city of New Orleans and FEMA in advance of Hurricane Katrina in 2005. Two months prior to the storm, the city conducted a full-scale simulation that demonstrated what would happen if a hurricane of Katrina’s strength struck (Brinkley, 2006). As the active hurricane season approached, little was done to remedy known flaws in their preparedness plans. strength struck (Brinkley, 2006). As the active hurricane season approached, little was done to remedy known flaws in their preparedness plans.
strength struck (Brinkley, 2006). As the active hurricane season approached, little was done to remedy known flaws in their preparedness plans.
Simplified decision rules bias: In Waveland, Mississippi, town officials acknowledged they were not prepared for a storm event of Katrina’s magnitude. No event of that magnitude had ever occurred in Waveland that might have allowed residents or decision makers to anticipate the ultimate effects of the storm. A railroad embankment had for years protected homes north of it in previous hurricanes, so residents behind the embankment felt less need to evacuate. As a result of the decision not to evacuate, fatality rates were higher in Waveland than elsewhere on the coast (NRC, 2011b).
Reframing likelihood data: As the Cedar River rose in June 2008, federal government agencies provided updated information and data on the change in the river level and the weather—the National Weather Service (NWS), the U.S. Geological Survey (USGS; which maintains stream gagesa), and the U.S. Army Corps of Engineers (USACE, which maintains the levee system and regional reservoirs) exchanged updates with one another, with city officials and emergency personnel in Cedar Rapids, and with state emergency and health personnel. In response to these updates and other information on conditions in the city, the local and state personnel communicated and continuously reframed their plans and responses as the river level climbed and the likelihood of a large flood became evident.
aStream gages measure and record river stages (height) and send the data in real time to a central office and over the Internet. These stream gages are distributed across the nation, and are maintained by the USGS, and are usually funded cooperatively with state or local governments. These data are provided to other government agencies such as the NWS and USACE.
RISK MANAGEMENT STRATEGIES AND MEASURES
Risk management strategies often represent the integration of structural and nonstructural measures designed to reduce vulnerability and mitigate consequences. In some cases, the risk management strategy consists primarily of structural (construction-related) measures such as levees, floodwalls, or disaster-resistant construction and retrofitting. Other strategies may focus on nonstructural (nonconstruction-related) means such as land-use management and planning, utilizing natural defenses such as swamps and wetlands (green infrastructure) to reduce the impact of flooding on communities, building codes, insurance, early warning systems, and evacuation. In most cases communities include portfolios of both structural and nonstructural measures; the combination of these measures improves the likely success of reducing hazard impacts and also improving resilience.
In evaluating alternative measures for managing risks associated with natural disasters and making the community more resilient, decision makers
need to comprehensively evaluate the advantages and disadvantages of each measure and the possible impacts on different individuals and groups residing in the community over time (Box 2.7). For example, a strategy that appears to mitigate some of the risks effectively (e.g., not allowing homes or businesses to be rebuilt on a floodplain) may have an adverse impact on one or more social groups and would therefore be deemed unacceptable by some members. Another proposed measure could create long-term fiscal commitments for the community that cannot be met without additional taxes that would be deemed by most residents to be unacceptable. Finding consensus among these needs and requirements is essential to implementation of any risk management strategy. The subsequent paragraphs provide a brief description of the principal structural and nonstructural measures currently being employed. Table 2.2 highlights typical actors, time frames, and potential benefits and adverse impacts of the structural and nonstructural measures and tools discussed below.
BOX 2.7
Determining Costs and Benefits of Different Management Strategies
Once the hazard is identified and assessed, decision makers can determine what strategies they will employ to reduce the risk the community faces. In developing these strategies officials need to estimate the benefits and costs of different measures as well as determining who should pay for them. If a probabilistic risk assessment has been carried out, there is a sound actuarial basis for analyzing the cost-benefit analysis of potential risk reduction/mitigation measures. Insurance can play a key role in encouraging the adoption of these measures. Suppose a family could invest $1,500 to strengthen the roof of its house so as to reduce the damage by $30,000 from a future hurricane with an annual probability of 1/100. An insurer charging a risk-based premium would be willing to reduce the annual charge by $300 (i.e., 1/100 x $30,000) to reflect the lower expected losses that would occur if a hurricane hit the area in which the policyholder was residing. If the house was expected to last for 10 or more years, the net present value of the expected benefit of investing in this measure would exceed the upfront cost at an annual discount rate as high as 15 percent so that the measure would be deemed to be attractive and viewed as cost-effective. If the homeowner could obtain a $1,500 home improvement loan tied to the mortgage at an annual interest rate of 10 percent, this would result in payments of $145 per year. Assuming that the insurance premium was reduced by $300, the savings to the homeowner each year would be $155 ($300-$145).
Structural (Construction-Related) Mitigation
The effect that hazards have on an exposed area can be mitigated by structural systems put in place to reduce the effects of the event. Some of these are locally developed, owned, and operated, while others require negotiated partnerships and joint decisions between local, state, and federal interests, and resources (Figure 2.4). A brief description of some of the most frequently used measures follows.
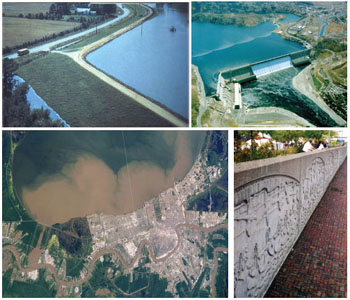
FIGURE 2.4 Structural Flood Mitigation Measures, clockwise from top left: Mississippi River levee; Grand Coulee Dam on the Columbia River in Washington; a floodwall that protects the city Winona, Minnesota, along the Mississippi River; and the Bonnet Carré Spillway, a floodway that diverts water from the Mississippi River into Lake Ponchartrain to reduce the flow passing New Orleans.
Sources: USACE (Mississippi River Levee)
http://www.mvd.usace.army.mil/mrc/mrt/Docs/Levees%20info%20paper.pdf; USACE (Winona floodwall) https://eportal.usace.army.mil/sites/DVL/DVL%20Images/cemvp191.tif; USBR (Grand Coulee Dam) http://www.usbr.gov/pn/grandcoulee/;http://users.owt.com/chubbard/gcdam/html/photos/exteriors.html; and NASA (Bonnet Carré Spillway) http://earthobservatory.nasa.gov/IOTD/view.php?id=8738l.
Levees, floodwalls, and similar structures
These structures are designed to prevent floodwaters, storm surges, or lava flows from reaching areas that are at risk. When the upper limit to the capability of these structures is exceeded, the consequences can be catastrophic. For example, when levees overtop or fail, those people behind the barriers are subjected to conditions more severe than they would have had if the flood or lava flow had been more gradual in its approach. The ways in which dam and levee safety can be integrated with community resilience have been discussed in a recent report (NRC, 2012).
Dams and flood control
Dams retain flood waters before they reach an area at risk. Some of the pool behind a dam is set aside to store floodwaters during high-precipitation periods and then release the stored water gradually to reduce the likelihood of damage to the community at risk. This storage can be inadequate if there are exceptional rainfall and snowmelt events and as was illustrated by the 2011 rain events on the Missouri River system. At some point, dams may no longer be able to contain the waters, and uncontrolled flows move downstream and either add to the existing flood or initiate flooding. On rare occasions, dams can fail and may inundate those below. Dam failures can cause significant property losses and environmental damage. State dam safety programs, for example, reported 132 dam failures in the period from 2005 to 2008,of these failures resulted in loss of life,7 although only one of these failures resulted in loss of life, in part because most of the dams were of limited size.
Floodways
Where the capacity of a river to pass a large volume of flood waters through a critical location is limited, floodways, spillways, or channels are constructed to carry these flows around the community or region. In the 2011 flooding along the Mississippi River, USACE relieved downstream flooding near Cairo, Illinois, by breaching upstream levees and flooding agricultural fields on leased land that had been held in reserve for exactly this purpose.
Disaster-resistant construction and retrofitting existing building stock
A significant opportunity to reduce loss in future events and thus increase resilience is to strengthen and/or retrofit the nation’s existing building stock. In the case of hurricanes, the new construction and retrofitting is relatively inexpensive and can include installation of exterior hurricane shutters
______________
7http://damsafety.org/newshttp://damsafety.org/news/?p=412f29c8-3fd8-4529-b5c9-8d47364c1f3e.
or replacing windows with impact resistant glass, garage door bracing, strengthening soffits, and securing loose roof shingles. In portions of the nation with high seismic hazard, strengthening older and structurally weak construction can require modest (in the case of wood frame one- to two-story structures) to substantial (in the case of 1960s and earlier nonductile concrete frame construction) investments. For structures that need to function immediately after an earthquake (such as hospitals, city halls, emergency operations centers) base isolation consisting of shock-absorbing devices that help isolate the building from strong ground shaking greatly reduces the possibility of damage; however, such strategies can be very expensive.
Hazard-conscious (“Smart”) building
Individual structures can be elevated, flood proofed or constructed to resist most hazard forces in order to reduce losses from future events such as floods, hurricanes, windstorms, and earthquakes (FEMA, 1998). “Smart” buildings can adjust to certain changes in conditions to counteract damaging structural reactions in response to an external hazard.
Securing building components and contents from damage from shaking, strong winds, or flooding
The failures of nonstructural components during earthquakes and other disasters may result in injuries or fatalities, cause costly property damage to buildings and their contents, and disrupt the operation of or force the closure of residences, businesses, and government offices. Bachman (2004) suggests that the nonstructural component and building content losses in recent events in developed countries represent 50 percent of total earthquake losses, but it is difficult to find sufficient data to substantiate this view.
Well-enforced building codes
Building codes can be adopted at the state or local level, but require local enforcement. Hurricane Andrew in 1992 revealed that one-third of the damage could have been avoided had Florida enforced its building codes (Kunreuther, 1996). Public officials may exacerbate the problem by not enforcing building codes and/or imposing zoning restrictions. See detailed descriptions in Chapter 5.
Nonstructural (Nonconstruction-Related) Mitigation and Risk Transfer
Nonstructural measures span a range of activities including securing building components and contents from damage due to strong shaking, winds, or floods; timely and accurate forecasts and warning systems; locally based changes in zoning and land use; and improved communication of risks. In many
instances, nonstructural measures for disaster risk reduction necessitate local control of decisions and implementation, although state and federal partnerships help support the programs. For example, U.S. residents can purchase flood insurance through the federally run NFIP when the communities in which they live agree to participate in the program. The program requires the community to adopt the flood insurance rate maps and to adopt and enforce floodplain management ordinances and control land-use development in the 100-year floodplain. Over 21,000 communities currently participate in the NFIP.
Natural defenses
Many types of natural defenses against disasters exist. For example, wetlands and swamps can store overflow waters from riverine flooding and help reduce downstream impacts; wetlands also provide a natural barrier to storm surge inundation (Galloway et al., 2009). Coastal sand dunes protect structures built behind them and help slow coastal erosion and also the immediate impact of rising storm surge. Communities and regions may include enhancement of these natural features to improve their risk reduction capabilities (Opperman et al., 2009).
Risk mapping
Combining the natural hazard risk assessment with quantitative consideration of mitigation measures yields expected outcomes that can be graphically portrayed in a manner that facilitates public understanding of the risk and its implications for them. Critical to risk mapping as a tool to manage risk is that the information is properly communicated to those who need to use the data. Risk communication is discussed in detail in Chapter 5.
Zoning ordinances
Zoning policies are locally controlled and enforced and can prohibit building or rebuilding in hazard-prone locations. See Chapter 5. for details on zoning and building codes.
Hazard and vulnerability disclosure
Everything that a buyer needs to know about a new car is on the Monroney sticker (United States Code, Title 15, Chapter 28, §§ 1231-1233). The Monroney sticker is required in the United States by federal law for new cars and includes, in addition to make, model, and serial number, items such as the final assembly point of the car, the manufacturer’s suggested retail price, optional equipment, safety ratings, and acknowledgment if the car has not been tested for safety. Except for disclosure mechanisms that have been legislated in a few states to inform potential home buyers that the property they are buying is
located in the pathway of a potential hazard, the real estate industry’s multiple listing service (MLS) is not required to provide information on the structural integrity of the house or its location with respect to nearby hazards. The MLS is not required to give any information about the roof construction and its tie-downs, for example, and it does not indicate if the home was built to code (either at the time of original construction or whether it meets present codes), or if additions or retrofits have been made by a licensed contractor or by someone who is not licensed.
In California, for example, zones of potential landslide, liquefaction, or fault rupture hazard have been mapped by the California Geological Survey as “special study zones” according to provisions in the California Alquist-Priolo Earthquake Fault Zoning Act of 1972.8 If a property is in one of these special study zones, the buyers must sign a form indicating that they have been made aware of this potential hazard and recognize that additional inspections and work may be required if they choose to modify the property in the future.
The U.S. Resiliency Council,9 a nonprofit organization, is working on creating building “report cards.” They are developing technically defensible metrics to evaluate and communicate the resilience of individual buildings. Their initial focus is on seismic risk, and they later plan to extend their efforts to creating metrics for resilience to catastrophic wind and flood risk. Transparency and required disclosure of these individual building resilience ratings will benefit building users, owners, and lenders by increasing the value of well-designed or properly retrofitted properties. Policy makers will be able to use
BOX 2.8
Property Transfer Tax Program, Berkeley, California
The Property Transfer Tax Program in Berkeley has provided funds for seismically retrofitting a huge number of properties in the city. In 1992, voters approved an additional 0.5 percent transfer tax on top of the existing 1 percent tax on all real estate transactions, with the tax paid equally by buyer and seller. This 0.5 percent portion of the transfer tax is available for voluntary seismic upgrades to residential property. Residential property owners have up to 1 year to complete the seismic retrofit (or lose the funds). Since many homes sell for $750k to $1M or more in Berkeley, this amounted to $3,750-5,000 in “free funds” and can cover homeowner upgrades such as brick chimney bracing or anchoring water heaters. This incentive program has an 80-90 percent participation rate. Along with other measures, this program has led to more than 60 percent of the residences in Berkeley becoming more seismically resistant.
SOURCES: http://www.ci.berkeley.ca.us/ContentDisplay.aspx?id=6282;
http://www.eeri.org/mitigation/files/berkeley.transfer.tax.rebate.pdf.
______________
8 http://ceres.ca.gov/planning/pzd/2000/pzd2000_web/pzd2000_misc19.html.
ratings of buildings in their communities to compare and prioritize relative risks and to form a basis for developing long-term resilience policy. Ultimately, these ratings will benefit our communities by creating market demand for better building construction overall.
Economic and tax incentives
Both positive economic incentives (e.g., subsidies, grants) and negative ones (e.g., fines, penalties) encourage individuals to undertake protective measures. The way that people process information on how these incentives affect the costs and benefits of reducing the risk plays an important role in their decision on whether to adopt the measures (Box 2.8). Several resilience tactics that can reduce business interruption losses after a disaster hits would include those in Box 2.9. Although these resilience tactics are implemented after an event, resilience capacity can be enhanced before an event by actions such as increasing inventories, identifying alternative supply-chain sources and operating locations, and conducting emergency planning drills. In addition, many inherent features of the operation of organizations and the economy as a whole can contribute to resilience. These features can refer to survival motivations that cause businesses and households to make appropriate resilience decisions, as well as the resilience inherent in the market system, where increased prices signal resource shortages and spur more efficient resource allocation (Rose, 2009; NRC, 2011c). Another approach is through tax incentives. For example, if a homeowner or business owner reduces the chances of damage from a hurricane by installing a mitigation measure, the taxpayer could be eligible for a rebate on state taxes to reflect the lower costs for disaster relief.
Hazard forecasting and warning systems
More detailed weather forecasts of the path and severity of a tropical storm or NOAA-developed tsunami warning alerts for U.S. coastal regions can be a key to timely evacuation decisions or movement to shelters (Appendix C). Improvement in the precision of these forecasts is critical for both averting disasters and minimizing their impacts (NRC, 2006a). The broadening of disaster losses to include longer-term impacts and indirect costs such as business interruption (see Chapter 3) has made forecasting more complex. Better and timelier data on the systemic risks also affect the lightly regulated but highly leveraged financial products such as catastrophe bonds.
In addition to forecasting, timely and effective warning about an impending hazard can reduce loss of life and the impacts of disasters by giving people time to take shelter or flee the area (UNISDR, 2007). Early warning systems such as sirens, e-mail, or targeted cell-phone alerts are effective for tornadoes and flash flood events. In all cases, tying early warning systems closely to education and communication programs are critical to develop citizen
understanding of the hazard and the actions that citizens can take to plan for and respond to an event (see also Chapter 5; Appendix C).
BOX 2.9
Examples of Post-Disaster Economic Resilience Tactics
• Conservation—maintaining production with fewer inputs.
• Input substitution—shifting input combinations to achieve the same function or level of productivity.
• Inventories—maintaining both emergency stockpiles and ordinary working supplies of production inputs.
• Excess capacity—temporarily reducing capacity by idling plant and equipment.
• Relocation—changing the site of business activity.
• Resource independence—continuing the portion of business operation that can go on without a critical input.
• Import substitution—importing resources from other regions, including new contractual arrangements.
• Technological change—finding new ways to restore functions, to increase production, to change hours of operation, and to respond to altered product demands.
• Production recapture—working overtime or extra shifts to recoup lost production.
Insurance
Insurance is an economic means to allow financial risk to be transferred from a single entity to a pooled group of risks through a contract (Kunreuther and Roth, 1998). The insured party receives an amount of coverage against an uncertain event (e.g., damage to property from an earthquake) in return for a smaller but certain payment (the premium). For a risk to be insurable the insurer has to be able to quantify or estimate the likelihood of the event occurring and the extent of claims when providing different levels of coverage, and to have the ability to set premiums for each potential customer or class of customers.
With respect to flood damage insurers refused to provide coverage since the 1927 Mississippi flood due to their inability to accurately assess the risk. The NFIP was established in 1968 as a result of increased federal relief triggered by disasters in the 1960s and the absence of adequate supply of insurance to cover this hazard (King, 2011). Box 2.10 discusses strategies for modifying the NFIP so that it encourages property owners to undertake mitigation measures in advance of a disaster so that their community is more resilient with respect to flooding.
Catastrophe bonds
To deal with a catastrophic loss, insurers, reinsurers, and governments can use alternative risk transfer instruments such as catastrophe bonds. The use of these financial instruments that take advantage of funds from the capital market grew out of a series of insurance capacity crises in the 1970s through the 1990s that led purchasers of traditional reinsurance coverage to seek more robust ways to buy protection. Catastrophe bonds can enable a country or an organization to access funds from investors if a severe disaster produces large-scale damage in return for premiums the organization pays for a prespecified amount of financial protection (Mahdyiar and Porter, 2005). Suppose the losses to an insurer from an earthquake in California covered by a cat bond exceed a pspecified trigger (e.g., $10 million). Then funds from the cat bond are provided to the insurer to cover a portion of the insurer’s claims payments.10
BOX 2.10
Making Flood Insurance Work
As of April 30, 2012, the National Flood Insurance Program (NFIP) covers more than $1.26 trillion of property, over five times what was covered 20 years ago.a However, people residing in flood-prone areas, many of whom are required to purchase coverage as a condition for obtaining a mortgage, often do not have flood insurance for a variety of reasons. For example, in Vermont, there are only 4,135 flood insurance policies (as of January 2012), which cover 1.3 percent of all housing units in the state.b Yet, many property owners residing in areas inundated by Hurricane Irene did not have flood insurance to cover the damage to their homes. Some of them were not able to buy a policy from the federal government because their community did not choose to enroll in the NFIP. Others did not perceive that they would be subject to water damage from hurricanes or tropical storms and chose not to purchase insurance. Still others in floodplains own their homes outright and thus are not subject to the mortgage requirements that otherwise require flood insurance.
Property owners commonly purchase coverage after they suffer losses from a disaster but then cancel their policies several years later if they have not suffered damage again because they view insurance as a poor investment (Kunreuther et al., in press). Difficulties arise in convincing people that they should celebrate their good fortune by recognizing that no return at all on their policy is the best return possible.
Currently, insurance premiums in the NFIP do not necessarily reflect the actual risks faced. This remains a challenge to the program because individuals may, as a result, not recognize the severity of the hazards they face.
Furthermore, reductions in insurance premiums are not awarded today, even if property owners invest in mitigation measures.
______________
10 For more details on the nature of catastrophe bonds and other alternative risk transfer instruments see Kunreuther and Michel-Kerjan (2011, Chapter 8).
Furthermore, reductions in insurance premiums are not awarded today, even if property owners invest in mitigation measures.
FEMA is now updating its flood maps to more accurately estimate the likelihood and potential consequences of future flooding to property at risk (NRC, 2007a, 2009). Premiums in many areas are likely to be higher than they are today and this increase could have a severe impact on low income and other households that need special treatment. For such reasons, people may not be enthusiastic about flood mapping even though more accurate flood maps can help individuals and communities assess flood risk. In cases where socially vulnerable members of a community may have difficulty paying insurance premiums as a result of new flood maps, insurance vouchers (similar in concept to food stamps) could be an option provided through federal programs. The NFIP was renewed in July 2012, and the legislation suggests that the Federal Emergency Agency and others examine ways to incorporate risk-based premiums coupled with means-tested insurance vouchers.c
One way to achieve resilience may also be to tie multiyear insurance policies in flood-prone areas to the property rather than to the individual to avoid cancellation of insurance. Enforcement of building codes through third-party audits by certified building inspectors could also help improve resilience. Home improvement loans for encouraging investment in loss reduction measures could be offered by banks with accompanying reductions in the cost of insurance to reflect the lower risk. In many cases the reduction in annual premiums may be greater than the annual loan payments. In these situations mitigating homes could be viewed as financially attractive. By modifying flood insurance in this way, we may avoid many of the problems faced, for example, by residents in the Northeast following Hurricane Irene (Michel-Kerjan and Kunreuther, 2011).
ahttp://bsa.nfipstat.com/reports/1011.htm.
bhttp://www.fema.gov/library/viewRecord.do?id=4566.
chttp://www.gpo.gov/fdsys/pkg/BILLS-112hr4348enr/pdf/BILLS-112hr4348enr.pdf.
TABLE 2.2 Illustrative Risk Management Tools, Actors, Time Frames, Benefits, and Potential Adverse Impacts
| Illustrative Risk Management Tools | Relevant Individuals, Groups and Organizations) | Time Frame |
Potential Benefits |
Potential Adverse Impacts |
| Structural (construction-related) | ||||
| Levees, dams, and floodways | USACE, USGS, FEMA; state, county, and local governments; researchers; private sector | 1-2 years, evaluation and decision; 3-50 years, construction | Flood risk reduction | Belief that levee will fully protect against all floods |
| Disaster- resistant construction and retrofitting of existing building stock | Federal government, local officials, researchers, private sector (risk management firms and engineering firms), professional organizations, individuals | On the order of weeks to years depending on measures employed and size of structure | Mitigation against extreme weather events, other natural hazards such as earthquakes and wildfires, floods, and hurricanes | Cost of the measures, belief that energy dissipation systems will fully protect against all hazards |
|
Hazard-
conscious (“smart”) |
Engineering and construction firms individual | Similar to or slightly longer time to build than other new homes | Mitigation against a variety of natural hazards; reduce losses | Cost may be higher than with non-hazard- conscious buildings |
| building | businesses and homeowners federal and state governments professional organizations | or businesses | ||
| Securing building components and contents | Building owners, tenants | At the time the building is occupied | Reduce earthquake (or other) damage for low investment | None |
| Well- enforced building codes | Local officials working in conjunction with USGS, NOAA, USFS, FEMA, NIST; engineering firms and professional safety and engineering organizations; businesses and homeowners | Code development: months to several years to review and revise existing codes relative to existing hazard risk Code enforcement: continuous | Home owners and business owners adopt mitigation measures; seals of approval on homes to show that property meets mitigation standards | Inability of some residents to afford compliance and lack of safety net |
| Nonstructural (nonconstruction-related) | ||||
| Natural defenses | Communities, regions, states, federal government | 1-4 years: evaluation and decision; from 3 years to many lifetimes | Protect structures built behind them by reducing impacts of disasters (wind, water, fire) | May prevent building new structures on protected areas; requires long-term perspective |
| Risk mapping | FEMA, USACE, NOAA, NASA, USFS, USGS in conjunction with state and local authorities; engineering firms | Weeks to several years depending upon quality and availability of data and map area covered | Communication of the hazard risk to the community | Overreliance on accuracy of maps |
| Zoning ordinances | Local and state governments | Immediate | Prohibits building or rebuilding in hazard-prone locations | May prevent lucrative construction of homes or businesses in specific areas |
| Hazard and vulnerability disclosure | Private sector; federal, state, and local governments | Immediate if adopted freely by the private sector; several years or more if new legislation is required to implement | Allows buyers to identify potential hazards or construction known to be vulnerable to such hazards before the purchase of a home or business; increases the value of disaster-resistant buildings | May hinder sales or lower property values in areas where hazards are revealed or for vulnerable construction types |
| Economic and tax incentives | Federal, state, and local governments | May be quickly adopted and implemented if political will, competing demands for resources, and public acceptance align; realization of returns on investment | Subsidies, grants, fines, or tax rebates can provide incentives to homeowners and businesses to install hazard mitigation measures | Negative incentives (fines, penalties) may not be acceptable to residents or businesses; positive incentives (subsidies, grants, rebates) incur immediate costs to the government with delayed return on investment |
| may be months to many years | ||||
| Hazard forecasting and warning systems | NOAA, USGS, USACE, NASA, USFS, state agencies, private sector | Constant data collection and monitoring | Allows forecasts of potential events and their impacts to be made; when communicated in a timely way, warning systems can save lives | Complex disasters and natural systems, increasing population, and potential longer-term impacts require increased data precision and better forecasting models |
| Insurance | FEMA, state insurance commissioners, private insurance industry, banks | Policies currently are issued on an annual basis but some consideration is being given to multiyear insurance tied to the property | Risk-based pricing that communicates level of risk to people in hazard-prone areas; vouchers for lower-income owners | Continued public financial assistance to those who do not buy insurance |
| Catastrophe bonds | Insurers, banks, investors | Typically 1 to 3 years | Risk is transferred to a broad investor base in the event of a catastrophic event; allows access to large fund amounts fairly quickly | Investors lose invested funds if a catastrophic event occurs; insurers pay bond amount with interest if the event does not occur |
Note: FEMA = Federal Emergency Management Agency, NASA = National Aeronautics and Space Administration, NIST = National Institute of Standards and Technology, NOAA = National Oceanic and Atmospheric Administration, USACE = U.S. Army Corps of Engineers, USFS = U.S. Forest Service, and USGS = U.S. Geological Survey.
IMPROVING RESILIENCE THROUGH RISK MANAGEMENT
Several themes emerge from disaster risk management, which provide a foundation for increasing the resilience of communities to hazard and disaster risks (Sayers et al., 2012):
1. Risk cannot be eliminated completely, so some residual risk will continue to exist and require management actions. The impacts of past natural disasters, particularly recent ones, are not necessarily a key to the future for several reasons. Society and its support systems have become increasingly interdependent (Chapter 1). In addition, human activity and development have destroyed much of nature’s defenses against natural hazards. This fact, coupled with likely changes in the physical environment due to climate change, suggests that future hazard probability and exposure will rise if no actions are taken. Historic records are short in a geological time frame, and the possibility exists for more severe floods, earthquakes, or other disasters.
2. The nature of risk perceptions and behavioral biases are important to consider in developing risk management strategies. The public and decision makers often underestimate the likelihood of a disaster occurring and hence do not undertake risk-reducing measures beforehand. Short-term strategies may also dominate when deciding what action to take. These behavioral features need to be considered when determining what types of risk management strategies are likely to increase resilience to disasters.
3. A diverse portfolio of disaster risk management measures provides options for decision makers and communities before, during, and after disasters. Such a portfolio can aid in efficient use of resources and more effective risk management. A portfolio with diverse risk management measures provides multiple options for enhancing resilience to a community in case one of the measures should fail. Combining well-enforced building codes and insurance with structural reinforcements or other measures can take on special significance to protect the community or region against physical and financial losses should structural measures (e.g., dams and levees, natural defenses) fail to provide full protection against the hazard. A key balance is that between investment in resources for managing disaster and the likelihood and magnitude of the hazards.
3. The need for science-based objective hazard identification and risk assessments is a critical input into the risk management process. Such input should be easily communicated to the community, with information and data that are transparent and not cloaked in an unpublished model, with all details proprietary. The sole reliance on anecdotal information, past experience, or deterministic scenarios does not provide an adequate or rigorous foundation for determining disaster risk.
5. Reflecting risk in insurance premiums while keeping insurance acquisition affordable to those requiring special treatment can encourage more individuals to purchase insurance policies. When insurance premiums are based on risk they provide signals about the hazards individuals face and can encourage them to adopt cost-effective mitigation measures to decrease their vulnerability to future disaster losses. General public funding, as opposed to insurance premium subsidies, can provide insurance for homeowners currently residing in hazard-prone areas and who may be socially vulnerable but are uninsured or inadequately insured.
6. Communicating risk in ways that are understandable to the public is a critical aspect of the risk management process. Decision makers and the public require accurate information on the risks they face. Risk maps, framing of information, social networking, and educational processes can be employed to communicate information on the risk and on mitigation measures (Sayers et al., 2012; this topic is addressed in detail in Chapter 5).
To achieve resilience the federal government has a dominant leadership role in supporting research to improve forecasting, impact-modeling capabilities, as well as the efficacy of risk-reduction strategies for the physical, public health, ecological, and socioeconomic aspects of natural and human-made disasters. Over the last several decades, significant investment by federal and state agencies in both land-based and space-based monitoring and observation networks for natural hazards has greatly increased our ability to forecast the likelihood and characteristics (e.g., magnitude, path) of future event occurrence as well as the intensity of the physical impacts of natural hazard events (e.g., ground-shaking level, wind speed, inundation depth). These data networks provide a quantitative basis for accurate, real-time meteorological forecasting, as well as early warning of flooding and tsunamis. In addition, these hazard monitoring networks provide a multidecadal baseline to help evaluate natural variability as well as the impacts of climate change.
The digital technological revolution made hazard monitoring network data available in real time and, in some cases, permitted rapid computer-automated, preliminary data analysis. The nation relies on a number of essential land-based and space-based hazard monitoring networks for short-term forecasting and early warning, as well as for understanding the physical processes leading to natural disasters and their physical impacts. Both the sensors and the communication networks supporting them require continual maintenance as well as upgrades to take full advantage of technological advances in sensor capabilities and communications. However, resource limitations have prevented many federally run monitoring
networks from taking full advantage of the technological advances. The key federal hazard monitoring networks (along with the relevant reviews which include recommendations) are illustrated in Appendix C. Nearly all these networks have been the subject of outside reviews with consistent recommendations for upgrades. While it is beyond the scope of this report to repeat all the recommendations related to hazard monitoring in each of the NRC reports listed in Appendix C, we extend our strongest support for continued and adequate upgrading, expansion of coverage, maintenance, and staffing of the key hazard monitoring networks and observation platforms as outlined above. These data are essential for sustaining the forecasting and modeling capabilities required for national resilience.
Achieving resilience involves monitoring impacts in all the systems and the integration of data. While many hazard monitoring networks are in place, comparable networks for monitoring changes in the human systems as they affect vulnerability and resilience are lacking. Monitoring vulnerability and resilience requires long-term systematic data collection to capture for place-based human and environmental changes. A number of studies have advocated establishing place-based observatory networks on community resilience and vulnerability (Peacock et al., 2008; NRC, 2011c)—observatories that integrate social sciences, natural sciences, and engineering data in monitoring progress toward resilience.
Breakthroughs in hazard and risk assessment will come from better constraints on the key parameters in the models that govern the systems responsible for disaster impacts, such as the role of clouds in climate models, the three-dimensional effects of basins on strong ground shaking in earthquakes, and improved estimates of seasonal and diurnal changes in populations in hazardous areas. Research is also needed on the role and function of natural defenses against natural disasters (e.g., the capacity of coastal wetlands to help absorb storm surge, the role of swamps along rivers for floodwater storage), many of which have been severely compromised by actions of people. Until we fully understand the full ecosystem functions and feedback loops of these natural defenses, it is difficult to meaningfully evaluate whether it would be more cost-effective to restore wetlands or swamps or simply build or continue to raise and strengthen a system of levees downstream.
Research is also scant on the value of disaster mitigation and what factors strongly reduce losses. Targeted research into new materials and new processes for much more resilient construction of new buildings and infrastructure is needed, as well as assessment models of the role of retrofit standards to meet resiliency goals or effective strategies for addressing infrastructure interdependencies, . From a social science perspective, more research is required in modeling social capital within communities. Integration of information and modeling the connections between threats, vulnerability, exposure, sensitivity, and impacts also require more research, especially based on differences in geographic scale or time periods.
One of the key themes in the report is that despite some level of information about disaster risk, individuals, communities, businesses, and
political leaders may be reluctant to reduce risk to make the nation more resilient. The question is why? To address that question more research into the social and behavioral biases that affect the processing of risk information, how risk data could be more effectively communicated, and how such risk information translates into the adoption of resilience strategies could be helpful. Research on the next generation of technologies for communicating and sharing location-based risk information would also enhance resilience at all levels.
Understanding, managing, and reducing risk is an essential foundation for increasing resilience to hazards and disasters. Risk management is a continuous process, and the choice of strategies requires regular reevaluation in the context of new data, models, and changes in the socioeconomic and demographic characteristics, and environmental setting of a community. The risk management strategy that works best for a community is based on the available information, how it is communicated to the key interested parties, and the perception of risks and rewards for avoiding or mitigating risk.
A variety of tools exists to manage disaster risk. These tools include structural (construction-related) measures such as levees, dams, disaster-resistant construction, and well-enforced building codes, and nonstructural (nonconstruction-related) measures such as natural defenses, insurance, zoning ordinances, and economic incentives. Structural and nonstructural measures are complementary and can be used in conjunction with one another. Risk management is at its foundation a community decision—including not only the immediately affected community, but also local, state, and federal levels of government and the private sector—and the risk management approach and will only be as effective if there is commitment to use risk management tools and measures.
Recommendation: The public and private sectors in a community should work cooperatively to encourage commitment to and investment in a risk management strategy that includes complementary structural and nonstructural risk-reduction and risk-spreading measures or tools. The portfolio of tools should seek equitable balance among the needs and circumstances of individuals, businesses, and government, as well as the community’s economic, social, and environmental resources.
Examples from actual disasters and their aftermaths show that implementation of risk management strategies involves a combination of actors in local, state, and federal governments, NGOs, researchers, the private sector, and individuals in the neighborhood community. Each actor will have different roles and responsibilities in developing the risk management strategy and in characterizing and implementing the measure or tool, whether structural or nonstructural, to be added to the community’s risk management portfolio.
Some strategies can be implemented over the short term, while others may take a longer time. Table 2.2 is a potential template for decision makers to consider how to develop and implement risk management strategies and to manage expectations. The roles and responsibilities of the different actors are described in more detail in Chapters 5 and 6.
One underutilized tool is investment in risk reduction through insurance and other financial instruments to enhance resilience. Such measures can improve mitigation of properties and infrastructure, but more importantly, can encourage the relocation of residences, businesses, and infrastructure through more risk-based pricing.
Recommendation: The public and private sectors should encourage investment in risk-based pricing of insurance in which insurance premiums are designed to include multiyear policies tied to the property, with premiums reflecting risk. Such risk-based pricing reduces the need for public subsidies of disaster insurance. Risk-based pricing can serve as an incentive that clearly communicates to those in hazard-prone areas the different levels of risk that they face. Use of risk-based pricing could also reward mitigation through premium reductions and can apply to both privately and publicly funded insurance programs.
Bachman, R. E. 2004. The ATC 58 project plan for nonstructural components In Proceedings of the International Workshop on Performance-Based Seismic Design, Concepts and Implementation, June 28-July 1, 2004, Bled, Slovenia, P. Fafjar, ed. Richmond, CA:Pacific Earthquake Engineering Research Center.
Bradley, A. A., Jr. 2010. What causes floods in Iowa? In A Watershed Year: Anatomy of the Iowa
Floods of 2008, C. F. Mutel (ed.). Iowa City: University of Iowa Press, pp. 7-18.
Brinkley, D. 2006. The Great Deluge: Hurricane Katrina, New Orleans, and the Mississippi Gulf Coast. New York: Harper Collins.
Burby, R. J. 2006. Hurricane Katrina and the paradoxes of government disaster policy: Bringing about wise governmental decisions for hazardous areas. Annals of the American Academy of Political and Social Science 604:171-191.
Camerer, C, and H. Kunreuther. 1989. Decision processes for low probability events: Policy implications. Journal of Policy Analysis and Management 8:565-592.
Cornell, C. A. 1968. Engineering seismic risk analysis. Bulletin of the Seismological Society of America 58:1583-1606.
Cutter, S. L., ed. 2001. American Hazardscapes: The Regionalization of Hazards and Disasters.Washington, DC: Joseph Henry Press.
Cutter, S. L., B. J. Boruff, and W. L. Shirley. 2003. Social vulnerability to environmental hazards.Social Science Quarterly 84 (1):242-261.
Cutter, S. L., L. Barnes, M. Berry, C. Burton, E. Evans, E. Tate, and J. Webb. 2008. A place-based model for understanding community resilience to natural disasters. Global Environmental Change 18(4):598-606.
Cutter, S., B. Osman-Elasha, J. Campbell, S.-M. Cheong, S. McCormick, R. Pulwarty, S. Supratid,and G. Ziervogel. 2012. Managing the risks from climate extremes at the local level. In Managing the Risks of Extreme Events and Disasters to Advance Climate ChangeAdaptation. A Special Report of Working Groups I and II of the Intergovernmental Panel on Climate Change, C. B. Field, V. Barros, T. F. Stocker, D. Qin, D. J. Dokken, K. L. Ebi, M. D. Mastrandrea, K. J. Mach, G.-K. Plattner, S. K. Allen, M. Tignor, and P. M. Midgley, eds. Cambridge, UK, and New York: Cambridge University Press, pp. 291-338.
Elnashai, A. S., V. Papanikolaou, and D. Lee. 2009. ZEUS-NL—A system for inelastic analysis of structures. Mid-America Earthquake Center, Univ. of Illinois at Urbana-Champaign, IL.Ԡhttp://mae.cee.uiuc.edu/news/zeusnl.htmlԠ.
Emrich, C. T., S. L. Cutter, and P. J. Weschler. 2011. GIS and emergency management. In The SAGE Handbook of GIS and Society. Thousand Oaks, CA: SAGE, pp. 321-343.
FEMA (Federal Emergency Management Agency). 1998. Retrofitting: Six Ways to Prevent Your Home from Flooding. Washington, DC: FEMA.
Galloway, G., G. Baecher, D. Plasencia, K. Coulton, J. Louthain, and M. Bagha. 2006. Assessing the Adequacy of the National Flood Insurance Program’s 1 Percent Flood Standard.Washington, DC: American Institutes for Research.
Galloway, G. E, D. F. Boesch, and R. R. Twilley. 2009. Restoring and protecting coastal Louisiana.Issues in Science and Technology 25:2:29-38.
Grossi, P., and H. Kunreuther. 2005. Catastrophe Modeling: A New Approach to Managing Risk.New York: Springer.
Heinz Center. 2000. The Hidden Costs of Coastal Hazards. Washington, DC: Island Press.
Huber, O., R. Wider, and O. Huber. 1997. Active information search and complete information presentation in naturalistic risky decision tasks. Acta Psychologica 95:15-29.
IAEM (International Association of Emergency Managers). 2007. Principles of Emergency Management Monograph (Supplement). Available at https://www.iaem.com/EMPrinciples/index.htm.
International Bank for Reconstruction and Development/World Bank. 2010. Natural Hazards.UnNatural Disastes: The Economics of Effective Prevention. Washington, DC: WorldBank.
IPCC (Intergovernmental Panel on Climate Change). 2012. Managing the Risks of Extreme Events and Disasters to Advance Climate Change Adaptation, C. B. Field, V. Barros, T. F.
Stocker, D. Qin, D. J. Dokken, K. L. Ebi, M. D. Mastrandrea, K. J. Mach, G.-K. Plattner, S. K. Allen, M. Tignor, and P. M. Midgley, eds. Cambridge, UK and New York: Cambridge University Press.
Kahneman, D., and A. Tversky. 2000. Choices, Values and Frames. New York: Cambridge University Press.
Karl, T. R., J. M. Melillo, and T. C. Peterson. 2009. Global Climate Change Impacts in the United States. New York: Cambridge University Press.
Keeney, R. 1992. Value Focused Thinking: A Path to Creative Decisionmaking. Cambridge, MA:Harvard University Press.
King, R. O. 2011. National Flood Insurance Program: Background, Challenges, and Financial Status. Congressional Research Service. Available at:http://www.fas.org/sgp/crs/misc/R40650.pdf.
Krajewski, W. F., and R. Mantilla. 2010. Why were the 2008 floods so large? In A Watershed Year:Anatomy of the Iowa Floods of 2008. Iowa City: University of Iowa Press, pp. 19-30.
Kunreuther, H. 1996. Mitigating disaster losses through insurance, Journal of Risk and Uncertainty 12:171-187.
Kunreuther, H., and E. Michel-Kerjan. 2011. At War with the Weather: Managing Large-Scale Risks in a New Era of Catastrophes. Cambridge, MA: MIT Press (paperback ed.).
Kunreuther, H., and R. Roth, Sr., eds. 1998. Paying the Price: The Status and Role of Insurance Against Natural Disasters in the United States. Washington, DC: Joseph Henry Press.
Kunreuther, H., N. Novemsky, and D. Kahneman. 2001. Making low probabilities useful. Journal of Risk and Uncertainty 23:103-120.
Kunreuther, H., R. Meyer, and E. Michel-Kerjan. 2012. Overcoming decision biases to reduce losses from natural catastrophes. In Behavioral Foundations of Policy. Princeton, NJ: Princeton University Press.
Kunreuther, H., M. Pauly, and S. McMorrow. In press. Insurance and Behavioral Economics:Improving Decisions in the Most Misunderstood Industry. New York: Cambridge University Press.
Mahdyiar, M., and B. Porter. 2005. The risk assessment process: The role of catastrophe modeling in dealing with natural hazards. In Catastrophe Modeling: A New Approach to Managing Risk. New York: Springer, pp. 45-68.
Magat, W., K. W. Viscusi, and J. Huber. 1987. Risk-dollar tradeoffs, risk perceptions, and consumer behavior. In Learning About Risk. Cambridge, MA: Harvard UniversityPress, pp. 83-97.
Michel-Kerjan, E., and H. Kunreuther. 2011. Redesigning flood insurance. Science 333(6041):408-409.
Milly, P. C. D., J. Betancourt, M. Falkenmark, R. M. Hirsch, Z. W. Kundzewicz, D. P. Lettenmaier,and R. J. Stouffer. 2008. Stationarity is dead—Whither water management? Science 319:573-574.
NRC (National Research Council). 2006a. Completing the Forecast: Characterizing and Communicating Uncertainty for Better Decisions Using Weather and Climate Forecasts.Washington DC: The National Academies Press.
NRC. 2006b. Facing Hazards and Disasters: Understanding Human Dimension. Washington DC:The National Academies Press.
NRC. 2007a. Elevation Data for Floodplain Mapping. Washington DC: The National Academies Press
. NRC. 2007b. Successful Response Starts with a Map: Improving Geospatial Support for Disaster Management. Washington DC: The National Academies Press.
NRC. 2009. Mapping the Zone: Improving Flood Map Accuracy. Washington DC: The National Academies Press.
NRC. 2010. Risk in DHS: Review of the Department of Homeland Security’s Approach to Risk Analysis. Washington DC: The National Academies Press.
NRC. 2011a. America’s Climate Choices. Washington DC: The National Academies Press.
NRC. 2011b. Increasing National Resilience to Hazards and Disasters: The Perspective from the Gulf Coast of Louisiana and Mississippi, Summary of a Workshop. Washington, DC: The National Academies Press.
NRC. 2011c. National Earthquake Resilience: Research, Implementation, and Outreach. Washington, DC: The National Academies Press.
NRC. 2012. Dam and Levee Safety and Community Resilience: A Vision for Future Practice. Washignton, DC: The National Academies Press.
Opperman, J. J., G. E. Galloway, J. Fargione, J. F. Mount, B. D. Richter, and S. Secchi. 2009.Sustainable floodplains through large-scale reconnection to rivers. Science. 326:1487-1488.
Peacock, W. G., H. Kunreuther, W. H. Hooke, S. L. Cutter, S. E. Change, and P. R. Berke. 2008. Toward a Resiliency and Vulnerability Observatory Network: RAVON. Final Report. Hazard Reduction and Recovery Center, Texas A&M University. Available at http://www.nehrp.gov/pdf/RAVON.pdf.
Peduzzi, P., H. Dao, C. Herold, and F. Mouton. 2009. Assessing global exposure and vulnerability to hazards: The Disaster Risk Index. Natural Hazards Earth System Science 9:1149-1159.
Rose, A. 2009. Economic Resilience to Disasters: CARRI Research Report 8. Community and Regional Resilience Initiative, Oak Ridge, TN. Available at http://www.resilientus.org/library/Research_Report_8_Rose_1258138606.pdf.
Samuelson, W., and R. Zeckhauser. 1988. Status quo bias in decision making. Journal of Risk and Uncertainty 1:7-59.
Sayers, P., G. Galloway, E. Penning-Rowsell, F. Shen, K. Wang, Y. Chen, and T. Le Quesne. 2012. Flood Risk Management: A Strategic Approach—Consultation Draft. UNESCO on behalf of WWF-UK/China and the General Institute of Water Design and Planning, China.
Slovic, P. 1987. Perception of risk. Science 236:280-285.
Slovic, P. 2000. The Perception of Risk. Sterling, VA: Earthscan.
Slovic, P., B. Fischhoff, and S. Lichtenstein. 1978. Accident probabilities and seat belt usage: A psychological perspective. Accident Analysis and Prevention 10:281-285.
Tobin, G. A. 1995. The levee love affair: A stormy relationship? Water Resources Bulletin 31(3):359-367.
UNISDR (United Nations International Strategy for Disaster Reduction Secretariat). 2007. Hyogo Framework for Action 2005-2015: Building the Resilience of Nations and Communities to Disasters. Geneva, Switzerland: UN/ISDR. Available at http://www.unisdr.org/files/1037_hyogoframeworkforactionenglish.pdf
This page intentionally left blankd.


