
“We lost 31 of those (street) cars. To rebuild those cars cost us $1.2 million per car. That’s not a capital cost you can replace very easily.” —Justin Augustine, CEO of the New Orleans Regional Transit Authority,
January 2011 on losses to the New Orleans transportation system after Hurricane Katrina
3
Making the Case for Resilience Investments: The Scope of the Challenge
The potential benefits of being resilient to hazards and disasters make abundant sense. Few would oppose taking action to reduce the loss of life or property damage. However, increasing the resilience of a community requires large-scale investments of money, human resources, and time. Once risk has been identified and assessed, what actions are sufficient to address the risk? How resilient does the community need to be? How do investments in improving resilience compete with other community investment priorities? What are the benefits? Who pays now? Who pays later?
The available data portraying past disasters show that the scale and scope of disaster losses1 are enormous and that significant investment is required to mitigate the losses of human life, risks to human health, and economic and social costs. Investments are required for a wide spectrum of community needs such as planning, organizing, training, and equipping first responders to large infrastructure projects. Owners of community assets are primarily responsible for their own resilience investments, yet community leaders from both the public and private sectors recognize that community assets are interconnected and interdependent and that holistic planning, programming, investing, and execution create common and interrelated resilience benefits for the community. Realizing the maximum benefits requires close collaboration among public- and private-sector leaders aided by a shared approach and commitment to investment.
______________
1 Unless otherwise noted, economic losses refer to property damage or crop losses (or both, if noted).
As stewards of community assets the potential benefits of being resilient to hazards and disasters are attractive from governmental, economic, social, and environmental points of view. Although consensus generally exists on the goals for strengthening resilience, making the case for investing in resilience programs, in individual initiatives or projects, and in strengthening weak infrastructure is very challenging, especially in the context of demand for competing resources. Particularly during times of economic hardship, competing demand for many societally relevant resources (education, health, and social services) can be a major barrier to making progress in building resilience in communities. As a prerequisite for making the case, advocates are required to demonstrate that the potential benefits of being resilient to hazards and disasters make conceptual sense. However, such efforts also have to show clearly that community investments in resilience will yield significant and measurable short-and long-term benefits that balance or exceed the costs. This kind of cost-benefit analysis is critical for sustained commitment to increasing resilience, given the rising level of competition for scarce resources at local, state, and federal levels (Rose et al., 2007).
Furthermore, increasing resilience is tied in important ways to economic recovery after a disaster. Specifically, resilience measures can encourage efficient use of existing resources, and thereby lead to as rapid a recovery as possible. Some factors that have been shown to have achieved these ends include rapid business relocation (because of the existence of excess office space), use of inventories and stockpiles, and substitution of inputs or suppliers (Rose and Blomberg, 2010).
One approach that communities can use as they embark on a process of improving resilience is to develop multiyear plans or programs that include compelling initiatives or projects. These projects may include improving weak or underfunded community infrastructure such as schools, clinics, and hospitals, and the services which constitute any community. Involving and empowering individuals and families in developing these programs are important because of the ultimate need for individuals to take a share of responsibility in building resilience. Beyond the essential cost-benefit analysis, the value of each initiative or project also rests on the basis of its life-safety, economic, social, public health, and environmental significance. This kind of valuation can assist community leaders with prioritizing investments, decision making, and developing a schedule for implementing their resilience-building strategies.
Resilience investments challenge traditional approaches to “cost-benefit” analysis because communities have many different kinds of assets which are valued differently. Communities have very-high-value assets that are “essential” to keep operating—for example, hospitals, power plants, water and sewage plants, and transportation and communication networks—that usually have a tangible dollar value attached to them, and the costs of disruptions in these services can usually be directly calculated. The social, cultural, and environmental assets of a community also have high “value” but the value is
described in cultural and life-quality terms and is more difficult to quantify in financial terms. Such assets include museums, natural landscapes or areas, protected environmental zones, historical buildings, and a health infrastructure that supports prevention and health maintenance throughout the population. Thus the total value of a community’s assets—both the high-value structural assets and those with high social, cultural, and/or environmental value— necessitates qualitative and quantitative inputs into a decision-making framework for disaster resilience. Such decision making is going to be difficult for community leaders as they try to address the value of multiple community assets in economic, social, cultural, and environmental terms. Access to reliable data is vital in order to support these kinds of decisions. This chapter identifies the data needed and an approach for valuing assets, planning, programming, and investment decision making for resilience. Specifically, the chapter addresses (1) the challenge of decision making for community leaders in developing their priorities in the context of their risk management findings and conclusions (see also Chapter 2); and (2) the scale and scope of the threat and potential losses from disasters. The ways in which communities might be able to develop or adapt measures of their progress toward resilience are developed in Chapter 4.
CHALLENGE OF RESILIENCE DECISION MAKING FOR COMMUNITY LEADERS
High-value assets of a community are those for which continued operation is essential and urgent for the entire community (e.g., water and power utilities, fuel systems, transportation facilities and systems, communication systems, first responder operations centers, and hospitals). These interdependent, high-value assets drive the need for holistic thinking, risk management (Chapter 2), priority setting, and investment timing.
Although substantial investments in some communities are made for contingency preparations to secure essential community services and operations during disasters, the scale of a disaster can nonetheless overwhelm the capacity of the system and its operators to cope, leading to a failure in one or more parts of the system as occurred, for example, with essential utilities in coastal Louisiana during and after hurricane Katrina (NRC, 2011). Proven techniques such as systemwide analyses and scenario planning offer insights for decision makers to see resilience improvement needs and weigh their investment priorities.
Other high-value assets of a community may include its economic foundation (e.g., local industry or business), and its social, cultural, environmental, and educational assets. These may include traditional ethnic neighborhoods, religious centers, parks and preserves, wildlife habitats, art centers and architectural icons, town squares, and schools or other educational institutions. These assets are held dear and are highly valued as distinguishing
attributes by the community. Although it is difficult to measure their value in purely monetary terms, their loss may significantly degrade the total ambiance or qualify of life of a community. Although such losses may at first be devastating, the investment priority judgments of community leaders will consider the promise and possibilities embedded in the ingenuity and self-reliance of citizens (see Box 3.1).
Establishing ownership of a community’s assets is also important. Asset owners in a community will vary and include those from public utilities, local businesses and industries, faith-based communities, governmental and nongovernmental organizations, and individual citizens. Owners are primarily responsible for their property and for making appropriate steps including investments in mitigation measures—structural and nonstructural (see Chapter 2)—to prepare and plan for hazards and risks. Community resilience planning and investment programming set goals, strategies, and metrics for the community and guide owners in how best to prioritize and time their investments. However, resilience is also the outcome of interconnected systems (Chapter 1). Decisions about the prioritization and the level of investment require consideration of both quantitative data and qualitative value assessments the community is key in this regard. The next section examines the urgency of the need to consider the scale and scope of disasters and disaster losses as a means to motivate community efforts to identify and prioritize the full extent of a community’s assets.
BOX 3.1
Decentralization of Community Assets: One Means to Forge a Greater Sense of Community Resilience
Prior to Hurricane Katrina, the public school system in New Orleans was centralized, and the schools were operated largely through a unified school district and primarily served one community function—to educate the city’s children. With the destruction of many essential functions including the schools and school system in New Orleans as a result of Katrina, some members of the private sector, nonprofit organizations, and local citizens revisited together the “value” of their schools in the context of the larger neighborhood communities that the schools serve. What emerged was a design for new schools that encompassed a “systems” approach where schools were designed and built to serve multiple community purposes—with facilities to support cultural and social events and community health through fitness centers in gymnasiums. Investments in hardening the school structures to withstand the hazards present in the area have focused not only on protecting students in the event of a disaster, but also on having the schools capable of serving as centers for shelter of the neighborhood community in case of a crisis. These planned investments by the “owners” and stakeholders of this educational community asset— essentially a blend of private, nonprofit, and community members—have increased the scope of the asset as well as its overall community value.
Source: NRC (2011); Steven Bingler, personal communication, January 20, 2011.
the community is key in this regard. The next section examines the urgency of the need to consider the scale and scope of disasters and disaster losses as a means to motivate community efforts to identify and prioritize the full extent of a community’s assets.
THE SCALE AND SCOPE OF DISASTERS AND DISASTER LOSSES— AN URGENT PROBLEM
The Economic Value of Mitigation
Understanding the benefits of investing in one or more mitigation strategies in one place may provide some level of guidance that similar measures implemented elsewhere may yield a certain, or potentially greater, level of benefit. One of the landmark studies on the economic value of disaster mitigation is the work of the Multihazard Mitigation Council (2005), a public— private partnership established to reduce the economic and social costs of natural hazards. The study, based on cost-benefit analysis, examined future savings from hazard mitigation related to earthquakes, wind, and floods using two approaches: (1) a purposive sample of communities with mitigation grants funded by the Federal Emergency Management Agency (FEMA) to determine losses avoided through reductions in direct property damage, business interruptions, nonmarket damages, human losses, and costs of emergency response; (2) estimates of future savings from FEMA mitigation expenditures that use a statistically representative sample of FEMA-funded mitigation grants and that was then generalized to all FEMA mitigation grants (Multihazard Mitigation Council, 2005). HAZUS-MH was used to estimate direct property damage from earthquake, flooding, and hurricane wind. The mitigation approaches included both physical measures (elevating or relocating structures, strengthening structures against earthquake or wind hazards) and processes (such as building codes, policies, education). The study results concluded that mitigation saves money with benefits that greatly exceed the costs: for every $1 spent on pre-event mitigation, $4 was saved in post-event damages (see also Chapter 1). In another study that examined physical mitigation measures, Sutter et al. (2009) found that wind-resistant construction costing less than $500 additional per typical single-family home could mitigate future wind damage in tornado-prone regions by 30 percent. Research conducted by the Institute for Business and Home Safety has also demonstrated the economic value of relatively simple and inexpensive home fortification through significant reduction in structural damage and economic losses from strong weather events (Box 3.2).
BOX 3.2
For the Want of a Ring-Shank Nail, the Roof Was Lost: Research Supports Inexpensive Ways to Fortify a Home against Natural Hazards
Steps toward resilience need not be expensive. During a wind, water, or fire event, the roof is often involved, and “once the roof cover is compromised, all sorts of bad things can happen to the structure” (J. Rochman, personal communication, January 20, 2011). Research conducted by the Institute for Business and Home Safety (IBHS) has demonstrated that using ring-shank nails with full round heads instead of smooth-shank nails or staples to hold siding and roofing materials on a home contributes to significantly more resilient structures when the homes are subjected to strong weather events such as hurricanes and wind storms. IBHS has a stronger, safer construction standard for new homes, known as FORTIFIED for Safer Living®, which goes above building codes (where they exist) with risk-specific guidance for homeowners, architects, and builders.
A simple and inexpensive change to improve the resilience of a roof— whether first put on a new building or during reroofing—is to use a minimum of 2⅜-inch ring-shank nails instead of smooth-shank nails or staples to secure the roof decking. In a series of full-scale tests at the IBHS Research Center, two virtually identical two-story, 1,300-ft2 homes (one built to standard building codes as they exist in the center of the country and one built to FORTIFIED standards for new construction) were subjected to hurricane-strength wind speeds. Unlike the conventionally constructed house, the FORTIFIED house had ring-shank nails securing the roof and met other FORTIFIED requirements, such as using metal strapping to hold load-path elements together. The cost of the extra FORTIFIED modifications totaled only about $3,000. After subjecting both houses to sustained wind and gusts that peaked at 96 miles per hour, professional insurance adjustors examined both homes and estimated that the cost of exterior repairs to the conventionally built home was ~2.5 to 8 times higher than the home built to the IBHS FORTIFIED standard.
FORTIFIED program value was clearly demonstrated in a real-world situation on the Bolivar Peninsula of Texas during Hurricane Ike. Thirteen FORTIFIED homes stood directly in the path of Ike’s eye wall, which included 110-mph winds and an 18-ft to 20-ft storm surge. Ten FORTIFIED homes remained standing with minimal damage, while all other homes for miles around were totally destroyed. The three FORTIFIED homes that were destroyed were lost due to impacts from surrounding homes that were knocked off their foundations and became moving piles of debris.
Research by the committee at a local home supply store revealed the cost of 2,500 2⅜-inch ring-shank nails with full round heads was $38. Approximately 6,000 nails are required to attach the roof sheeting for a 2,000-ft2 house, another 6,000 nails with plastic or metal caps to anchor the
underlayment, and about 12,000 nails to attach the shingles (ca. 6 nails per shingle).
Sources: http://www.disastersafety.org/content/data/file/FORTIFIED-vs-Conventional.pdf;
http://www.disastersafety.org/fortified; J. Rochman, personal communication, January 20, 2011.
Patterns of Disaster Losses to Guide Resilience Investments
Examining historic patterns of disaster losses provides some sense of the magnitude of the need to become more disaster resilient. In addition, the geographic patterns of disaster losses—human fatalities, property losses, and crop losses—illustrate where the impacts are the greatest, and where there could be challenges in responding to and recovering from disasters. Geographic patterns of losses, when compared with available data on housing, population growth, income level, and types of natural hazards, allow understanding of some of the driving factors of exposure and vulnerability to hazards and disasters (see also Chapter 2), and can lead more readily to appropriate paths to increase resilience. This kind of analysis also reveals gaps in our knowledge of natural, built, and socioeconomic systems—including their interrelationships—and is useful in prioritizing research needs. The following sections review disaster losses in terms of U.S. and global tendencies; geographic variation in economic losses, human losses, and patterns of exposure; and population growth. Each section draws upon available data and also presents evidence for gaps in data collection, analysis, and availability.
U.S. and Global Patterns in Economic Losses
Because local and national patterns in disaster losses occur within a larger global context, a useful way to assess the current state of resilience in the United States is to examine the magnitude of global events and losses. As estimated by Munich RE (2012), the costliest year on record for natural disasters around the world (based on preliminary global data for the year) was 2011, with more than $380 billion in losses (of which only $105 billion was insured), exceeding the previous record set in 2005. The earthquakes in New Zealand, the March earthquake and tsunami in Japan, and flooding in Australia and Thailand all contributed to these new levels of loss. The Japanese earthquake and tsunami combined were the most costly events globally in 2011. In the United States, estimated losses were $64 billion, of which $35.8 billion were insured losses (Munich RE, 2012). The snows of February, severe storms in April and May which brought many tornadoes, the extensive flooding in the Midwest and Great Plains, wildfires in Texas and the Southwest, and Hurricane Irene impacting much of the U.S. East Coast all contributed to the total (see also Figure 1.1).
Establishing the tendencies in economic losses provides the baseline against which we can monitor losses avoided due to improved resilience. Data that have been collected in a consistent manner are essential for measuring
losses in absolute terms over time or in different locations, or simply attempting to monitor loss history for a single location. Existing global loss databases are useful for certain kinds of analyses, but require improvement in measurements, accuracy, and consistency. For example, there is an ongoing debate in the literature over whether losses from natural disasters are actually increasing over time (Figure 3.1), or whether the data reflect large, recent singular extreme events (e.g., the Tohoku earthquake and tsunami), changes in asset values, changes in reporting, changes in housing stock, improved awareness, or some combination of these. When national losses are normalized for population and wealth, upward patterns in normalized losses appear to become less significant (Pielke and Landsea, 1998; Brooks and Doswell, 2001; Miller et al., 2008); however, other evidence suggests that even with normalization for population and wealth, losses are increasing significantly, especially in the United States (Gall et al., 2012) (Figure 3.2). Improvements in disaster-data collection will help clarify these fundamental tendencies.
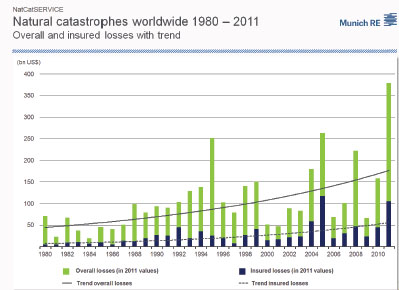
FIGURE 3.1 Natural hazard losses worldwide 1980-2011. Source: Munich RE (2012).
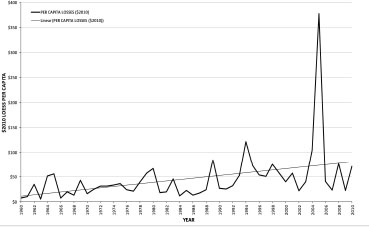
FIGURE 3.2 Trends in per-capita property and crop losses (adjusted to $2010) from natural hazards, 1960-2010. According to Gall et al. (2012), per-capita losses appear to be escalating in the United States, even when normalized by population, and have more than tripled per person since the 1960s. Source: S. Cutter; compiled from SHELDUS.
Another issue in analyzing loss data is that not all losses are counted and valued (Box 3.3). In the case of Munich RE, the NatCatSERVICE database provides property losses (total and insured) and insured business interruption losses, estimated from known insured losses. Because of the differences in loss estimation techniques, thresholds for inclusion in the database (large versus small events; insured versus uninsured losses), and data availability (public versus proprietary), natural-hazard loss databases are rarely comparable with one another. For example, comparisons among four publicly accessible databases show different total dollar loss estimates for the United States in 2010 attributed to weather perils such as winter storms, hurricanes, tornadoes, and flooding (Table 3.1). In the health arena, some losses of life and health may occur days or months after the disaster and thus may go uncounted.
Geographic Variation in Economic Losses
Long-term disaster loss data for specific geographic regions provide a baseline from which to measure improvements in resilience. The success of measures to reduce disaster risk and impacts are difficult to evaluate without this baseline information. A number of federal agencies compile separate data on disaster losses and costs including the National Oceanic and Atmospheric Administration (NOAA), FEMA, the U.S. Geological Survey (USGS), and the Department of Agriculture. These data serve quite specific and useful purposes, but in aggregate are incomplete, often incompatible with one another, have limited economic impact information, and are less useful for mapping the
BOX 3.3
Which Economic Losses Are Counted?
Losses from natural hazards are normally divided into two major categories—direct losses and indirect losses. Economic losses are classified as stock losses (property damage) and flow losses (business interruption). There are direct and indirect versions of each. For example, direct property damage occurs from the seismic shaking from an earthquake whereas indirect property damage can occur from fires due to the rupture of a natural gas pipeline caused by the earthquake. Direct flow losses occur to those businesses in the affected area that had to shut down temporarily. Indirect flow losses refer to the disruption in the supply chain for other businesses as a result of the shutdown (a ripple effect caused by the interconnectedness of many supply chains regionally and globally). Other primary losses include the costs of repair and placement of structures, the cost of debris removal, loss of jobs, loss of rental income, and evacuation costs. Secondary losses such as those associated with decreased tax revenues, decline in property values, loss of attractiveness of tourist destinations, psychological trauma, and the damage to natural systems are not taken into account in loss tallies, yet these hidden costs may directly influence the affected community’s ability to manage disaster risk.
SOURCES: Heinz Center (1999), Rose (2004), Multihazard Mitigation Council (2005), NRC (2006a); Gall et al. (2009).
geographic distribution and impact of such losses at the local (community to state) scale. Currently, no comprehensive federal database or national archive for disaster loss data exists (Mileti, 1999; NRC, 1999; Cutter, 2001). The SHELDUS® (Spatial Hazard Event and Loss Database for the United States), compiled from existing federal data sources, is the closest approximation to a U.S. national inventory of direct disaster losses from natural hazards, but it also underestimates the total value of losses because indirect losses and business interruption are not included, for example. Such indirect losses can be substantial (see Box 3.4).
SHELDUS information can be used to examine patterns losses from natural hazards within the United States over the last 50 years. Figure 3.3 shows that these losses tend to be concentrated in a few regions and within a few states. The overall patterns highlight losses on the hurricane coast along the Gulf of Mexico extending from Texas to Florida and up the Atlantic Coast to the Carolinas. When normalized to losses per square mile (Figure 3.3b) the largest cumulative losses are concentrated in California, western Washington, the Gulf Coast and Florida, the Carolinas, the Northeast, and in the upper Midwest.
Table 3.1 Losses from Selected Weather-Related Hazards in the United States for 2010.
| Databaseaa | Loss ($ Billion) | Deaths |
| Munich RE | 13.6 | 197 |
| NCDC Billion Dollar Events | 6.8 | 46 |
| SHELDUS | 8.8 | 266 |
| EM-DAT | 9.15 | 90 |
aMunch RE = NatCatSERVICE (which includes total property loss, known insured property losses. and estimated insured business interruption losses: NCDC Billion Dollar Events (http://www.ncdc.noaa.gov/oa/reports/billionz.html#narrative) reported total property and crop loss; SHELDUS = Spatial Hazard Events and Loss Database for the United States, maintained by the Hazards and Vulnerability Research Institute at the University of South Carolina (http://www.sheldus.org), repotted total property and crop loss; EM-DAT = Emergency Events Database, maintained by die Centre for Research on die Epidemiology of Disasters. CRED (http://www.emdat.be), estimated property and crop loss, loss of revenues). See Gall et al. 2009 for more details on the databases
BOX 3.4
Spatial Hazard Event and Loss Database for the United States (SHELDUS®)
SHELDUS is a county-level database for U.S. states of loss-causing natural hazards that spans the period from 1960 to the present. The database is maintained by the University of South Carolina’s Hazards & Vulnerability Research Institute. It reports only direct losses as defined by the federal source data it uses (e.g., National Climatic Data Center’s Storm Data; U.S. Geological Survey Open File Reports), and does not include Puerto Rico, Guam, or other U.S. territories. The historic Storm Data (1960-1995) used logarithmic categories for losses; for example, an event with a loss category 5 represents losses of $50,000-$500,000 in that database. SHELDUS uses the lower-bound value (e.g., $50,000), and as a result, the database is conservative and provides the minimum value of losses over the specified time period. Thus, losses are expected to be higher than those reported in the database, but how much higher is presently unknown.
The database is available online (http:www.sheldus.org), can be queried by individual hazard, by geography (state and county), by time period, by presidential disaster declarations number, by major named disasters (e.g., Hurricane Katrina, Blizzard of 1967), and by GLIDE number (an international standard numeric to enable linkages across databases). The database provides property losses (recorded in period dollars); crop losses (recorded in period dollars); injuries; fatalities; county, state, and federal Information Processing Standard codes; and beginning and ending dates for when the information was recorded. Losses can be converted to current dollars or standardized to any
year by the user. All the data from the queries is downloadable into a spreadsheet. At present, the database (v.10.0) contains over 710,000 records. The strengths of the SHELDUS database relate to its county-level coverage for a 50-year time period for 18 different hazard types. The consistent georeferencing over time, despite changes in county boundaries, is another added feature. The weaknesses of SHELDUS relate to the input data, culled from federal sources. The federal databases were developed for a different purpose; inconsistencies and biases in those data are transferred to SHELDUS. For example, in many reports of weather-related losses, an entire state was given in the record and the database disaggregation technique is to apportion the losses equally across affected counties when no additional data were provided. This technique results in a geographic pattern that may appear state-centric, but in reality is a function of the initial reporting of losses. SHELDUS is a database and does not predict losses based on annualized losses or other mathematical functions.
SOURCE: Information provided by S. Cutter; http://sheldus.org
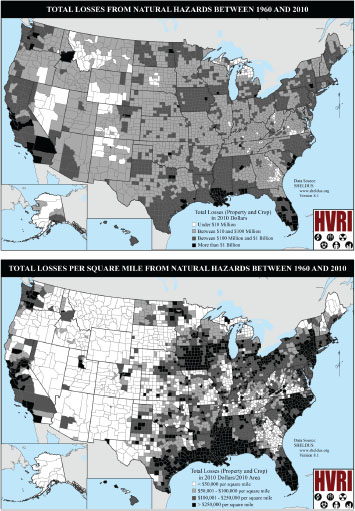
FIGURE 3.3 Geographic pattern of property and crop losses from natural hazards, 1960-2010. (a) Cumulative losses; (b) losses normalized by area (square mile). In addition to the clear concentration of losses along the Gulf Coast and southeastern coastal region, other concentrations of losses occur in California, western Washington, Mid-Atlantic (New Jersey, Pennsylvania, and New York), and in the upper Great Plains (North Dakota and Minnesota). The state-centric pattern in (a) for Iowa and Mississippi is partially a function of data-reporting biases in the source data. The overall pattern of losses in Idaho, and particularly in Lewis county, is not a function of a single extreme event, but instead a series of events which, over time, contributed to the total. Although significant, many of these individual events were not severe enough to warrant a presidential disaster declaration; yet over time, such repetitive losses affected the counties’ abilities to respond and recover and led to millions of dollars in crop damages. HVRI = Hazards and Vulnerability Research Institute. Source: S. Cutter/HVRI.
Given that the past 50 years may not be a good indicator of future patterns in hazard losses, either for weather-related events likely to be impacted by climate change or for hazards with long return periods such as earthquakes, other probabilistic models can be used to predict the potential distribution or impact of future losses for the nation. FEMA’s natural hazard loss estimation model, HAZUS, enables users to project losses for a community or region based on inputs about a specific event that is defined by the user. Alternatively, HAZUS can provide probabilistic loss estimates nationwide when the USGS probabilistic seismic source model is input. An example of the output of such modeling is the annualized earthquake losses by county for the United States (FEMA, 2008) (Figure 3.4).
Nationwide, the total modeled annualized loss of national building stock from earthquakes is about $5.3 billion.2 If indirect business interruption were taken into account the economic losses from earthquakes would be even greater and more widely distributed. The map of total annualized earthquake losses shown in Figure 3.4a demonstrates that nearly the entire nation is subject to potential earthquake loss; however, the greatest risk exists along the West Coast. Los Angeles County alone accounts for 25 percent of the entire nation’s annualized loss, which is not surprising considering the large number of active faults in the region and the fact that the population of this single county is greater than all but eight states in the country. California in total has about 66 percent of the nation’s total annualized loss; the Pacific Northwest together with California encompasses about 77 percent of the nation’s annualized earthquake loss.3 The map of normalized AEL (ratio of total loss to millions of dollars of building inventory value) in Figure 3.4b highlights concentrated loss in regions of high seismic hazard outside of the West Coast: the Wasatch Front in Utah and extending north through the Rocky Mountains, as well as sites of historic earthquakes in the central and eastern United States for which there is geological evidence of repeated events over the past several thousand years (New Madrid, Missouri region; Charleston, South Carolina; and along the Saint Lawrence Seaway).
______________
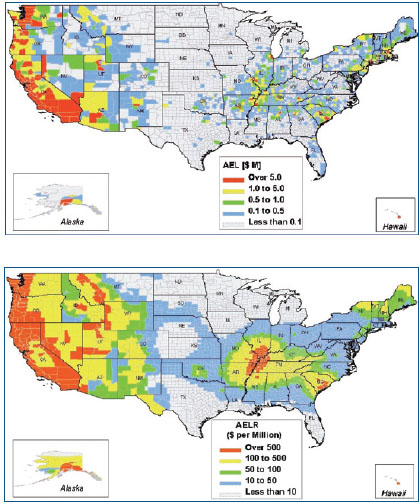
FIGURE 3.4 Annualized earthquake losses (AEL) derived from HAZUS using U.S. Geological Survey probabilistic seismic hazard assessment as input. (a) AEL (total dollar value loss of all structures included in the HAZUS exposure inventory); (b) normalized AEL (ratio of total loss to millions of dollars of building inventory value (the value of all buildings in the study area). Source: Federal Emergency Management Agency.
Human Losses and Loss-of-Life Data
Whereas national and global economic losses are growing annually, a positive development is that human losses (deaths, injuries, displacements) generally show the opposite tendency, especially in the developed world (Goklany, 2009). In the United States, the number of fatalities due to disasters
has remained roughly steady between the 1990s and 2000s. In contrast, deaths and numbers of people affected by disasters continue to grow in the developing nations (IFRCRC, 2010); in fact, the number of people affected (those requiring immediate assistance, those who are injured, or those made homeless from the disaster) increased threefold during the first decade of the 21st century (IFRCRC, 2010).
The declining number of deaths from natural disasters in the United States and the rest of the developed world is mostly the result of improved building codes and construction practices, improved awareness about disaster risk, and more accurate forecasting and warning systems. Considerable research on disaster mortality has been conducted, especially on specific perils such as floods (Ashley and Ashley, 2008; Zahran et al., 2008), earthquakes (Shoaf et al., 1998), and severe weather (Ashley, 2007). Well-established research also exists on specific mortality-causing disasters such as Hurricane Andrew (Combs et al., 1996), the Northridge earthquake (Peek-Asa et al., 2000), the Chicago heat wave (Klinenberg, 2003), and Hurricane Katrina (Elder et al., 2007; Jonkman et al., 2008). Despite those significant efforts, however, research results on all-hazards mortality in terms of temporal and spatial patterns are few (Borden and Cutter, 2008; Thacker et al., 2008) and do not provide the quality and quantity of data necessary for understanding the overall human losses.
As was the case with economic losses, loss-of-life data for disasters can also be difficult to use and interpret (Box 3.5). NOAA and the Centers for Disease Control (CDC) are the primary natural-disaster-fatality sources in the federal government. Their data include direct and indirect fatalities related to a disaster event. Death certificates are the source of the input data in CDC’s mortality databases. NOAA also records fatality statistics based on reports by local National Weather Service offices and the news media and then consolidates estimates into the monthly Storm Data. The CDC and NOAA fatality databases differ in the classification of perils, which deaths are counted, and the attribution of the death to a specific peril or place (Figure 3.5).
A further complication with mortality data is that most hazard-mortality research uses raw counts of fatalities that are not adjusted to either rates (deaths per population), densities (per unit area), or standardized mortality ratios (accounting for the age/sex structure and size of the population). This lack of refinement may present a very misleading indication of the nature of human losses from natural disasters, especially when attempting to examine regional variations. Moreover, the extreme variation in the scale of U.S. counties, both in terms of population and area, makes interpretation of county-level maps, such as those that illustrate this chapter, especially problematic. U.S. counties vary in population from less than 100 to roughly 10 million, and in area from less than 2 square miles to more than 150,000 square miles. However, counties remain the administrative unit for most hazard and risk management programs, and so we opt to report data at this level of resolution.
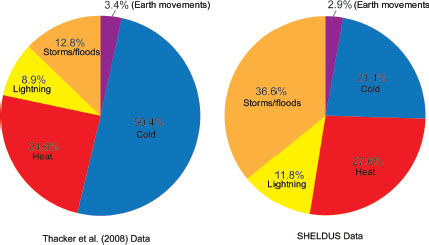
FIGURE 3.5 Hazard fatalities 1979-2004 compared by perils. Earth movements refers to earthquake-related fatalities and landslides. (a) Centers for Disease Control and Prevention (Thacker et al., 2008) and (b) National Oceanic and Atmospheric Administration (Borden and Cutter, 2008). CDC data are more likely to include urban and exposure deaths (heat and cold extremes), whereas NOAA data are biased toward more rural events such as lightning. The comparison illustrates the difficulty and inconsistency in data and recording the peril that contributed to the hazard fatality. Source: S. Cutter; complied from SHELDUS.
BOX 3.5
Problems with Collecting and Interpreting Disaster Fatality Data
Tracking deaths is relatively straightforward because all deaths are required by law to be reported. The difficulties with disaster fatality data are in how to attribute the cause of the death to a particular disaster or peril. This designation will vary depending on who is doing the reporting and recording on the death certificate. Attribution of the cause of death and the conditions contributing to it become highly subjective, and pronouncing physicians may have difficulties completely identifying the contributing conditions. For example, if a person has a heart attack while shoveling snow, the death may or may not be recorded as a disaster death depending on how the paperwork is completed. The cause of death would be a heart attack, but the contributors would be physical exertion due to the snowstorm. A further complication related to disaster fatality statistics is determining the location where the death occurred. A death certificate contains a place to fill in the geographic location of the initial injury (street, county, zip code, etc.). If left blank, the fatality is georeferenced to the place of residence of the deceased, or is recorded as the place where the death pronouncement was made (e.g., a hospital). For example, if a tourist from Arkansas died in a wildfire while on vacation in Colorado, the
death could be recorded as a wildfire fatality in Arkansas (where the person lived), but it could also be listed for Colorado (where he or she died), depending on how the death certificate was completed. Finally, problems arise with the timing of the death. Many suicides and deaths related to toxic exposures post-Katrina were not recorded as related to Katrina. Deaths from toxic exposures experienced by first responders to the 9/11/2001 destruction of the World Trade Center towers in New York City are still occurring.
Patterns of Exposure and Population Growth
Population growth affects exposure to hazards for a variety of reasons. Understanding these population patterns through time allows assessment of some of the underlying socioeconomic or demographic changes that may contribute to the vulnerability of communities to disasters. Population growth or decline in a geographic location can also relate to infrastructure issues pertinent to the particular hazards associated with that region. For example, the new infrastructure needs (housing, roads, bridges) that growing communities need may require decisions to be made regarding land use and development in undeveloped areas. These undeveloped areas may include areas of natural defenses whose integrity may be important as a mitigation measure against existing natural hazards (see Chapter 2). The United States is experiencing a major transformation in population development patterns, which began in the 1970s with the movement of population out of the northern Rust Belt states into the south and southwest. This period saw a tremendous influx into coastal counties where approximately 53 percent of the U.S. population now resides and where about half of the nation’s residential units are located (Crosset et al., 2004). Over the period from 2000 to 2010, the migration to the coastal counties has slowed somewhat (Figure 3.6) although growth in selected Florida counties exceeded 50 percent. Depopulation is another aspect that is visible in Figure 3.6, with much of the Great Plains showing decreasing populations. Also notable is the declining population in counties bordering the lower Mississippi River from southern Illinois to southern Mississippi (Mackun and Wilson, 2011). Large population losses during the decade occurred in Orleans and St. Bernard parishes in Louisiana (due to Hurricane Katrina), in Cameron Parish, Louisiana (due to Hurricane Ike), and in Issaquena and Sharkey counties in Mississippi due to poor economic conditions and a long history of population decline from the counties.
The aging of the U.S. population is also important to consider. The growing number of older adults who need more specialized care will require greater knowledge, expertise, equipment, and supplies during a disaster, particularly during an evacuation. This problem was very clearly evident in the hours and days that followed Hurricane Katrina, where responders were not prepared to handle the medical needs they encountered in older adults (NRC, 2011).
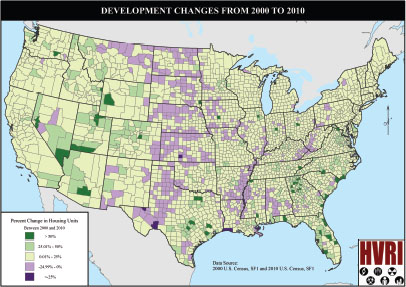
FIGURE 3.6 Changes in housing units from 2000 to 2010. Counties with a decline in housing units are shown in purple; areas with increasing housing units are shown in dark green. Source: S. Cutter/HVRI.
What is missing from this narrative is the overlay of the population shifts and residential housing units with consistent national probabilistic hazard maps (such as the USGS National Seismic Hazard Map and the FEMA flood zone maps) and with accurate mapping of both structural and social vulnerability. Although existing data allow discussion about increases and decreases in exposure, conclusions remain difficult to make regarding the effects on resilience of changes in populations in hazardous zones such as flood-prone areas or seismically active regions. Consistent multihazard data for the entire country calibrated from the local to the state level together with local- to regional-scale vulnerability data are needed to create true national risk maps to allow comparison of relative risks from different perils as different return periods. Such information could provide the basis for community prioritization of limited resources to expend on reducing risk and building resilience.
The lack of standardization of data on hazardous conditions, disaster losses, and impacts is a continuous challenge in the effort to understand and managing risk and increase disaster resilience. Hazard and disaster informatics is a relatively new scientific field, yet information derived from this area of study is critical to the national resilience efforts. The CDC is beginning to
coordinate health and health-risk and emergency data from hospitals and health departments, but medical professionals are a long way from having the ability to access individual health records in an emergency, or recording losses of life and health accurately following a disaster. A number of NRC reports recognize the need addressing issues of hazard and disaster data collection, standardization, management, archiving, and sharing (NRC, 2006b, 2007a,b,c). Whether such principles are achieved through a nongovernmental panel looking at hazard and disaster informatics (NRC, 2006a) or through the formal establishment of a national loss inventory (Mileti, 1999; Cutter, 2001) or other mechanisms is open for discussion. What is not debatable is the criticality of the need to solve the disaster informatics issue.
The ability to measure and evaluate the assets of communities and to understand the economic and human value of resilience is critical to improving disaster resilience. The resources of a community involve more than the high-value essential assets such as hospitals and utilities. They also include other assets with high social, cultural, and environmental value, and so decision-making models developed by communities have to involve both quantitative and qualitative “valuation” of assets in order to prioritize resilience investments. Presently, little guidance exists for communities to understand how to place meaningful value on both their quantitative and qualitative assets.
In developing the case for enhancing resilience now and providing motivation for community decision makers to understand their inventory of assets and the ways in which they interact with one another, this chapter has also outlined the historical spatial and temporal patterns of economic and human disaster losses on communities in the United States. Although the data available to assess economic and human losses nationally are conservative and are neither comprehensive nor centrally archived for the nation, the historical patterns of economic losses from hazards and disasters in the United States appear to be increasing and will be expensive to absorb, if allowed to continue. A positive sign—a declining tendency in human losses (fatalities) from disasters in the United States and other developed countries—attests to the success of some resilience-building measures. Improved building codes, improved awareness, and more accurate forecasting and better warning systems are some of the factors researchers think may contribute to fewer fatalities from disasters.
However, changing patterns of hazards as well as changes in population and vulnerability affect economic and human loss patterns. Attempts to improve resilience of individual communities and the nation require more consistent hazard and risk assessments supported by consistent and centrally available disaster loss data. Accurate loss and casualty data on past disasters enable researchers to better constrain the factors controlling the
structural and social vulnerability of communities and also enable practitioners to quantitatively calibrate risk/loss models and make more accurate predictions of future losses. This lack of data compromises the ability of communities to make informed decisions about resilience-building strategies. Importantly, the need for resilience-building strategies continues even if historical patterns of loss begin to improve.
Recommendation: A national resource of disaster-related data should be established that documents injuries, loss of life, property loss, and impacts on economic activity. Such a database will support efforts to develop more quantitative risk models and better understand structural and social vulnerability to disasters. To improve access to these data, the principle of open access should be recognized in all relevant federal data management policies. The data should be made accessible through an Internet portal maintained either by a designated agency or by an independent entity such as a university. The National Science and Technology Council (NSTC) would be an appropriate entity to convene federal and state agencies, private actors, nongovernmental organizations, and the research community to develop strategies and policies in support of these data collection and maintenance goals.
Such a data inventory would reconcile and integrate the fragmented federal datasets on disasters and losses; serve as a national data archive for historic hazard events and loss data; assist in the development of better loss metrics; and provide the evidentiary basis for potentially evaluating resilience interventions. Federal agencies, private actors, and the research community working in concert would improve post-event data collection and public access to such data, would determine essential data, standards, and protocols to employ, and determine which agencies are best positioned to collect and archive specific data on the impacts of hazards. Such an approach helps to avoid duplication of efforts. Likely federal actors include FEMA, NOAA, CDC, USGS, the U.S. Forest Service, and the U.S. Army Corps of Engineers. Biennial status reports coordinated by the NSTC on the nation’s resilience could be based in part on an analysis of these data, and could include priorities for future data collection and dissemination. At the same time, data on resilience are also lacking. Chapter 4 discusses specific ways in which resilience can be measured and used as a basis for such status reports.
Ashley, S. T., and W. S. Ashley. 2008. Flood fatalities in the United States. Journal of Applied Meteorology and Climatology 47(3):805-818.
Ashley, W. S. 2007. Spatial and temporal analysis of tornado fatalities in the United States: 1880-2005. Weather and Forecasting 22(6):1214-1228.
Borden, K., and S. L. Cutter. 2008. Spatial patterns of natural hazard mortality in the United States. International Journal of Health Geographics 7:64. Available at http://www.ijhealthgeographics.com/content/7/1/64.
Brooks, H. E., and C. A. Doswell III. 2001. Normalized damage from major tornadoes in the United States: 1890-1999. Weather and Forecasting 16(1):169-176.
Combs, D. L., R. G. Parrish, S. J. N. McNabb, and J. H. Davis. 1996. Deaths related to Hurricane Andrew in Florida and Louisiana, 1992. International Journal of Epidemiology 25(3):537-544.
Crosset, K. M., T. J. Culliton, P. C. Wiley, and T. R. Goodspeed. 2004. Population Trends Along the Coastal United States: 1980-2008. NOAA National Ocean Service. Available at http://oceanservice.noaa.gov/programs/mb/pdfs/coastal_pop_trends_complete.pdf.
Cutter, S. L., ed. 2001. American Hazardscapes: The reRgionalization of Hazards and Disasters. Washington, DC: Joseph Henry Press.
Elder, K., S. Xirasagar, N. Miller, S. A. Bowen, S. Glover, and C. Piper. 2007. African Americans’ decision not to evacuate New Orleans before Hurricane Katrina: A qualitative study. American Journal of Public Health 97(1):S124-S129.
FEMA (Federal Emergency Management Agency). 2008. HAZUS® MH Estimated Annualized Earthquake Losses for the United States. FEMA 366. Available at http://www.fema.gov/library/viewRecord.do?id=3265.
Gall, M., K. Borden, and S. L. Cutter. 2009. When do losses count? Six fallacies of natural hazards loss data. Bulletin of the American Meteorological Society 90(6):799-809.
Gall, M., K. A. Borden, C. T. Emrich, and S. L. Cutter. 2012. The unstable trend of natural hazard losses in the United States. Sustainability 3:2157-2181.
Giesecke, J., W. Burns, A. Barrett, E. Bayrak, A. Rose, P. Slovic, and M. Suher. 2011. Assessment of the regional economic impacts of catastrophic events: A CGE analysis of resource loss and behavioral effects of a radiological dispersion device attack scenario. Risk Analysis 33(4):583-600.
Goklany, I. M. 2009. Deaths and death rates from extreme weather events: 1900-2008. Journal of American Physicians and Surgeons 14(4):102-109.
Heinz Center. 1999. The Hidden Costs of Coastal Hazards: Implications for Risk Assessment and Mitigation. Washington, DC: Island Press.
IFRCRC (International Federation of Red Cross and Red Crescent Societies). 2010. World Disasters Report 2010: Focus on Urban Risk. Available at http://www.ifrc.org/Global/Publications/disasters/WDR/wdr2010/WDR2010-full.pdf.
Jonkman, S. N., B. Maaskant, E. Boyd, and M. Levitan. 2008. Loss of life caused by the flooding of New Orleans after Hurricane Katrina: A preliminary analysis of the relationship between flood characteristics and mortality. In 4th International Symposium on Flood Defence. Toronto, Ontario: Institute for Catastrophic Loss Reduction, pp. 96-1 to 99-9. Available at http://www.hkv.nl/documenten/Loss_of_life_caused_by_the_flooding_of_New_Orleans_after_hurricane_Katrina_BM(1).pdf.
Klinenberg, E. 2003. Heat Wave: A Social Autopsy of Disaster in Chicago. Chicago: University of Chicago Press.
Mackun, P., and S. Wilson. 2011. Population Distribution and Change: 2000 to 2010. Census Brief C2010BR-01. U.S. Bureau of the Census. Available at http://www.census.gov/prod/cen2010/briefs/c2010br-01.pdf.
Miller, S., R. Muir-Wood, and A. Boissonnade. 2008. An exploration of trends in normalized weather-related catastrophe loss. In Climate Extremes and Society. Cambridge, UK: Cambridge University Press, pp. 225-247.
Mileti, D. 1999. Disasters by Design: A Reassessment of Natural Hazards in the United States. Washington, DC: Joseph Henry Press.
Multihazard Mitigation Council. 2005. Natural Hazard Mitigation Saves: An Independent Study to Assess the Future Savings from Mitigation Activities, Vol. 1, Findings, Conclusions, and Recommendations. Washington, DC: National Institute of Building Sciences. Available at www.nibs.org/MMC/MitigationSavingsReport/Part1_final.pdf.
Munich RE. 2012. Topics Geo 2011. Munich: Münchener Rückversicherungs-Gesellschaft. NRC (National Research Council). 1999. The Impacts of Natural Disasters: A Framework for Loss Estimation. Washington, DC: National Academy Press.
NRC. 2006a. Facing Hazards and Disasters: Understanding Human Dimensions. Washington, DC: The National Academies Press.
NRC. 2006b. Improved Seismic Monitoring—Improved Decision-Making: Assessing the Value of Reduced Uncertainty, Washington, DC: The National Academies Press.
NRC. 2007a. National Land Parcel Data: A Vision for the Future. Washington, DC: The National Academies Press.
NRC. 2007b. Successful Response Starts with a Map: Improving Geospatial Support for Disaster Management. Washington, DC: The National Academies Press.
NRC. 2007c. Tools and Methods for Estimating Populations at Risk from Natural Disasters and Complex Humanitarian Crises. Washington, DC: The National Academies Press.
NRC. 2011. Increasing National Resilience to Hazards and Disasters: The Perspective from the Gulf Coast of Louisiana and Mississippi. Washington, DC: The National Academies Press.
Peek-Asa, C., J. F. Kraus, L. B. Bourque, D. Vimalachandra, J. Yu, and J. Abrams. 1998. Fatal and hospitalized injuries resulting from the 1994 Northridge earthquake. International Journal of Epidemiology 27(3):459-465.
Pielke, R. A. J., and C. W. Landsea. 1998. Normalized hurricane damages in the United States: 1925-95. Weather and Forecasting 13:621-631.
Rose, A. 2004. Economic principles, issues, and research priorities in natural hazard loss estimation. In Modeling the Spatial Economic Impacts of Natural Hazards, Y. Okuyama and S. Chang, eds. Heidelberg: Springer, pp. 13-36.
Rose, A., and S. B. Blomberg, 2010. Total economic impacts of a terrorist attack: Insights from 9/11. Peace Economics, Peace Science, and Public Policy 16(1), Article 2.
Rose, A., K. Porter, N. Dash, J. Bouabid, C. Huyck, J. C. Whitehead, D. Shaw, R. T. Eguchi, C. Taylor, T. R. McLane, L. T. Tobin, P. T. Ganderton, D. Godschalk, K. Tierney, and C. T. West. 2007. Benefit-cost analysis of FEMA hazard mitigation grants. Natural Hazards Review 8(4):97-111.
Shoaf, K. I., L. H. Nguyen, H. R. Sareen, and L. B. Bourque, 1998. Injuries as a result of California earthquakes in the past decade. Disasters 32(2):303-315.
Sutter, D., D. DeSilva, and J. Kruse. 2009. An economic analysis of wind resistant construction. Journal of Wind Engineering and Industrial Aerodynamics 97:113-119.
Thacker, M. T. F., R. Lee, R. I. Sabogal, and A. Henderson. 2008. Overview of deaths associated with natural events, United States, 1979-2004. Disasters 32(2):303-315.
Zahran, S., S. D. Brody, W. G. Peacock, A. Vedlitz, and H. Grover. 2008. Social vulnerability and the natural and built environment: A model of flood casualties in Texas. Disasters 32(3):537-560.


