
“(We) look at trends in the New
Orleans area across 3 decades to get the entire
view of the health and vitality of the city as a
measure of the city’s resilience…”
Allison Plyer, Greater New Orleans
Community Data Center, January 20, 2011
4
Measuring Progress Toward Resilience
THE NEED FOR METRICS AND INDICATORS
The committee recognized early on in its discussions that the study’s focus on improving resilience necessitates measurement, a position also indicated in the study’s Statement of Task (see Chapter 1). Measurement is essential for several reasons. First, it would be impossible to identify the priority needs for improvement without some numerical means of assessment. Second, a system of measurement is essential if progress is to be monitored. Third, any effort to compare the benefits of increasing resilience with the associated costs requires a basis of measurement. Establishing a baseline or reference point from which changes in resilience can be measured, combined with a regular system of monitoring to track changes through time, is also necessary. However, the measurement of a hard-to-define concept is necessarily difficult, requiring not only an agreed-upon metric, but also the data and algorithms needed to compute it. Resilience also includes human (social) and physical (infrastructure, natural environment) components that add complexity and challenges in finding metrics that cover this range of factors. This chapter discusses some of the more important principles and issues connected with measuring resilience. It examines the available methods, data, and tools, and makes recommendations designed to implement one type of measuring system for resilience.
One national-scale metric of resilience could be the dollar amount (per capita) of federal assistance spent annually for disasters, with the measure for resilience being whether this dollar amount flattens or declines (potentially indicating increasing resilience) or continues its steady growth (potentially indicating that resilience is not increasing, or is not increasing at a significant rate nationally). While imperfect, such an indicator provides a valuable
synoptic, national picture, but other metrics would be required to measure the progress of individual communities.
Metrics are an important tool of administration. They allow targets to be established and set clear goals for improvement. The very act of defining a metric, and the discussions that ensue about its structure, help a community to clarify and formalize what it means by an abstract concept, thereby raising the quality of debate. The general concept of resilience is one with which most people are familiar, but resilience is not something that communities have much experience in measuring. Resilience is also clearly influenced by multiple factors, making precise measurement very difficult. This immediately suggests a strategy of combining various factors, using appropriate weights, into a composite index. The set of factors, how they are measured, the weights given to each factor, and the operations used to combine them into a composite index all present issues that can be the subject of lengthy debates and contention. At the same time, the translation of an abstract concept into a rigorous procedure for measurement—the formalization of the concept—allows for monitoring, the comparison of progress in different communities, and the prioritization of actions and investments, all of which can be extremely helpful. The effects of actions and policy changes can then be monitored through time to produce more desirable outcomes in the future by comparing improvements in resilience that result from those actions to what was promised or predicted, iteratively modifying actions and policies, and perhaps recalibrating metrics.
To be useful in this context, a resilience metric needs to be open and transparent, so that all members of a community understand how it was constructed and computed. It needs to be replicable, providing sufficient detail of the method of determination of a community’s resilience so that it can be checked by anyone using the same data. It must also be well documented and simple enough to be used by a wide range of stakeholders.
Metrics may be quantitative, but metrics with no more than ordinal properties still allow resilience to be ranked and progress to be monitored. For example, a metric might set the qualitative levels “unsatisfactory,” “marginal,” and “satisfactory” resilience, without specifying quantitative measures or ranges for each level, as long as the procedure for arriving at a rating was open, transparent, and replicable. A scale similar to those used in academic report cards with designations of A, B, C, D, or F could also be used to indicate progress. In recent years, much of this process of defining a metric has been the subject of extensive research, often under the rubric of multicriteria decision making (MCDM). Many of these methods have been devised for problems embedded in geographic space, such as the selection of a site for a new public facility, or of a route for a new highway. The geospatial nature of such problems raises additional issues such as estimating environmental, social, and economic impacts of site selection for the new development and the way in which the necessary data to gauge these impacts can be incorporated into a collective planning process, as several texts make clear (see, e.g., Massam, 1993;
Malczewski, 2010). The methods deal effectively with the disparate views of stakeholders, allowing consensus to emerge and measuring the degree to which consensus exists. For example, the analytical hierarchy process (Saaty, 1988) is a much-applied method for reconciling divergent views in the creation of a consensus metric.
Many of these principles are illustrated by the well-known LEED (Leadership in Energy and Environmental Design; Box 4.1) process, released by the U.S. Green Building Council in March 2000. By providing an open forum for the measurement of environmental sustainability of buildings, LEED has provided an important tool for promoting and achieving energy efficiency. LEED was a bottom-up initiative without any initial endorsement from government agencies. It has gained popularity in engineering and architectural design as an added value to building occupants and to the environment in general. It has also become a trademark of socially conscious organizations in the private sector. The committee was struck by the impact LEED has had and seeks to emulate its success by envisioning a similar strategy for the measurement of resilience, laid out in the final section of this chapter.
BOX 4.1
Leadership in Energy and Environmental Design
LEED, or Leadership in Energy and Environmental Design, is an internationally recognized green-building certification system. Developed by the U.S. Green Building Council (USGBC) in March 2000, LEED is a framework for building owners and operators that allows identification and implementation of green building design, construction, operations, and maintenance.
LEED promotes sustainable building and development practices through a set of rating systems that recognize building projects that have adopted strategies for better environmental and health performance. The LEED rating systems are developed through an open, consensus-based process led by LEED committees comprising groups of volunteers from across the building and construction industry. Key elements of the process of developing LEED rating systems include a balanced, transparent committee structure, technical advisory groups for scientific consistency and rigor, opportunities for stakeholder comment, member ballot of new rating systems, and fair and open appeals.
LEED can apply to all building types, whether commercial or residential. LEED works throughout the building life cycle from design and construction through to tenant fitout and retrofit. LEED for Neighborhood Development is designed to allow the benefits of LEED to extend beyond a single building and into the neighborhood it serves.
SOURCE: http://www.usgbc.org/DisplayPage.aspx?CMSPageID=1988.
While LEED focuses primarily on buildings, the thrust of this chapter’s discussion is on the resilience of communities and their complexities. For example, a metric of the overall resilience of an entire city may mask substantial variations within the city. Carried to an extreme, we might conceive of resilience as varying continuously over the Earth’s surface, similar to the way elevation varies, and scale-dependent in both space and time. Moreover, resilience is a function of many factors, not all of which may be the same for all people, even when those people occupy the same location.
Problems such as these are familiar to geographers and others who work with geospatial data, and are commonly termed the Modifiable Areal Unit Problem (see, e.g., Longley et al., 2011). Such problems arise when the results of an analysis, such as the measurement of resilience, depend on the areas used for the analysis. We might find, for example, that neighborhoods in some areas of New Orleans are substantially more resilient than other neighborhoods and that New Orleans as a whole has a resilience in the middle of the range, when compared with other places. By selectively lumping neighborhoods together, in other words, by modifying the areal units in a process similar to gerrymandering electoral districts, one could produce a map that sharply and misleadingly contrasts highly resilient areas and much less resilient areas.
The committee recognized the need to address this problem in any recommended system of measurement. The key is the concept of community, and its requirements of self-identification and mutual affinity, allowing a community, its members, and its boundary to be treated as an existing, well-defined area. In this sense a neighborhood, a town, or an entire city might all qualify as communities; and a community need not be formally recognized as an administrative unit, or precisely defined by a boundary on the Earth’s surface. Any individual might belong to more than one community, each with its own measurement of resilience; a New Orleans resident might live in a highly resilient neighborhood, but in a city of relatively low resilience. With this principle as its foundation, and no possibility of arbitrary or selective gerrymandering, the process of measurement of community resilience becomes much more straightforward. Essentially, and recalling a long-recognized duality in geography and related disciplines (e.g., Tuan, 2007), resilience needs to be addressed by reference to place and not space.
MEASURES OF U.S. NATIONAL RESILIENCE
Many organizations have tackled the problem of measuring resilience, or its close relative vulnerability, for the United States. This section reviews many of these efforts, choosing specific representative examples for detailed discussion.
Coastal Resilience Index
The Coastal Resilience Index, cosponsored by the Louisiana Sea Grant, Mississippi-Alabama Sea Grant Consortium, and the National Oceanic and Atmospheric Administration Gulf Coast Services Center (Emmer et al., 2008), provides an example of a community-based approach to developing an index of resilience to storm events through self-assessment. It adapts the principles outlined by FEMA (2001) to the specific needs of coastal hazards and operationalizes them into an ordinal metric.
The community is first asked to identify two scenarios from memory: a “bad storm” and a “worst storm.” Critical infrastructure and facilities are then evaluated: Were they impacted in either or both of the scenarios, and were they functioning afterward? Critical infrastructure includes the wastewater treatment system, the power grid, the water purification system, and transportation/evacuation routes. Critical facilities include government buildings, law enforcement buildings, fire stations, communication offices, the emergency operations center, evacuation shelters, hospitals, and critical record storage. The community is encouraged to expand these lists as appropriate. The numbers of critical infrastructure elements and critical facilities that continued to function after the scenarios are then totaled.
In the next step, the community is asked to assess whether various elements of its transportation system will be restored within 1 week after a “bad storm,” and again to total the number of such elements. The third step asks for information on the participation of the community in various plans and agreements, and whether it has key personnel in place with responsibility for disaster-related matters. The number of positive responses is counted. Step 4 yields a total for ongoing mitigation measures, Step 5 addresses business plans for the recovery of retail stores, and Step 6 asks about social networks and civic organizations.
The totals in each step are next transformed to Low, Medium, and High categories based on specified ranges—for example, to gain a High rating on critical infrastructure the community must have agreed that 100 percent of its elements would be functioning after a disaster. No weights are applied to each element; rather, the community is asked simply to count. The result is a total of seven metrics (two from Step 1 and one from each of the subsequent steps). The community is advised to treat these as separate indicators and not to attempt to combine them into a single metric.
The Low, Medium, and High resilience ratings are then converted into an overall state-of-the-community resilience for a specific category, along with some estimate of the time it would take for reoccupation of the community after the disaster: more than 18 months for a Low rating; less than 2 months for a Medium rating; and minimal impact for a High rating.
Argonne National Laboratory Resilience Index
A very different approach to measuring the resilience of critical infrastructure is described by Fisher et al. (2010), the result of a project conducted by Argonne National Laboratory in collaboration with the U.S. Department of Homeland Security’s Protective Security Coordination Division. Data are gathered at critical infrastructure facilities by trained interviewers known as Protective Security Advisors (PSAs). The interviews use an Infrastructure Survey Tool covering roughly 1,500 variables that cover six major physical and human components (physical security, security management, security force, information sharing, protective measures assessment, and dependencies) that are themselves broken down into 42 components. The approach is used for one or several types of critical infrastructure or key resource sector (banking and finance, dams, energy, etc.). Data are subjected to an elaborate, six-step process of quality control involving review by experts in critical infrastructure protection.
A five-stage aggregation process is then used to combine the items into a single Resilience Index (called the Protective Measure Index PMI) that ranges from 0 (lowest resilience) to 100 (highest resilience) for a given critical infrastructure or key resource sector and for a given threat. Each of the stages takes a subset of items at that stage and combines them using weights to obtain a single index for the next stage. From roughly 1,500 items at Level 5, this process results in 47 composite scores at Level 2, three at Level 1, and finally a single score. At Level 2, 18 of the 47 measures contribute to Robustness at Level 1, five to Recovery at Level 1, and 24 to Resourcefulness at Level 1. At each stage, every contributing measure is multiplied by a weight, and the products are summed to obtain the PMI composite index. Weights are obtained by analyzing the opinions of experts, using the MCDM methods of Keeney and Raiffa (1976). PMI ratings by sector (e.g., commercial facilities, energy, transportation, water) may help in identifying the infrastructure facility that is weakest in relation to one or several threats.
In contrast to the bottom-up elements of the Coastal Resilience Index, this approach is almost entirely top down, reflecting the need of a national program to be uniform and universal in its approach. There is no possibility of adaptation to local needs, by modifying either the set of data items or the weights, both of which are prescribed. The index is entirely concerned with critical infrastructure, such a narrow focus being more conducive to a rigorous, quantitative approach. Nevertheless, justifying universal weights resolved to three decimal places is difficult given the inherent vagueness of the concept of resilience and its essential components, and uncertainties over the exact nature of threats.
Social Vulnerability Index (SoVI®)
Social vulnerability is the susceptibility of a population to harm from a natural hazard and examines those characteristics of the population that influence their resilience. Vulnerable populations may be less resilient to hazards and disasters than other parts of the population, may need special assistance in preparing for, responding to, and recovering from disasters, and may be more susceptible to economic or other impacts from an event. Social vulnerability is place-based and context-specific, and helps explain why some portions of the country or community experience a hazard differently, despite having the same exposure. Income is but one variable that is often associated with vulnerable populations, and income levels clearly vary by race and ethnicity (Figure 4.1). Other vulnerable populations may include special-needs populations such as residents with physical or mental impairments, the elderly, the young, and those with limited access to transportation (see also Chapter 5).
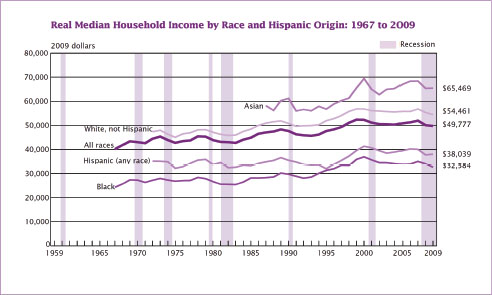
FIGURE 4.1 Trends in median household income in the United States. Data show income level variations by race and ethnicity. Source: U.S. Census Bureau.
Social vulnerability helps us to understand the inequalities in disaster impacts and is a multiattribute concept that includes socioeconomic status, race and ethnicity, gender, age, housing tenure, and so forth and how these factors influence a community’s resilience (Mileti, 1999; Heinz Center, 2002; NRC, 2006). Social vulnerability can change over time and across space (Cutter and Finch, 2008) and can be measured both qualitatively and quantitatively (Birkmann, 2006; Phillips et al., 2010).
Social vulnerability metrics are increasing in sophistication and usage in both research and practice. Among the best known is the Social Vulnerability Index (SoVI®), a metric that permits comparisons of places (block groups, census tracts, metropolitan areas, counties) (Cutter et al., 2003; Box 4.2). Mapping SoVI® scores illustrates the extremes of social vulnerability—those places with very high values (the most vulnerable), and those with relatively low values (the least vulnerable) (Figure 4.2). SoVI® captures the multidimensional nature of social vulnerability—vulnerability that exists prior to any hazard or disaster event. In addition to describing the relative level of social vulnerability, the metric also enables the examination of those underlying dimensions that are contributing to the overall score such as age disparities, socioeconomic status, employment, and special-needs populations.
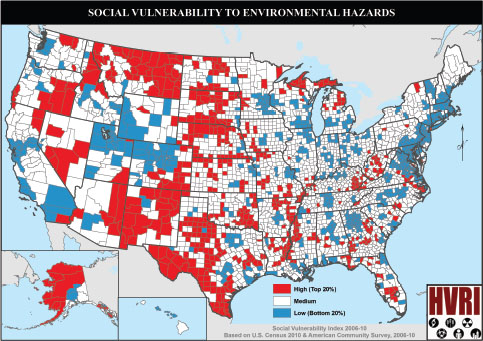
FIGURE 4.2 Social Vulnerability Index, 2006-2010. Areas in red denote higher levels of social vulnerability relative to other counties, whereas counties in blue show lower levels of social vulnerability. Mapping by standard deviations (represented here as top and bottom 20 percent) shows the extremes of the distribution, which is of greatest interest. HVRI = Hazard and Vulnerability Research Institute. Source: S. Cutter/HVRI.
BOX 4.2
The Social Vulnerability Index (SoVI®)
SoVI® is a statistically derived comparative metric to illustrate the variability in capacity for preparedness, response, and recovery at county and subcounty levels of geography. Using census data, SoVI® synthesizes 32 different variables, using a principal components analysis and expert judgment, into a single composite value, which is then mapped to illustrate differences between places. Several factors consistently appear in the results of these analyses, including socioeconomic status, elderly, and gender; however, the relative importance of these factors is observed to be place specific. Since its inception, SoVI® has been used by emergency planners as part of their state hazard mitigation planning (South Carolina, California, and Colorado) and has been incorporated into a number of digital products including the National Oceanic and Atmospheric Administration’s Coastal Services Digital Coast.
(http://www.csc.noaa.gov/digitalcoast/tools/slrviewer/index.html). See
http://sovius.org for more details and applications.
Baseline Resilience Indicator for Communities
A new composite indicator called the Baseline Resilience Indicator for Communities (BRIC) was introduced to measure community resiliency (Cutter et al., 2010). BRIC acknowledges that resilience is a multifaceted concept with social, economic, institutional, infrastructural, ecological, and community components. The composite indicator is calculated as the arithmetic mean of five subindexes related to social, economic, institutional, infrastructural, and community resilience; ecological resilience is not included in the 2010 formulation. Each subindex is normalized so that the final indicator varies between 0 and 1.
Cutter et al. (2010) proposed several applications of the proposed method to communities at different scales. An interesting case study relates to the spatial distribution of disaster resilience over 736 counties within FEMA Region IV (Figure 4.3). A second example deals with determining the resilience score of three metropolitan areas: Gulfport-Biloxi, Charleston, and Memphis. Both case studies show a clear ability to identify least-resilient areas at different geographic scales using an empirically based descriptive approach.
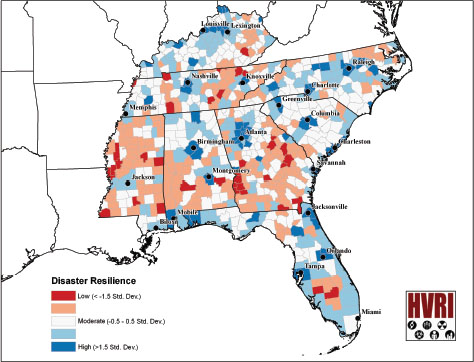
FIGURE 4.3 Spatial resolution of disaster resilience for FEMA Region IV. Source: S. Cutter/HRVI.
SPUR Model
The San Francisco Planning and Urban Research Association (SPUR) developed a set of metrics for measuring the resilience of the Bay Area with respect to earthquakes (SPUR, 2008). The process begins with the definition of an “expected earthquake,” defined as one “that can reasonably be expected to occur once during the useful life of a structure or system,” and in operation is one with a 10 percent probability of occurrence in a 50-year period. In the SPUR methodology, specific recovery objectives are defined in distinct time frames (Table 4.1): hours (3 to 72), days (30 to 60), and months (4 to 36). These target states of recovery and their time frames include those for hospitals, police and fire, the emergency operations center, transportation systems and utilities, airports, and neighborhood retail businesses, offices, and workplaces. Five categories of performance are defined for buildings ranging from A (safe and operational) to E (unsafe). Significantly, the goal for San Francisco was to have 95 percent of residents sheltering in place with 24 hours, requiring Category B performance for buildings. Although not all utilities might be functioning within 24 hours, the goal was to keep citizens in their homes and in their neighborhoods. The table provides the target states of recovery for San
Francisco’s buildings and infrastructure together with an assessment of the current status for each of 31 distinct criteria. The gap between desired performance and current status highlights which areas need most work. No attempt is made in the model to collapse the criteria into a single metric. This approach provides a useful template that could be applied to an entire city, or to any neighborhood or community for use in defining their critical criteria for recovery, creating a timeline using performance objectives to achieve it, all in support of longer-term resilience goals.
TABLE 4.1 SPUR Model of Measuring Recovery from Earthquakes
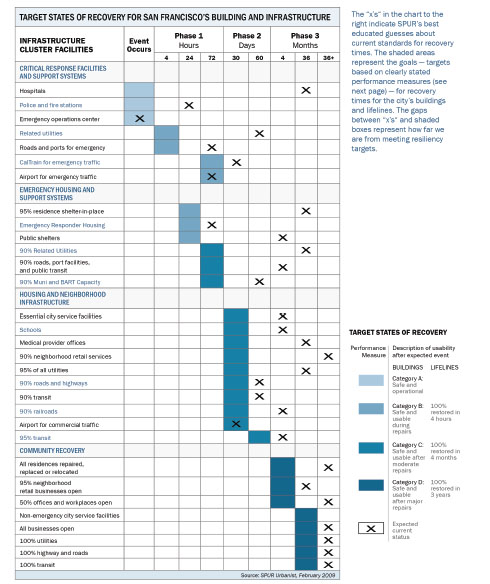
Note: The table provides a useful template for identifying critical areas for recovery, which could provide the basis for establishing resilience goals. Source: C. Poland/SPUR.
Other Models and Metrics
Many other models and metrics have been developed for measuring progress toward resilience. A number of these are listed and described briefly Table 4.2. This table and Table 4.3 provided examples that the committee used to develop the perspectives presented in Section 4.4.
Table 4.2 Additional Models and Metrics of U.S. National Resilience
| Community Assessment of Resilience Tool (CART) |
A product of the National Consortium for the Study of Terrorism and Responses to Terrorism (START), CART is “a community intervention mat includes a survey instrument, focus groups script, and process for assessing and building community resilience to disasters. Seven community capacity and competence attributes have been identified, refined, revised, and re-organized into four interrelated domains thought to affect community resilience to disasters: Connection and Caring, Resources. Transformative Potential, and Disaster Management. The current CART survey instrument consists of 21 core community resilience items along with demographics of respondents and additional questions dealing with issues of particular interest to participating organizations. The survey can be administered in person, over the telephone, by mail, or online. Results are used to develop a community profile from the perspective of respondents, a community intervention designed to measure and enhance community resilience” (START. 2011). |
| Community Resilience System (CRS) | CRS has been developed by the Community and Regional Resilience Initiative (CARRI. 2011). It includes six stages: Engage Community Leadership at Large. Perform Resilience Assessment, Develop Shared Community Vision. Action Planning, Establish Mechanism to Implement Plan and Sustain Program, and Evaluate and Review the Community’s Resilience Program. |
| T*H*R*I*V*E | The Toolkit for Health and Resilience in Vulnerable Environments (T*H*R*I*V*E) was developed by Prevention Institute under contract to the U.S. Office of Minority Health. It provides a toolkit “to help communities bolster factors that will improve health |
| outcomes and reduce disparities experienced by racial and ethnic minorities. T*H*R*I*V*E provides a framework for community members, coalitions, public health practitioners, and local decision makers to identify factors associated with poor health outcomes in communities of color, engage relevant stakeholders, and take action to remedy the disparities. The tool is grounded in research and was developed with input from a national expert panel. It has demonstrated utility in urban, rural, and suburban settings” (Prevention Institute. 2004). | |
| Nonis et al. (2008) community resilience model | An approach to the measurement of community resilience was proposed by Norris et al. in 2008. In a subsequent paper. Sherreib et al. (2010) combined this approach with publicly accessible population indicators, and applied it in a study of 21 counties of Mississippi. Their measure of community resilience, which is limited to the economic and social capacities of communities, indicated generally favorable correlation with archival and survey data. |
| Resilience Capacity Index (RCI) | The Resilience Capacity Index was developed by Kathryn A. Foster at the University at Buffalo Regional Institute. It provides “a single statistic summarizing a region's status on twelve factors hypothesized to influence the ability of a region to bounce back from a future unknown stress. The index permits comparisons across metropolitan regions and identification of strong and weak conditions relative to other metropolitan regions.” Further details are available through the Building Resilient Regions project of the Institute of Governmental Studies. University of California-Berkeley (BRR. 2011). |
| Community Disaster Resilience Index (CDRI) | The CDRI was developed by a team of researchers at Texas A&M’s Hazard Reduction and Recovery Center with support from NOAA. The quantitatively based metric uses the four phases of the disaster management cycle (preparedness, response, recovery, mitigation) and combines these with community capital assets (social, economic, physical, human, and natural capital). From the initial 120 candidate indicators, 75 were used in the index. Using subindexes based on each community capital (excluding natural capital), scores were averaged by each of the four capital assets and then averaged to compute the CDRI. The CDRI was then computed for |
| Gulf of Mexico coastal counties (Peacock, 2010). | |
| Center for Risk and Economic Analysis of Terrorism Events Economic Resilience Index (CREATE-ERI) | This index uses dollar values as a common denominator and is measured in terms of direct and indirect business interruption losses (usually as gross domestic product, or GDP). It is defined in terms of the standard “loss-triangle.” and includes static considerations of resilience through improved allocation of existing resources and dynamic considerations of optimal investment to hasten recovery and reconstruction. In essence, it is defined as avoided losses divided by maximum potential losses. A major application was to the economic impacts of the September 11 terrorist attacks. The New York Metropolitan Area economy and the U.S. economy as a whole exhibited remarkable resilience. Ninety-five percent of the businesses in the World Trade Center area were able to relocate. Business interruption losses were incurred during the period in which relocation took place. Application of the index indicated that 72 percent of potential business interruption losses were reduced by this relocation resilience tactic (Rose et al.. 2009). |
INTERNATIONAL EFFORTS TO MEASURE RESILIENCE
Importantly, the international community also has a great deal of interest in disaster resilience. Although some of the international focus is clearly on resilience of individual countries, many of the international resilience initiatives focus on how to build a world more resilient to disasters. As a complement to the previous section on U.S. resilience models and metrics, this section reviews examples of resilience measurement at the global scale; one approach is described in detail, followed by a table summarizing other efforts.
International Strategy for Disaster Reduction
Following the International Decade for Natural Disaster Reduction (IDNDR) in the 1990s, the International Strategy for Disaster Reduction (ISDR) was developed through a gathering of stakeholders committed to reducing disaster risk and building the resilience of communities and actions. A major action plan was proposed in 2005 in Kyoto, Japan, known as the Hyogo Framework of Action (UNISDR, 2007) for the decade ranging between 2005 and 2015. Adoption of the plan by 168 states at that time was driven by the impact of the recent 2004 tsunami. The most recent review of the progress
toward reaching that action plan was held in Geneva in May 2011 (UNISDR, 2011).
The action plan recognizes that the local community level is where the impact of disasters is most felt and where risk reduction is more needed—and that not addressing resilience may threaten nations’ and communities’ development gains. The plan also recognizes a need for international collaboration between various stakeholders interested in disaster risk reduction, namely states, regional organizations and institutions, international organizations, civil society, the scientific community, and the private sector.
The 2005 Hyogo Framework for Action (HFA) consists of five well-defined priorities for action (UNISDR, 2010):
• HFA-1. mating risk reduction a national and local priority, with a strong institutional basis for implementation:
• HFA-2. identifying, assessing, and monitoring disaster risks, and enhancing early warning;
• HFA-3. building a culture of safety and resilience using knowledge, innovation, and education at all levels;
• HFA-4, reducing the risk in key sectors; and
• HFA-5. strengthening disaster preparedness for effective response at all levels.
Each priority for action is divided into several specific tasks. Each task is assigned specific measurable indicators, a method of monitoring progress, guiding questions, and specific tools to reach the desired level of disaster risk reduction (DRR). Further, implementation of each task is illustrated by one or several international case studies. Table 4.3 shows an example for HFA-1.
Table 4.3 Tasks Defined by HFA to Make Risk Reduction a National and Local Priority-HFA Priority1
| Making Risk Reduction a National and Local/City Priority with a Strong Institutional Basis for Implementation | ||||
| HFA Tasks | Local Indicators | National HFA Monitor Indicators | Guiding Questions | Tools |
| Task – 1 Engage in multistakehold er dialogue to establish foundations for disaster risk reduction (DRR) |
• A local/city multisectoral platform for disaster risk reduction is functioning • Political commitment |
A. National multisectoral platform for disaster risk reduction is operational |
• Are different stakeholders engages in a continuing dialogue for dis ster risk reduction? • Is there political consensus on importance of DRR? • What is the degree of participation of civil society in DRR? • Is local/city government supportive to a community vision for DRR? |
• Multistakeholder dialogues; management information system |
|
Task – 2 Create or strengthen mechanisms for systematic coordination for DRR |
• Community participation and decentralized functions are ensured throughout the local authority |
B. Community participation and decentralization are ensured through the delegation of authority and resources to local levels |
• Are community participation and decentralization ensured through the delegation of authority and resources to the local/city level? • Is there official policy and strategy to support communi y-based disaster risk management in the city? • Are communities empowered to participate |
• Stakeholder engagement mechanisms; local platform for DRR |
| authority | levels |
in disaster risk reduction?
• Are city offices aware of their respective roles in reduction? • Are there committed and effective community outreach activities (DRR and related services, e.g. healthcare?) |
||
| Task – 3 Assess and develop the institutional basis for disaster risk reduction |
• Policy instruments and tools to support national institutional and legal frameworks • Legal and regulatory system |
C. A legal framework for disaster risk reduction exists with explicit responsibilities defined for all levels of government. D. A national policy framework for disaster risk reduction exists that requires plans and activities at all administrative levels, from national to local levels |
• Is responsibility for DRR planning and implementation devolved to city government and communities? • Are city government and communities equipped with human, financial, and organizational capacities/resources? • Are city government DRR policies, strategies, and implementation plans in place? • Are there relevant and enabling legislation (ordinance), land use regulations, building codes, etc. addressing and supporting DRR at the local level? • Are thre mechanisms for compliance and enforcement of laws, regulations, building codes, etc., and penalties for noncompliance defined by laws and regulations? • Is DRR integrated into planning at the local/city level in key sectors such as |
• Development plan; land use plan; physical plan • Budget allocation for DRR • Disaster management ordinance; building code; fire code; zoning ordinance • Specific ordinances |
|
agriculture, climate change, education, environment, health, housing, poverty alleviation, and social welfare? • Are the roles and responsibilities for disaster risk reduction clearly designated? • Is the legal and regulatory system underpinned by guarantees of relevant rights to safety, to equitable assistance, to be listened to and consulted? |
||||
| Task – 4 Prioritize DRR and allocate appropriate resources |
• Dedicated and adequate resources are available to implemen t DRR activities within the local authority |
E. Dedicated and adequate resources are available to implement DRR plans at all administrative levels |
• Are there institutional capacities for DRR at the local/city level? • Is budget allocated to local/city covernment and other local institutions adequate to enable DRR to be integrated into planning and actual activities? • Are financial resources available to build partnerships with civil society for DRR? • Are there logistical, and other such resources allocated for DRR? • Does the government provide training in DRR to local/city officials and community leaders? • Is a system of accountability in place, including transparency in the conduct of DRR and use of funds? |
• Disaster risk management office; disaster coordinating council |
Source: R. Shaw and Y. Matasuoko, UNISDR
Other International Resilience Metrics and Indicators
Other international metrics and indicators for vulnerability, risk, and resilience have also been developed. Table 4.4 provides a brief summary of some of these.
Table 4.4 Selected Summary of International Metrics and Indicators for Vulnerability, Risk, and Resilience
| United Nations Development Programme (UNDP) Disaster Risk Index (DRJ) | The DEI. introduced in 2004, measures the average risk of death per country in three types of disasters (earthquakes, tropical cyclones, and floods). It is a measure of vulnerability to a specific hazard that also accounts for the role of sociotechnical-humanistic and environmental issues that could be correlated with death and may point toward causal processes of disaster risks. The key steps in determining the DRI for a specific hazard include calculation of physical exposure in terms of number of people exposed to a hazard event in a given year: calculation of relative vulnerability in terms of number of people killed to number of people exposed; and calculation of vulnerability indicators using 26 variables. Based on the value of the DRI. and for a given specific hazard, countries are ranked according to their degree of physical exposure, relative vulnerability, and degree of risk (UNDP, 2004; Peduzzi et al., 2009). |
| Inter-American Development Bank Disaster Deficit Index (DDI) | The DDL introduced in 2005, is an indicator of a country’s economic vulnerability to disaster. It is limited to Latin America and the Caribbean. DDI is a measure of the likely economic loss related to a disaster in a given time period and for the economic coping capacity of the country (IDB, 2007). |
| Inter-Agency Standing Committee (IASC) In-Country Team Self-Assessment Tool for Natural Disaster Response Preparedness | Established in 1994. the IASC was created to be the primary mechanism for interagency coordination of humanitarian assistance at the international level. It is composed of representatives of all 14 leading UN agencies, non-UN humanitarian agencies, and three consortia of nongovernmental organizations. The In-Country Team Self-Assessment Tool for Natural Disaster Response Preparedness consists of a support chart and a checklist of issues and questions to self-assess the level of |
| international standards. It also provides resources to address key concerns and propriety areas for disaster preparedness and response. See http://www.humanitarianinfo.org/iasc/. | |
| United Nations University Institute for Environment and Human Security. World Risk Index | The World Risk Index, introduced in 2011 (UNU, 2011), indicates the probability that a country or region will be affected by an extreme natural event (earthquakes, storms, floods, droughts, and sea-level rise). It also focuses on (i) the vulnerability of the population (levels of poverty, education, food security, infrastructure, economic framework) to natural hazards, (ii) its capacity to cope with severe and immediate disasters as a function of governance, disaster preparedness, early warning systems, medical services, and social and economic security, and (in) its adaptive precautionary measures against anticipated future natural disasters. The World Risk Index is also combined with local and project risk indexes. |
The preceding two sections have presented representative approaches to the measurement of resilience. They vary on many dimensions: top-down prescriptions versus community-based consensus; universal or adaptable, based on available data or requiring extensive data gathering; place-based or spatial, and focused on specific hazards and vulnerabilities or extensible depending on the context. This section introduces the committee’s perspective, comments on each of these dimensions as they might apply to the committee’s charge, and then moves to a discussion of the implementation of metrics.
First, the committee visited three different areas—New Orleans and the Mississippi Gulf Coast, Iowa, and Southern California—and recognized the degree to which community concerns vary. New Orleans was recovering from a major storm event and Iowa from a major flood event, whereas Southern California has a history of disastrous wildfires and landslides and must prepare for a future major earthquake event. In the committee’s view, therefore, any approach to measuring resilience has to address multiple hazards, and has to be adaptable to the needs of specific communities and the hazards they face. By contrast, the SPUR model (see earlier section) concerns only earthquake hazard, though it could perhaps be generalized to other hazards.
Second, the committee met with communities of many sizes, from those in the greater metropolitan areas of Southern California to the small towns of the Mississippi Gulf Coast. It is clear that any approach the committee
recommends must be place-based rather than spatial, in the meaning of those terms defined at the start of the chapter, and capable of dealing with a range of community sizes. Moreover some communities, such as the Lower Ninth Ward of New Orleans, will be very different in structure, spatial extent, and level of social organization than others. Again, the emphasis in the committee’s approach to measuring resilience is on adaptability. This concern for community, place, and adaptability argues against any universal solution, such as that represented by the Argonne National Laboratory Resilience Index.
Third, the committee recognizes that many dimensions must contribute to an index, from the physical resilience of the built and natural environment and critical infrastructure to aspects of human/social resilience such as the existence of strong social networks, a strong economic base, or good governance. The examples that yield a single index—SoVI®, BRIC, and the Argonne National Laboratory Resilience Index—all focus on a single dimension, social vulnerability in the first case, community resilience in the second, and critical infrastructure in the third. SoVI®’s reliance on available Census data suggests that it would be difficult to extend its approach to other dimensions, while the Argonne approach requires substantial investment in data gathering, compared with the community-based data gathering of the Coastal Resilience Index, for example.
As mentioned in Chapter 3, the issues of data availability are critical not only for hazard and disaster informatics, but resilience metrics as well. However, it is not just data that constrain our ability to measure resilience. Better understanding on how to implement such a measurement system is also needed. What should be measured over what time frame and geographic scale? Should resilience be reassessed on a regular schedule, or should certain factors trigger a reassessment? Should scales be prescribed and uniform, or should they be adapted to meet specific circumstances? How should these indicators be measured (e.g., qualitatively, quantitatively)? Should these data be included into a single composite index or some other structure, and if a single index, how should the various components be weighted? By what means can it be determined that the right elements for the resilience index have been captured? How is the sensitivity of the index assessed? Addressing these issues through an integrated research program would assist the nation in providing the scientific backing for the development of a national resilience scorecard.
Moreover, such a research program could provide useful insights by making a systematic comparison of the different metrics proposed in the literature. Besides addressing the questions raised earlier in this paragraph, it
would be very useful to compare metrics on the basis of cost, and the time and effort needed to implement and evaluate them.
SUMMARY AND RECOMMENDATION: IMPLEMENTING A MEASUREMENT SYSTEM
With this background, we now turn to the committee’s conclusions and specific recommendations regarding metrics and indicators. Related topics have been discussed at several points in the report, including Chapter 3, where we discuss the lack of consistent, reliable data on the impacts of hazards and disasters that might feed into the measurement of resilience.
This chapter has focused on the importance of metrics and indicators that can be used to evaluate resilience, to provide baselines for comparison and the foundation for a system of tracking improvements. In essence, the committee concludes from the evidence gathered that without some numerical basis for assessing resilience it would be impossible to monitor changes or show that community resilience has improved. At present, no consistent basis for such measurement exists. We recommend therefore that a National Resilience Scorecard be established.
Until a community experiences a disaster and has to respond to and recover from it, demonstrating the complexity, volume of issues, conflicts, and lack of ownership are difficult. A national resilience scorecard, from which communities can then develop their own, tailored scorecards, will make it easier for communities to see the issues they will face without being subjected to the event and can support necessary work in anticipation of an appropriate resilience-building strategy. A scorecard will also allow communities to ask the right questions in advance.
In the preceding sections the committee’s vision of such a scorecard was outlined. It should be readily adaptable to the needs of communities and levels of government, focusing specifically on the hazards that threaten each community. It should align with community goals and vision. It should not attempt unreasonable precision, either in the ways in which individual factors are measured, or in the ways they are combined into composite indicators. Rather, the scorecard should follow the examples presented earlier where qualitative and quantitative measures are mingled, and reduced where appropriate to ordinal (rankings) rather than interval or ratio scales.
The various indicators reviewed in this chapter vary greatly depending on the dimensions they assess, the sources of data they employ, and the ways in which they combine data to obtain indicators. However, certain commonalities emerge and provide useful guidance in the development of a Scorecard. While maintaining its commitment to local solutions and not wishing to be overly
prescriptive, the committee emphasizes that it is imperative to include certain dimensions in the Scorecard:
• Indicators of the ability of critical infrastructure to recover rapidly from impacts (see, e.g., Section 4.2.1);
• Social factors that enhance or limit a community’s ability to recover, including social capital, language, and socioeconomic status, and the availability of a workforce with skills relevant to recovery (see, e.g., Section 4.2.3);
• Indicators of the ability of buildings and other structures to withstand the physical and ecological impacts of disasters (e.g., ground shaking, severe wind and precipitation, inundation, fires (see, e.g., Section 4.2.5); and
• Factors that capture the special needs of individuals and groups, related to minority status, mobility, or health status (see, e.g., the T*H*R*I*V*E model in Section 4.2.6).
Although such a scorecard would be used as a self-assessment tool employed by individual communities, some central coordination and direction for the development of the scorecard is appropriate from the federal level. The committee concludes that responsibility for coordinating the development of a scorecard should rest with a single federal agency but be compiled through a national effort that engages with individuals and communities at all levels. The Department of Homeland Security appears to be the most appropriate agency for coordinating this collective endeavor. In summary, the committee concludes its work in the area of metrics and indicators with this recommendation:
Recommendation. The Department of Homeland Security in conjunction with other federal agencies, state and local partners, and professional groups should develop a National Resilience Scorecard.
Birkmann, J., ed. 2006. Measuring Vulnerability to Natural Hazards. New Delhi, India: TERI Press.
BRR (Building Resilient Regions). 2011. Resilience Capacity Index. Available at: http://brr.berkeley.edu/rci/. CARRI (Community and Regional Resilience Initiative). 2011. Community Resilience System Initiative (CRSI) Steering Committee Final Report: A Roadmap to Increased Community Resilience. Available at: http://www.resilientus.org/library/CRSI_Final_Report-1_1314792521.pdf.
Cutter, S. L., and C. Finch. 2008. Temporal and spatial changes in social vulnerability to natural hazards. Proceedings of the National Academy of Sciences of the United States of America 105(7):2301-2306.
Cutter, S. L., B. J. Boruff, and W. L. Shirley. 2003. Social vulnerability to environmental hazards. Social Science Quarterly 84(2):242-261.
Cutter, S. L., C. G. Burton, and C. T. Emrich. 2010. Disaster resilience indicators for benchmarking baseline conditions. Journal of Homeland Security and Emergency Management 7(1). Available at http://www.bepress.com/jhsem/vol7/iss1/51.
Emmer, R., L. Swann, M. Schneider, S. Sempier, T. Sempier, and T. Sanchez. 2008. Coastal Resilience Index: A Community Self-Assessment. A Guide to Examining How Prepared Your Community Is for a Disaster. NOAA Publ. No. MAS GP-08-014. Available at http://research.fit.edu/sealevelriselibrary/documents/doc_mgr/434/Gulf_Coast_Coastal_Resilience_Index_-_SeaGrant.pdf.
FEMA (Federal Emergency Management Administration). 2001. Understanding Your Risks: Identifying Hazards and Estimating Losses. FEMA Publ. No. 386-2. Available at http://www.fema.gov/library/viewRecord.do?id=1880.
Fisher, R. E., G. W. Bassett, W. A. Buehring, M. J. Collins, D. C. Dickinson, L. K. Easton, R. A. Haffenden, N. E. Hussar, M. S. Klett, M. A. Lawlor, D. J. Miller, F. D. Petit, S. M. Peyton, K. E. Wallace, R. G. Whitfield, and J. P. Peerenboom. 2010. Constructing a Resilience Index for the Enhanced Critical Infrastructure Program. Argonne National Laboratory/Department of Energy Report No. ANL/DIS 10-9. Available at www.ipd.anl.gov/anlpubs/2010/09/67823.pdf.
Heinz Center (H. John Heinz III Center for Science, Economics, and the Environment). 2002. Human Links to Coastal to Coastal Disasters, Washington, DC: Heinz Center.
IDB (Inter-American Development Bank). 2007. Indicators of Disaster Risk and Risk Management: Program for Latin America and the Caribbean. Available at http://www.iadb.org/exr/disaster/ddi50.cfm.
Keeney, R. L., and H. Raiffa. 1976. Decisions with Multiple Objectives: Preferences and Value Tradeoffs. New York: Wiley.
Longley, P. A., M. F. Goodchild, D. J. Maguire, and D. W. Rhind. 2011. Geographical Information Systems and Science, 3rd Ed. Hoboken, NJ: Wiley.
Malczewski, J. 2010. Multicriteria Decision Analysis in Geographic Information Science. Berlin: Springer.
Massam, B. H. 1993. The Right Place: Shared Responsibility and the Location of Public Facilities. Harlow, UK: Longman.
Mileti, D. 1999. Disasters by Design: A Reassessment of Natural Hazards in the United States. Washington, DC: Joseph Henry Press.
Norris, F. H., S. P. Stevens, B. Pfefferbaum, K. F. Wyche, and R. L. Pfefferbaum. 2008. Community resilience as a metaphor, theory, set of capacities, and strategy for disaster readiness. American Journal of Community Psychology 41:127-150.
NRC (National Research Council). 2006. Facing Hazards and Disasters: Understanding Human Dimensions. Washington, DC: The National Academies Press.
Peacock, W. G., ed. 2010. Advancing the Resilience of Coastal Localities: Developing, Implementing and Sustaining the Use of Coastal Resilience Indicators: A Final Report. Hazard Reduction and Recovery Center, Texas A&M University. Available at http://archone.tamu.edu/hrrc/Publications/researchreports/downloads/10-02R_final_report_grant_NA07NOS4730147_with_cover.pdf.
Peduzzi, P., H. Dao, C. Herold, and F. Mouton. 2009. Assessing global exposure and vulnerability towards natural hazards: The Disaster Risk Index. Natural Hazards and Earth System Sciences 9:1149-1159.
Phillips, B. D., D. S. K. Thomas, A. Fothergill, and L. Blinn-Pike, eds. 2010. Social Vulnerability to Disasters. Boca Raton, FL: CRC Press.
Prevention Institute. 2004. A Community Approach to Address Health Disparities: T*H*R*I*V*E: Toolkit for Health and Resilience in Vulnerable Environments. Available at http://minorityhealth.hhs.gov/assets/pdf/checked/THRIVE_FinalProjectReport_093004.pdf.
Rose, A., G. Oladosu, B. Lee, and G. Beeler-Asay. 2009. The economic impacts of the 2001 terrorist attacks on the World Trade Center: A computable general equilibrium analysis. Peace Economics, Peace Science, and Public Policy 15(2), Article 4.
Saaty, T. L. 1988. Decision Making for Leaders: The Analytical Hierarchy Process for Decisions in a Complex World. Pittsburgh, PA: University of Pittsburgh Press.
Sherrieb, K., F. Norris, and S. Galea. 2010. Measuring capacities for community resilience. Social Indicators Research 99(2):227-247.
SPUR (San Francisco Planning and Urban Research Association). 2008. Defining What San Francisco Needs from Its Seismic Mitigation Policies. Available at http://www.spur.org/publications/library/report/defining-what-san-francisco-needs-its-seismic-mitigation-policies#disaster.
START (National Consortium for the Study of Terrorism and Responses to Terrorism). 2011. Developing Community Resilience for Children and Families. Available at http://www.start.umd.edu/start/research/investigators/project.asp?id=30.
Tuan, Y.-F., 2007. Space and Place: The Perspective of Experience. Minneapolis: University of Minnesota Press.
UNDP (United Nations Development Program). 2004. Reducing Disaster Risk: A Challenge for Development. Available at http://www.grid.unep.ch/activities/earlywarning/DRI/.
UNISDR (United Nations International Strategy for Disaster Reduction). 2007. Hyogo Framework for Action 2005-2015: Building the Resilience of Nations and Communities to Disaster. Available at http://www.unisdr.org/files/1037_hyogoframeworkforactionenglish.pdf.
UNISDR. 2010. A Guide for Implementing the Hyogo Framework for Action by Local Stakeholders. Available at http://www.unisdr.org/files/13101_ImplementingtheHFA.pdf.
UNISDR. 2011. Themes and Issues in Disaster Risk Reduction. Available at http://www.preventionweb.net/files/19646_themesandissuesindrrwithdefinitions.pdf.
UNU (United Nations University). 2011. World Risk Report 2011. Berlin, Germany: Alliance Development Works. Available at http://www.ehs.unu.edu/file/get/9018.


