
![]()
Neuroscientists have become used to a number of “facts” about the human brain: It has 100 billion neurons and 10- to 50-fold more glial cells; it is the largest-than-expected for its body among primates and mammals in general, and therefore the most cognitively able; it consumes an outstanding 20% of the total body energy budget despite representing only 2% of body mass because of an increased metabolic need of its neurons; and it is endowed with an overdeveloped cerebral cortex, the largest compared with brain size. These facts led to the widespread notion that the human brain is literally extraordinary: an outlier among mammalian brains, defying evolutionary rules that apply to other species, with a uniqueness seemingly necessary to justify the superior cognitive abilities of humans over mammals with even larger brains. These facts, with deep implications for neurophysiology and evolutionary biology, are not grounded on solid evidence or sound assumptions, however. Our recent development of a method that allows rapid and reliable quantification of the numbers of cells that compose the whole brain has provided a means to verify these facts. Here, I review this recent evidence and argue that, with 86 billion neurons and just as many nonneuronal cells, the human brain is a scaled-up primate brain in its cellular composition and
__________
Instituto de Ciências Biomédicas, Universidade Federal do Rio de Janeiro, 21941-902, Rio de Janeiro, Brazil; and Instituto Nacional de Neurociência Translacional, Instituto Nacional de Ciência e Tecnologia/Ministério de Ciência e Tecnologia, 04023-900, Sao Paulo, Brazil. E-mail: suzanahh@gmail.com.
metabolic cost, with a relatively enlarged cerebral cortex that does not have a relatively larger number of brain neurons yet is remarkable in its cognitive abilities and metabolism simply because of its extremely large number of neurons.
If the basis for cognition lies in the brain, how can it be that the self-designated most cognitively able of animals—us, of course—is not the one endowed with the largest brain? The logic behind the paradox is simple: because brains are made of neurons, it seems reasonable to expect larger brains to be made of larger numbers of neurons; if neurons are the computational units of the brain, then larger brains, made of larger numbers of neurons, should have larger computational abilities than smaller brains. By this logic, humans should not rank even an honorable second in cognitive abilities among animals: at about 1.5 kg, the human brain is two- to threefold smaller than the elephant brain and four- to sixfold smaller than the brains of several cetaceans (Tower, 1954; Marino, 1998). Nevertheless, we are so convinced of our primacy that we carry it explicitly in the name given by Linnaeus to the mammalian order to which we belong—Primata, meaning “first rank,” and we are seemingly the only animal species concerned with developing entire research programs to study itself.
Humans also do not rank first, or even close to first, in relative brain size (expressed as a percentage of body mass), in absolute size of the cerebral cortex, or in gyrification (Hofman, 1985). At best, we rank first in the relative size of the cerebral cortex expressed as a percentage of brain mass, but not by far. Although the human cerebral cortex is the largest among mammals in its relative size, at 75.5% (Rilling and Insel, 1999), 75.7% (Frahm et al., 1982), or even 84.0% (Hofman, 1988) of the entire brain mass or volume, other animals, primate and nonprimate, are not far behind: The cerebral cortex represents 73.0% of the entire brain mass in the chimpanzee (Stephan et al., 1981), 74.5% in the horse, and 73.4% in the short-finned whale (Hofman, 1985).
The incongruity between our extraordinary cognitive abilities and our not-that-extraordinary brain size has been the major driving factor behind the idea that the human brain is an outlier, an exception to the rules that have applied to the evolution of all other animals and brains. A largely accepted alternative explanation for our cognitive superiority over other mammals has been our extraordinary brain size compared with our body size, that is, our large encephalization quotient (Jerison, 1973). Compared with the trend for brain mass to increase together with body mass across mammalian species in a fashion that can be described mathematically by a power law (von Bonin, 1937), the human species appears
to be an outlier, with a brain that is about sevenfold larger than expected from its body mass compared with mammals as a whole (Jerison, 1977), or threefold larger than expected compared with other primates (Jerison, 1985), although how we came to be that way has not been well accounted for in the literature.
Why should a larger-than-expected brain bring about larger cognitive abilities? That notion is based on the idea that an “excess brain mass,” relative to the brain mass necessary to operate the body, would endow the behavior of more encephalized animals with more complexity and flexibility (Jerison, 1985). The most encephalized species should also be the most cognitively able, and that species, finally, was our own.
However, the notion that higher encephalization correlates with improved cognitive abilities has recently been disputed in favor of absolute numbers of cortical neurons and connections (Roth and Dicke, 2005), or simply absolute brain size (Deaner et al., 2007). If encephalization were the main determinant of cognitive abilities, small-brained animals with very large encephalization quotients, such as capuchin monkeys, should be more cognitively able than large-brained but less encephalized animals, such as the gorilla (Marino, 1998). However, the former animals with a smaller brain are outranked by the latter in cognitive performance (Deaner et al., 2007).
It remains possible that the source of incongruence between our cognitive abilities and brain size is an unwarranted comparison of species across orders. Such comparisons are based on the notion, implicit in most comparative studies to date, that different brains are just scaled-up or scaled-down versions of a common basic plan, such that larger brains always have more neurons than smaller brains and two brains of a similar size always have comparable numbers of neurons. However, this notion is in disagreement with the observation that animals of similar brain size but belonging to different mammalian orders, such as the cow and the chimpanzee (both at about 400 g of brain mass), or the rhesus monkey and the capybara (at 70–80 g of brain mass), may have strikingly different cognitive abilities and behavioral repertoires. Thus, either the logic that larger brains always have more neurons is flawed or the number of neurons is not the most important determinant of cognitive abilities. The appealing alternative view that total connectivity, gauged from the total number of synapses in the brain, should be a direct determinant of brain processing capabilities runs into the same difficulty. Although this possibility remains to be examined systematically, the few pieces of evidence available in the literature suggest that synaptic density is constant across species (Cragg, 1967; Beaulieu and Colonnier, 1985; Schüz and Palm, 1989; Schüz and Demianenko, 1995). If that is indeed the case, the total numbers of brain synapses would be simply proportional to brain size and the differences
in cognitive abilities between brains of a similar size would, again, be left unaccounted for.
On the other hand, it is possible that the relationship between brain size and number of brain neurons is determined by rules that have varied in evolution, and visual examination of brain sizes in the mammalian radiation does suggest that large brains appeared several times independently in most of the mammalian orders (Fig. 8.1). In this scenario of independent evolution of large brains in different mammalian orders, not all mammalian brains are necessarily built as larger or smaller versions of the same plan, with proportionately larger or smaller numbers of neurons. This scenario leaves room for similarly sized brains across orders, such as the cow and the chimpanzee brains, to contain very different numbers of neurons, just as a very large cetacean brain might contain fewer neurons than a gorilla brain. In that case, size comparisons between the human brain and nonprimate brains, larger or smaller, might simply be inadequate and uninformative, and our view of the human brain as an outlier, an extraordinary oddity, may have been based on the mistaken assumption that all brains are made the same.
Here, I will explore the different relationships that apply across mammalian orders between brain structure size and numbers of neuronal cells (i.e., their order- and structure-specific neuronal scaling rules); the shared relationships across orders between brain structure mass and numbers of nonneuronal cells and nonneuronal cell density (i.e., their shared nonneuronal scaling rules); the concerted scaling across mammalian brains of numbers of neurons in the cerebral cortex and cerebellum, despite the increase in relative size of the former in larger brains; the constraints imposed by the primate neuronal scaling rules on cortical connectivity; the relationship between brain metabolism and number of neurons; and, finally, how humans compare with other mammals in these aspects, and what that recent evidence implies about human brain evolution.
NOT ALL BRAINS ARE MADE THE SAME: NEURONAL SCALING RULES
Testing the possibility that large brains have evolved as different functions of their numbers of neurons across mammalian orders became possible when we determined the numbers of cells that compose the brain of over 30 species belonging to three mammalian orders (Herculano-Houzel, 2011b). These studies were made possible by the development of the isotropic fractionator, an unbiased nonstereological method created in our laboratory that provides cell counts based on suspensions of free nuclei derived from tissue homogenates from whole brains divided into anatomically defined regions (Herculano-Houzel and Lent, 2005).
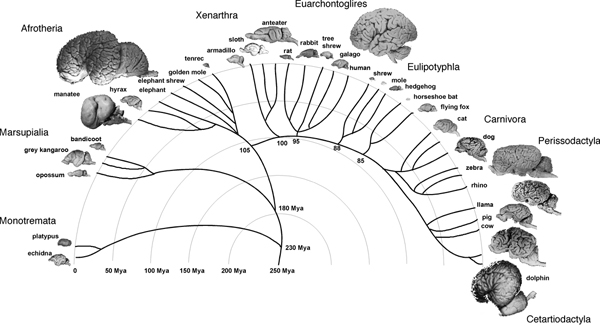
FIGURE 8.1 Large brains appear several times in the mammalian radiation. Example species are illustrated for each major mammalian group. Mammalian radiation based on Murphy et al. (2004) and Kaas (2007). Brain images from the Wisconsin and Michigan State Comparative Mammalian Brain Collections (www.Brainmuseum.org).
Applying the isotropic fractionator, we found that the proportionality between brain mass and number of brain neurons (i.e., the neuronal scaling rule for the brains of a group of animals) is different across brain structures and mammalian orders [reviewed in Herculano-Houzel (2011b)] (Fig. 8.2). In rodents, variations in brain size outpace variations in the number of brain neurons: rodent brains vary in mass as a power function of the number of brain neurons raised to a large exponent of 1.5 (Herculano-Houzel et al., 2006, 2011) (Fig. 8.2, Upper Left). In primates and insectivores, in contrast, brain size increases linearly as a function of its number of neurons, or as a power function with an exponent of ~1.0 (Herculano-Houzel et al., 2007; Azevedo et al., 2009; Sarko et al., 2009; Gabi et al., 2010) (Fig. 8.2, Upper Left). This means that a 10-fold increase in the number of neurons in a rodent brain results in a 35-fold larger brain, whereas in a primate or insectivore, the same increase results in a brain that is only 10- or 11-fold larger (Herculano-Houzel, 2009). Different neuronal scaling rules also apply separately to the cerebral cortex, cerebellum, and rest of the brain across mammalian orders (Figs. 8.2, Upper and 8.3A). This happens as the rate of variation in neuronal density with increasing structure size differs across brain structures and mammalian orders (Fig. 8.3B), indicating that average neuronal size varies rapidly with numbers of neurons in some and slowly or not at all in others (Herculano-Houzel, 2011b). For instance, the cerebral cortex grows across rodent species as a power function of its number of neurons with a large exponent of 1.7 (Herculano-Houzel et al., 2011), which means that a 10-fold increase in the number of cortical neurons in a rodent leads to a 50-fold increase in the size of the cerebral cortex. In insectivores, the exponent is 1.6, such that a 10-fold increase in the number of cortical neurons leads to a 40-fold larger cortex. In primates, in contrast, the cerebral cortex and cerebellum vary in size as almost linear functions of their numbers of neurons (Herculano-Houzel et al., 2007; Gabi et al., 2010), which means that a 10-fold increase in the number of neurons in a primate cerebral cortex or cerebellum leads to a practically similar 10-fold increase in structure size, a scaling mechanism that is much more economical than in rodents and allows for a much larger number of neurons to be concentrated in a primate brain than in a rodent brain of similar size (Fig. 8.3A).
SHARED SCALING RULES: NONNEURONAL CELLS
In contrast to the structure- and order-specific neuronal scaling rules, the numerical relationship between brain structure mass and the respective number of nonneuronal cells seems similar across all structures and species analyzed so far, spanning about 90 million years of evolution (Figs. 8.2, Lower and 8.3C): the larger a structure is, the more nonneuronal cells
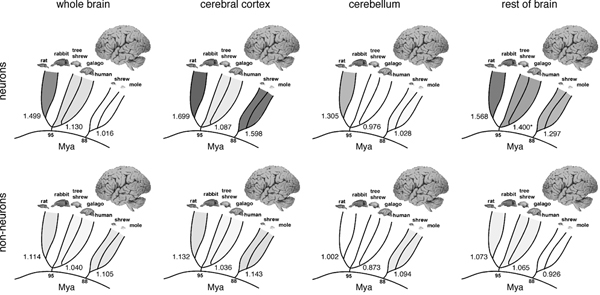
FIGURE 8.2 Comparison of allometric exponents for total brain mass, cerebral cortex mass, cerebellar mass, and rest of brain mass as a function of numbers of neurons (Left) or nonneuronal cells (Right). Exponents, given at the base of the radiation of each individual group (Glires, Primata/Scandentia, and Eulipotyphla), are illustrated by the intensity of the shading. Data from Herculano-Houzel et al. (2006, 2007, 2011), Azevedo et al. (2009), Sarko et al. (2009), and Gabi et al. (2010); exponents from Herculano-Houzel (2011b).
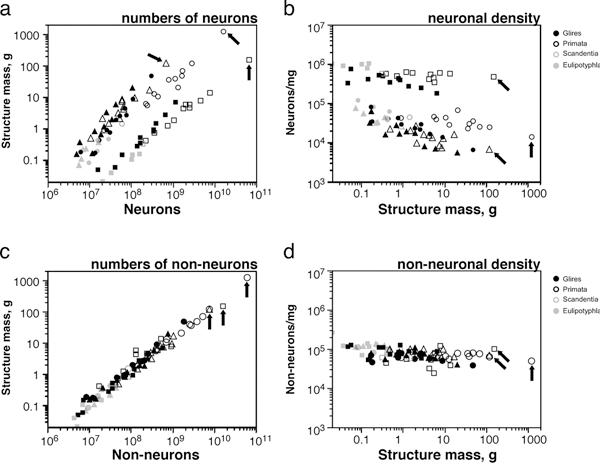
FIGURE 8.3 Shared nonneuronal scaling rules and structure- and order-specific neuronal scaling rules for mammalian brains. Each point represents the average values for one species (insectivores, filled gray symbols; rodents, filled black symbols; primates, open black symbols; scandentia, open gray symbols). Arrows, human datapoints. Circles, cerebral cortex; squares, cerebellum; triangles, rest of brain (excluding the olfactory bulb). (A) Clade- and structure-specific scaling of brain structure mass as a function of numbers of neurons. Allometric exponents: cerebral cortex, 1.699 (Glires), 1.598 (insectivores), 1.087 or linear (primates); cerebellum, 1.305 (Glires), 1.028 or linear (insectivores), 0.976 or linear (primates); rest of brain, 1.568 (Glires), 1.297 (insectivores), 1.198 (or 1.4 when corrected for phylogenetic relatedness in the dataset, primates). (B) Neuronal cell densities scale differently across structures and orders, but are always larger in primates than in Glires. Allometric exponents: cerebral cortex, -0.424 (Glires), -0.569 (insectivores), –0.168 (primates); cerebellum, -0.271 (Glires), not significant (insectivores and primates); rest of brain, -0.467 (Glires), not significant (insectivores), -0.220 (primates). (C) Mass of the cerebral cortex, cerebellum, and rest of brain varies as a similar function of their respective numbers of nonneuronal cells. Allometric exponents: cerebral cortex, 1.132 (Glires), 1.143 (insectivores), 1.036 (primates); cerebellum, 1.002 (Glires), 1.094 (insectivores), 0.873 (primates); rest of brain, 1.073 (Glires), 0.926 (insectivores), 1.065 (primates). (D) Average density of nonneuronal cells in each structure does not vary systematically with structure mass across species. Power functions are not plotted so as not to obscure the datapoints. Allometric exponents from Herculano-Houzel (2011b). Data from Herculano-Houzel et al. (2006, 2007, 2011), Azevedo et al. (2009), Sarko et al. (2009), and Gabi et al. (2010).
it has, in a nearly linear manner, such that nonneuronal cell density does not vary systematically with structure size (Fig. 8.3D). This implies that glial and endothelial cells have not been free to vary in size as mammalian brains evolve, a finding suggesting that the functions of these cells must be tightly regulated, allowing very little room for changes in evolution (Herculano-Houzel, 2011b).
SHARED SCALING RULES: CEREBRAL CORTEX AND CEREBELLUM
Larger brains possess larger cerebral cortices and cerebella but with a slightly faster increase in the size of the former compared with the latter, such that over five orders of magnitude, larger brains possess relatively larger cerebral cortices, whereas the relative size of the cerebellum fails to increase with brain size (Stephan et al., 1981). If the size of these structures were similar functions of their numbers of neurons, relatively larger cerebral cortices should hold increasingly larger percentages of brain neurons across species. Based on this implicit assumption, the discrepancy in the scaling of relative cerebral cortical and cerebellar size in larger brains has been used as an argument favoring the functional importance of relative neocortex expansion in brain function and evolution (Hofman, 1985; Clark et al., 2001; Jerison, 2007).
Strikingly, we found that the increase in relative size of the cerebral cortex in larger brains does not reflect a relatively larger number of cortical neurons compared with the whole brain, or with the cerebellum. Larger cortices do have larger numbers of neurons, of course (Fig. 8.3A); however, and in contrast to the increasing volumetric preponderance of the cerebral cortex in larger mammalian brains, numbers of neurons in the cerebral cortex increase coordinately and linearly with numbers of neurons in the cerebellum across mammalian species of different orders (Fig. 8.4A), regardless of how much the cerebral cortex comes to dominate brain size (Fig. 8.4B). This coordinated scaling happens with a relatively stable numerical preponderance of about four neurons in the cerebellum to every neuron in the cerebral cortex, even though these structures change in size following different cellular scaling rules across rodents, primates, and Eulipotyphla (Herculano-Houzel, 2010) (insectivores; Fig. 8.4A). This is illustrated by the finding that in most mammalian species examined so far, including humans, the cerebral cortex contains about 20–25% of all brain neurons, regardless of its relative size [which can reach 82% of the brain in humans (Herculano-Houzel, 2010)]. Thus, for a variation in brain size of five orders of magnitude, the ratio between numbers of cerebral cortical and cerebellar neurons varies relatively little and does not correlate with brain size. This is a strong argument against neocorticalization
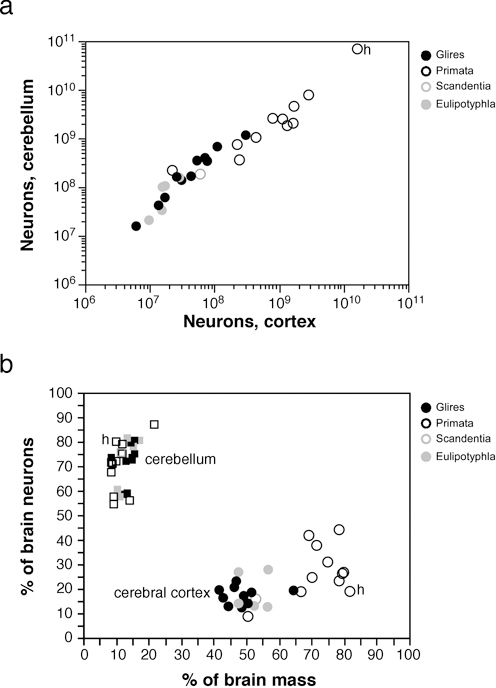
FIGURE 8.4 Coordinated scaling of the number of neurons in the cerebral cortex and cerebellum of mammals. (A) The number of neurons in the cerebellum covaries with the number of neurons in the cerebral cortex across all species in a way that can be described as a linear function of slope 4.2 (p < 0.0001, r2 = 0.995). (B) Increased relative cortical mass does not reflect an increased relative number of brain neurons. Each point represents the average values for one species (insectivores, filled gray symbols; rodents, filled black symbols; primates, open black symbols; scandentia, open gray symbols). Circles, relative mass and relative number of brain neurons in the cerebral cortex; squares, relative values for cerebellum. All Spearman correlation p-values > 0.2. Data from Herculano-Houzel et al. (2006, 2007, 2011), Azevedo et al. (2009), Sarko et al. (2009), and Gabi et al. (2010); h, human datapoints.
(in what concerns numbers of neurons) and in favor of the coordinated increase in numbers of neurons across the cortex and cerebellum related to the behavioral and cognitive (not only sensorimotor) functions that corticocerebellar circuits mediate as brain size increased on multiple, independent occasions in evolution. The coordinated addition of neurons to cerebral cortex and cerebellum thus argues for coordinated corticocerebellar function and a joint evolution of the processing abilities of the two structures (Whiting and Barton, 2003; Ramnani et al., 2006; Balsters et al., 2010), a view also supported by the concerted increase in size of the prefrontal cerebral cortex, prefrontal inputs to the corticopontine system, and prefrontal-projecting cerebellar lobules in primates (Ramnani et al., 2006; Balsters et al., 2010). The issue then becomes accounting for how the cerebral cortex increases in size faster than the cerebellum as both gain neurons coordinately. As examined next, this differential scaling is probably related to how connectivity through the underlying white matter scales in the two structures, one of which carries massive long-range connections across cerebral cortical areas both within and across the hemispheres that are essential for the operation of associative networks (Wen and Chklovskii, 2005), whereas the other is mostly composed of centrifugal and centripetal connections, with associative connections mostly restricted to the gray matter of the cerebellum (Bush and Allman, 2003). As a result, the cerebral subcortical white matter gains volume faster than the cerebellar white matter in larger brains (Zhang and Sejnowski, 2000; Bush and Allman, 2003), because overall neuronal size (including dendrites and axonal arborizations) increases faster in the cerebral cortex than in the cerebellum, as both gain neurons coordinately.
CEREBRAL CORTEX EXPANSION, GYRIFICATION, AND CONNECTIVITY
Even if expanding without gaining relatively more of the total number of brain neurons, the mammalian cerebral cortex does vary in size over five orders of magnitude, albeit as different functions of its number of neurons across mammalian orders (Herculano-Houzel, 2011b). Cortical expansion is commonly envisioned as occurring laterally, through the increase of the number of progenitor cells in the subventricular zone and the consequent addition of radial columns containing a constant number of neurons across species (Rakic, 1988). A number of models of cortical expansion in evolution assume such a uniform distribution of neurons across species, based on the initial findings of Rockel et al. (1980) of a constant number of ~147,000 neurons beneath 1 mm2 of cortical surface of various mammalian species. A second common assumption in evolutionary models of cortical expansion is that a constant fraction of cortical neurons sends axons into the white matter; that is, cortical connectivity
does not scale with brain size (Prothero, 1997; Zhang and Sejnowski, 2000; Wang et al., 2008), although some models predict a decrease in cortical connectivity through the white matter in larger cortices (Stevens, 1989; Ringo, 1991; Karbowski, 2001, 2003).
Contrary to the expectation of a uniform number of neurons beneath a given cortical surface across species (Rockel et al., 1980), cortical expansion in primates occurs with at least a threefold variation in these numbers across species (Herculano-Houzel et al., 2008). Moreover, cortical connectivity through the white matter (i.e., the fraction of gray matter neurons that sends or receives an axon through the white matter) indeed decreases as the cortex gains neurons (Herculano-Houzel et al., 2010). Larger primate cortices increase in size proportionally to the number, N, of neurons in the gray matter, of which a decreasing fraction (proportional to N0.841) sends axons into the white matter. Given the average axonal length in the primate white matter to increase with N0.242, and given our inference that the average axonal diameter does not change appreciably with N (Herculano-Houzel et al., 2010), we predict that the volume of the white matter should increase with N1.114, which is close to the scaling exponent obtained experimentally (Herculano-Houzel et al., 2010). The expansion of both the gray and white matter of the brains of primates thus occurs with a decreasing connectivity fraction and a largely invariant average axonal diameter in the white matter, which might also explain the increasing gyrification of larger cortices through the increasing tension of axons coursing in the white matter [reviewed in Mota and Herculano-Houzel (2012)].
A decrease in long-range connectivity, favoring local connectivity, in larger primate brains is expected from the nearly linear increase in cortical size as the brain gains neurons, given that, all things being equal (including connectivity), cortical volume should increase with its number of neurons raised to the power of 4/3. A decrease in connectivity in larger primate brains is compatible with the view that the cerebral cortex displays among its neurons the connectivity properties of a small-world network, that is, a network in which distance between nodes (neurons) is small, with mostly local connectivity and only a relatively small number of long-range connections (Watts and Strogatz, 1998). Evidence that the cortex is connected and functions as a small-world network at the neuronal level has been found recently (Grinstein and Linsker, 2005; Bassett et al., 2006), even though the cerebral cortex may be densely connected at the level of functional areas (Markov et al., 2011). There is converging evidence that the cerebral cortex also scales as a small-world network at the neuronal level, growing through the addition of nodes that are densely interconnected locally (through horizontal connections in the gray matter) but only sparsely interconnected globally, through long fibers (in the white matter), which still guarantees fast global communication (Ringo, 1991; Changizi, 2001; Sporns and Kötter, 2004; Sporns and Zwi, 2004). A
decrease in neuronal connectivity is indeed an expected feature of growing small-world networks (Argollo de Menezes et al., 2000).
HUMAN BRAIN AS A SCALED-UP PRIMATE BRAIN
Despite common remarks in the literature that the human brain contains 100 billion neurons and 10- to 50-fold more glial cells [e.g., Helmuth (2001), Kandel et al. (2004), Nishiyama et al. (2005)], no references are given to support these statements; to the best of my knowledge, they are none other than ballpark estimates (Williams and Herrup, 1988). Comparing the human brain with other mammalian brains thus required first estimating the total numbers of neuronal and nonneuronal cells that compose these brains, which we did a few years ago (Azevedo et al., 2009). Remarkably, at an average of 86 billion neurons and 85 billion nonneuronal cells (Azevedo et al., 2009), the human brain has just as many neurons as would be expected of a generic primate brain of its size and the same overall 1:1 nonneuronal/neuronal ratio as other primates (Gabi et al., 2010). Broken down into the cerebral cortex, cerebellum, and rest of the brain, the neuronal scaling rules that apply to primate brains also apply to the human brain (Azevedo et al., 2009) (Fig. 8.3A and C, arrows). Neuronal densities in the cerebral cortex and cerebellum also fit the expected values in humans as in other primate species (Fig. 8.3B), and the ratio between nonneuronal and neuronal cells in the whole human brain of 1:1 (not 10:1, as commonly reported) is similar to that of other primates (Azevedo et al., 2009). The number of neurons in the gray matter alone of the human cerebral cortex, as well as the size of the subcortical white matter and the number of nonneuronal cells that it contains, also conforms to the rules that apply to other primates analyzed (Herculano-Houzel et al., 2010). Most importantly, even though the relative expansion of the human cortex is frequently equated with brain evolution, which would have reached its crowning achievement in us (Rakic, 2009), the human brain has the ratio of cerebellar to cerebral cortical neurons predicted from other mammals, primate and nonprimate alike (Fig. 8.4A). Therefore, the observed compliance of the human brain to the same neuronal scaling rules that apply to nonhuman primates [including great apes (Herculano-Houzel and Kaas, 2011)] makes the human brain simply a scaled-up primate brain: In what regards its number of neurons, our brain cannot be considered extraordinary in the sense of being an outlier.
HUMAN ADVANTAGE
Observing that the human brain is a scaled-up primate brain in its number of neuronal and nonneuronal cells is not to say that the human
brain is not at an advantage compared with other mammals. What needs to be considered is that the human cognitive advantage over other animals may reside simply in the total number of brain neurons (Herculano-Houzel, 2009, 2011a), and this may be the consequence of humans being primates and, among these, the species with the largest brain (Herculano-Houzel, 2012). Because of the different proportionality between brain size and number of brain neurons between primates and rodents, a primate brain contains more neurons than a similarly sized rodent brain (Herculano-Houzel, 2011b). For instance, the human brain has about sevenfold more neurons than the 12 billion neurons that a hypothetical rodent brain of 1.5 kg would be expected to have, according to the neuronal scaling rules that apply to rodent brains (Herculano-Houzel et al., 2006, 2011; Herculano-Houzel, 2009). Moreover, the primate advantage in numbers of brain neurons compared with a similarly sized rodent brain becomes increasingly larger with increasing brain size. Although direct measurements of numbers of neurons are not yet available for whole elephant and whale brains, one can speculate on how those numbers might differ depending on the particular neuronal scaling rules that apply. Hypothetically, if cetacean brains scaled similar to primate brains [which is unlikely, given their steep decrease in neuronal density with increasing brain size (Tower, 1954)], a whale brain of 3.65 kg would be predicted to have a whopping 212 billion neurons. In contrast, if cetacean brains scaled similar to rodent brains [which is a more likely scenario, given the very low neuronal densities in cetacean and elephant brains (Tower, 1954)], that same brain would only hold about 21 billion neurons, which is fewer than the 28 billion and 33 billion neurons that we have predicted for the chimpanzee and gorilla brains, respectively (Herculano-Houzel, 2009; Herculano-Houzel and Kaas, 2011).
Compared with other primates, the human brain is therefore not exceptional in its number of neurons, nor should it be considered an evolutionary outlier. If absolute brain size is the best predictor of cognitive abilities in a primate (Deaner et al., 2007), and absolute brain size is proportional to number of neurons across primates (Herculano-Houzel et al., 2007; Gabi et al., 2010), our superior cognitive abilities might be accounted for simply by the total number of neurons in our brain, which, based on the similar scaling of neuronal densities in rodents, elephants, and cetaceans, we predict to be the largest of any animal on Earth (Herculano-Houzel, 2009).
SCALING OF GLIA/NEURON RATIOS AND METABOLISM
Although neurons are generally considered the most important cell type for the generation of cognition, the role of glial cells in brain physiology is more and more recognized (Barres, 2008). One parameter traditionally
considered a functionally relevant indicator of the neuron/glia relationship is the ratio between numbers of glial and neuronal cells in brain tissue (the G/N ratio). The G/N ratio used to be considered to increase uniformly with brain size, which would be uniformly accompanied by larger neurons (Haug, 1987; Marino, 2006). Instead, as could be expected from the uniform nonneuronal scaling rules but structure- and order-specific neuronal scaling rules, we found that the nonneuronal/neuronal ratio (which serves as an approximation of the maximal G/N ratio) does not increase homogeneously with increasing brain size or increasing size of brain structures, as originally thought (Fig. 8.5A). However, the G/N ratio increases in a strikingly homogeneous manner with decreasing neuronal density across brain structures in all mammalian species examined so far, which indicates that the G/N ratio does indeed accompany average neuronal size [reviewed in Herculano-Houzel (2011b)] (Fig. 8.5B). The finding that glial cells are not nearly as numerous in the human brain as once believed is therefore highly significant: it shows that the human brain, like that of every other mammal observed so far, obeys the same uniform scaling relationship between the G/N ratio and neuronal density (Herculano-Houzel, 2012). Such a universal relationship between G/N ratios and neuronal size, conserved across brain structures and species over 90 million years of evolution, suggests that this ratio reflects a functionally fundamental and evolutionarily conserved aspect of brain morphology (Herculano-Houzel, 2011b).
The increased G/N ratio with increased neuronal size is traditionally believed to reflect an increased metabolic need of larger neurons (Attwell and Laughlin, 2001). Once numbers of neurons composing different rodent and primate brains were available, it became possible to estimate how the average metabolic cost per neuron scales with brain size and neuronal density. Contrary to expectations, dividing total glucose use per minute in the cerebral cortex or whole brain (Karbowski, 2007) by the number of brain neurons revealed a remarkably constant average glucose use per neuron across the mouse, rat, squirrel, monkey, baboon, and human, with no significant relationship to neuronal density and, therefore, to average neuronal size (Herculano-Houzel, 2011c). This is in contrast to the decreasing average metabolic cost of other cell types in mammalian bodies with increasing cell size (Porter and Brand, 1995a,b; West et al., 2002), with the single possible exception of muscle fibers (Hulbert and Else, 1989). The higher levels of expression of genes related to metabolism in human brains compared with chimpanzee and monkey brains (Cáceres et al., 2003; Uddin et al., 2004) might therefore be related not to an actual increase in metabolism per cell but to the maintenance of average neuronal metabolism in the face of decreasing metabolism in other cell types in the body.
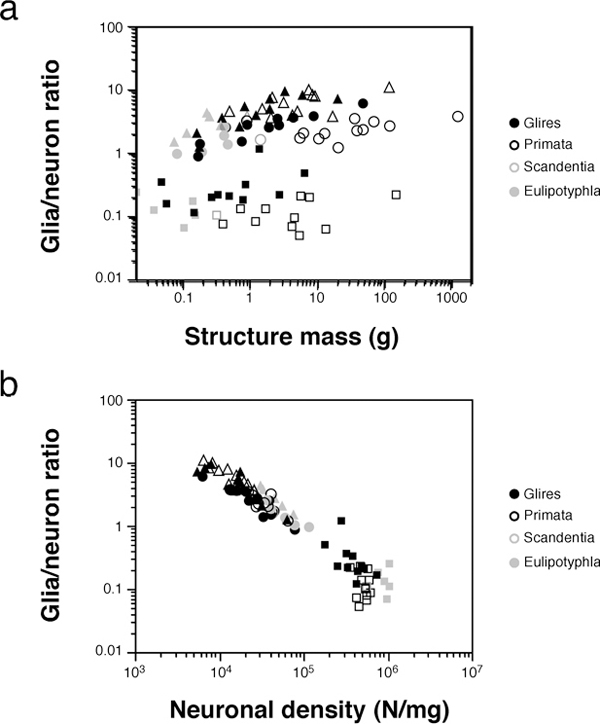
FIGURE 8.5 Glia/neuron ratio scales differently across structures and orders with structure mass, but scales homogeneously with neuronal density. Each point represents the average other cell/neuron ratio (which approximates the glia/neuron ratio) and structure mass (A) or neuronal density (B) in the cerebral cortex (circles), cerebellum (squares), or RoB (triangles) of a species (insectivores, filled gray symbols; rodents, filled black symbols; primates, open black symbols; scandentia, open gray symbols). Notice that in contrast to the scattered distribution across species and structures in (A), datapoints are aligned across species and structures in the bottom plot, suggesting that it is smaller neuronal densities (i.e., larger average neuronal cell size), not larger structure mass, that is accompanied by a larger glia/neuron ratio. Data from Herculano-Houzel et al. (2006, 2007, 2011), Azevedo et al. (2009), Sarko et al. (2009), and Gabi et al. (2010).
That the average energetic cost per neuron does not scale with average neuronal cell size has important physiological implications. First, considering the obligatory increased cost related to a larger surface area (Attwell and Laughlin, 2001), the evolution of neurons with a constant average energetic cost regardless of their total cell size implies that the relationship between larger neuronal size and a larger G/N ratio must not be related to increased metabolic needs, as usually assumed. Instead, we have proposed that this relationship ensues simply from the invasion during early development of a parenchyma composed mostly of neurons of varying sizes (in different brain structures and species) by glial cells of relatively constant size across structures and species (Herculano-Houzel, 2011c). Second, the constant average energetic cost per neuron across species implies that larger neurons must compensate for the obligatory increased metabolic cost related to repolarizing the increased surface area of the cell membrane. This compensation could be implemented by a decreased number of synapses and/or decreased rates of excitatory synaptic transmission (Karbowski, 2007). Synaptic homeostasis and elimination of excess synapses [e.g., during sleep (Gilestro et al., 2009)], the bases of synaptic plasticity, might thus be necessary consequences of a tradeoff imposed by the need to constrain neuronal energetic expenditure (Herculano-Houzel, 2011c).
Another consequence of a seemingly constant metabolic cost per neuron across species is that the total metabolic cost of rodent and primate brains, and of the human brain, is a simple, linear function of their total number of neurons (Herculano-Houzel, 2011c) (Fig. 8.6), regardless of average neuronal size, absolute brain size, or relative brain size compared with the body. At an average rate of 6 kcal/d per billion neurons (Herculano-Houzel, 2011c), the average human brain, with 86 billion neurons, costs about 516 kcal/d. That this represents an enormous 25% of the total body energetic cost is simply a result of the “economical” neuronal scaling rules that apply to primates in comparison to rodents, and probably to other mammals in general: For a similar brain size, more neurons will be found in a primate brain than in possibly any other mammalian brain (Herculano-Houzel, 2009, 2011a). It is intriguing to consider, therefore, that our remarkable cognitive abilities, at a remarkable relative energetic cost, might be mostly the result of a very large number of neurons put together in a not extraordinary fashion but, instead, according to the same evolutionary scaling rules that apply to other primates.
COST OF BEING HUMAN
Humans are not the largest living primates: Gorillas overlap with or exceed humans in body size, but their brains amount to about one-third
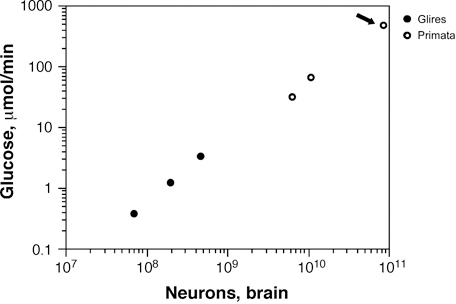
FIGURE 8.6 Total brain metabolism (measured as μmol of glucose consumed per minute) scales as a linear function of the total number of neurons in the brain across rodents and primates alike, including humans (arrow). The function plotted is a power function of exponent 0.988, not significantly different from 1.0. Data from Herculano-Houzel (2011c).
of the size of the human brain (Marino, 1998), making our comparatively larger brain size appear an oddity, given our body mass (Marino, 1998; Rilling, 2006; Gazzaniga, 2008). Why does the largest primate not also have the largest brain, if brain and body size are usually well correlated across species?
In the relationship between brain size, body size, and number of brain neurons, body mass is much freer to vary than the other two variables (Gabi et al., 2010). Across primates, the exponent that describes the brain–body scaling relationship is highly dependent on the species sampled, whereas the neuronal scaling rules that apply to primate brains are insensitive to the choice of species (Gabi et al., 2010). Moreover, body mass should not be considered as a variable determining, or contributing directly to, brain size (Herculano-Houzel, 2011a), even though it is often correlated with brain size, particularly given that body size evolution, such as body size divergence between chimpanzees and gorillas, can occur through changes in late growth that will be accompanied by little parallel change in brain size (Shea, 1983; Riska and Atchley, 1985).
The evolution of the hominin brain, and of the human brain in particular, may thus have involved two parallel but not necessarily related phenomena: an increase in brain size and number of neurons, obeying the same cellular scaling rules that apply to other primates, and a moderate increase in body size, compared with gorillas and orangutans, whose body size increased greatly compared with other primates that diverged
earlier from the common ancestor (Herculano-Houzel and Kaas, 2011). We and others (Shea, 1983; Riska and Atchley, 1985; Byrne, 1995; Deacon, 1997b; Herculano-Houzel and Kaas, 2011) have proposed that it might not be the case that humans have a brain that is too large for their body; rather, it might be that great apes evolved a body size (diverging from the brain–body relationship that applies to earlier diverging primates as well as to later diverging humans) that may not be directly related to their brain size, a trend in evolution that was not pursued in the Homo lineage.
There is, however, an additional possibility to be explored, and that is that great apes do not have larger brains to match their larger bodies because they cannot afford the metabolic cost of supporting the larger number of neurons. The great apes lineage appears to have favored marked increases in body size rather than brain size from the common ancestor with the Homo lineage, whereas the Homo lineage seems to have favored a large brain, with a large number of neurons, instead of a large body. The absence of animals in the fossil record with both a very large (human-like) brain and a very large (great ape–like) body is consistent with the possibility that it is not metabolically possible to have both.
Growing a large body comes at a cost. Although large animals require less energy per unit of body weight, they have considerably larger total metabolic requirements that, on average, scale with body mass raised to an exponent of ~3/4 (Kleiber, 1932; Schmidt-Nielsen, 1984; Martin, 1990; Bonner, 2006). Thus, large mammals need to eat more, and they cannot concentrate on rare, hard-to-find, or catch foods (Conroy, 1990). Adding neurons to the brain, however, also comes at a sizable cost, as reviewed above: 6 kcal/d per billion neurons (Herculano-Houzel, 2011c). In primates, whose brain mass scales linearly with its number of neurons, this implies that total brain metabolism scales linearly with brain volume or mass, that is, with an exponent of 1, which is much greater than the much cited 3/4 exponent of Kleiber (1932) that relates body metabolism to body mass. The discrepancy suggests that, per gram, the cost of primate brain tissue scales faster than the cost of nonneuronal bodily tissues, which calls for a modification of the “expensive tissue hypothesis” of brain evolution (Aiello and Wheeler, 1995), according to which brain size is a limiting factor. Given the steep, linear increase in brain metabolic cost with increasing numbers of neurons, we conclude that metabolic cost is a more limiting factor to brain expansion than previously suspected. In our view, it is not brain size but, instead, absolute number of neurons that imposes a metabolic constraint on brain scaling in evolution, because individuals with larger numbers of neurons must be able to sustain their proportionately larger metabolic requirements to keep their brain functional.
The larger the number of neurons, the higher is the total caloric cost of the brain, and therefore the more time required to be spent feeding
to support the brain alone, and feeding can be very time-consuming (Owen-Smith, 1988). Based on their brain mass [estimated from cranial capacity (De Sousa and Woods, 2007)], we predicted that total numbers of neurons in the brain increased from 27 billion to 35 billion neurons in Australopithecus and Paranthropus species to close to 50–60 billion neurons in Homo species from Homo rudolfensis to Homo antecessor, to 62 billion neurons in Homo erectus, and to 76–90 billion neurons in Homo heidelbergensis and Homo neanderthalensis (Herculano-Houzel and Kaas, 2011), which is within the range of variation found in modern Homo sapiens (Azevedo et al., 2009). It can thus be seen how any increase in total numbers of neurons in the evolution of hominins and great apes would have taxed survival in a limiting, if not prohibitive, way, given that it probably would have to occur in a context of already limiting feeding hours: The added 60 billion brain neurons from an orangutan-sized hominin ancestor to modern Homo require an additional 360 kcal/d, which is probably not readily available to great apes on their diet.
It has been proposed that the advent of the ability to control fire to cook foods, which increases enormously the energy yield of foods and the speed with which they are consumed (Carmody and Wrangham, 2009; Carmody et al., 2011), may have been a crucial step in allowing the near doubling of numbers of brain neurons that is estimated to have occurred between H. erectus and H. sapiens (Wrangham, 2009). The evolution of the human brain, with its high metabolic cost imposed by its large number of neurons, may thus only have been possible because of the use of fire to cook foods, enabling individuals to ingest in very little time the entire caloric requirement for the day, and thereby freeing time to use the added neurons to their competitive advantage.
CONCLUSION: REMARKABLE, YET NOT EXTRAORDINARY
Despite our ongoing efforts to understand biology under the light of evolution, we have often resorted to considering the human brain as an outlier to justify our cognitive abilities, as if evolution applied to all species except humans. Remarkably, all the characteristics that appeared to single out the human brain as extraordinary, a point off the curve, can now, in retrospect, be understood as stemming from comparisons against body size with the underlying assumptions that all brains are uniformly scaled-up or scaled-down versions of each other and that brain size (and, hence, number of neurons) is tightly coupled to body size. Our recently acquired quantitative data on the cellular composition of the human brain and its comparison to other brains, both primate and nonprimate, strongly indicate that we need to rethink the place that the human brain holds in nature and evolution, and to rewrite some basic concepts that
are taught in textbooks. The human brain has just the number of neurons and nonneuronal cells that would be expected for a primate brain of its size, with the same distribution of neurons between its cerebral cortex and cerebellum as in other species, despite the relative enlargement of the former; it costs as much energy as would be expected from its number of neurons; and it may have been a change from a raw diet to a cooked diet that afforded us its remarkable number of neurons, possibly responsible for its remarkable cognitive abilities.


