
6
Aging, Productivity, and Innovation
BACKGROUND
One of the important issues raised by the aging society is its impact on productivity, adaptation, and innovation. Improvements in productivity play a central role in the growth of long-run living standards, and an important aspect of a society is its ability to innovate and adapt to changing conditions. It is worth remembering that small changes in productivity growth will lead to large improvements in living standards over time.
There has been relatively little research on the impact of a changing age structure on overall economic productivity. There are many ways in which changes in the age distribution can affect productivity. For example, the performance of certain tasks may differ over the life cycle. There is substantial research on different ages in the psychology literature. But actual productivity is more complicated than the undertaking of simple tasks, and experience, work skills, health status, job turnover, and other more subtle factors also have a major impact on productivity. The net effect, as best as the committee can judge from the literature, is that there is likely to be little net effect of changes in the age distribution on productivity in the United States over the next two decades.
Productivity growth is commonly measured as the growth of output per unit of input, either per unit of labor input or per unit of all factors combined. Analyses of productivity growth generally separate the determinants of labor productivity growth into those generated by (1) increases in the quantity and quality of inputs combined with labor and (2) techno-
logical change, either new or improved products or improved processes of production.
The first factor—increases in productivity due to higher inputs—would include the improved education, training, and skill acquisition of labor as well as higher quality and quantity of complementary factors such as capital and resources. For example, increased levels of education of the workforce improve the quality of labor inputs and thereby increase output per hour worked. Changes in the quantity of inputs would be the first important channel through which an aging population could change productivity. As the workforce ages, it becomes more experienced, and greater experience is generally associated with higher earnings and productivity. But an aging workforce might also experience deterioration in the relevant skills if job requirements change over time or if people’s skills decline. Some believe, for example, that increased penetration of information technologies into the workplace might place older workers at a disadvantage. This chapter will review below the evidence on how these factors interact in the workplace.
The second factor in productivity growth involves ingredients other than increases of inputs. Called “technological advance,” it also includes advances in knowledge and organization and has a completely different mechanism. Over the long run, technological advance arises from several channels: the generation and diffusion of new scientific, technological, and engineering knowledge and improvements in production processes and social overhead capital. For example, the vast improvements in productivity in computation arose from a long line of technological developments, from transistors to improved communications to programmable software. Innovations in organizational structure and management practices and improved political and legal environments have also fostered significant productivity gains. While technological advance and other changes have played a key role in productivity growth, their rate and direction have varied greatly from decade to decade, and the pattern of change is not well understood.
Studies of productivity growth and technological change emphasize that progress does not typically occur through a grand leap by a single ingenious inventor. Rather, improvements in products and processes are typically the result of many small and unspectacular steps. They result from the application of basic research and engineering, from learning by doing, and from suggestions by workers on the production line.
Clearly, the processes involved in increasing productivity involve both very local forces, such as the skills of individual workers, and more global trends in new and improved technologies and processes. Moreover, economic studies indicate that the second factor—technological advance—is the major contributor to long-run growth in productivity. Depending on
the time, place, and approach, studies indicate that anywhere from half to virtually all of the growth in output per hour worked or per capita income is due to advances in knowledge, and that the balance is due to increases in capital and other inputs per unit of labor.
RESEARCH ON THE IMPACTS OF AGING
AT THE INDIVIDUAL LEVEL
There is a substantial literature on behavioral measures of productivity or proxies for it over the life cycle. Studies include psychometric ones (such as ones that measure verbal or quantitative reasoning), ratings (such as those of supervisors), productivity measures (such as in piece rates or baseball scores), and statistical studies at the company level. Useful surveys are those by Prskawetz and Lindh (2006) and Skirbekk (2004).
On the whole, the literature on individual productivity measures shows great diversity across age, individuals, and measures. As one of the pioneers in the field, Salthouse (1991) found that the relationship between age and cognition varies considerably across different cognitive tests.
Many psychometric measures show a clear relationship to age. Verhaegen and Salthouse (1997) provide a meta-analysis of cognitive studies (p. 246). They compare the performance of individuals over and under 50 years of age and conclude as follows:
[M]eta-analyses of correlations between age and different measures of cognition revealed that the age relations in this literature are somewhat stronger with measures of speed than with measures of reasoning, spatial abilities, and working and episodic memory and that primary memory has a smaller age relation than do the latter variables.
Avolio and Waldman (1994) examine a series of studies that measure work-related skills using the General Aptitude Test Battery (GATB) for more than 25,000 workers from 16 to 74 years old. They conclude that age accounted for a relatively small percentage of the variance in ability test scores once experience, education, and occupational type were controlled. Differences in performance across age groups were relatively small until at least age 65. However, unlike the earnings data reviewed below, job experience has little value in predicting the maintenance of abilities over the long run except for complex jobs.
Literature using other metrics for individual productivity also shows divergent results by age and metric. One survey concludes that supervisors’ ratings typically do not find any clear systematic relationship between age and productivity. The evidence on productivity as measured by piece rates is mixed.
An important new approach is cross-sectional employer-employee
matched data. These studies also show a mixed pattern, with many studies estimating peak productivity at around 40 years of age, while a few find peak productivity at older ages. Case studies in the United States and Germany shed more light on the age-productivity relation. Kotlikoff and Wise (1989) found that the productivity of salespeople in a large insurance company, measured by the value of contracts sold, increases with age. Boersch-Supan, Duezguen, and Weiss (2008) and Boersch-Supan and Weiss (2011) assembled a large data set on production workers in a German car manufacturing company over many years and show a similar effect. They measure productivity by the absence of errors in a well-defined production process. They find that, while the number of small errors is larger among older workers, major errors are more frequent among younger ones. Their measure of productivity finds that older workers have higher productivity.
Although the literature on productivity and behavior at the individual level provides weighty evidence on the impact of aging on many individual attributes, we need to be cautious about the application of those attributes to aggregate productivity. Many of the studies are cross-sectional and do not take into account changes in occupation or, in labor market studies, attrition.
Additionally, the determinants of individual productivity are extremely complex and are unlikely to be captured in most metrics. For example, a typical cross-sectional study of earnings can explain a small fraction of the dispersion on the basis of personal attributes such as intelligence. Moreover, while it is true in a few areas that reasonable output metrics have been developed (such as for athletes), we know that in other areas the measures have often proven highly unreliable and even systemically dangerous (such as the compensation metrics used in many financial firms).
Furthermore, the important skill sets, and the difficulties in accurately measuring them, will change over the life cycle as workers move from being unskilled workers at fast food stores in summer jobs, to entry-level technicians, to middle and upper management positions. Given the multitude of attributes and vast number of different jobs, it has proven very difficult to make an accurate measure of the economic value of an individual’s attributes and the changes in those over time due to aging.
A final reason to discount metrics on individual attributes is that work increasingly takes place in teams. Teams are often composed of individuals with different backgrounds and experiences, and it is difficult to separate the contribution of individuals. So while we might focus on the hitting scores of star baseball players, it is worth considering how well nine players would perform in the absence of (generally older) coaches, trainers, surgeons, and owners. In an economy, it is generally the bundle or teams that are productive, not the individuals.
For this reason, the committee tends to prefer market-based measures
to estimate the impact of aging on productivity, either measures based on market earnings or ones based on aggregate measures of productivity.
AGING AND THE ECONOMICS OF
INNOVATION AND INVENTION
The first important question involves the impact of changes in the age distribution of the population on a society’s innovation and invention. An important aspect of new knowledge is that it is a public good, a process in which new technologies generated anywhere can potentially spread and be used by all, young and old, rich and poor, at home and abroad. Hence the stock of useful and productive knowledge should be seen in the context of the global stock rather than that of an individual person or country. If other countries take up more of the innovational activities that were over the last century led by the United States and other current high-income countries, the overall trend in income and productivity growth might well continue to grow rapidly. So a first important point is that it is global inventive and innovative activity that over the coming decades will influence long-run U.S. productivity and income growth. Countries are not technological islands in an increasingly globalized world. As countries grow and increase their inventive activity in an increasingly networked world, the United States will benefit from the inventiveness outside its borders (Jones and Romer, 2010).
While long-run productivity growth is likely to be largely determined by global trends in frontier technologies, national characteristics are critical for diffusion and adoption of best-practice technologies and for actual levels of productivity. Studies of diffusion show that best-practice knowledge and techniques diffuse more slowly across national borders than within nations. The rate of adoption depends on many non-age-related factors, such as openness to trade and capital flows; competitiveness of domestic market structures; profitability; and regulatory structures. The major impacts of age-related factors reflect the composition of demand. For example, an aging population or one with strong demand for health services is likely not only to generate but also to adopt technologies that are in great domestic demand in this sector.
There is a substantial literature on the age distribution of producers of inventions, patents, publications, and other creative material. Historians of science have generally concluded that scientific output tends to rise steeply in the twenties and thirties, peak in the late thirties or early forties, and then trail off slowly through later years. There is some variation among disciplines, but most studies find that peak scientific productivity tends to be in the interval between ages 30 and 40 (Lehman, 1953; Simonton, 1988 and 1991).
Benjamin Jones (2010) has investigated the question of age and “great
achievement” in a statistical framework using data covering more than a century. His sample is of Nobel prize winners in physics, chemistry, medicine, and economics (N = 544) and great technological inventors (N = 286). Figure 6-1 shows the age distribution for each group from his sample. In each case, the average age was 39.1 There is considerable dispersion in the distribution.
Another important finding of Jones’s study is that the average age at which invention occurred increased over the twentieth century. For recipients of Nobel prizes in physics, chemistry, and medicine, the increase in the median age has been around 2 years per century, while the increase in the mean has been 8 years. The increase has resulted from an increase in the starting age (the age at which the youngest inventors did their prize-winning work) as well as the ending age (the age at which oldest inventors did their prize-winning work). In part, the increase in the ending age is due to the longer life span over which invention occurs that comes from longer life expectancy.
From a policy perspective, one of the most important findings is a delay in the start of the creative period. Jones finds a significant delay in the onset of scientific creativity. He points to two potential factors in the delay: the increased complexity of acquiring knowledge because of the greater depth of accumulated knowledge and the longer time to a final degree (see also National Research Council, 1990 and 1998).
There is genuine concern on the part of the scientific establishment in universities as well as federal scientific agencies that the longer time for young researchers to enter their careers as productive scientists is due to institutional impediments.
Patents and Other Areas
Another measure of innovative output, and one that is generally closer to economic activity, is patents. Patents have been the subject of study as indicators of inventive output for many years (see the overview in Griliches, 1990). They have the advantage of passing some threshold of importance and nonobviousness. Their shortcoming is that they have highly variable importance and commercial value. Jones (2009) examined the characteristics of patent awardees over the twentieth century and found increases in three important measures: (1) the age at which an inventor makes the first invention; (2) a measure of specialization in patents; and (3) the size of teams. He concludes that the nature of the scientific and inventive process is becoming more complicated as more knowledge is accumulated. Additionally, the age at which applied knowledge was crystallized in the form
_____________
1Age refers to the age at which a discovery was made, as best as could be determined.
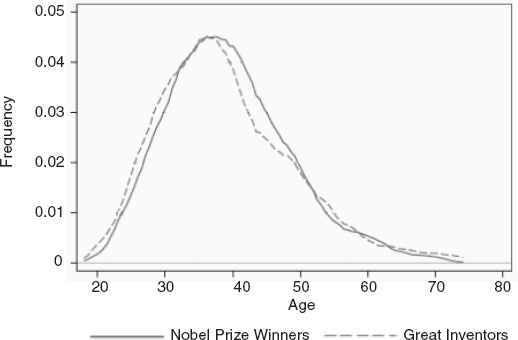
FIGURE 6-1 Age distribution of great inventors and Nobel prize winners. SOURCE: Jones (2010). Reprinted by permission.
of patents tends to be about a decade later than transformational science or great inventions.
Other studies have examined the age of artistic creation, such as for works of fine art (Galenson 2004a and 2004b). There appears to be greater dispersion in the ages of creative works than of scientific achievements. Galenson also distinguishes between conceptual innovations (done at an early age) and experimental creativity (often performed at a later age). But the basic idea about the distinctive role of the early years (from 25 to 45 years of age) emerges from these other studies as well.
Determinants Other Than Age
While age is an important determinant of invention and innovation, it explains very little about actual performance across societies. Other factors, such as education, support institutions, economic and social rewards, and religious institutions, tend to dominate the actual distribution of scientific output.
This can be illustrated by examining the distribution of Nobel prize awards in chemistry and physics over the last century. If we assume that the distribution of awards should be proportional to that of raw talent, and that raw talent should be equally distributed around the world, then we would expect that the number of prize winners should be distributed proportionally to the population (or young population) of different countries.
In reality, the proportion of prize winners born in Africa or India is lower by a factor of more than 100 than that of those born in Western Europe and North America. Moreover, the least developed countries, with 10 percent of the world’s population, have not produced a single prize winner in physics or chemistry during the entire history of those prizes.
Put differently, over two-thirds of Nobel prize—winning research done since 1960 has occurred in the United States, even though the United States averaged only 5 percent of the world’s population. The fact that 30 percent of U.S.-based Nobel prize winners were foreign born indicates the importance of the research environment for successful invention.
Looking forward, the key to continuing strong advances in knowledge for the United States and other countries is to increase investments in young scientists and other creative talent. The importance of the support environment is an emphatic reminder of the key role of educational and other social institutions in nurturing innovation. The United States has performed relatively poorly in recent years in K-12 education compared to other countries, according to the Organisation for Economic Co-Operation and Development (OECD) Programme for International Student Assessment. Also, most urban school districts in the United States see high school graduation rates of only 50 percent. These indicators are a reminder of the vast potential supply of scientific and innovational talents that remains untapped in the United States and the rest of the world, and of the important determinants of technological advance other than age.
PRODUCTIVITY AND THE AGE STRUCTURE
OF THE POPULATION
The second important factor in the productivity of the population involves the interaction of the quality of the workforce and the distribution of the population with a given technology. As noted above, this influence would include the impact of improved education, training, skill acquisition of labor as well as higher quality and quantity of complementary factors such as capital and resources. In its discussion, the committee focuses on the impact of a workforce whose composition is changing; the reason for this focus is that the impact of the age distribution on complementary factors such as capital and resources appears to be less significant.
The basic idea is that workers have different productivities as a result of evolving skills, experience, formal and informal education, training, and personal attributes over their life cycles. In the human capital model, productivity is a function of the amount of accumulated human capital. Human capital will vary over the life span. Generally, we expect productivity to be relatively low for unskilled and inexperienced workers; to rise with education and experience and as workers find a good match between
their skills and the opportunities in the workplace; and eventually to decline either as (or if) their skills decline or their specific human capital and experience depreciate.
A central issue in this context is the age distribution of productivity for the workforce. Changes in aggregate productivity arise from the interaction of the age distribution of productivity and the changing age distribution of the labor force. This can be called the “age composition effect.” A plot of this effect would be analogous to the productivity curve shown in Figure 6-1, although it would look quite different. There are two alternative approaches to estimating the age composition effect. The first examines the age distribution of earnings and assumes that earnings are proportional to productivity. The second looks directly at the impact of the age distribution on aggregate productivity.
Earnings and the Changing Distribution of the Workforce
There is a vast literature on the distribution of earnings by different attributes, including age, experience, and education. A recent survey of this approach summarized the results as follows:
Perhaps the most widely estimated regression equation in economics is Mincer’s log-earnings function that relates the log of individual earnings or wages to observed measures of schooling and potential work experience. The regression has been estimated in numerous studies, employing various data sets from almost every historical period and country for which micro data are available, with remarkably robust regularities. First, workers’ wage profiles are well ranked by education level; at any experience level, workers earn more, on average, as their schooling increases. Second, average wages grow at a decreasing rate until late in one’s working lifetime. (Rubinstein and Weiss, 2006, p. 3)
In the simplest approach, with perfectly competitive markets, a worker’s hourly earnings are equal to the value of the marginal product of an hour worked. This relationship would hold even if the worker is investing in general (non-firm-specific) human capital. Labor economists have reservations about this theory. The link between current earnings and current marginal productivity may be decoupled if there are long-term relations or contracts between the worker and the company. In some areas, for example, compensation is back-loaded to provide incentives for workers to stay with companies. Additionally, most earnings estimates exclude fringe benefits such as health care, which are an increasingly important fraction of total compensation. While labor economists generally believe that fringe benefits are a dollar-for-dollar substitute for wages, this may hold for the company and is unlikely to hold for individual workers in large companies, so ex-
amination of earnings without fringe benefits is an appropriate approach. While the earnings-marginal productivity theory has many shortcomings, it does provide a useful benchmark for purposes of estimating the impact of a changing age structure.
The examples provided here take the simplest case in which earnings are assumed to be proportional to marginal productivities.2 This specification initially assumes no impact of changes in the distribution of the labor force on relative earnings or productivity, and this assumption will be relaxed below.
The standard earnings-age-experience model assumes that earnings are a quadratic function of age or experience. A careful review of the data indicates that this introduces inaccurate estimates in the tails of the distribution. It underestimates the growth of earnings in the early years and overestimates the decline in the later years. Since these are exactly the years that are important for present purposes, estimation of distributional effects is accordingly uncertain.
For the present purpose, the committee took estimates of the age-earnings profile for college graduates and high school graduates. The estimates are drawn from a study by Lemieux (2006) based on earlier work of Murphy and Welch (1990) and are very similar to those made by Rubinstein and Weiss (2006). The Lemieux estimates rely on 1999–2001 Current Population Survey data on hourly earnings with a dummy for education and for year. Estimates of the earnings-experience curve are shown in Figure 6-2. The shaded line is the unconstrained curve, while the other two show the results using quadratic and quartic functions of experience.
To generate estimates of the impact of a changing age distribution on productivity, the committee used the 1999–2001 age-experience curve as its age-productivity relationship in conjunction with the committee’s estimates and projections of the distribution of the labor force by age (see Appendix A) for three different years, 2010, 2020, and 2030, and applied the estimates for males to all workers. This yields three different experience curves: the quadratic fits the standard quadratic function to the actual data; the quartic fit is the result of Lemieux’s equation; and the actual is the unconstrained age-experience curve. These results are shown in Table 6-1 separately for college and high school graduates.
_____________
2The procedure for estimating the age composition effect assumes that the workforce has a distribution given by {ϑ1,t,…, ϑn,t}, where ϑi,t is the share of the labor force, employment, or population in age group i and time period t. We assume that productivity is a separable function of the share of workers in each age group and of other factors. Then we can write the aggregate production function as
![]()
where Lt is total labor inputs in year t, Ht is an index of aggregate labor input, Kt is capital and other inputs, wi,t is average earnings of group i, and At is an index of technology.
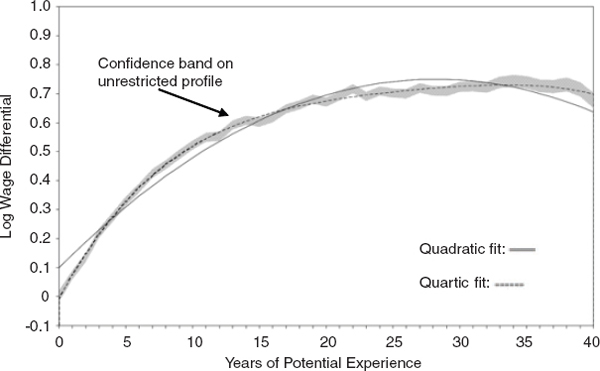
FIGURE 6-2 Distribution of earnings, by age. This figure shows the unrestricted (shaded band) as well as quadratic and quartic fit to the ln wage data for males using data from the 1999–2001 Current Population Survey. The series are estimated with a full set of education, experience, and year dummies. SOURCE: Lemieux (2006). Reprinted by permission.
Note that the earnings functions usually do not go beyond 40 years of experience (taken to be 62 years of age for college graduates and 58 years for high school graduates). Therefore, this analysis takes the distribution only through 40 years of experience, which covers between 87 and 91 percent of the distribution depending upon the year. There is some truncation bias, but this appears to make little difference to the estimates.3
Table 6-1 shows the calculated impact of the changing age distribution on the rate of growth of productivity over the 2010–2020 and 2020–2030 periods. The estimates suggest that the age composition effect is likely to be very small for all specifications and both periods. The largest positive number is 0.024 percentage points per year and the largest negative estimate is −0.013 percentage points per year. For reference purposes, multifactor productivity growth over the 1987–2010 period has averaged 1.1 percent per year according to the Bureau of Labor Statistics (2011a).
_____________
3The sensitivity of these estimates can be determined by extrapolating the experience curve through labor force projections to age 90. The impact is around −0.008 percentage point using specifications for college graduates. Another adjustment would be to take into account unemployment rates by age, but the committee did not undertake this estimate.
TABLE 6-1 Projected Impact of Changing Age Distribution on Productivity for Two Education Groups, 2010–2020 and 2020–2030
| Impact of Changing Age Distribution on Productivity (percentage points per year) | ||
| Education Group | 2010–2020 | 2020–2030 |
| High school | ||
| Quartic fit | 0.020 | 0.005 |
| Actual | 0.023 | 0.004 |
| Quadratic specification | −0.013 | 0.006 |
| College | ||
| Quartic fit | 0.006 | 0.011 |
| Actual | −0.003 | 0.009 |
| Quadratic specification | −0.010 | 0.024 |
Research indicates that changes in the age distribution of workers may impact relative wages. Card and Lemieux (2001) estimate that a 1 percent increase in the share of workers in a cohort relative to other workers will lower their earnings by approximately 0.2 percent for a given education and cohort, while Carneiro and Lee (2011) estimate an impact that is approximately one-half of that. The committee examined the impact of allowing imperfect substitutability on the age-productivity relationship. Dividing the workforce into six subgroups, it estimates that assuming perfect substitution among different age groups raises calculated productivity growth by 0.01 to 0.02 percentage points per year over the 2010–2030 period, depending upon which of the two estimates is used. In the context of all the factors at work, the substitution impact is very small.
The committee concludes that, taking earnings as a proxy for productivity, the impact of the changing age distribution on the level of productivity is negligible. The intuition behind these results can be explained using the quadratic specification of the earnings function for college graduates. According to the committee’s projections, the average age of the labor force in the age range examined here is expected to increase by 2.0 years from 2010 to 2030. It estimates the slope of the log experience curve at the average experience for this period for college graduates is 1.2 percent per year of experience. Over the 20-year period, this averages 1.2 × (2.0)/20 = 0.12 percentage points per year. The estimates in Table 6-1 are slightly lower than this estimate because of asymmetries in the age distribution, but from an economic point of view the estimates are virtually identical. The impact of the changing age distribution on productivity is small fundamentally because the slope of the earnings curve at the current average age of the labor force is close to zero. In other words, if the average age of the workforce were to increase by a single year (and ignoring for simplicity
the dispersion of worker ages), the impact of estimated productivity would be essentially nil.
Productivity and the Changing Distribution of the Workforce
In contrast to the vast enterprise engaged in estimating earnings-experience functions, there is very little research on the question of the impact of changes in the age distribution on overall productivity. An early study by Cutler et al. (1990) looked at the impact of changes in the growth rate of the labor force on labor productivity using a panel of countries over the period 1960–1985 and subperiods. After conducting a battery of tests, they conclude, “Because the annual labor force growth rate is predicted to fall by about 1 percentage point between 1990 and 2050, with most of the change occurring between 1990 and 2010, our estimates imply an increase of about 0.6 percentage point in annual productivity growth” (p. 43). When they correct for the average age of the labor force (similar to below), they find a slightly smaller impact. Their net results are that slower labor force growth accompanied by a higher average age leads to higher labor productivity.
More recent work by Feyrer (2007 and 2008) uses more detailed demographic data. His approach takes measures of productivity growth in major countries and combines them with estimates of the shares of the labor force in different age groups, using output data from the Penn World Table 6.0 and worker data from the International Labor Organization for decadal observations, the latter interpolated for 5-year intervals using population data from the United Nations. The total sample is 87 countries, while a more appropriate sample of countries for our purpose is limited to 21 OECD countries.
The Feyrer work shows an implausible pattern of coefficients when all six age groups are included. The ordinary least squares estimates for the OECD countries indicate that there is a logarithmic productivity bonus for workers in the 40–49 age group of 2.3 (a factor of 10) relative to workers aged 30–39 and of 2.0 (a factor of 8) relative to workers 50–59. These estimates likely reflect sampling error that arises from an excessive number of estimated parameters (i.e., equations that include all share variables). The committee therefore reestimated the productivity equations using linear, quadratic, and cubic functions of the average age.4 This reestimation
_____________
4This analysis examines OECD countries only (total observations N = 126) because the other countries not only have poorer quality data but also seem less relevant to understanding productivity patterns in an aging society. If the equations for all countries are used, the estimated impact on productivity growth is a larger positive number than that shown in Table 6-2.
produced reasonable estimates, with a hump-shaped function of age that reaches a maximum at approximately 40 years.
For the sample of OECD countries, the United States lies pretty much in the mean of the sample of average ages. For the latest year (2000), the mean age of the U.S. workforce in the Feyrer data set is 40.1, while the range for OECD countries is 37.7 to 45.0 years. The average age of the workforce is estimated to increase from 41.1 years in 2010 to 43.2 years in 2030, so the mean value is within the range of estimates in the data used to estimate the productivity function.
Table 6-2 shows calculations analogous to those shown in Table 6-1 for the aggregate productivity equations. These equations estimate the impact of polynomial functions of the change in mean age on the change in the logarithm of total factor productivity using the Feyrer data set. For all three specifications, the committee has taken the mean age of the labor force from its estimated and projected age distributions for the years 2010, 2020, and 2030. If the equations are nested, the cubic term is statistically insignificant when the linear and quadratic terms are included (p = 0.46). The quadratic term is statistically significant when the linear term is included (p = 0.034). On a statistical basis, therefore, the committee prefers the quadratic specification in Table 6-2.
In the preferred equation, the change in the age distribution subtracts approximately 0.1 percent per year from aggregate productivity over the next two decades. However, this finding is sensitive to alternative specifications.
Conclusion on Productivity
The impact of changes in the composition of the labor force on productivity shows consistent results in all the committee’s tests. Even though the numbers vary slightly depending on the technique, estimation period, and group, the estimates all indicate that the age composition effect on
TABLE 6-2 Projected Impact of Changing Age Distribution on Productivity Using Three Aggregate Productivity Estimates, 2010–2020 and 2020–2030
| Impact of Changing Age Distribution on Productivity (% change per year) | ||
| Productivity Estimates | 2010–2020 | 2020–2030 |
| Linear | 0.60 | 0.25 |
| Quadratic | −0.06 | −0.14 |
| Cubic | 0.09 | 0.04 |
productivity for the U.S. labor force over the next two decades is very small. The only exception is the linear productivity equation in Table 6-2, but this estimate should be discounted both because it is inconsistent with the earnings approach and because the quadratic approach has superior statistical qualities.
Therefore, the bottom line is that the committee’s estimates indicate that there is likely to be a negligible effect of the age composition of the labor force on aggregate productivity over the next two decades. The summary judgment is that the age composition effect is between −0.1 and +0.1 percentage point per year.
However, these estimates are subject to some remaining uncertainty. For the earnings estimates, the uncertainties arise because of the concern that earnings do not reflect marginal productivities. If that relationship were clearly established, then the estimates in Table 6-1 indicate that the impact of the changing age distribution is close to zero. From a conceptual point of view, the productivity approach is superior because it would capture the substitution and complementarities among different groups as well as any externalities (at least in the sample period). However, at present, the empirical results are quite fragile and subject to specification concerns, so the results shown in Table 6-2 must be taken as very tentative.
IMPLICATIONS
The committee has considered the implications of its review of the relationship between the aging of the workforce and productivity and innovation. There are multiple pathways from a changing age distribution to the growth of productivity and income and their eventual magnitude. The most important in the long run is the rate of total factor productivity. The United States has been a major contributor to technological change, so it is important to ensure that policies are well-designed for innovation in an aging society.
One of the major policy levers on productivity and innovation is immigration. This is particularly important for scientists and innovators, where the United States has proven to be fertile soil for nurturing inventive talent, as was seen in the preceding discussion of the greatest scientists. Immigration has been a major source of scientific and innovative gains in this country over the last century. Immigration, and particularly the skill characteristics of immigration, is perhaps the most important way to affect innovativeness. Immigration policies must therefore be very sensitive to the potential for retarding the flow of the best talent to the United States.
Another factor that can play a particularly important role is the pattern of support for young scientists and engineers. This is an area where small changes in public policy and funding might have a large effect on creative
outputs. While there has been attention paid to the lengthening time to the doctorate and the increased age at which scientists win their first grants, it appears that this is a particularly critical question for creative life spans. Earlier NRC studies discussed issues in this area, and the present committee would note two measures that are particularly important. First, it is important to ensure that young researchers have access to federal grants. This will be especially critical in an environment in which the federal budget is constrained and federal funds for science and engineering are likely to be under severe pressure. Additionally, it is important to ensure that the time to degree for young researchers be kept at the minimum so that they can progress to productive and independent scientific careers. This emphasizes the need for strong support for doctoral and postdoctoral scientists and engineers as well as measures that shorten the time during which young people are dependent on older researchers for support.
An important area for innovational structure is retirement policy. Fiscal concerns suggest that the country should support measures that encourage people to work longer. This is particularly true of incentives to retire early that have been discussed in Chapter 5 and elsewhere in this report. However, the committee would issue cautions about the potential squeeze on young scientists in a period in which universities and other institutions of innovation are under pressure. There has been aging in our innovational institutions over recent years, and this is of concern for a sector where the most innovative work is done early in the life cycle, as seen above. Attention to the needs of young scientists will help advance the early stages of scientific careers. Innovational institutions should pay increased attention to the need to ensure that there is ample room for young scientists and scholars in their ranks.
Finally, some federal spending and tax structures are more likely to promote innovation than others. Programs to support education, science programs, and scholarships for college and postgraduate students are better at creating an innovative society than many existing federal programs. It is important that fiscal decisions in a constrained budget environment be mindful of the impact of policies on innovation and adaptiveness.


