
9
The Outlook for Fiscal Policy
INTRODUCTION
Population aging will generate significant changes for the macroeconomy. As discussed in Chapter 2, barring significant changes in productivity growth, responding to population aging will require some combination of slower consumption growth and greater labor force participation, relative to an economy in which the age structure of the population is unchanged. Because the public sector finances a large share of the consumption of the elderly, population aging presents a particularly difficult challenge for government. Increases in life expectancy increase the number of beneficiaries of government programs, while declines in fertility lower the relative number of taxpayers upon whom these programs depend for financial support. Thus, as in the economy in general, population aging requires changes to government programs that ultimately involve some combination of lower consumption (which can be achieved through lower benefits or higher taxes) and higher labor force participation in order to remain financially viable. Furthermore, as explained in Chapter 3, the aging of the population is not a temporary phenomenon associated with the retirement of the baby boom generation. Rather, current projections suggest that the share of the population that is elderly is likely to remain elevated and even to increase over the foreseeable future. Thus, population aging is a phenomenon that needs to be addressed with changes to government programs.
The changing demographics affect both federal and state budgets. At the federal level, population aging raises expenditures on Social Security, Medicare, and Medicaid, while the projected slowdown in the growth rate
of the labor force lowers payroll tax revenues and lowers gross domestic product (GDP) growth, making it more difficult to service existing debt. States finance part of Medicaid as well, so they, too, face financial pressure from demographic change. In addition, many states have promised pension and health benefits to their retirees, and these commitments will also put pressure on budgets as the population ages.
From an academic perspective, it would be interesting to distinguish the effects of demographic change from other factors affecting the fiscal outlook. However, in order to do so, it would be necessary to construct a counterfactual baseline (alternative scenario) of what the history and future of spending and tax revenues would have been in a world with no demographic change. Such a counterfactual is very difficult to create, because it is difficult to know how policies might have been different under alternative demographic patterns. To cite just a couple of examples: One would have to know how Medicare policies concerning payments to hospitals and physicians might have evolved differently in the absence of the looming fiscal challenges associated with an aging population or whether Medicaid benefits might have been more limited had states had to finance the education of the much larger cohort of children who would have been born had fertility not declined.
To the extent that the policies currently in place already reflect the actual or anticipated effects of demographic change, an examination of the current fiscal outlook may understate the impact of such change. For example, the 1983 Social Security Commission raised payroll taxes and increased the Social Security full retirement age. These measures reduced the imbalances in Social Security by, in essence, lowering consumption by workers through higher payroll taxes and a reduction in expected benefits. Thus, the current imbalances in the Social Security system provide a measure of how much further policy needs to adjust, but not of the entire effect of demographic change on consumption and/or labor force participation.1
On the other hand, for many parts of the budget, the projected imbalances between revenues and expenditures are only partially explained by demographic change. In particular, excess cost growth in health care and past tax and spending policies that contributed to today’s outsized deficits
_____________
1Some observers believe that the buildup of surpluses in the Social Security trust fund was used to offset deficits in the on-budget accounts—that is, that taxes would have been higher or spending lower had those surpluses not been amassed. In that case, it is still true that the combined effects of the earlier tax increases and benefit cuts provide a good metric, when combined with the adjustments that still need to made, of the effects of aging on Social Security. However, if on-budget deficits are higher than they would have been in the absence of the tax increase, it means that, as a society, we have yet to make any of the adjustments required in the face of aging—some of the adjustments need to be made to shore up the Social Security trust fund, and other adjustments need to be made to pay off the extra debt that was amassed.
both contribute importantly to the difficult fiscal adjustments that will be necessary in years ahead.
Accordingly, it is difficult to isolate the effects of ongoing demographic change on the fiscal outlook. Furthermore, from a practical perspective, the ease with which our nation can adapt to the challenges of aging is greatly affected by the other factors shaping fiscal policy choices. For example, aging becomes a much more difficult problem in the face of rapidly rising health spending, and raising taxes to finance Social Security benefits becomes more difficult and has greater efficiency costs if taxes are already being raised to finance federal government debt or to pay for the pension and health benefits of state and local workers. Thus, in this chapter, the committee provides an overview of the financial imbalances projected for Social Security and Medicare, but it also focuses more broadly on the overall fiscal conditions of federal and state and local governments rather than solely on the challenges presented by aging.
FEDERAL GOVERNMENT
Social Security and Medicare are the two largest federal programs that support the elderly. In addition, Medicaid, a joint federal-state program that provides health care to those of modest means, is an important source of financing for the long-term care needs of the elderly. These three programs currently account for over 40 percent of all federal spending and almost 10 percent of our nation’s gross domestic product. In addition, the federal government’s publicly held debt now stands at roughly $10 trillion, or about 62 percent of GDP, and current projections suggest that, under reasonable (though still quite uncertain) policy assumptions, it will rise to 80 percent of GDP over the coming decade (Auerbach and Gale, 2012). The projected slowdown in the rate of labor force growth, by lowering the growth rate of the tax base, also makes that debt more difficult to service.
Social Security
The Social Security program assesses payroll taxes on workers and uses those revenues to provide cash benefits to retired workers and their dependents.2 Thus, Social Security revenues depend on the size and productivity of the labor force, whereas Social Security outlays depend on the size of the elderly population. Both increases in life expectancy (which increase the size of the elderly population) and reductions in fertility (which eventually
_____________
2While payroll taxes provide most of Social Security’s revenues, small amounts are also collected from the personal income taxes paid on Social Security benefits by upper-income taxpayers and from interest earned on trust fund reserves.
reduce the size of the labor force) contribute to imbalances in the Social Security program.
Figure 9-1 presents 2011 estimates from the Social Security Administration on the future of the program. Under the intermediate estimates, the retirement of the baby boom generation raises costs by about 25 percent, from almost 5 percent of GDP in 2010 to about 6 percent of GDP by 2030, while program revenues rise a little, on net, over this period.3
The traditional method used by the Social Security actuaries to portray the uncertainty in their analyses is to provide three alternative sets of assumptions: (1) the intermediate, baseline assumption; (2) a low-cost assumption, which assumes that life expectancy and unemployment are lower and fertility and productivity are higher than in the baseline case; and (3) a high-cost assumption, which makes the opposite assumptions. The actual outcome for future costs is very unlikely to be as extreme as either of the last two outcomes. According to the Social Security Trustees, these high-and low-cost projections correspond very closely to a 95 percent probability interval, meaning that there is only a 5 percent chance that the actual experience will be more extreme than represented by these two projections. Yet, even under these assumptions, the range of uncertainty is not that large over the next 20 years. For example, under the low-cost scenario, by 2030, Social Security expenditures will have increased only a little, to about 5.5 percent of GDP, while under the high-cost scenario, expenditures are closer to 7 percent of GDP. Revenues are fairly stable over this time period for both these scenarios.
Medicare
The Medicare program provides health insurance to Americans aged 65 and over, as well as to certain disabled Americans younger than 65. The Medicare program shares some features with Social Security. In particular, it finances a large share of elderly consumption, its benefits accrue predominantly to the elderly, and much of the financing comes from taxes on current workers.4 However, the effect of aging on Medicare expenditures and revenues is more complicated than its effect on Social Security. Because Medicare provides health services rather than cash, the expenditures depend
_____________
3This chapter utilizes projections of spending from the Social Security and Medicare Trustees and from the Congressional Budget Office. These projections are based on different demographic assumptions than those presented in Chapter 3.
4According to the Congressional Budget Office (2011), in 2010 about 35 percent of Medicare spending was financed by the payroll tax, about 12 percent by beneficiaries’ premiums, almost 40 percent through general revenues, and the remainder through various other sources, including income taxes on high-earning Social Security beneficiaries.
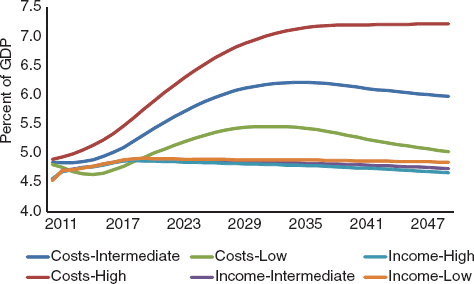
FIGURE 9-1 Projected costs and revenues for the Social Security Old-Age, Survivors, and Disability Insurance (OASDI) program, 2011–2050. SOURCE: Board of Trustees, Federal Old-Age and Survivors Insurance and Federal Disability Insurance Trust Funds (2011).
not only on how many people are eligible for the program, but also on their health needs and the costs of treatments.
One important question is the relationship between increased life expectancy and Medicare spending. Holding all else constant, an increase in longevity raises Medicare spending because it increases the size of the elderly population, and that increase is concentrated among the oldest old (those aged 85 and over), who generally have the greatest need for health services.5 However, to the extent increased life expectancy is associated with better health at a given age, then Medicare expenditures need not rise as much. Indeed, several researchers have found that time until death is a better predictor of health expenditures than is age, and that taking this into account can lead to a substantial reduction in projected health expenditures (Shang and Goldman, 2007; Seshamani and Gray, 2004; Stearns and Norton, 2004; Lee and Miller, 2002; Cutler and Sheiner, 2001). However, much of this research uses data from the period when disability levels were still declining, and it remains an open question how the recent stabilization in old-age disability, discussed in Chapter 4, will affect future health expenditures.
A far more important source of uncertainty concerns the expected rate
_____________
5Increased life expectancy raises the share of the population that is 85 years and older, but the large flow of baby boomers entering into retirement raises the share of the young elderly. The average age of Medicare beneficiaries is projected to decline into the 2030s; after that, the average age of the elderly population increases gradually over time with increased life expectancy.
of growth of health spending holding health status constant. For more than four decades, health spending growth has exceeded GDP growth. As shown in Table 9-1, excess cost growth—defined as the difference between age-adjusted per capita health spending growth and per capita GDP growth—averaged 2 percent from 1975 to 2007 and 1.5 percent from 1990 to 2007. As a result, the share of health spending in GDP increased from 8 percent in 1975 to 16 percent in 2007.6
Most analysts believe that this rapid rise in spending in large part reflects the increasing value that our society has been placing on health care as we become richer, which has fueled the demand for new medical technologies and services (Smith, Newhouse, and Freeland, 2009). But health spending cannot continue to rise in excess of GDP forever, and it is likely that the growth in demand for health services will slow over time as expenditures on health increasingly crowd out spending on other goods and services.7 However, there is little basis to predict by what means and at what rate that slowdown will occur. Many researchers believe that there is a considerable amount of inefficiency in our health system, and so part of the slowdown in spending could come from efficiency improvements. In addition, greater financial pressures on providers will likely lead to a slowdown in the rate of adoption of new technologies. The Congressional Budget Office (CBO) and the Centers for Medicare and Medicaid Services (CMS) both assume that excess cost growth in health spending will decline over time, although their assumptions about the rate of decline differ, particularly for Medicare.8
In the past, Medicare beneficiaries have received the same type of care from the same providers as those having other forms of insurance, and Medicare and other health spending have increased at similar rates (Table 9-1). However, the health reform measures enacted in 2010 (the Patient Protection and Affordable Care Act, as amended by the Health Care and Education Reconciliation Act of 2010, collectively known as the Affordable Care Act, or ACA) included provisions to lower the annual updates to provider payment rates and to cap annual Medicare growth. According to the 2011 Trustees’ projections, with these payment changes, average excess cost growth for Medicare spending under the ACA will be close to zero over
_____________
6The share increased to 18 percent in 2009, but this sharp increase reflects the effects of the severe economic downturn, which lowered GDP more than it lowered health spending.
7When health spending is a small share of the budget, it can increase rapidly without having a large effect on other spending. As health spending becomes a larger and larger share of the budget, rapid rates of growth increasingly require large adjustments in the growth rate of other spending.
8In particular, the CBO assumes that, under a current law framework, the Medicare program will have less flexibility than states and private insurers to take measures to slow the rate of health spending, and thus that Medicare excess cost growth will not slow as much as that of private health spending.
TABLE 9-1 Excess Cost Growth (%) in Health Spending During Four Time Periods
| National Health Spending | Medicare | Medicaid | All Other | |
| 1975 to 2007 | 2.0 | 2.4 | 2.0 | 1.9 |
| 1980 to 2007 | 2.0 | 2.2 | 1.7 | 2.0 |
| 1985 to 2007 | 1.7 | 1.4 | 1.3 | 1.9 |
| 1990 to 2007 | 1.5 | 1.6 | 1.1 | 1.5 |
SOURCE: Congressional Budget Office (2011).
the long-run projection period; that is, most of the increase in Medicare spending in the Trustees baseline projection is the result of demographic change rather than health care cost growth.9
There is a great deal of uncertainty about whether these lower payment updates will allow Medicare beneficiaries to continue to be provided health care at a level roughly comparable to that received by the nonelderly and, if not, whether such a system would continue to be viewed as desirable (see Boards of Trustees, Federal Hospital Insurance and Federal Supplementary Medical Insurance Trust Funds, 2011, also referred to as the Medicare Trustees Report). For these reasons, both the CBO and CMS present alternative Medicare projections in which Medicare payments to providers are higher than those allowed under current law. The CBO assumes that the ACA cuts turn off in either 2020 (CBO baseline) or 2030 (CBO alternative), whereas the Medicare Trustees projections assume that the ACA cuts either last indefinitely (Trustees Current Law) or are phased out beginning in 2020 (Trustees Alternative). In addition, it is widely believed that Medicare’s payment system for physicians, the Sustainable Growth Rate (SGR) system, will eventually be amended, as the administration and Congress have repeatedly stepped in to postpone the cuts to physician payments required under this system.10 Both the CBO and the Trustees alternatives assume physician payments will be higher than those allowed by the SGR.
The impact of these varying assumptions, along with an estimate of how Medicare spending would rise under the assumption of no decline in excess cost growth, are depicted in Figure 9-2. Under the 2011 Trustees current-law projection, Medicare expenditure rises from 3.7 percent of
_____________
9The Trustees boosted their assumption about excess cost growth in their most recent report (Board of Trustees, Federal Old-Age and Survivors Insurance and Federal Disability Insurance Trust Funds, 2012), but aging is still the predominant factor contributing to the rise in the share of GDP allocated to Medicare over the long run.
10The SGR has annual caps on Medicare spending on physician and other services; when these caps are exceeded, the prices paid per service are lowered.
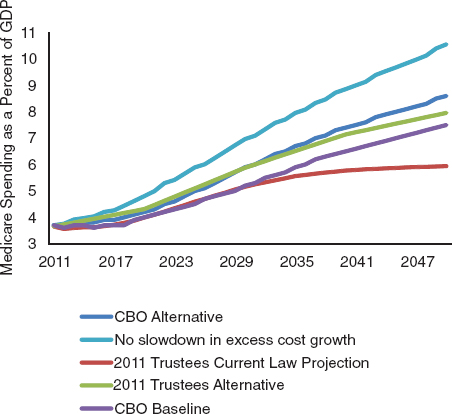
FIGURE 9-2 Alternative projections of Medicare spending, 2011–2050. SOURCE: Boards of Trustees, Federal Hospital Insurance and Federal Supplementary Medical Insurance Trust Funds (2011).
GDP in 2011 to 6 percent by 2050. Under the CBO alternative (which is similar to the Trustees alternative), Medicare spending in 2050 reaches 7.5 percent of GDP. The anticipated slowdown in health spending is important to these projections; under the assumption of no slowdown in excess cost growth, Medicare spending reaches over 10 percent of GDP by 2050.
Medicaid and Other Health Programs
Medicaid, a program that is financed in part by the federal government and in part by the states, is not an old-age program, yet it plays an important part in financing the long-term care needs of the elderly. In 2004, for example, Medicaid financed about one-third of long-term care services for the elderly (O’Brien, 2005), and in 2007 these services represented 14 percent of Medicaid expenditures (Centers for Medicare and Medicaid Services, 2011a). Table 9-2 shows the distribution of Medicaid spending by age in 2004. Per capita Medicaid spending is highest for those 75–84 and over 85, a reflection of the increased utilization and high cost of nursing home care.
TABLE 9-2 Medicaid Spending by Age, 2004
| Age Group | Per Capita Medicaid Spending, 2004 ($) | Share of Medicaid Spending by Age Group (%) |
| 0–18 | 819 | 24 |
| 19–44 | 662 | 27 |
| 45–54 | 737 | 11 |
| 55–64 | 1,026 | 11 |
| 65–74 | 1,112 | 8 |
| 75–84 | 2,058 | 10 |
| 85+ | 5,424 | 10 |
SOURCE: Centers for Medicare and Medicaid Services (2011b).
As noted in Chapter 3, increases in life expectancy are projected to significantly increase the share of people aged 85 and older. Thus, population aging may increase the demands on Medicaid. For example, assuming that relative Medicaid spending by age remains constant at the 2004 levels, projected changes in the age distribution of the population would raise Medicaid spending by about 10 percent by 2035 and 15 percent by 2050. Medicaid expenditure growth is also affected by excess cost growth in health spending (Table 9-1) as well by the recently enacted health reform, which expanded eligibility for the program. Taking into account the expected slowdown in health spending growth, the aging of the population, and the effects of the recently enacted health reform, the CBO projects (Figure 9-3) that federal spending for Medicaid and other non-Medicare health programs (the much smaller Children’s Health Insurance program
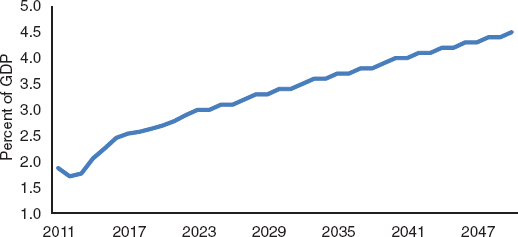
FIGURE 9-3 Projected federal spending on Medicaid and other health programs, 2011–2050. SOURCE: Congressional Budget Office (2011, Underlying Tables, Table B-1, Extended Baseline).
and the future outlays for health insurance subsidies under health reform) will rise from about 2 percent of GDP in 2011 to 3.7 percent in 2035 and 4.5 percent in 2050.11
STATE AND LOCAL GOVERNMENT
For the state and local sector, there are likely to be two significant sources of fiscal pressure going forward. First, since states finance roughly 40 percent of Medicaid spending, on average, rapid increases in Medicaid expenditures are also likely to put pressure on state budgets as well. Second, although states are subject to balanced budget requirements in their operating funds and so typically don’t have substantial amounts of debt outstanding, they do have implicit debt in the form of unfunded liabilities for the pension and retiree health benefits of state workers (Munnell et al., 2011).
There has been much less attention paid to long-term budget projections for the state and local sector than to the federal government sector. One exception is the Government Accountability Office (GAO), which reports its projections for state and local expenditures and revenues through 2060 (Government Accountability Office, 2012). The GAO examines both the impact of health care cost growth and the liabilities for state and local pension and retiree health benefits, assuming that these benefits are fully paid as scheduled. According to these projections, without policy changes, state and local government operating budgets are likely to be under increasing stress over time. By 2025, for example, the GAO’s base case shows an imbalance between revenues and expenditures of about 1.5 percent of GDP, rising to close to 4 percent of GDP by 2060. Much of this rise is attributable to rapidly increasing excess cost growth (the GAO assumes slightly faster growth of excess health cost growth for Medicaid and retiree health insurance than does the CBO). While not strictly comparable to the CBO projections, the GAO projections show that, even with the assumed slowdown in health spending, expenditure and revenue adjustments will need to be made in the state and local sector as well. While not all of these adjustments are directly attributable to demographic change, they are an important component of the overall fiscal outlook for the U.S. economy.
_____________
11Medicaid is by far the largest component of these. For example, in 2021, under the CBO projections, Medicaid accounts for 83 percent of the federal government spending on health programs other than Medicare. The CBO assumes that excess cost growth in these health programs will decline linearly over time, from 1.7 percentage points per year in 2022 to 0 in 2086.
PUTTING THE PIECES TOGETHER: THE
LONG-TERM BUDGET OUTLOOK
The sustainability of federal fiscal policy is affected not only by the expected growth in entitlement programs but also by the current level of national debt and by the expected trajectories for tax revenues and discretionary spending. Auerbach and Gale (2012) present a detailed analysis of alternative trajectories of total federal spending, revenues, and debt under a variety of assumptions about fiscal policy.
Figure 9-4 presents two such scenarios for noninterest expenditure and revenues. The more optimistic scenario uses the Medicare Trustees projections for Medicare spending and assumes that taxes will rise to about 21 percent of GDP over the long term, 3 percentage points above the 18 percent average recorded from 1970 to 2007. In addition, it assumes that savings from the Budget Control Act of 2011 will materialize. The more pessimistic scenario uses the CBO “alternative” projection for Medicare spending, which is considerably higher than that of the Medicare Trustees, assumes that Congress will maintain tax revenues at roughly its recent historical average of 18 percent of GDP, and assumes that parts of the Budget Control Act will be repealed.12 This scenario can be interpreted as one in which taxes and entitlement programs operate largely as they have in the past, whereas the optimistic scenario already incorporates some adjustments to demographic change, including a reining in of health care cost growth and an increase in average tax rates.
Under the optimistic scenario, noninterest expenditures fall from 22 percent to roughly 20 percent of GDP by 2018 as the economy recovers and then rise slowly thereafter, to about 22 percent by 2030 and 23 percent by 2050. Under the more pessimistic scenario, noninterest outlays rise faster, reaching almost 26 percent by 2050. With tax revenues of 21 percent and 18 percent of GDP, respectively, the primary deficit (that is, the deficit excluding interest payments on the national debt) reaches 2 percent of GDP by 2050 under the optimistic scenario and almost 8 percent in the pessimistic scenario.
Figure 9-5 shows the deficit projections implied by these two sets of expenditure and revenue projections, including projected interest payments. In both scenarios, the deficit declines sharply over the next few years relative to GDP as the economy recovers, and then begins to climb. In the optimistic scenario, the deficit falls to close to 1 percent of GDP over the next decade and then increases only gradually over time, reaching 4 percent of GDP by 2030 and almost 8 percent of GDP by 2050. Even under this positive sce-
_____________
12In particular, the pessimistic scenario assumes that the $1.2 trillion in budget savings that would be triggered by automatic sequestration under the Budget Control Act of 2011 will be repealed.
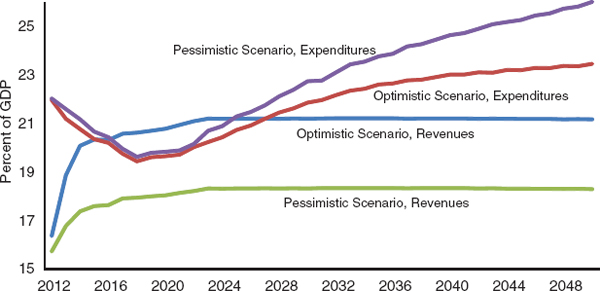
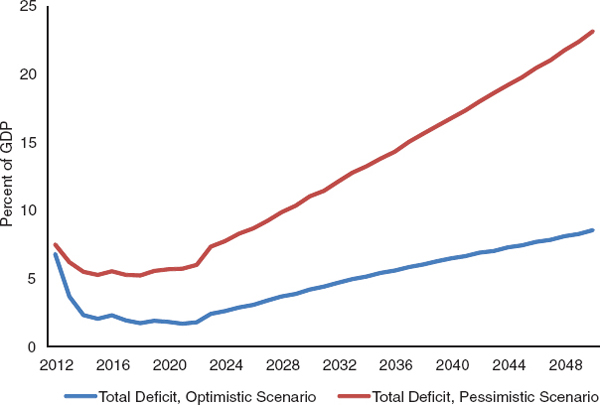
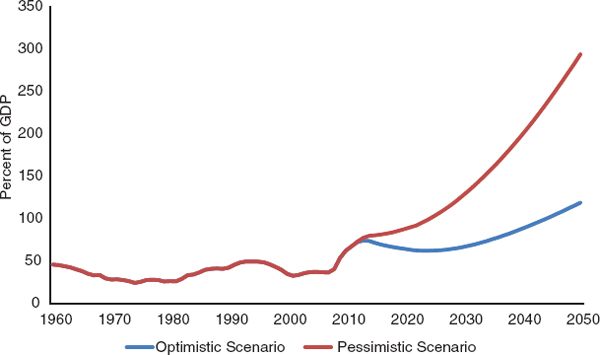
FIGURE 9-6 Alternative federal debt:GDP ratios, 2012–2050. SOURCE: Committee calculations based on Auerbach and Gale (2012).
nario, future adjustments will still be necessary. In the pessimistic scenario, the deficit hovers around 5 percent of GDP for much for the next decade but climbs sharply thereafter, reaching over 10 percent of GDP by 2030 and over 20 percent of GDP by 2050. The sharp acceleration in the future deficits under the pessimistic scenario reflects the combination of continued rapid growth in health expenditures as well as rapidly rising interest payments from continued large deficits.
Figure 9-6 shows the implied debt:GDP ratios under these two sets of projections. Under the most optimistic set of assumptions, the debt:GDP ratio falls over the next 15 years and then begins to climb sharply, reaching 100 percent of GDP by 2046. Under the more pessimistic set of projections, the debt:GDP ratio climbs much more rapidly, reaching 100 percent of GDP by 2027 and 200 percent of GDP by 2043.
The debt:GDP ratio cannot continue to rise indefinitely; at some point, investors would become uncertain of full repayment (or worry about repayment in greatly inflated dollars) and start demanding a risk premium13 on U.S. Treasury securities. At that point, rising interest payments on the debt would trigger even larger deficits, potentially resulting in an unsustainable deficit spiral. Although there is uncertainty as to exactly what level of debt
_____________
13The extra expected return over the risk-free rate demanded by investors to compensate for the volatility of returns or the possibility of default of risky assets.
TABLE 9-3 Adjustment Needed to Maintain the 2011 Debt/GDP Ratio Through 2050
| Required Adjustment (% of GDP) | ||
| Adjustment Takes Place in | Optimistic Scenario | Pessimistic Scenario |
| 2012 | 1.1 | 4.8 |
| 2022 | 1.7 | 6.1 |
| 2032 | 2.4 | 7.7 |
SOURCE: Committee calculations based on Auerbach and Gale (2012).
will elicit such a reaction, it is clear that fiscal policy adjustments will need to be made eventually. In particular, even through 2050, it is unlikely that the pessimistic scenario could actually unfold, as it is unlikely that investors would be willing to continue to finance the projected deficits.
One response to population aging would be to attempt to smooth the required adjustments over time in order to minimize the size of the adjustment in any given year. Because population aging is projected to be permanent, however, spreading the adjustments equally over time would require the government to build up a large stock of assets and to use the earnings on those assets to help finance part of future government spending. Alternatively, the government could smooth through the adjustments over a more finite period. For example, Table 9-3 presents calculations based on Auerbach and Gale (2012) showing the size of the adjustments required in order for the debt:GDP ratio in 2050 to be the same as it was in 2011. For example, under the more optimistic scenario, which already includes higher revenues and lower health spending growth than the historical averages, an immediate and permanent change to tax revenues or expenditures equal to just over 1 percent of GDP would leave the debt:GDP ratio in 2050 the same as it is today; under this scenario, the debt:GDP ratio would decline to 44 percent over roughly the next two decades years, and then it would start to climb again, reaching 68 percent in 2050. Alternatively, if the adjustment were delayed until 2022, a 1.7 percent of GDP adjustment would be required, and if it were delayed until 2032, a 2.4 percent of GDP reduction in expenditures or increase in taxes would be required. Under the pessimistic scenario, which assumes significantly lower tax revenues and higher health expenditures, the required adjustments are significantly larger.
MACROECONOMIC IMPLICATIONS OF
RESPONSES TO DEMOGRAPHIC CHANGE
The aforementioned budget projections indicate that a large change in the combined trajectory of federal tax revenues and expenditures will be
required over the coming decades. These changes will have important macroeconomic consequences, but there is no natural baseline against which to measure these macroeconomic effects because the status quo trajectory is not a feasible one—it would lead to an exploding and unsustainable level of national debt. Thus, we can only compare the effects of different feasible paths, especially their relative effects on capital accumulation and labor supply, both in the aggregate and across generations. To estimate these effects, several attributes of budget adjustments will be relevant, including those described in the next seven subsections.
How Quickly the Changes Are Implemented
Under both the optimistic and pessimistic scenarios, annual deficits are projected to grow over time as a share of GDP, even when debt service costs are excluded. Thus, as mentioned above, if the adjustment process targets the rate of debt accumulation, the magnitude of deficit cuts will grow over time as a share of GDP.
A different policy that would lessen the magnitude of the required deficit cuts over time would be to make larger immediate adjustments to taxes and spending policies that could temporarily lower the debt:GDP ratio. This would have the effect of smoothing the adjustments across more cohorts. However, it is unclear how much of this type of “prefunding” is feasible. According to Auerbach (2002 and 2003), there is a predictable reaction function of government spending to the deficit: As the deficit falls as a share of GDP, government spending increases and tax revenues fall as a share of GDP. Thus, policies that would significantly lower deficits ahead of the baby boom retirement, while possibly economically attractive, might prove politically unsustainable.
On the other hand, waiting too long to announce and implement policy changes is a risky strategy. As noted above, it is impossible to predict the level of debt at which investors might lose confidence in the ability or willingness of the United States to fully repay its debts. This loss of confidence could occur quite suddenly, and it might lead to a period of financial crisis or a situation in which policy adjustments would have to be quite large and immediate, which could have deleterious effects on short-term macroeconomic performance (National Research Council and National Academy of Public Administration, 2010).
When Changes Are Announced or Anticipated
Changes that are implemented in the future may nonetheless be announced or anticipated many years before. If announcements of future policies are credible or if expectations reflect an accurate assessment of the
policies that eventually will be undertaken, then these policies can affect behavior long before their implementation. An example is the phased increase in the Social Security full retirement age, which was enacted in 1983 but implemented over a long period beginning several years after enactment. To the extent individuals are forward looking, this change in policy would have boosted private saving in the years prior to its implementation, as people increased their saving in anticipation of lower future Social Security benefits.
Changes That Explicitly or Implicitly Increase Marginal Tax Rates
Some policy changes quite explicitly increase marginal tax rates.14 Most tax increases would do so, unless accompanied by changes in tax structure. But many marginal tax rates are implicit, as in the case of the means-testing of social insurance benefits. This point has been made quite frequently in the context of antipoverty programs, where the simultaneous loss of different benefits for those who enter work can in combination lead to very high marginal tax rates and create a poverty “trap” that strongly discourages exits from poverty and dependence. But the point also applies to universal old-age entitlement programs. For example, the share of Social Security benefits subject to the income tax depends on retirees’ other income, which imposes an implicit marginal tax rate (in addition to the explicit one) on that other income. Similarly Medicare Part B premiums are now income-based, which also imposes a tax on such income.
Note that implicit marginal tax rates on income may be imposed through the tax system (as in the case of Social Security benefit taxation) or through the expenditure system (as in the case of Medicare premiums, which are classified in the budget as offsetting receipts that reduce expenditures). This fact highlights an important point: Macroeconomic effects will depend on the distribution and structure of budget changes but not directly on whether these changes are recorded on the tax side or the expenditure side. Though this distinction sometimes appears paramount in political discussions, it is of little relevance for economic analysis except to the extent that the underlying behavioral effects of tax or expenditure changes may systematically differ.
The Intergenerational Distribution of Policy Changes
The intergenerational distribution of policy changes will relate to the first point above, because changes that are delayed are likely to affect
_____________
14The marginal tax rate is the rate that would have to be paid on any additional taxable income earned, which may be higher than the rate paid without additional earnings.
younger generations. But two policies of the same magnitude implemented at the same time may have different distributional effects among generations. For example, an immediate, permanent cut in Social Security benefits will affect older generations more than an immediate, permanent increase in Social Security taxes with the same budget result. Similarly, a consumption tax would affect older generations more than an increase in the income tax. The generational distribution of deficit reductions will matter for aggregate economic activity because generations have different propensities to consume goods and leisure out of income changes, and they are affected differently by changes in marginal tax rates. For example, we would expect larger reductions in consumption (say, through reductions in tax exemptions) from income reductions imposed on 70-year-olds than from equal-size reductions imposed on 40-year-olds, because the latter group is in a better position to offset income losses by increasing labor force participation. Likewise, we would expect larger changes in labor supply from increased marginal income tax rates on 40-year-olds than from increased marginal income tax rates on 70-year-olds, who are mostly retired and out of the labor force.
The distributional effects of a program of budget adjustments over time can be summarized using generational accounts, which cumulate the effects on different generations at different dates. Such accounts, however, focus on incidence and hence must be complemented by analysis of how changes in incentives, via marginal tax rates, are distributed across generations and, as discussed next, within generations. Also, because generational accounts are forward-looking calculations, their usefulness for macroeconomic analysis hinges on the extent to which the affected individuals (1) actually are forward looking and (2) are not liquidity-constrained15 in a manner that makes future taxes and benefits irrelevant, as they would be for households with little or no saving who spend essentially all of their disposable income each year.
The Intragenerational Distribution of Policy Changes
Two policies with the same timing, intergenerational distribution, and marginal tax rate changes can affect members of a given cohort differently. For example, one might vary the progressivity of a given cut in Social Security benefits. As with differences across generations, differences in the impact of deficit cuts within a generation can be expected to have different effects on labor supply and saving. For example, lower-income individuals are more likely to be liquidity-constrained and hence to suffer a big-
_____________
15That is, without sufficient cash to make purchases, and/or unable to borrow to consume or invest.
ger decline in consumption in response to a given reduction in after-tax income. Also, those who are liquidity-constrained or myopic are less likely to respond to anticipated future policy changes; such individuals may not change their labor force or saving behavior, which become irrelevant when current decisions are constrained.
The Timing of Tax Increases and Benefit Cuts over a Lifetime
One of the important rationales for the existence of programs like Social Security and Medicare is that many people are not farsighted enough to adequately save for retirement, and these programs are a form of forced saving, at least from the individual’s standpoint. Thus, while people with perfect foresight will adjust their consumption optimally in response to an announced cut in benefits, many others may not. This means that, even for an individual, a tax increase and benefit cut that lower lifetime resources by the same amount can have different effects, with changes occurring in the distant future possibly having a smaller impact today.
The Role That Policy Changes Play in Insuring or Exacerbating Risk
Under reasonable assumptions, uncertainty about future resources affects current behavior. Individuals may engage in precautionary saving if the future is uncertain, and they may also work more or delay retirement. These effects are in addition to those resulting from expected changes in resources. Uncertainty is always present in the economy, and indeed one stated purpose of social insurance is to reduce such uncertainty by cushioning the shocks of economic forces on particular individuals or, through intergenerational risk-sharing, entire cohorts. But uncertainty about future policy changes might exacerbate existing uncertainty. For example, budget deficits rise when the economy is weak because of a loss in revenues, so if policy aims to achieve a fixed budget reduction, budget cuts must be larger when the economy is weak and individual resources are low.
In summary, to analyze the macroeconomic effects of a given policy trajectory, one would like to estimate the inter- and intragenerational distribution of changes in resources and marginal tax rates under the policy, the dates at which future policy changes are anticipated, and the distribution of possible policy paths and how these paths relate to the economy’s possible trajectories. Sophisticated general equilibrium models with overlapping generations, forward-looking agents, and within-generation heterogeneity do exist, but it would be a considerable challenge to construct a detailed model that incorporates realistic tax and expenditure elements and is capable of taking all of the factors discussed into account simultaneously. Thus, the most reasonable approach is to use different models designed to
capture different elements of the overall picture, simplifying where possible to keep the most important elements of particular policy changes in focus.
To see how these different channels of transmission from policy to the economy may operate, it is helpful to focus on the three broad categories of policy adjustments that have been considered to address the fiscal imbalances.
Steps to Rein in Excess Health Care Cost Growth
One of the key differences between the most optimistic and most pessimistic scenarios in Figure 9-4 is the assumption about the trajectory of federal spending on health programs after 2020. Under the optimistic scenario, per-beneficiary health spending grows roughly in line with GDP, whereas under the pessimistic scenario, rapid health spending is responsible for a large and growing portion of the fiscal imbalances over time.
Accordingly, measures like the ACA that attempt to lower the overall health spending of the elderly are likely to be an important component of long-term fiscal policy. Yet the macroeconomic consequences of such measures are among the most difficult to determine. If, as some believe, changes in Medicare policy can induce innovations in health care delivery that lead to reduced spending without a reduction in the quality of care (for example, by eliminating duplication of services, eliminating unnecessary care, or reducing costly errors), then these policy changes would help address the fiscal problem without any required reduction in living standards. On the other hand, lowering the rate of growth of health spending may be accompanied by reduced access to care and a slower rate of growth of innovation, which would lower the living standards of the elderly relative to a baseline in which spending continued to rise faster than GDP. Finally, cuts in Medicare spending could lead to lower income for health service providers, which would be equivalent to a tax on providers. Over time, such a tax could reduce the attractiveness of practicing medicine, which could lead to lower quality and reduced access as well.
Benefit Cuts
There is a wide variety of policies that could lower the growth rate of entitlement spending beyond changing the growth rate of health care costs. Such options include changing the age of eligibility for benefits, changing the generosity of benefits, and limiting benefit growth by increased reliance on means-testing. These different approaches would likely have different distributional consequences; in addition, they might also have differential effects on labor supply.
For example, a policy to index retirement ages (particularly the full retirement age) for Social Security benefits to life expectancy would lower benefits disproportionately for those with a shorter life expectancy. Given
the dramatic widening of the gap in life expectancies across the income distribution seen in recent decades (Congressional Budget Office, 2008), this distributional effect might be deemed undesirable. On the other hand, if changing the retirement age—particularly the age of early retirement—could induce workers to stay in the labor force longer, this could offset the effect of the reduction in benefits on income and would also provide a greater boost to economic activity than a benefit cut for all retirees. But, those with shorter life expectancies may also have less capacity for work (Cutler, Meara, and Richards-Shubik, 2011). Other possible policies might also face some trade-offs between efficiency and equity. For example, a policy to further means-test benefits might have favorable distributional consequences but would also impose greater implicit taxes on saving.
Tax Increases
Many observers believe that increased tax revenues will be necessary to meet the fiscal challenge posed by population aging. From a macroeconomic standpoint, the particular details of the tax changes are quite important. For example, simply raising tax rates on the existing tax base could have significant disincentive effects on labor force participation as well as on saving, making the required adjustments to the fiscal challenge of aging that much more difficult. On the other hand, many economists believe that reforming the tax code by broadening the base could lead to higher revenues while lowering marginal tax rates. This type of policy could help address the fiscal imbalance while also boosting economic activity.
CONCLUSIONS
A sizable share of the consumption of the elderly is financed by the government, in the form of Social Security, Medicare, and Medicaid. The projected changes in the population’s age distribution will create imbalances in these programs and, even under the most optimistic projections, lead to progressively larger budget deficits. The challenges of population aging are made more difficult by rapidly growing health costs and by the underlying structural budget deficits that federal and state and local governments face even in the absence of demographic change. Although government debt can grow faster than the economy for a time, policy changes that increase revenues and/or lower expenditures are inevitable in the next few decades. Analyzing the macroeconomic effects of the potential policy changes requires a consideration of their likely impact on private behavior, which will depend on their timing, their distribution, and their effects on the marginal incentives to work and to invest. To the extent that spending can be reduced and revenues increased in ways that increase economic efficiency, the macroeconomic consequences of the necessary policy changes would be muted.


