
5
Labor Force Participation
and Retirement
Chapter 3 discusses the aging of the U.S. population and the accompanying increase in average life expectancy. The macroeconomic implications of these demographic trends will depend in large part on the future growth of the labor force and on how long people stay in the labor force. Working longer can provide more resources to pay for the higher Social Security and health care costs associated with population aging. It will also allow a smaller proportion of total resources to be used for support of the older population and more to be allocated to the young, to education in particular. How long people work will depend on health and disability trends, the incentive effects of public and private pension programs, the demand for older workers, and the flexibility of work at older ages.
The first part of this chapter describes trends in the labor force since 1950 and projections for future years and discusses the changing job mix and changing human capital needs. The chapter then explores trends in employment by health status and the capacity to work at older ages and examines public and private policies that induce early retirement. The discussion concludes with a look at ways that longer working lives can be facilitated and summarizes the macroimplications of longer working lives.
TRENDS IN LABOR FORCE SIZE,
PARTICIPATION, AND PROJECTIONS
Labor Force Size and Composition
Changes in labor force size and composition in the United States over the past 60 years may be attributed to three main trends. The first, as de-
scribed in Chapter 3, was the overall growth of the population after the Second World War. Beginning in the early 1960s, the surge in labor force size was propelled by the large number of postwar babies who began to enter the labor force. A second contributor to labor force growth was the increase in the number and proportion of women, especially married women, undertaking employment. The third factor was an increase in the number foreign-born workers, which accelerated in the 1970s.
Between 1950 and 2010, the labor force1 grew more rapidly than did the population as a whole. Whereas the total U.S. population increased 102 percent over the 60-year period, the corresponding increase in civilian labor force size was 148 percent. The highest rates of labor force growth were seen in the 1970s, when large numbers of the baby boom generation entered the prime working ages (Figure 5-1). By the 1980s, the majority of the baby boomers were of working age. While the absolute size of the labor force has continued to rise since the 1970s, the decadal growth rates have declined.
Non-Hispanic whites constitute the bulk of the total labor force (70 percent in 2005), but the racial and ethnic composition of workers has been changing. The proportion of the labor force that is foreign-born increased from 6 percent in 1960 to 13 percent in 2000 and to 16 percent in 2009 (Lee and Mather, 2008; Bureau of Labor Statistics, 2011b).
Labor Force Participation
The long-term growth of the labor force has been the product of several subtrends, not all of which have moved in the same direction. The total labor force participation rate (people aged 16 and over in the labor force as a percent of the civilian noninstitutional population aged 16 and over) fluctuated between 58 and 60 percent in the 1950s and the first half of the 1960s. Beginning in the mid-1960s, the labor force participation rate (LFPR) began a long-term increase that reached a high point—67 percent—in the latter 1990s. The LFPR declined slightly, to 66 percent in the mid-2000s and less than 65 percent in 2010.
Figure 5-2 indicates the labor force participation experience of four broad age/sex groupings. Men have always constituted the majority of the U.S. labor force, but as the total labor force has grown over the past 60 years, the participation rate of prime age (25–54) men has declined some-
_______________
1The Bureau of Labor Statistics defines “labor force” to include all persons aged 16 or older in the civilian, noninstitutionalized population who, during a given reference week, (1) worked as paid employees or in their own business, (2) worked 15 hours or more without pay in a family enterprise, (3) were temporarily absent from a regular job, or (4) had no employment but were available for work, except for temporary illness, and had made specific efforts to find employment sometime during the 4-week period ending with the reference week.
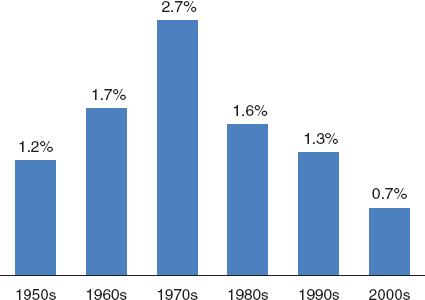
FIGURE 5-1 Average annual labor force growth, by decade, 1950s to 2000s. SOURCE: Bureau of Labor Statistics.
what. More striking is the decline in the participation rate from 1950 to 1995 among men aged 55 and over, from nearly 70 percent to less than 40 percent. This drop reflects the declines in average age at retirement (discussed below) that occurred since the 1950s, a pattern also seen throughout most of the industrialized world. Since the mid-1990s, however, the partici-
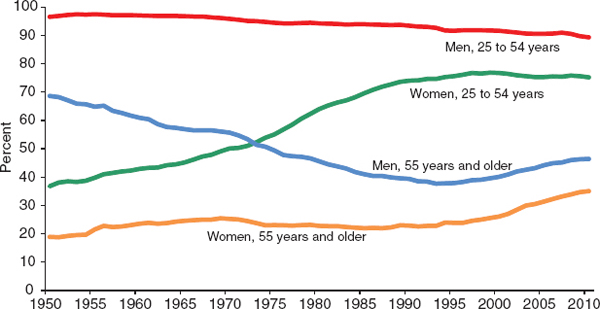
FIGURE 5-2 Labor force participation rates for four broad age-sex groups, 1950–2011. SOURCE: Bureau of Labor Statistics.
pation rate among older men has reversed course and now approaches 50 percent, even as the overall LFPR was flat or declining.
Trends among women were distinctly different from those for men, at least between 1950 and 2000. The combination of economic growth and changing social norms produced a surge in female labor force participation rates during the second half of the twentieth century; the participation rate for women aged 25–54 doubled between 1950 and 2000, before declining slightly in the first decade of the 2000s. The participation rate for older women, unlike that for older men, rose from 1950 to 1970 and was essentially stable during the following two decades. After 1995, there was an upward trend for older women similar to that for older men.
Figure 5-3 takes a closer look at trends at older ages from 1976 to 2011. For men, it can be seen that the aggregate gains at ages 55 and over since the mid-1990s were driven mainly by increased participation at ages 60–64 and 65–69, with little change at ages 55–59. Increases in participation among women were seen in all older age groups. Note that LFPRs at ages 70 and over are not insignificant: more than 15 percent for men and 8 percent for women in 2011. And in spite of the economic downturn in 2008–2009, the total LFPR of people aged 55 and over continued to increase. This upturn seems likely to continue, at least in the near future, as people (1) work additional years to recoup assets that were lost owing to declining stock values and (2) seek to maintain access to employment-based health coverage (Copeland, 2011).
While participation rates vary by race and ethnic group, the differences are not as large as the variance seen across age and sex categories (Toossi, 2006). Since at least the mid-1970s, participation rates for Hispanic men have been somewhat higher than for white men and black men. Data from the mid-1970s through 2006 showed that the LFPR for Hispanic men averaged 81 percent, compared with 77 percent for whites and 70 percent for blacks (DiCecio et al., 2008). The relatively high level for Hispanic men reflects the fact that Hispanic men are younger, on average, than the overall population—that is, they are more likely to be in age groups that have the highest activity rates. The picture for women was quite different; the average LFPR for Hispanic women was 52 percent, lower than that for white women (55 percent) and black women (57 percent).
Projections of the Labor Force
The interplay between future demographic and labor force characteristics is a key factor in any macroeconomic assessment of aging. The committee considers changes in the size of the labor force and participation rates and likely changes in the composition of the labor force through 2050. The committee developed its own labor force projections as an adjunct to the
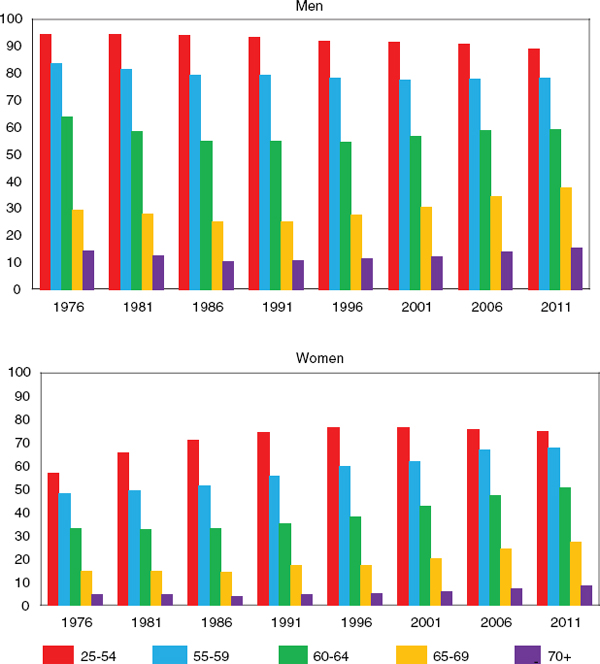
FIGURE 5-3 Labor force participation rates for prime-age and older workers, 1976–2011. SOURCE: Bureau of Labor Statistics.
population projections presented in Chapter 3 (see Appendix A for details). Data from the Bureau of Labor Statistics (BLS) and the Census Bureau’s Current Population Survey were used to add a race/ethnic group component to the population projections. The resulting labor force projections suggest that the growth rate of the labor force will be essentially flat from 2010 to 2015 and will then resume the downward trend seen in Figure 5-1. The overall annual labor force growth rate is projected to decline from 0.69 to 0.50 between 2015 and 2027, then increase to 0.63 by 2040 before
declining slightly to 0.60 by 2050. This overall trend reflects the interplay of several factors:
- The labor force will continue to age as the overall U.S. population ages. The median age of workers rose from less than 35 years in 1980 to more than 40 in 2010; the median age is projected to approach 41 by 2015 and increase gradually to 42 during the following 25 years. Other things being equal, the entrance of large baby boom cohorts into age groups that traditionally have lower LFPRs should exert a downward force on the overall LFPR.
- The share of young (16–24) workers in the total labor force is likely to decline throughout the entire 2010–2050 period, from 14 percent to 11 percent.
- The share of prime-age (25–54) workers in the total labor force is projected to decline, from 66 percent in 2010 to 62 percent in 2027, then rise slightly for 6 years before declining to 61 percent in 2050.
- The declining share of workers aged 16–54 will be offset by an increasing percentage of all workers who are aged 55 and above. The latter share was 12 percent in 1990, is projected to double to 24 percent around 2020, and should rise to more than 27 percent by 2050.
As the age distribution of the labor force changes, the racial and ethnic composition of the labor force is likely to become increasingly diverse. The committee projects an average annual growth rate of 2.2 percent and 1.7 percent for the Hispanic and Asian components of the labor force, respectively, from 2010 to 2050. In contrast, the average annual growth of the black component is expected to be 0.6 percent, while the white component is expected to decline by 0.1 percent annually over the 40-year period. The white non-Hispanic share of the total labor force is expected to decline from two-thirds in 2010 to about half by 2050 (67 to 51 percent). In addition to the differential growth rates by race and ethnicity, the white non-Hispanic share also will decline because of (1) lower fertility of white non-Hispanics relative to other population groups, which means proportionally fewer white non-Hispanic workers in the future, and (2) the eventual retirement of the largely white, non-Hispanic baby boom (Toossi, 2006).
Female Labor Force Participation and Fertility
Long-term projections of the size and composition of the nation’s labor force depend on several key variables, including female labor force participation (FLFP). As mentioned earlier, women’s participation in the
labor force increased steadily during much of the latter half of the twentieth century. Whereas 33 percent of women aged 16 years or older reported working in 1948, this figure had reached 60 percent (an all-time high) by the turn of the century. Over the last 25 years, much of the increase in FLFP has occurred among mothers with newborn children (Martinez and Iza, 2004). Women represented 47 percent of the total U.S. labor force in 2009 and are expected to account for more than half of the increase in total labor force growth through 2018 (Department of Labor, 2010).
While historical data highlight the dramatic changes in FLFP during the twentieth century, figures over the past 15 years indicate a plateau. By 2007, FLFP had decreased to its 1996 level of 59 percent (Vere, 2007). It is unclear whether this represents a long-term trend or a temporary stagnation in FLFP. Predicting FLFP—and, by extension, the characteristics of the labor force as a whole—relies on understanding several factors that could influence FLFP in the coming years.
Returns to female laborers have increased in absolute and relative terms since the early twentieth century and have been a driving factor behind women’s entry into the labor market (Galor and Weil, 1996). Today, women aged 25–34 are more likely than men to finish high school, obtain a college degree, and obtain a graduate degree. Thus, women are increasingly well qualified to enter the workforce at all skill levels. Though gender disparities in pay persist, they continue to narrow. In 2009, women earned approximately 80 percent of men’s weekly earnings, compared with 62 percent in 1979 (White House Council on Women and Girls, 2011). Further change in compensation may spur continued growth in FLFP.
The relationship between fertility (childbearing) and FLFP has been the subject of considerable investigation in recent decades. A negative relationship between FLFP and childbearing has been well documented in many countries. However, in spite of less generous family policies, the United States has relatively high levels of fertility and female labor market participation compared with other developed nations. Moreover, research suggests that the magnitude and significance of the trade-off between work and children has lessened in the United States since the 1980s (Furtado and Hock, 2008; Engelhardt and Prskawetz, 2004).
Several factors besides enhanced wage incentives could be responsible for the changing nature of the relationship between FLFP and fertility in the United States. Increased divorce rates, labor-saving household technologies, and declines in real wages for some groups of male workers have been identified as possible explanations for increased FLFP (Juhn and Potter, 2006). The influx of low-skilled immigrant workers is thought to have increased the affordability of child care for relatively higher-skilled workers (Furtado and Hock, 2010; Martinez and Iza, 2004). It also has been noted that increased social, political, and legal support for working mothers has
lessened the conflict between paid work and family responsibilities. For instance, the enactment of the 1993 Family and Medical Leave Act and the introduction of child care subsidies helped to increase both job security and labor force participation for working mothers (Apps and Rees, 2004; Brewster and Rindfuss, 2000). Further, federal programs such as Temporary Assistance for Needy Families (TANF) and the Earned Income Tax Credit (EITC), which provide an incentive for work or require work in exchange for state and federal assistance, have encouraged low-skilled workers to enter the labor force.
Part-Time Work
Societal responses to an unfavorable worker/retiree support ratio could involve incentives for older workers to remain in the labor force longer, as discussed at some length later in this chapter. One such incentive is the option of part-time work, which may facilitate gradual or phased retirement. Phased retirement in the United States appears to be gaining popularity among both employers and employees, notably in areas that have a current or projected shortage of workers (e.g., public school teachers and administrators) (Watson Wyatt Worldwide, 2004; Chen and Scott, 2006; Purcell, 2009b). Legislative changes have sought to ease restrictions on older employees’ receipt of pension benefits, and a congressional research report indicated that 41 percent of men and 35 percent of women aged 55–64 who reported receiving pension income in 2005 were employed in 2007 (Purcell, 2007).
Data suggest that many older workers work part-time as a transition to retirement. Part-time employment is more common among older than younger workers, and older women are more likely than older men to work part-time. In 2002, more than half of working women aged 65 who were surveyed in the Health and Retirement Study (a panel survey that began in 1992 and surveyed respondents every 2 years thereafter) were employed in part-time positions, compared with about 30 percent of men. And among older workers, the proportion working part-time increases with age; for both genders, part-time employment formed the lion’s share of total employment for people aged 70 and over (National Institute on Aging, 2007). Figure 5-4 indicates that in spite of the apparent prevalence of part-time work, the proportion of older workers employed part-time has declined since the mid-1990s, with a slight uptick between 2008 and 2009.
Retirement Trends
One important issue for policy makers and pension funds is the relationship between the statutory retirement age (also called the full retirement
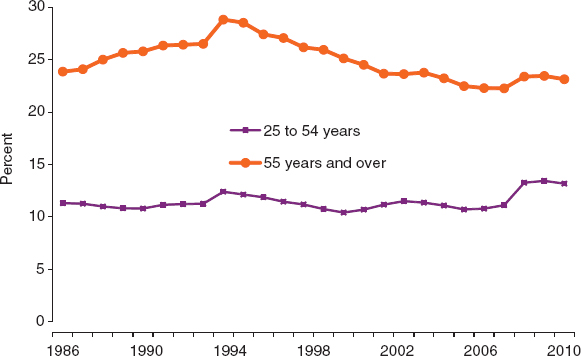
FIGURE 5-4 Share of employed individuals engaged in part-time work for two broad age groups, 1986–2011. The jump in share around 1994 is a function of a redesign of the Current Population Survey. SOURCE: Bureau of Labor Statistics.
age or normal retirement age), the age at which one can leave the labor force and receive full benefits, and the actual retirement age, the average age at which people leave the labor force and/or begin to receive some retirement benefits. The average age is heavily influenced by early retirement incentives inherent in plan provisions, as discussed later in the chapter.
There are numerous ways of defining “retirement,” and different data sources yield different estimates of when people retire and how much of life is spent in retirement. For example, Gendell (2008) calculated average retirement ages of 62.6 years for men and 62.5 years for women in the early to mid-2000s using Social Security data and somewhat lower ages (61.6 and 60.5 years, respectively) using labor force data from the Current Population Survey, a joint effort between the Bureau of Labor Statistics and the Census Bureau. The Organization for Economic Co-operation and Development (OECD), using a methodology based on net withdrawals from the labor market, posited higher average retirement ages of 64.1 years for men and 63.2 years for women, circa 2003. Regardless of methodology, however, it seems clear that a greater proportion of older Americans are currently working than was the case two decades ago, as is shown in Figure 5-3. The most recent OECD calculation, for 2009, suggests an average retirement
age of 65.3 for men and 64.8 for women (Organisation for Economic Co-operation and Development, 2010).2 While the trends in average retirement age have changed in recent decades, the age at which individuals initially receive Social Security retirement benefits has remained fairly constant since 1975, averaging around 63.7 years. There is little difference in the age at which men and women initially receive Social Security retirement benefits (Social Security Administration, 2010a).
TRENDS IN JOBS AND CHANGING HUMAN CAPITAL NEEDS
It has been argued that technology may change the nature of work faster than the skills of the workforce change. In modern economies, problems abound when a nation’s educational system grows out of touch with job market trends (Levy, 2010). This section takes a brief look at trends in job mix that have evolved during the past century, as well as short-term forecasts of changing occupational structure. The committee then considers the likely impact of technological change on U.S. job requirements over a longer time horizon.
Changes in the Job Mix
The distribution of U.S. workers by occupation underwent a transformation in the twentieth century, largely in response to industrialization and urbanization. Farmers and farm laborers constituted a third of the entire labor force in 1910, but their proportion had shrunk to 2 percent by 2000. Less precipitous but still large declines were seen among private household service workers, nonfarm laborers, and operatives—for example, workers who ran machines in rapidly expanding industries such as steel, paper, and chemicals. At the other end of the spectrum, the proportion of professional and technical workers jumped about 400 percent, and large proportional gains were seen for clerical workers, nonhousehold service workers, and the occupational category that includes managers, officials, and proprietors (Wyatt and Hecker, 2006).
As noted earlier, the BLS makes short-term projections of various labor force characteristics, one of which is growth among 750 detailed occupations. These occupations can be aggregated into 10 major groupings and
_____________
2The OECD calculates the average effective age of retirement as a weighted average of net withdrawals from the labor market at different ages over a 5-year period for workers initially aged 40 and over. In order to abstract from compositional effects in the age structure of the population, labor force withdrawals are estimated based on changes in labor force participation rates rather than labor force levels. These changes are calculated for each (synthetic) cohort divided into 5-year age groups. For more detail, see http://www.oecd.org/employment/employmentpoliciesanddata/39371923.pdf.
examined for variations in employment growth. The latest set of occupational projections, covering the period 2008–2018, foresees the most rapid growth (17 percent) among professional and related occupations, while production occupations will face a decline of 3.5 percent. The professional and related group is projected to account for the largest number of new jobs, in excess of 5.2 million, whereas a loss of about 350,000 positions is forecast in production occupations (Lacey and Wright, 2009). Although the general U.S. economic situation during 2009–2011 might affect any absolute numerical forecasts of job growth, it seems likely that the projected changes in job mix are realistic.
Technology and Changing Job Requirements
More detailed data from the 2008–2018 BLS projections illustrate the dual impact that technology and population aging are likely to have. The occupational category with the largest projected growth is “network systems and data communications analysts.” The second and third categories are “home health aides” and “personal and home care aides,” which reflect in large part the needs of an aging population. Computer software engineers and medical assistants round out the five highest projected growth areas. Data collected since these projections illustrate the importance of changes in the health sector: Private sector job changes in 13 major categories in 2009–2010 show a net job loss in each category except one: education and health services (U.S. Census Bureau, 2012).
There is little disagreement that the pace of technological change seen in recent decades will continue or accelerate. Technological advances will increase demand for a highly skilled workforce who can respond and adapt to new technologies and new product demand and grow productivity (Karoly and Panis, 2004). Numerous studies have attempted to gauge the fit between shifting employment and occupation patterns and the educational skills of U.S. workers. Separate analyses of job and education requirements in the 2010 decade, done independently from the BLS analysis, suggest that the United States will need 20–22 million new college degree holders but will fall short of that mark by at least 1.5–3.0 million degrees (Carnevale, Smith, and Strohl, 2010; Manyika et al., 2011).
During the 1990s and 2000s, the fraction of the workforce engaged in very low and very high skill occupations increased, while the fraction engaged in moderately skilled occupations contracted. Information technology (IT) is suited to highly educated workers engaged in abstract tasks and much less so to less-educated workers engaged in routine tasks. IT development has less impact on low-skilled workers engaged in manual labor (Autor, 2008; Autor and Dorn, 2011). A McKinsey Global Institute (2009) analysis suggests that 71 percent of U.S. workers are in jobs for which there is either low demand
from employers or an oversupply of workers, or both. Income and employment for the top-earning fifth of the U.S. labor force grew rapidly from the mid-1990s to the mid-2000s, mainly because global changes in technology generated new market opportunities and demand for advanced skills.
TRENDS IN EMPLOYMENT BY HEALTH
The combination of increasing life expectancy and large numbers of people moving into traditional retirement ages—and until the mid 1990s the decline in the LFPRs of men in particular (Figure 5-3, top panel)—has put fiscal strains on income support programs and medical care for older people not only in the United States but also in many other countries. To ease these strains, policy discussions here and elsewhere have more and more focused on an increase in Social Security retirement ages and incentives for older individuals to remain in the labor force. An important backdrop for these discussions is that older people in general are able to work later in life than earlier generations. This section considers several metrics that bear on the capacity to work at older ages. Here the committee emphasizes measures of health and capacity to work at or near typical retirement ages. Chapter 4 gives more attention to health and disability at older ages.
Mortality and Other Measures
Figure 5-5 shows two trends. The first is the relationship between age and employment for men in 1977 and 2007 (Milligan and Wise, 2011). The employment rate by age did not change much between the two years, at least through age 64. Specifically, as highlighted by the box in Figure 5-5, the employment rate at ages 62 and 63 changed very little between 1977 and 2007. But the male mortality rate at these ages declined substantially between 1977 and 2007. For example, the mortality rate for men aged 63 was 2.6 percent in 1977 but had fallen to 1.5 percent by 2007.
Figure 5-6 presents a different view of the data. This figure shows the employment rate by mortality rate in 1977 and 2007, together with ages corresponding to selected mortality rates. For example, consider the mortality rate of 1.5 percent on the x axis. In 1977, this was the mortality rate for men at age 57, and 80 percent of men were working at that age. In 2007, 1.5 percent was the mortality rate for men at age 63, and only 50 percent of men were working at that age. In other words, the probability of being employed when the mortality rate was 1.5 percent was 0.8 in 1977 and 0.5 in 2007.3 On average, men aged 63 worked 0.3 fewer years in 2007 than
_____________
3Looking at the data another way, consider the 50 percent employment level for men. In 1977, the mortality rate when 50 percent of men were employed was 2.7 percent; 30 years
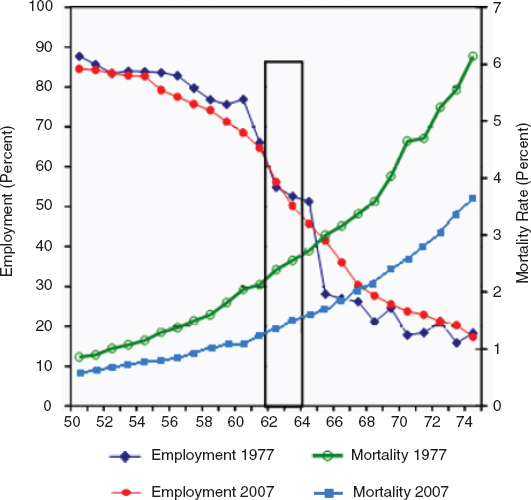
FIGURE 5-5 Male employment and mortality by age, 1977 and 2007. SOURCE: Milligan and Wise (2011).
they did in 1977. If we add up such differences from age 55 to age 69, men in this age group worked on average 3.7 fewer years in 2007 than in 1977 (8.3 versus 12.0 years, a decline of 31 percent). Or, if at each mortality rate, men in 2007 worked as much as men in 1977, employment in the 55–69 age range would have been approximately 45 percent greater than it was. This metric suggests that there is unused capacity to work at older ages today.
Figures 5-5 and 5-6 highlight the changing relationship between mortality and employment. Mortality lends itself to these comparisons because mortality is comparable across time and across countries. Other potential measures of health status are not comparable across countries and may not be comparable across time within countries. Nonetheless, the committee also would like to explore the relationship between mortality and another
_____________
later, in 2007, the mortality rate was only 1.5 percent. That is to say, for the employment rate to be 50 percent in 2007, men “had to be” much healthier (by the mortality measure) than they were in 1977.
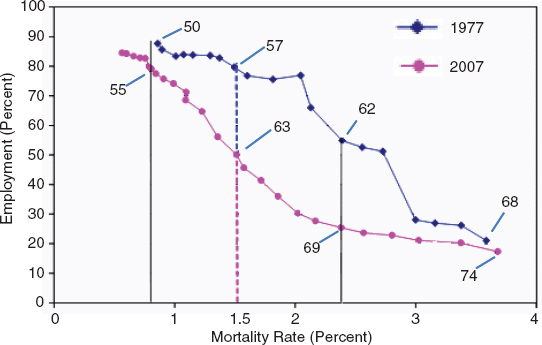
FIGURE 5-6 Employment by mortality for men, 1977 and 2007. SOURCE: Milligan and Wise (2011).
commonly used summary measure of health status, self-assessed health (SAH) status. These two measures are compared in several ways. The committee first compares SAH and future mortality in the United States. Second, it compares mortality-equivalent ages over time with SAH-equivalent ages over time. Third, it considers the time trend relationship between mortality and SAH within countries and combines the comparisons to estimate the cross-country relationship between the change in mortality over time and the comparable change in SAH over the same time period.
Self-Assessed Health and Future Mortality in the United States
Data from the U.S. Health and Retirement Study (HRS) can be used to illustrate the relationship between SAH and mortality. Table 5-1 shows, for each of five SAH categories in 1992, the proportion of men and women who were deceased by 1996, 2002, and 2008. These HRS data clearly indicate that SAH in 1992 was strongly predictive of subsequent mortality. For example, of men who reported that they were in excellent health in 1992, 11.4 percent were deceased by 2008. On the other hand, of men who reported that they were in poor health in 1992, 57.9 percent were deceased by 2008.
TABLE 5-1 Percent of Initial (1992) HRS Respondents Deceased by 1996, 2002, and 2008, by Self-Reported Health Status in 1992
| Self-Reported Health Status in 1992 | |||||
| Excellent | Very Good | Good | Fair | Poor | |
| Men | |||||
| 1996 | 1.0 | 1.5 | 2.1 | 4.3 | 10.8 |
| 2002 | 5.8 | 7.2 | 13.3 | 22.1 | 36.9 |
| 2008 | 11.4 | 15.6 | 25.8 | 36.5 | 57.9 |
| Women | |||||
| 1996 | 0.4 | 0.8 | 0.8 | 2.1 | 4.2 |
| 2002 | 2.6 | 5.4 | 7.1 | 15.2 | 24.4 |
| 2008 | 6.4 | 10.3 | 15.2 | 28.8 | 36.8 |
SOURCE: Milligan and Wise (2011).
Mortality-Equivalent Ages versus SAH-Equivalent Ages
“Mortality-equivalent ages” are defined as the ages at which the mortality rate was the same in different years. “SAH-equivalent ages” are defined similarly but are based on self-assessed health rather than mortality. Figure 5-7, which compares these two measures, shows that a person aged 67 in 2007 had about the same mortality rate as a person aged 60 in 1977,
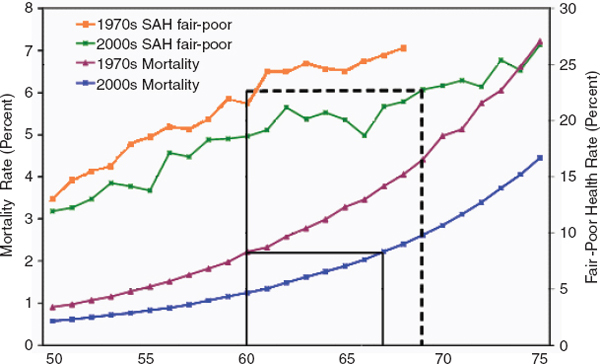
FIGURE 5-7 Mortality and self-assessed health, 1970s and 2000s. SOURCE: Milligan and Wise (2011).
a difference of 7 years. The figure also shows that men who were 69 in the 2000s had about the same SAH as men who were 9 years younger (age 60) in the 1970s. Thus in this example there was a greater difference in age-equivalent SAH than in age-equivalent mortality (about 9 versus 7 years).
Cross-Country Comparisons of Change in Mortality and Change in SAH
Figure 5-8 summarizes the SAH-mortality relationship across 11 countries for which both series are available over a sufficient time period. It compares the percent change in “fair or poor” health with the percent change in mortality. For each country, the time period spans the year of the first SAH observation to the year of the last SAH observation. For example, the period for the Netherlands is 1983 to 2008, and the percent changes in SAH and in mortality are changes between the 1983 and 2008 values. For the nine countries that report the proportion in fair or poor health, there is a close relationship between the change in mortality and the change in SAH.4 This suggests a fairly tight within-country relationship between improvements in mortality and improvements in SAH, providing a link between the committee’s earlier mortality analysis and one commonly used health measure. The committee emphasizes, however, that the level of SAH varies greatly from country to country, consistent with substantial country-specific SAH response effects.
Potential for Work in the United States
Available estimates of the future workforce, such as those produced by the BLS, assume a healthy population and do not account for a number of factors that are known to be associated with participation in the workforce, including functional impairment (Toossi, 2009). An alternative approach is to estimate the potential for work at older ages. The committee considers two such approaches here.
Cutler, Meara, and Richards-Shubik (2011) estimate the relationship between labor force participation on the one hand and demographic and health characteristics on the other for persons aged 62–64. Then they use these estimates to simulate the potential labor force participation for persons aged 65–69, which they call “capacity for work.” Results for men with a high school degree or less and for men with any college are shown in Figure 5-9. The observed labor force participation, which is affected by Medicare eligibility and Social Security provisions, is compared with the
_____________
4The data points for France and the United Kingdom use different measures of health; the latter reports the percent in bad health and the former reports the average of a 10-point scale of health status.
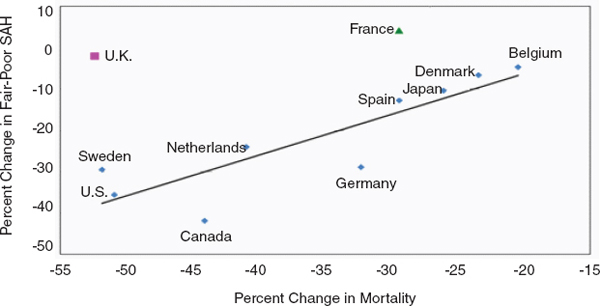
FIGURE 5-8 Percent change in “fair-poor” health and in mortality, men aged 60–64 in 11 countries. SOURCE: Milligan and Wise (2011).
simulated participation, which does not account for the effect of Medicare or Social Security provisions on retirement. For both education groups the simulated labor force participation is substantially higher than the observed rate—53 versus 35 percent for the high school or less group and 60 versus 38 percent for the any-college group. In other words, the capacity to work
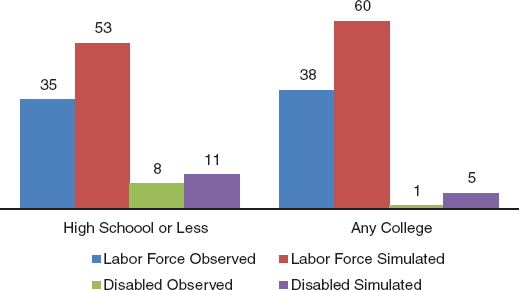
FIGURE 5-9 Labor force participation and disability rates for men aged 65–69, by education, 2000–2003. SOURCES: Based on data from the National Center for Health Statistics multiple-cause-of-death file; public-use 2000 sample census data from the U.S. Census Bureau; and data from the Medical Expenditure Panel Survey; see Cutler, Meara, and Richards-Shubik (2011) for further details.
was 51 percent greater than the actual level for high school graduates and 58 percent greater than the actual level for those with any college education. The simulated proportion for disability is also higher than the observed proportion, but the difference is very small relative to the difference in labor force participation.
A second approach, which builds on the Cutler, Meara, and Richards-Shubik analysis, was produced by a team of researchers commissioned by the committee (Rehkopf, Adler, and Rowe, 2011). The approach first considers the proportion of the population working with the proportion not working but with different levels of functional impairment. Figure 5-10 shows the distributions of men and women who are (1) working, (2) not working and with major impairment, (3) not working and with minor impairment, and (4) not working and with no impairment. These proportions are based on the average of data from nine waves of the HRS. Major impairment is defined as having limitation in one or more activities of daily living (ADL) or instrumental activities of daily living (IADL). Minor impairment is defined as not being able to do one of the following: walk several blocks, climb a flight of stairs, sit for 2 hours, and stoop, kneel, or crouch (Crimmins and Beltrán-Sánchez, 2011). As expected, the proportion of persons working is lower at older ages, and the proportion of persons with major or minor impairment is greater at older ages. However, with advancing age, large fractions of the population who are not working have
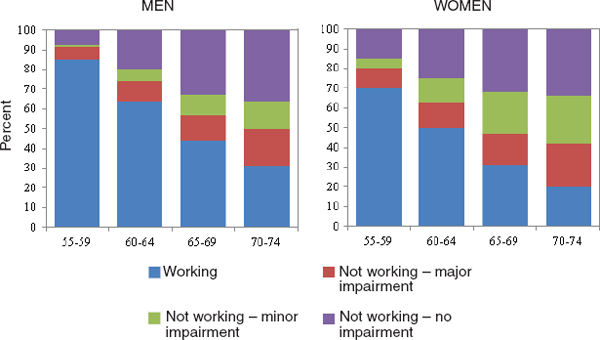
FIGURE 5-10 Percent of older population working and not working, by age and sex, composite HRS data for 1992 to 2008. SOURCE: Rehkopf, Adler, and Rowe (2011).
no impairment. For example, among men aged 65–69 who are not working, more than half have no impairment. Even at ages 70–74, half of men not working have no impairment. These data suggest that the capacity to work is substantially greater than the proportion actually working at older ages. Furthermore, while mild disability increases the likelihood of not working, many individuals with such impairments are able to continue in the workforce.
The Rehkopf, Adler, and Rowe study also made predictions of the potential workforce aged 20–74 between now and 2050, based on an evaluation of the impact of various independent predictor variables (race, ethnicity, education, father’s and mother’s level of education, occupation, major impairment, minor impairment, obesity, diabetes, cancer, heart disease, and stroke) on current work status using HRS data, and on projected labor force data described in Appendix A. The study considered three different assumptions about the change in disability rates in coming years: a 1 percent annual increase, no change, and a 1 percent annual decrease. Assuming no change in disability, the study forecasts a slight decrease from the current 91 percent capacity to work to 89 percent capacity to work in 2050 among the population aged 20–74. This decline reflects changes in the projected composition of the population with respect to the predictor variables. Assuming a 1 percent annual decrease in disability, the study finds a modest rise in the capacity to work over the next four decades. Only under the assumption of a 1 percent annual increase in disability is there a significant decline in the potential workforce.
In short, the evidence suggests that there is substantial potential for increased labor force participation at older ages. There has been a large decline in death rates over the past three or four decades and a corresponding improvement in self-assessed health. There has been a substantial increase in mortality-equivalent ages. For example, a person aged 67 in 2007 had about the same mortality rate as a person aged 60 in 1977. In addition, estimates of the capacity for work at older ages suggest that the potential for work is much larger that the proportion of persons actually working.
FACILITATING LONGER WORKING LIVES
Perhaps the two most important ways to facilitate longer working lives are (1) to eliminate the incentives in Social Security and private pension plans that encourage early retirement and penalize work at older ages and (2) to abandon the “fixed number of jobs” view of the labor market that has served as a rationale for maintaining program provisions that encourage older persons to leave the labor force. These issues are addressed in turn. The chapter then turns to analysis based on defined benefit (DB) plans in the United States, which have the same incentives as the social security
program incentives in many countries. It then considers other issues that may promote or inhibit work at older ages.
Effect of Social Security Plan Provisions on the Incentive to Retire
Very strong evidence on the effect of pension plans on retirement is provided by cross-country comparisons of social security programs, which often have incentives like those inherent in employer-provided DB pension plans. The evidence presented is based on a coordinated set of studies conducted by analysts in each of the 12 countries in the International Social Security Project (e.g., Gruber and Wise, 1999 and 2007).
To assess the incentives for early retirement in each country’s program, a measure of these incentives called the “implicit social security tax” was developed. It summarizes the extent to which earnings from working one additional year (rather than retiring) are offset by the forgone pension benefit. To understand this measure, one might think of wage compensation from working an additional year as having two components. The first is earnings from wages, and the second is the increase in the expected present discounted value of future social security benefits. One might normally expect this difference to be positive, or at least not negative. In other words, if someone works one additional year and thereby receives one less year of benefits, it might be expected that when benefits begin one year later, they are increased sufficiently to offset the fact that they are received for one less year. For example, if the typical U.S. worker does not claim Social Security benefits at the earliest possible age (62) and instead works another year, benefits in subsequent years are increased by 6.7 percent to account for the fact that they will be paid for one less year.
In most of the countries covered by the International Social Security Project, however, benefit accrual is negative. This is due in large part to the fact that benefits are not increased sufficiently when benefit receipt is postponed, i.e., benefits are not actuarially fair. Therefore, a worker’s gain in extra wage earnings is partially, or even largely, offset by a loss in eventual social security benefits. The ratio of this loss to wage earnings (after tax) is called the social security implicit tax on earnings. In many countries this tax can amount to 80 percent or more at some ages.
To provide a simple summary of country-specific incentives for early retirement, the implicit tax rates on continued work are summed from age 55 or from the early retirement age—when a person initially is eligible for social security benefits—through age 69. This measure is called the “tax force to retire” (Gruber and Wise, 1999). The relationship between the tax force to retire and the proportion of men aged 55–65 not in the labor force is shown in Figure 5-11. There is a striking correspondence between the tax force to retire and men out of the labor force (unused labor capacity).
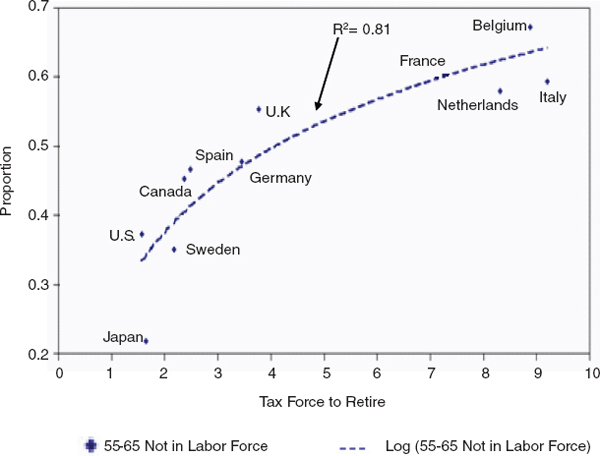
FIGURE 5-11 Tax force to retire and proportion of men aged 55–65 out of the labor force, 11 countries, circa 1995. SOURCE: Gruber, Milligan, and Wise (2009).
This suggests that social security incentives to retire are an important cause of the low labor force participation of older workers. An equally important result from this early project work is that when thinking about incentives to retire, it is critical to include disability insurance and special unemployment insurance programs as well as social security programs per se, because disability and special unemployment programs often serve as early retirement programs before the social security early retirement age.
The “Fixed Number of Jobs” View of the Labor Market
The original impetus for plan provisions that encouraged older persons to leave the labor force is unclear. It is now frequently claimed that such provisions were designed to generate more jobs for younger people, the assumption being that having fewer older persons in the labor force would translate into more opportunities for the young. This reasoning is also used against efforts to reduce or eliminate incentives for older workers to leave the labor force, by arguing that an increase in labor force participation
at older ages would reduce employment among younger people. Here the committee refers to this claim as the “fixed number of jobs” assumption,5 drawing on the International Social Security Project for evidence on whether more work by older people reduces job opportunities for younger people.
At first glance, it seems clear that the number of jobs in economies is not fixed. “The flow of women into the labor force in the past few decades has increased the size of the labor force enormously in many countries. For example, the number of women in the labor force in the United Stated increased by almost 48 million between 1960 and 2007, from about 34 to 46 percent of the labor force. But the employment rate of men changed little as the proportion of women employed increased.” (Gruber, Milligan, and Wise, 2009, p. 7)
The International Social Security Project considered several different ways of assessing the relationship between the employment of the old and the young. The various estimation methods yielded very consistent results and found no evidence that lowering employment among older people would generate more employment opportunities for younger people. Further, there was no indication that an increase in the employment rate for older people reduces employment opportunities for younger people. For example, Figure 5-12 is the same as Figure 5-11, except that it also shows the unemployment rate of youth aged 20–24 (based on data for an approximately 15-year period centered on 1995).
If the incentives that reduced the share of older people in the labor force were to increase employment opportunities for younger people, it seems likely that the tax force to retire would be related to the employment rate of younger people. That is, a greater tax force to retire should correlate with lower youth unemployment. In fact, however, there is a positive relationship between the tax force to retire and the unemployment of young men across countries. The greater the tax force to retire, the greater is youth unemployment. Further, a greater tax force to retire is associated with a lower youth employment rate. These findings offer no evidence to support the proposition that encouraging older people to leave the labor force frees up jobs for younger people.
A second way to assess the relationship between the employment of the old and the young is to consider within-country “natural experiment” estimates of this relationship. In some cases, one can compare employment trends for younger and older workers that preceded a social security reform with trends after the reform and assess (1) the impact of the reform on the
_____________
5This is often referred to by economists as the “lump of labor” theory. It was termed the “boxed economy” view in the International Social Security Project. Taken literally, this theory posits that if one additional older worker is employed, one younger worker has to be displaced. This implies that economies are boxed and that the size of the box cannot change.
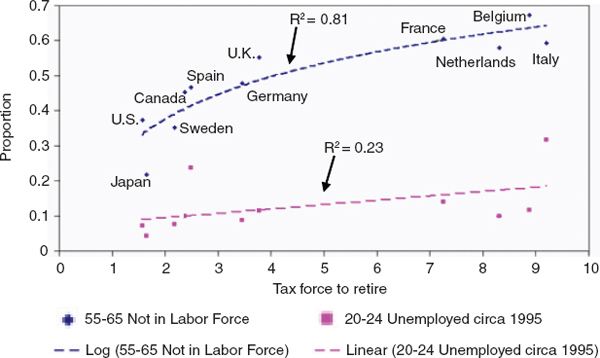
FIGURE 5-12 Tax force to retire, proportion of men aged 55–65 out of the labor force and proportion of youth aged 20–24 unemployed, circa 1995. SOURCE: Gruber, Milligan, and Wise (2009).
labor force behavior of older workers and (2) the relationship between the impact on older workers and the impact on younger workers.
A reform in Denmark provides a clear example (see Figure 5-13). In 1979, the Danish government introduced the Post-Employment Wage program, a labor market policy program intended to redistribute physically demanding jobs from older workers to unemployed younger workers. Before this reform, the youth employment rate had been rising while the youth unemployment rate changed little since 1975. Hence it seems unlikely that the reform was precipitated by a decline in the employment rate or an increase in the youth unemployment rate. Between 1978 and 1983 the employment rate for men aged 61–65 decreased by nearly 23 percentage points, a drop of 35 percent. During the same time period the employment rate for people aged 20–24 decreased by about 4 percentage points and the youth unemployment rate increased by about 4 percentage points. This natural experiment belies the fixed number of jobs proposition.6
_____________
6This example does not specifically address the issue of the business cycle, which may or may not have had an impact on the results. The study does, however, discuss endogeneity issues and notes that “economic shocks to the economy are likely to induce parallel movements in both the employment of the old and the employment of the young. [The study sought] to evaluate the effect of precipitating events that seek to induce older persons to leave the labor force, without a contemporaneous influence on the employment of the young (unlike macro economic shocks that tend to affect both simultaneously)” (Gruber, Milligan, and Wise, 2009, p. 23).
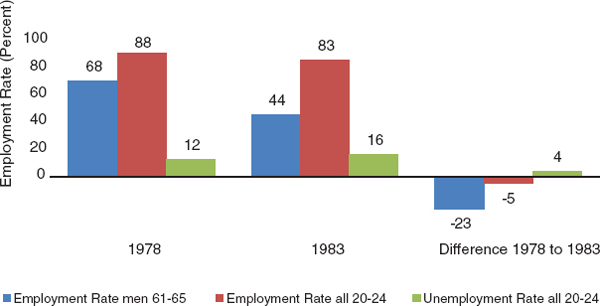
FIGURE 5-13 Response to the 1979 Post-Employment Wage reform in Denmark. SOURCE: Gruber, Milligan, and Wise (2009).
Gruber, Milligan, and Wise (2009) cite similar natural experiments for other countries that reveal the same thing. Several additional methods have been used to assess the relationship between the employment of the young and the old. In short, natural experiments and other methods of analysis all lead to the same conclusion and “provide no support for the boxed economy proposition. Indeed, the weight of the evidence suggests that increasing the employment of older persons provides more job opportunities for younger persons and reduces the unemployment rate of younger persons.” (Gruber, Milligan, and Wise, 2009, p. 64). The finding is consistent with earlier work showing that older and younger workers are actually complements, not substitutes (Levine and Mitchell, 1988).
Private DB Pension Plans Offer Large Incentive Effects to Retire Early
The social security retirement incentives described above result from the way in which the social security DB is determined in each country. Employer-provided DB pension plans typically have similar retirement incentives. DB pension plans are still common in the United States and are particularly important for state and local government employees, even as the proportion of employees covered by personal retirement plans such as 401(k) plans is rising rapidly. DB plans are also common in Canada and in the United Kingdom, and they underpin the employer-based system in the Netherlands. Thus, in some countries the incentive effects inherent in these plans can also have a large effect on labor force participation (Stock and Wise, 1990a and 1990b; Gustman and Steinmeier, 2002).
Just as for social security incentives, the key issue is this: If the receipt of benefits is delayed for a year, are benefits increased enough to offset their receipt for one less year? Is the benefit formula actuarially fair? Under the typical employer-provided DB plan in the United States, the answer is no. Benefits are not increased sufficiently to offset receipt for one less year. Thus, the plans impose a large implicit tax on work, just like the implicit tax described above for social security defined benefits. Indeed, the analysis of retirement incentives inherent in employer-provided DB plans in the United States led to the international comparison project that produced the results discussed above. The following discussion provides some information on the incentive effects of employer-provided plans. It does not attempt to draw from all the many studies that address this issue.
Until the mid-1990s, one of the important economic trends in the United States was the withdrawal of older persons from employment. This trend was surely made possible by the advent of the Social Security program and by the concurrent spread of employer-provided pension plans. Most of the pension plans were DB plans in which the benefit at retirement depended on years of service and earnings (usually those during the last years of employment).
Stock and Wise (1990a and 1990b) used company data to develop and estimate a formal model of retirement based on the option value retirement model. The model’s central feature involves recognition of the significant effect on retirement of the future accrual pattern of pension benefits. A series of subsequent papers found similar behavioral responses to plan incentives among men and women and among different types of employees (see, e.g., Lumsdaine, Stock, and Wise, 1997).
Looking at social security systems in different countries was analogous to looking at the effects of different employer-sponsored pension plans (with varying provisions) in the United States. Indeed, the retirement responses to social security plan incentives to retire correspond very closely to the incentive inherent in the employer-provided DB plans.
401(k)-Like Plans Have None of These Incentive Effects
Since the early 1980s there has been a rapid conversion to 401(k) plans in the private sector and a movement away from DB plans. The data are shown in Figure 5-14. People can of course participate in more than one type of plan. The 401(k) plans and other personal accounts such as individual retirement accounts (IRAs) have none of the incentive effects of DB plans and in particular none of the early retirement incentives inherent in DB plans. Since DB plans had typically provided a strong inducement to retire early, it should be expected that the decline in DB plans reduced the incentive to retire early. Thus the advent of personal accounts probably was
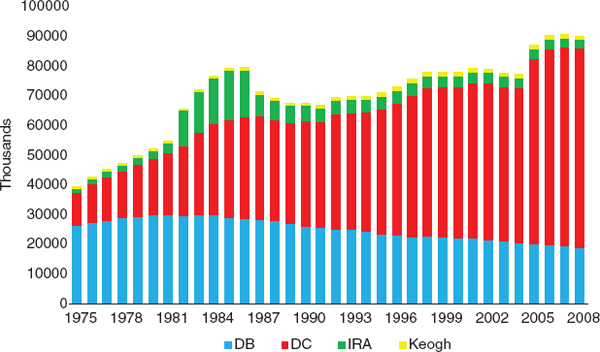
FIGURE 5-14 Pension plan participants in the private sector by plan type, 1975–2008. SOURCES: Data for defined benefit (DB) and defined contribution (DC) from Department of Labor, Form 5500; data for individual retirement accounts (IRAs) and Keogh plans from Internal Revenue Service, Statistics of Income.
one reason for the increase in the labor force participation of older workers since the mid-1990s.
State and Local DB Plans Have Strong Incentives to Retire Early
While there has been a rapid conversion to personal retirement accounts in the private sector, DB plans with strong early retirement incentives are still common among federal, state, and local employees. Figure 5-15 shows the trend in the federal (nonmilitary) sector. There is less time-series information on DB versus DC coverage for the state and local sectors. Except for a few scattered plans in higher education, there were no DC plans in state government until 1996. By 2010, 13 states offered their employees a DC plan (typically a secondary plan). Recently, Michigan and Alaska required all new employees to participate solely in a DC plan, but in these states the primary plan for earlier hires is still DB.
The best state and local data are from the BLS compensation surveys. The 2010 survey of state and local governments found that 90 percent offered retirement benefits, with 85 percent participating; that 84 percent offered a DB plan, with 79 percent participating; that 29 percent offered a DC plan, with 17 percent participating; and that most persons who were offered a DC plan were also offered a DB plan.
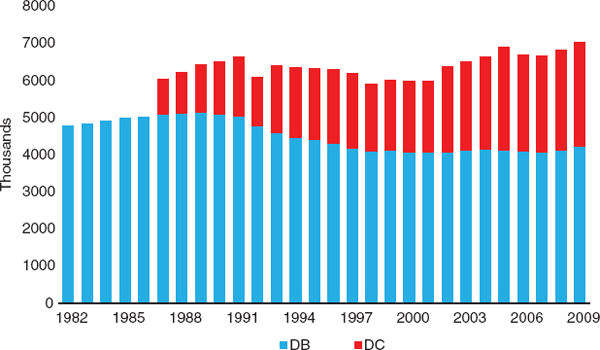
FIGURE 5-15 Pension plan participants in the federal sector, by plan type, 1982–2009. SOURCE: Employee Benefit Research Institute, Databook on Employee Benefits, various years.
Reducing the Cost of Employing Older Workers
It is not well known that older workers in the United States face higher effective tax rates than younger workers. For instance, the 15.3 percent Social Security and Medicare payroll tax is often a pure tax on work for those aged 60 and over (Goda, Shoven, and Slavov, 2011). That is, while younger workers accrue additional Social Security benefits from the payroll taxes they pay, older workers have often already worked the 35 years that count toward Social Security benefits. Depending on their remuneration, older workers may earn no incremental retirement benefits or Medicare benefits for continuing in the workforce. The employer and employee halves of the payroll tax combine to create a 15.3 percent wedge between wages and the worker output.
Many ways have been proposed to decrease the implicit tax on work for older workers (see, e.g., Butrica et al, 2006; Goda, Shoven, and Slavov, 2009; Kotlikoff and Wise, 1988). This report does not evaluate these options but does present two illustrative examples. One way to lessen the effect would be to create a new category of worker: “paid up.” After 35 or 40 years of covered work experience, the payroll tax would be eliminated. Such workers would be paid up. One principle would be that every year of earnings either counts towards Social Security benefits or is not subject to the payroll tax. Removing a 15 percent wedge between the employer’s cost
of employment and the employee’s net wage would be equivalent to an 18 percent increase in net pay.7
For many workers aged 65 and over there is an even larger implicit tax. If they work for an employer with an employee health insurance benefit and more than 20 employees, then Medicare steps aside and lets the employer-sponsored health plan cover the worker. This policy is called Medicare as a secondary payer. Depending on the incidence of the employer-sponsored health insurance, it is likely that employees pay for health insurance even though they are otherwise eligible for Medicare. This creates another large gap between the employer’s cost of employing an older worker and the employee’s net wage. This wedge varies by age, gender, wage, and other factors and can easily average 30 percent (Goda, Shoven, and Slavov, 2007). In combination with the payroll tax, the total wedge from these two sources can approximate 45 percent. An alternative policy would be to grant Medicare benefits to workers aged 65 and over whether their employer has a health plan or not. This policy could be termed Medicare as a primary payer. Eliminating the entire 45 percent wedge would increase net wages by over 80 percent.
Retiree Health Benefits
The substantial connection between health insurance and employment may prompt many U.S. workers to delay retirement until they are eligible for Medicare at age 65. Some employers provide health insurance to retired workers, and those who can receive such insurance may not need to wait until age 65 to retire with group health coverage. Nyce et al. (2011) investigated the relationship between retiree health insurance and early retirement using data from 64 diverse company clients of Towers Watson, a prominent benefits consulting firm. They found that retiree health coverage has a strong effect on retirement. For example, a generous employer contribution of 50 percent or more lowered the number of person-years worked between ages 56 and 64 by 9.6 percent compared to those with no coverage. This question may be particularly important in light of the health reforms enacted in 2010, which if implemented will weaken the connection between employment and health insurance by making group coverage available to all regardless of work status.
_____________
7It should be noted that while a policy involving paid-up workers could help to raise labor force participation among older persons, it might have a deleterious effect on the imbalance in the Social Security trust fund. A similar concern could arise with respect to the idea of Medicare as a primary payer.
Gradual Retirement
An important way to facilitate longer working lives is to adopt policies and practices that allow workers (and employers) greater flexibility with respect to hours worked and give people more control over job responsibilities and demands as they age. There is substantial anecdotal evidence that many older workers would prefer to work half-time, for example. As noted earlier in this chapter, gradual retirement in the United States is becoming more common. Older workers are more likely than younger workers to work part-time, and the proportion of older workers employed part-time increases with age. Sixty percent of both men and women who had left full-time employment after age 50 by 2008 had moved to a “bridge” job, with more than half of such jobs being part-time (Quinn, Cahill, and Giandrea, 2011). Many of the bridge jobs pay less than the earlier full-time jobs.
Related to this discussion is the need to consider and promote training, retraining, and continuing education for older workers. Some studies of demand and prevalence in these areas are under way, but the empirical basis for understanding how common and effective such measures have been is still lacking. One of the committee’s research recommendations in Chapter 10 encourages data collection and analysis of the facilitation of work at older ages.
MACRO IMPLICATIONS OF LONGER WORKING LIVES
The changing demographic environment over the past five decades is on the one hand an achievement and on the other a problem. Chapter 3 explained that mortality rates have declined and life expectancy has increased substantially in industrialized countries. This is the achievement. The problem is that falling birth rates and fewer young people, combined with increased longevity, mean that the ratio of old to young is rising. An increasing number of older people means that health care costs will rise not only because of sheer numbers but also because technology will likely lead to improved and probably more expensive treatment. And while the cost of public pensions rises, there is the prospect of fewer persons in the labor force to pay for the rising pension and health care costs.
How might the increasing imbalance between the rising proportion of older people and the declining proportion of young people be accommodated? Part of the solution would be to leverage the gains in longevity by increasing the employment rate of older people. This would increase the number of people in the workforce and lower the number of retirees that workers help support.
But as noted earlier, until the mid-1990s the trend was just the opposite. The employment rate for older persons in the United States was
dropping, which made it increasingly difficult for the labor force to support those who had retired. In the United States, the median number of years in retirement for men increased nearly 50 percent between 1965 and 2003, from 13 years to almost 19 years. Roughly half of these additional years were related to gains in life expectancy and the other half to earlier retirement (Goda, Shoven, and Slavov, 2009). In other industrialized countries, the trend has been more extreme. Figure 5-16 shows the percent increase in life expectancy at age 65 together with the percent decline in the labor force participation of men aged 60–64 in the 12 countries participating in the International Social Security Project. In all of the countries life expectancy has increased and in all of the countries labor force participation has declined, although there is substantial variation across countries.
What is the gain from prolonged labor force participation? An increase in the labor force participation of older persons will increase production (gross domestic product). Increased production will increase tax revenues, which should in turn increase available funding for social security and health care. In addition, personal savings may increase with longer working lives. This would essentially happen by default with 401(k)-like personal retirement accounts. Because a large portion of private saving is through personal retirement accounts, this effect may offset the possibility that some persons would save less because they anticipated the need to support fewer retirement years. In the United States, an increasingly large proportion of resources has been going to health care and pensions for older persons. If the resources of the country are to advance in future years, the education of the current young is of critical importance. If the working lives of older people lengthen, not only will there be more resources to pay Social Security
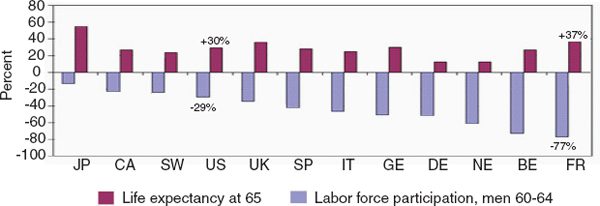
FIGURE 5-16 Increase in life expectancy and decline in labor force participation in 12 countries, 1960s to early 2000s. JP-Japan; CA-Canada; SW-Sweden; US-United States; UK-United Kingdom; SP-Spain; IT-Italy; GE-Germany; DE-Denmark; NE-Netherlands; BE-Belgium; FR-France. SOURCE: Data compiled as part of the National Bureau of Economic Research International Social Security Project.
and health care costs, but also more resources will be freed up to pay for the education of the young.
Of course, there may be trade-offs for later retirement ages. Data from the Health and Retirement Study show that roughly one-fourth of workers aged 60–61 report a health condition that limits their work capability. Raising the early retirement age would delay benefit eligibility and might lead older people with job-limiting health conditions to seek disability insurance rather than waiting to claim retirement. Raising the full retirement age would reduce retirement benefits for people who retire early and might generate a financial incentive to seek disability insurance benefits, which are not reduced (Government Accountability Office, 2010).
Nevertheless, two key ingredients are critical to facilitating longer working lives. First, penalties on work at older ages—found in the provisions of many employer-provided DB pension plans and in many national social security programs—that encourage older people to leave the labor force would have to be eliminated. In the United States these provisions have been reduced by the conversion to 401(k) and other personal retirement accounts. But DB pension plans are still common for state and local employees, who typically have very generous plans with strong inducements to retire early. Second, a false rationale—the assumption of a fixed number of jobs in the economy—used to maintain provisions that encourage older people to leave employment would have to be abandoned. In addition, it will be important to understand which work arrangements, such as flexible working hours, would facilitate work by older persons and to assess the potential of employers to accommodate such arrangements.
Finally, automatic adjustment of Social Security benefits may help accommodate the force of demographic change. Many analysts have suggested that retirement ages be indexed to longevity. By 2009, 13 out of 30 OECD countries had introduced automatic links of pension benefits to life expectancy in their public pension systems (OECD, 2009). Systems in Sweden and Italy link benefits to life expectancy, the dependency ratio, and wage growth. Germany has maintained a DB system but bases benefits on a “sustainability factor.” Annual benefit changes are determined by changes in gross earnings minus contributions to the pension system and by changes in the dependency ratio (Boersch-Supan, Reil-Held, and Wilke, 2007; Boersch-Supan and Ludwig, 2010). As noted elsewhere in this report, however, policies that link retirement ages (particularly the full retirement age) to overall life expectancy might lower benefits disproportionately for those with a shorter life expectancy, a less than desirable distributional effect.


