
An assessment of the global landscape for research and development (R&D) of advanced computing—especially efforts to address the computing performance challenges outlined in Chapter 1—must include an examination of research efforts related to the technologies described in Chapter 1, including semiconductor devices and circuits, architecture, programming systems, and applications. Further, assessing the global competitiveness in these technologies requires examination of both advanced research and development as well as how successful commercialization of these technologies has been and for whom.
Research capability is a leading indicator for a nation’s future technical competitiveness in science-intensive technological fields. For the purposes of this report, a nation’s research capabilities include the education provided by and output from universities as well as the training by and output from industry and government laboratories. This chapter examines two broad indicators to assess national technological research capabilities and competitiveness: (1) commercialization of semiconductors, as well as computing hardware and software, technologies; and (2) bilateral trade revenues from U.S. exports and imports of advanced electronics and technology products critical to the computing performance challenges described in Chapter 1.
The committee also conducted a pilot study of a third indicator: national contributions of papers at top technical conferences. In computer science, papers presented at conferences are an important (and often underused) measure of research quality, in addition to journal articles. The committee analyzed authorship—specifically, authors’ geographical locations—of papers at many of the top technical conferences in the four research areas most closely related to the challenges outlined in Chapter 1: semiconductor devices and circuits, computer architecture, programming systems, and applications. The pilot study included an analysis of data from papers presented at 2011 conferences in these four research areas and a similar analysis of conference papers from 1996–2011 to show recent changes in representation at these conferences. The complete results of the pilot study, along with a methodological overview and discussion of its limitations, are discussed in Appendixes F and G.
Section 2.1 provides a brief snapshot of some preliminary observations and insights that can be gleaned from the pilot study. Section 2.2 uses the conference publication data to examine how the international collaborative nature of these conference papers has changed over time. Section 2.3 provides a description of the global landscape in commercialization of semiconductor, as well as computing hardware and software, technologies. Section 2.4 presents an analysis of bilateral (U.S.-China, -Korea, -Taiwan, and -Japan) trade data for U.S. exports and imports of electronics and products specifically relevant to the computing challenges outlined in Chapter 1. Lastly, Section 2.5 examines China’s growing role as a major consumer and supplier of semiconductors, as well as its contribution to the global semiconductor value chain.
2.1 Preliminary Observations from Pilot Study of Papers at Top Technical Conferences
The committee encountered some methodological challenges in its analysis of publication data from conference papers (for example, determining whether the location of a conference can introduce travel biases for researchers), making it difficult to draw concrete conclusions about the technological research capabilities
of individual countries. There are some interesting observations about overall trends and emerging strengths, however, which can be made from this preliminary analysis.
2.1.1. Current (2011) national and regional advanced computing research contributions at top technical conferences
The committee’s preliminary assessment of conference papers at selected technical conferences in 2011 indicates that the United States is strongly represented in each of the four research areas identified by the committee as critical for meeting the computing performance challenges outlined in Chapter 1 (semiconductor devices and circuits, architecture, programming systems, and applications), contributing more than half of all papers across each research area. Of these areas, the United States has the strongest representation in architecture research with no other individual nation contributing as significantly. These data are consistent with the historical U.S. strengths in commercial microprocessors, including Intel, AMD, and IBM, as well as former commercial microprocessors from DEC, HP, and others (see Table F-5). The committee notes, however, that the UK-based ARM processor ecosystem now dominates by processor shipment volume, largely based on smartphones and embedded devices.
Limited or no representation at architecture research conferences may suggest that some nations’ universities and industry research institutions are not focused on mainstream computer architecture. For example, while Japan has activity and expertise in architecture research, notably the custom processors from Fujitsu that are in the K supercomputer, the data suggest its national research focus may lie in other areas such as advanced semiconductor and nanoscale devices and circuits (see Table F-4). As another example, Germany and the U.K., while poorly represented at architecture research conferences, have notable representation in advanced programming research (see Table F-6).
Several interesting observations can also be made about regional representation at these conferences. For example, while the United States maintains a significant lead over Europe and Asia in paper contributions at semiconductor and nanoscale devices conferences, its contributions in semiconductor circuits research are comparable to Europe and Asia. In programming systems and applications, the United States maintains a lead followed by Europe and distantly by Asia. See Figures F-2 through F-6.
2.1.2 Time series assessment of national and regional advanced computing research contributions at top technical conferences
Longitudinal analysis of conference data from 1996–2011 also provides insight into trends in national (see Tables F-8 through F-11) and regional (see Figures F-7 through F-11) contributions to advanced research. During this time, for the two conference series (IEDM and NANO) in the semiconductor devices area, the U.S. lead has remained relatively stable with the largest gains made by Taiwan and Belgium (IMEC). For the ISSCC conference series in semiconductor circuits research, the United States shows a moderate decline, in tandem with an overall broadening in international representation. In this area, the largest leaps were made by Korea, Taiwan, and the Netherlands. For the four conference series (ASPLOS, HPCA, ISCA, and MICRO) in architecture research, the United States has maintained a significant lead, with no major advances by any other nation or region.
For the five conference series (ECOOP, OOPSLA, PLDP, POPL, and PPoPP) in programming systems research, the U.S. lead has been challenged somewhat by increases in Europe by small but steady gains by Israel, Switzerland, and the UK (as well as by China, India, and Korea to a lesser degree). For the seven conference series (Eurographics, OSDI, SC, SIGGRAPH, SOSP, VLDB, and WWW) in applications research, U.S. representation has retained a stable lead over the 15-year period with no significant representation by other nations. While only representing a small percentage of papers in the applications research areas, China moved from no representation in 1996 to ~4 percent of conference papers in 2011.
Strong R&D investments by U.S. universities and industry laboratories over the last 15 years have yielded numerous innovations and have helped to sustain the United State’s position as a lead contributor of conference papers across the four specific technology areas identified by the committee. Despite this fact, the U.S. position is now being challenged by increasing technical and manufacturing capabilities in Europe and, in particular, Asia. For example, while showing relatively few contributions to conference papers, China continues to make significant contributions to U.S.–China trade revenues (discussed in Section 2.4) and demonstrates increasing competitiveness in the global semiconductor value chain (discussed in Section 2.5). The committee expects that these trends will likely continue as nations make greater investments in domestic university and industry research, as well as through multinational, and increasingly global,
commercial partnerships and international research collaborations.
2.2 Increased International Collaboration
Data on coauthored papers presented at several of the sampled conferences1 discussed above and in Appendix F were used to examine how international collaborations have changed over time. In the network connectivity graphs2 of Figure 2-1, the nodes (circles) represent individual countries, and the size of each node represents the number of papers produced by that country. The edges (lines connecting two circles) represent collaborations on coauthored papers, and the weight of each edge indicates the number of papers that share coauthorship between nations.
In each area except architecture, the network graphs show an increasing geographical diversity in research and a tremendous increase in international collaborations. The network graphs show that between 1996 and 2011, international participation and collaboration between the United States and other nations has dramatically increased. In the devices and circuits areas, many of the international collaborations come from work that spans multiple international sites within the same company. This trend toward greater collaboration across national boundaries will likely continue due to the increasing global investments in research by both nations and global industries.
International research collaborations in computer architecture have not increased dramatically, although more papers are being published as collaborations between U.S. and foreign researchers. The emergence of the ARM architecture in the mobile computing space provides impetus for foreign investment in architecture research, particularly in Europe, as European funding agencies prefer to invest in activities that are synergistic with European-based technologies.
Today, leading U.S. universities are linking to remote campuses in Asia and Europe and are describing themselves as “global universities.” This trend, as well as the growing number of global companies, may have an impact on future U.S. competitiveness.
2.3 Commercialization of Technologies
This section provides a snapshot of the global landscape in the commercialization of semiconductor and computing hardware and software technologies using data from iSuppli, Gartner, the Hardware Top 100, and the Software Top 100.3
2.3.1 Semiconductor Commercialization
The committee began by analyzing revenues from the largest semiconductor, as well as computing hardware and software, companies. Table 2-1 shows the top 20 semiconductor companies, ranked by 2010 revenues4 and includes companies that sell semiconductor components.5 The chart shows the nation where the company is headquartered, its primary technology area, whether it has its own in-house fabrication capability, 2010 revenues in U.S. dollars, and the fraction of the global semiconductor market.
These top 20 companies account for a total of $197 billion, which is about two-thirds of the global semiconductor market. Of these top 20 companies, the United States accounts for 47 percent of revenue. Japan and Korea account for about 20 percent each, while Europe accounts for 10 percent. Historically, being a major semiconductor company required owning and operating significant semiconductor fabrication factories. However, the rising cost of deploying such facilities, both in R&D and capital investments, combined with the availability of “fab-for-hire” foundry services from companies such as Taiwan Semiconductor Manufacturing Corporation (TSMC), have given rise to an increasing number of fabless6 semiconductor companies. Foundries such as TSMC have grown to be about 10 percent of the overall semiconductor component market (Gartner7 estimate is U.S. $28.3
_______________
1Conferences included in each of the four technology areas are as follows: (1) Architecture: ASPLOS, HPCA, ISCA, and MICRO; (2) Programming: ECOOP, OOPSLA, PLDI, POPL, and PPoPP; (3) Applications: SIGGRAPH, SC, VLDB, and WWW; and (4) Semiconductor Devices and Circuits: IEDM and ISSCC.
2Coauthor networks were generated with the Science of Science (Sci2) Tool: Sci2 Team (2009). Science of Science (Sci2) Tool. Indiana University and SciTech Strategies, http://sci2.cns.iu.edu.
3See www.isuppli.com; www.gartner.com; www.hardwaretop100.org; and www.softwaretop100.org.
4See http://www.isuppli.com/Semiconductor-Value-Chain/News/Pages/Intel-Reasserts-Semiconductor-Market-Leadership-in-2011.aspx. Last accessed on August 16, 2012.
5Companies that supply only fabrication services (such as TSMC with 2010 revenues of over $13 billion) are not included. Systems companies that design their own chips (such as Apple) are included in Table 2-1 below.
6Fabless semiconductor companies specialize in the design and sale of hardware devices and semiconductor chips, as opposed to device fabrication.
7“Semiconductor foundry revenue increased 40.5%, reaching $28.3 billion in 2010. Foundry fab utilization reached its peak in 3Q10 after several quarters of good growth. Leading-edge technologies (65 nm to 45 nm) have been in high demand from foundries, increasing in revenue contribution.” Available at http://www.gartner.com/id=1634315. Last accessed on February 7, 2012.
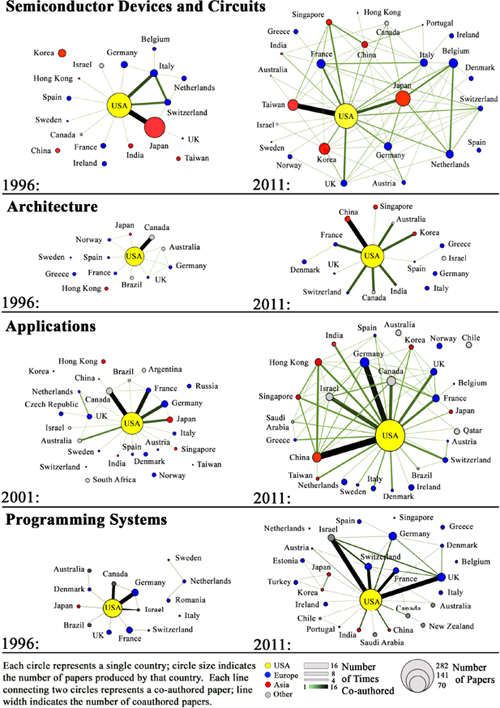
FIGURE 2-1 International conference collaboration networks. Data compiled from the following conferences: ASPLOS, HPCA, ISCA and MICRO (architecture); ECOOP, OOPSLA, PLDI, POPL, and PPoPP (programming systems); SC, SIGGRAPH, VLDB, and WWW (applications); and IEDM and ISSCC (semiconductor devices and circuits). Collaboration maps were generated using the Science of Science (Sci2) Tool available at http://sci2.cns.iu.edu.
TABLE 2-1 Top 20 Largest Semiconductor Companies (by revenue) in 2010
| Rank | Company | Country of Origin | Primary Market | Fab | $ Sales (U.S. millions) | % Market Share |
| 1 | Intel* | USA | microprocessors | yes | 40,394 | 13.2 |
| 2 | Samsung* | South Korea | memory, mobile SoCs | yes | 28,380 | 9.3 |
| 3 | Toshiba | Japan | memory | yes | 13,010 | 4.3 |
| 4 | Texas Instruments* | USA | DSP, mobile SOC | yes | 12,944 | 4.3 |
| 5 | Renesas | Japan | microcontrollers | yes | 11,893 | 3.9 |
| 6 | Hynix | South Korea | memory | yes | 10,380 | 3.5 |
| 7 | ST Microeletronics | France, Italy | memory, microcontrollers | yes | 10,346 | 3.4 |
| 8 | Micron | USA | memory | yes | 8,876 | 2.9 |
| 9 | Qualcomm* | USA | mobile SOC | no | 7,204 | 2.4 |
| 10 | Broadcom | USA | communication | no | 6,682 | 2.3 |
| 11 | Elpida | Japan | memory | yes | 6,446 | 2.1 |
| 12 | AMD* | USA | microprocessors, GPUs | no | 6,345 | 2.1 |
| 13 | Infineon | Germany | microcontrollers | yes | 6,319 | 2.0 |
| 14 | Sony | Japan | LCD, microprocessors | yes | 5,224 | 1.8 |
| 15 | Panasonic | Japan | microcontrollers | yes | 4,946 | 1.7 |
| 16 | Freescale | USA | microcontrollers | no | 4,357 | 1.4 |
| 17 | NXP | Netherlands | microcontrollers, mixed signal | yes | 4,028 | 1.3 |
| 18 | Marvell* | USA | mobile SOCs | no | 3,606 | 1.2 |
| 19 | MediaTek | Taiwan | communication | no | 3,553 | 1.2 |
| 20 | NVIDIA* | USA | GPUs, mobile SOCs | no | 3,196 | 1.0 |
Data compiled from isuppli’s Preliminary Worldwide Ranking of the Top 20 Suppliers of Semiconductors in 2010 (www.isuppli.com).
billion foundry revenue out of roughly U.S. $300 billion overall semiconductor revenue). This trend has enabled startup companies to grow into large semiconductor companies, focused on design. While 13 of the top 20 on the 2010 list have their own semiconductor fabrication capability, 6 fabless semiconductor companies make the list, all of which are from the United States. The companies in the table that are marked by an asterisk design and sell multicore processors. Companies that sell multicore processors for PCs and servers (including graphics and high-performance accelerators) are Intel, AMD, and NVIDIA. Companies such as IBM and Oracle also design and sell multicore server processors, but have semiconductor revenues that place them outside the top 20. Companies that produce multicore processors for mobile devices such as cell phones and tablets include Samsung, Texas Instruments, Qualcomm, Marvell, and NVIDIA. As noted in Chapter 1, while the dominant instruction set in the PC and server space is x86 (Intel and AMD), the ARM instruction set dominates the mobile computing space. In addition to the mobile processor companies listed above, Apple designs its own multicore ARM-based processors for its mobile and tablet computers. The openness of the ARM architecture and ecosystem, along with ARM’s focus on power efficiency, has led it to dominate in this fast-growing space.
It is equally important to assess how commercialization of these semiconductor technologies
has changed over time. Table 2-28 ranks the largest semiconductor companies in 5-year intervals between 1995 and 2010. While mergers and acquisitions have changed the names of some of the companies, the country of origin still reflects the relative competitive stature of different nations and regions. In general, the United States has become more competitive in the semiconductor sectors. In 1995, 6 U.S. companies were in the top 20, representing 34 percent of the revenue of the top 20 companies. By 2010, 9 U.S. companies were in the top 20, representing 47 percent of revenue of the top 20 companies. While South Korea saw a drop in the number of companies in the top 20 from 3 to 2, the combined revenue share of Samsung and SK Hynix accounted for 19 percent of revenue of the top 20. Japan’s representation in the top 20 also dropped, from 7 to 5, with its revenue share dropping even more precipitously, from 44 percent to 21 percent of the top 20.
2.3.2 Computing Hardware and Software Commercialization
In addition to assessing nations’ competitive posture in the commercialization of semiconductor technologies, insight can also be gained from monitoring the world’s largest computing hardware (including semiconductors, devices, and systems) and software companies. According to the Top 100 Research Foundation,9 in 2010 the world’s 20 largest hardware companies accounted for nearly U.S. $650 billion in annual revenue. Of just these top 20 companies, alone, the United States accounts for about 35 percent of total revenue, followed by Japan, South Korea, and Taiwan, each with about 19 percent. Europe’s only entry is Nokia in Finland. China’s Lenovo is a relatively recent entry to the global market, following their acquisition of IBM’s laptop business in 2005.
A similar analysis finds that the world’s 20 largest software companies account for more than U.S. $160 billion in revenue and nearly half of the overall U.S. $300 billion plus worldwide software market10 in 2010 (see Appendix H). U.S.-based companies account for nearly 80 percent of revenues, with European companies accounting for about 15 percent. The only Asian country represented is Japan, with about 6 percent of the top 20 in revenue. The top U.S. companies, including Microsoft, IBM, Oracle, and HP, all have significant R&D investments in software and tools for parallel and multicore systems. The companies that produce game software all have core competence in parallel and multicore systems.
Information technology (IT) companies such as Google and Amazon do not appear in this list because their business models do not rely on selling software. However, they depend on a distributed parallel infrastructure that is now based on multicore systems. They are thus both producers and consumers of multicore hardware and software technology.
2.3.3 Summary of Commercialization Landscape
The degree to which indicators of national research capability and productivity, such as those discussed in Appendix F, are correlated with a nation’s current commercial competitiveness, is a complex question, especially when the lag between research discovery and commercialization can be substantial and global information flow makes research results widely available. Similarly, the interplay between a country’s research prowess and its educational systems affect global talent flow and retention in subtle and complex ways. These complexities underlie the longstanding questions about the interplay between basic research and technology commercialization, with broad implications for national, regional, and global economic policies.
Conversely, a nations’ economic competitiveness may influence both its research capabilities and the ability of its companies to capitalize effectively on new research ideas. For example, if an industry can no longer translate the combination of government-funded basic research ideas and its own R&D investments into commercial successes with wide-enough profit margins, next-generation product development investments can become cost-prohibitive. This is akin to an economics argument that underlies Moore’s Law—that the scaling rate parameter is significantly driven by the economics of internal investment and risk. For industries that can no longer make these investments or take the risks, residing at the leading edge of technology is no longer a viable business model and new strategies are required to remain competitive.
In considering a nation’s ability to commercialize technological investments, it is important to recognize that most of the world’s largest semiconductor, hardware, and software companies are global in nature, with R&D and manufacturing facilities worldwide, along with a complex set of technology cross-licensing agreements and supply chain interdependencies. Very
_______________
8Reported revenues for each company may not be independent; for example, due to the outsourcing of manufacturing across companies, as well as cross-licensing and use of intellectual property.
9See http://www.hardwaretop100.org/. Last accessed on June 16, 2012.
10See http://www.softwaretop100.org/. Last accessed on June 16, 2012.
TABLE 2-2 Largest Semiconductor Companies by Revenue (1995-2010)
| Company | Country of Origin | 1995 Rank | 2000 Rank | 2005 Rank | 2010 Rank |
| Intel | USA | 1 | 1 | 1 | 1 |
| Samsung | South Korea | 6 | 4 | 2 | 2 |
| Toshiba | Japan | 3 | 2 | 4 | 3 |
| Texas Instruments | USA | 7 | 3 | 3 | 4 |
| Renesas | Japan | N/A | N/A | 7 | 5 |
| SK Hynix | South Korea | N/A | 14 | 11 | 6 |
| STMicroeletronics | France, Italy | N/A | 6 | 5 | 7 |
| Micron | USA | 18 | 10 | 12 | 8 |
| Qualcomm | USA | N/A | N/A | 16 | 9 |
| Broadcom | USA | N/A | N/A | 20 | 10 |
| Elpida | Japan | N/A | N/A | N/A | 11 |
| AMD | USA | N/A | 16 | 15 | 12 |
| Infineon | Germany | N/A | 8 | 6 | 13 |
| Sony | Japan | N/A | 20 | 13 | 14 |
| Panasonic | Japan | N/A | N/A | N/A | 15 |
| Freescale | USA | N/A | N/A | 10 | 16 |
| NXP | Netherlands | 11 | 9 | 9 | 17 |
| Marvell | USA | N/A | N/A | N/A | 18 |
| MediaTek | Taiwan | N/A | N/A | N/A | 19 |
| NVIDIA | USA | N/A | N/A | N/A | 20 |
| NEC | Japan | 2 | 5 | 8 | N/A |
| Matsushita | Japan | 13 | 17 | 14 | N/A |
| Sharp | Japan | 19 | 19 | 17 | N/A |
| Rohm | Japan | N/A | N/A | 18 | N/A |
| IBM Microelectronics | USA | 12 | 18 | 19 | N/A |
| Motorola | USA | 5 | 7 | N/A | N/A |
| Mitsubishi | Japan | 9 | 11 | N/A | N/A |
| Hitachi | Japan | 4 | 12 | N/A | N/A |
| Agere | USA | N/A | 13 | N/A | N/A |
| Fujitsu | Japan | 8 | 15 | N/A | N/A |
| Hyundai | South Korea | 10 | N/A | N/A | N/A |
| SGS Thompson | France, Italy | 14 | N/A | N/A | N/A |
| Siemens | Germany | 15 | N/A | N/A | N/A |
| LG | South Korea | 16 | N/A | N/A | N/A |
| Sanyo | Japan | 17 | N/A | N/A | N/A |
| National Semiconductor | USA | 20 | N/A | N/A | N/A |
Data compiled from www.isuppli.com (2000, 2005, 2010) and www.gartner.com (1995).
few, if any products are designed, manufactured, and sold entirely within the borders of a single country.
For example, nearly all Taiwanese companies maintain manufacturing facilities in China, as does Intel and other U.S.-based companies. Many of these companies also operate assembly and test factories in lower-cost countries such as Vietnam, Malaysia, Costa Rica, and others. Furthermore, many companies on the list outsource manufacturing to other companies on the list. In particular, Foxconn, Quanta Computer, and Compal Electronics each manufacture systems on behalf of companies such as Toshiba, Dell, HP, and Apple. This interconnectedness of international economies underscores the need for researchers, as well as policy makers, to maintain a global awareness of not only emerging research capabilities, but also of successes in the commercialization of semiconductor, hardware, and software technologies.
In the last decade, Asia has gained an increasing role in the commercialization of technologies, particularly in manufacturing. In the areas centered on design (as exemplified by the U.S. fabless semiconductor industry), the United States still leads in both hardware and software. However, other nations seek to climb the value chain from manufacturing to integrated system design. Samsung’s investment in its own system-on-a-chip designs are but one example of that type of activity.
In the following section, U.S. Census Bureau trade data on advanced technology products are examined to provide a view of how different nations transform innovation from advanced research investments into commercially successful products.
2.4 Growing Complexity in IT Trade – Tracing Shifts in International Competitiveness
Trade data provide additional information on the global R&D landscape in advanced computing technologies and products, and on potential future shifts in competitive advantages.
2.4.1 U.S. Census ATP Trade Data at the 10-digit Level for Information and Communications (Code 4) and Electronics (Code 5)
Analysis of U.S. Census Bureau Advanced Technology Product (ATP) trade data allows a closer look at changing patterns of trade in Code 4 information and communications technology (ICT) products and Code 5 electronics, including integrated circuits (ICs), products11 between the United States and China, Taiwan, Japan, and Korea. In addition, the ATP trade data may also provide useful proxy indicators on the development of technological capabilities in those four countries.
While U.S. ATP exports fared better than other U.S. exports during 2009,12 the recession induced a great deal of volatility for information technology and electronics ATP exports. For example, U.S. electronics (including integrated circuits) exports fell by 27 percent in 2009 and then increased by 23 percent in 2010. The same volatility can be seen for U.S. ATP exports to Asia. After declining by 15 percent in 2009, U.S. ATP exports to Asia grew by a record 23 percent in 2010, driven by the rapid growth in both electronics and ICT exports. Here, China emerges as the most important growth determinant of U.S. ATP exports, electronics in particular. In fact, in 2009, electronics accounted for roughly half of U.S. ATP exports to China. It is important to emphasize that the focus increasingly is on semiconductors (~90 percent of U.S. electronics exports to China) intended for use in China’s manufacturing plants.13
2.4.2 Trade analysis of ‘Advanced Computing’ (AC) ATP exports/imports
As an additional metric for assessing international competitiveness, U.S. Census Bureau ATP trade data at the 10-digit level was examined to quantify changes in ICT and electronics exports to (and imports from) China, Korea, Taiwan, and Japan between 2006 and 2010.14 In
_______________
11The US Census Bureau defines “information and communications” (Code 4 of its ATP trade database) as products that are able to process increased volumes of information in shorter periods of time. This includes central processing units, all computers, and some peripheral units such as disk drive units and control units, along with modems, facsimile machines, and telephonic switching apparatus. Examples of other products included are radar apparatus and communication satellites. Code 5 (electronics) concentrates on recent design advances in electronic components (with the exception of optoelectronic components) that result in improved performance and capacity and, in many cases, reduced size. Products included are integrated circuits, multilayer printed circuit boards and surface-mounted components such as capacitors and resistors.
12D. Hill, September 2011, U.S. Exports of Advanced Technology Products Declined Less than Other U.S. Exports in 2009, InfoBrief, National Center for Science and Engineering Statistics, National Science Foundation. The U.S. Census Bureau defines ATP trade to consist of advanced materials, aerospace, biotechnology, electronics, flexible manufacturing, information and communication technology (ICT), life science, optoelectronics, nuclear technology, and weapons. Four of these 10 categories (i.e., aerospace, electronics, ICT, and life science) together accounted for 85 percent of U.S. ATP exports in 2010.
13A. Hammer, R. Koopman, A. Martinez, 2009, U.S. Exports of Advanced Technology Products to China, U.S. International Trade Commission, October, No. RN-2009-10E.
14This time period allows for a consideration of the effects of the 2008-2009 global recession.
particular, the committee selected from the Code 4 and 5 export-import data a narrower set of product groups directly relevant to the computer and semiconductor R&D and commercial ecosystem.15 These focused product groups are referred to as Code 4 AC (advanced computing) and Code 5 AC. These AC products are technologically more complex than the rest of the Code 4 and Code 5 product groups, and hence may pose higher entry barriers for latecomers like China (discussed in Chapter 3).
Figure 2-2 compares the growth of U.S. Code 4 AC and 5 AC exports with that of all U.S. Code 4 and 5 exports. Between 2006 and 2010, U.S. Code 4 AC (blue triangles) exports grew four times faster than all Code 4 (blue circles) exports. In contrast, all U.S. electronics exports were negatively affected by the global recession, with Code 5 AC (red triangles) and Code 5 (red circles) exports falling ~11 percent and ~14 percent, respectively.
For U.S. imports, Figure 2-3 shows that U.S. Code 4 AC imports (blue triangles) grew more than twice as fast as all Code 4 imports (~68 percent compared to ~28 percent) between 2006 and 2010. In contrast, both U.S. Code 5 and 5 AC imports show relatively flat growth (± ~1 percent). During this time, the shares of both U.S. Code 4 AC and 5 AC exports in all Code 4 and 5 exports showed a slight increase of ~3–4 percent. The same is true for U.S. Code 4 AC and 5 AC imports, with the share of Code 4 AC imports in all Code 4 imports showing a larger increase of ~7 percent.
2.4.3 Changing Patterns of Trade
Figure 2-4 shows changes in total values of U.S. Code 4 and 4 AC exports to four leading Asian countries—China, Japan, Korea, and Taiwan—between 2006 and 2010. In 2007, China became the largest overseas market for U.S. Code 4 and 4 AC exports, followed by Japan, Korea, and Taiwan. Since then, the export markets of Korea, Taiwan, and Japan, in particular, have all declined (the most dramatic being a ~39 percent decline by Japan). In contrast, China has experienced remarkable growth as a market for U.S. exports of Code 4 and, especially, 4 AC products (~86 percent growth over 4 years). As a result, China held the largest share (nearly half) of all U.S. Code 4 AC exports to Asia in 2010, with Japan in second place (~34 percent). However, Japan’s relatively stagnant export market is unlikely to be a challenger (at least in the near term) as China emerges as a leading market for more sophisticated U.S. ICT exports.
Figure 2-5 shows that China has also become an important market for U.S. Code 5 AC exports, well ahead of Taiwan, Korea, and Japan. Even during the global recession, China’s market for U.S. electronics exports, including semiconductors, continued to increase, while each of the other Asian markets experienced significant declines, in particular Korea and Japan with more than 40 percent reductions. By 2010, China held the largest share (nearly half) of all U.S. electronics exports (both Code 5 and 5 AC) to Asia, followed by Taiwan (~25 percent) and Korea (~20 percent). As such, China has established itself as a leading market for sophisticated U.S. electronics exports, and especially for semiconductors.
Figure 2-6 shows that China clearly dominates as a major source of Code 4 AC products, well ahead of Korea (which overtook Japan in 2008), Japan, and Taiwan (by more than an order of magnitude). Between 2006 and 2010, U.S. Code 4 AC imports from China grew by almost 130 percent. More importantly, by 2010 China held a ~95 percent share of all Code 4 AC exports from Asia to the United States, establishing its role as a major source of U.S. imports of sophisticated ICT products. While they do not pose any perceivable threat to China’s lead, it is worth noting that an increasing share of U.S. Code 4 imports from Korea and Taiwan,16—but not Japan, which has experienced negative growth—now constitute more sophisticated Code 4 AC products.
Figure 2-7 shows that, despite the trade disruption resulting from the global recession, Taiwan remains the leading source of Code 5 AC imports to the United States, ahead of Korea, Japan, and China. Historically, China has lagged behind the rest of Asia as a source of U.S. Code 5 and 5 AC imports. However, it is worth emphasizing that, since 2009, Code 5 AC imports to the United States from China have grown much faster (~72
_______________
15From the Code 4 and Code 5 data, the committee analyzed import and export products associated with advanced computing. In particular, the committee focused on categories that included (1) products associated with the implementation of integrated circuits and (2) memory and logic-integrated circuits themselves. The committee did not include discrete electronic components (e.g., diodes and amplifiers), display technologies, low-frequency integrated circuits, printer technologies, magnetic storage, and radio and telecommunication technologies.
16In 2010, U.S. imports of Code 4 AC products from Korea and Taiwan grew by ~1,328 percent and ~98 percent, respectfully. However, high growth rates should not necessarily be associated with high export-import values. For example, while Korea exhibits a high growth rate of Code 4 AC products to the United States between 2006 and 2010, the total value of these exports remains very low (increasing from U.S. $30 million to $470 million), compared with China (U.S. $16.9 billion to $38.8 billion).
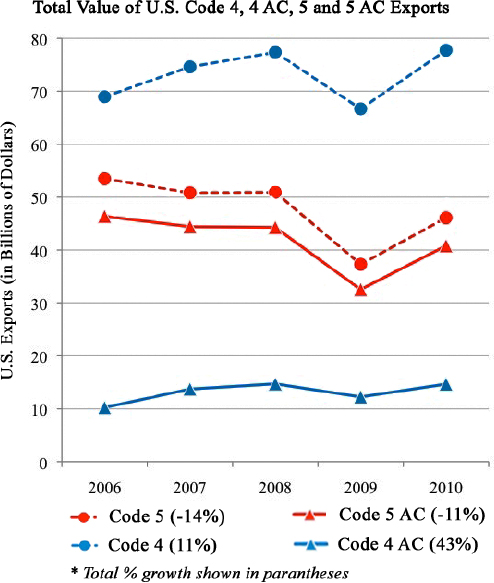
FIGURE 2-2 Total value of U.S. Code 4, 4 AC, 5, and 5 AC exports. Data compiled from U.S. Census Bureau Advanced Technology Product trade data.
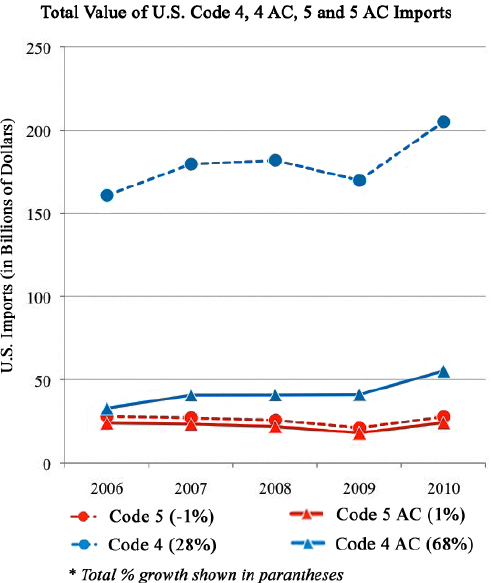
FIGURE 2-3 Total value of U.S. Code 4, 4 AC, 5, and 5 AC imports. Data compiled from U.S. Census Bureau Advanced Technology Product trade data
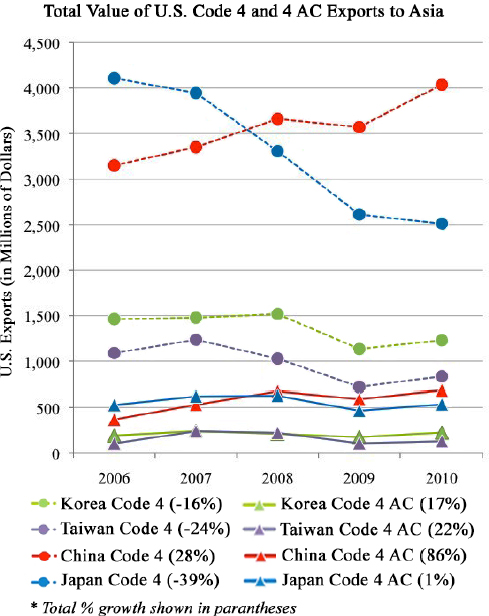
FIGURE 2-4 Total value of U.S. Code 4 and 4 AC exports to Asia. Data compiled from U.S. Census Bureau Advanced Technology Product trade data.
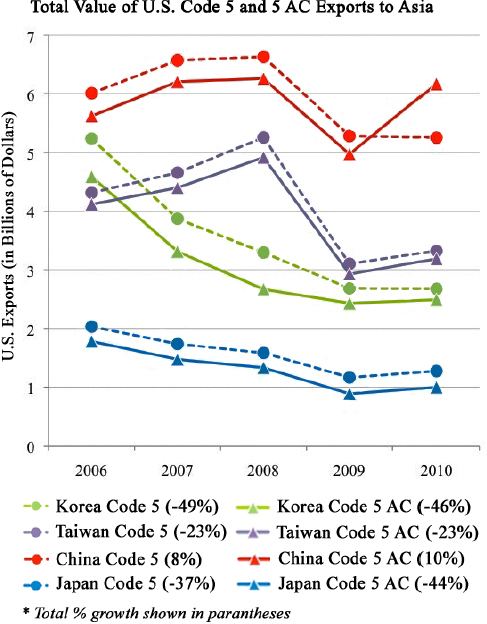
FIGURE 2-5 Total value of U.S. Code 5 and 5 AC exports to Asia. Data compiled from U.S. Census Bureau Advanced Technology Product trade data.
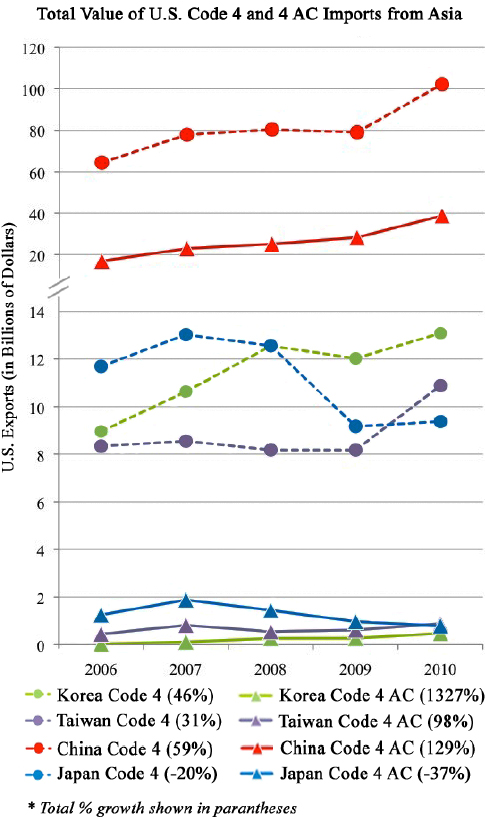
FIGURE 2-6 Total value of U.S. Code 4 and 4 AC imports from Asia. Data compiled from U.S. Census Bureau Advanced Technology Product trade data.
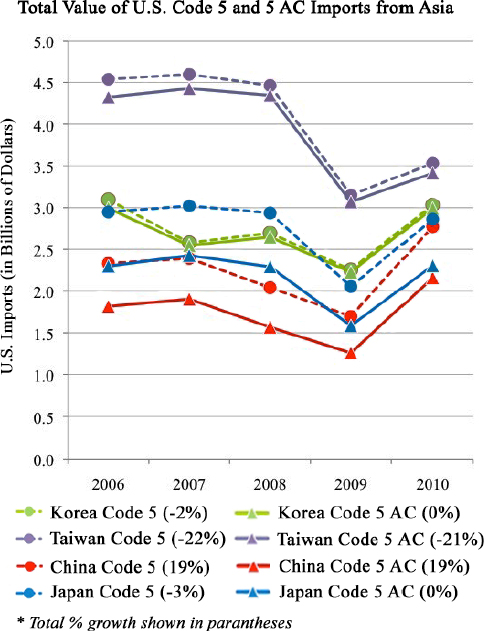
FIGURE 2-7 Total value of U.S. Code 5 and 5 AC imports from Asia. Data compiled from U.S. Census Bureau Advanced Technology Product trade data.
percent) than any of the other three Asian countries. As a result, China now has a 20 percent share of all U.S. Code 5 AC imports from Asia, suggesting that China is making continuous progress as an exporter despite its persistent weakness as a semiconductor producer.
2.4.4 Summary of Trade Data Analysis
The overall picture that emerges from the analysis of trade data is that the United States has kept its leading position as a supplier of leading-edge semiconductors, as reflected by Code 5 and 5 AC export data. China is also increasingly becoming a major market for both Code 5 and 5 AC products. Most U.S. exports of semiconductors to China end up in Chinese ICT products. The trade data also suggest that China is exhibiting increased competitiveness as both a consumer and supplier of Code 4 and 4 AC products.
Another important finding is that shifts in competitiveness are very pronounced among the four leading Asian countries. While these shifts differ across product markets, China consistently leads the group, except in being a supplier of Code 5 and 5 AC products (though it is growing in that market, as well).
Finally, with regard to China’s position in the global semiconductor value chain, the trade data analysis suggests that while the China market increases in importance, its domestic semiconductor industry continues to play a secondary role. Although China has growing strengths in the O-S-D (optoelectronics-sensor-discrete) industry and in the SPA&T (semiconductor packaging, assembly, and test) industry, these are somewhat secondary markets that do not define future technology trajectories.
In summary, the United States cannot afford to be complacent. There is no doubt that over time China’s
position in the global semiconductor value chain will keep improving. The United States needs to be prepared for a long-term shift in competitiveness.
2.5 China’s Position in the Global Semiconductor Value Chain
So far, three broad metrics have been discussed—preliminary pilot study data on national representation at technical conferences (i.e., authorship of conference papers); revenues generated by leading semiconductor, hardware, and software companies; and analyses of advanced electronics and ICT imports from and exports to Asia—to assess national technological leadership and competitiveness—each of which has indicated that the United States continues to maintain a leadership position.
However, these metrics also shed insight into the potential for competitor nations, such as China, to now meet or surpass U.S. technological capabilities. For example, while Table F-4 suggests that China’s research contributions (via conference papers) are low relative to the United States and other leaders like Japan, Section 2.4 shows that China is exhibiting increased competitiveness as a strong consumer and supplier of advanced electronics and ICT products. China’s rapidly growing semiconductor market continues to transform the semiconductor industry worldwide (both geographically and economically). Accordingly, many questions arise as to whether and how these emerging changes may affect the global semiconductor value chain.
The following sections examine China’s growing role as a major consumer and supplier of semiconductors, as well as its contribution to the global semiconductor value chain. The following description relies heavily on the PricewaterhouseCoopers (PwC) report, Continued growth – China’s impact on the semiconductor industry – 2011 update.17
2.5.1 China has become a Major Consumer of Semiconductors
Over the last decade, China’s semiconductor market18 has grown at an incredible 24.8 percent compounded annual growth rate (CAGR), far outpacing the worldwide semiconductor market (3.9 percent CAGR). In 2010 alone, China’s semiconductor market grew by ~30 percent to U.S. $132 billion, accounting for more than 40 percent of the worldwide market. Much of this growth is driven by two factors: (1) a significant portion of consumed semiconductors are incorporated into final products that are assembled in China and then exported for sale elsewhere (such as in the United States, the European Union, Japan, and India) and (2) electronic products produced in China have higher semiconductor content (~27 percent) than the worldwide average (~19 percent).
To fairly assess the implications of China’s large share of the worldwide semiconductor market, it is important to recognize that, unlike in the United States, China’s semiconductor market is dominated by multinational and global semiconductor companies. For example, the 10 largest suppliers of semiconductors to China are not Chinese-owned companies and account for a combined 47 percent share of China’s semiconductor market. However, although no Chinese-owned semiconductor companies are among the top 10 suppliers to either the worldwide or Chinese market, China’s domestic semiconductor market has experienced significant growth, increasing from U.S. $10 billion in 2003 to U.S. $46 billion in 2010, representing more than 27 percent of worldwide semiconductor market growth.
Today, China’s domestic consumption of semiconductors accounts for more than 15 percent of the worldwide market. This suggests that Chinese original equipment manufacturers (OEMs) may play a more prominent role in the future in shaping the parameters of semiconductor designs.
2.5.2 China’s Semiconductor Manufacturing Industry
In 2010, China’s semiconductor industry19 experienced record growth (~30 percent) with revenues that account for ~8–11 percent of the worldwide semiconductor industry (compared with ~2 percent in 2000). Similar to its largest semiconductor suppliers, China’s largest semiconductor manufacturing enterprises are multinational integrated device manufacturers (IDMs). Various aspects of the industry have been demonstrating significant growth.20
China’s IC design industry has become one of the fastest growing sectors in China’s semiconductor
_______________
17PwC, 2011, Continued growth: China’s impact on the semiconductor industry – 2011 update. Available at http://www.pwc.com/gx/en/technology/assets/china-semiconductor-report-2011.pdf. Last accessed January 27, 2012.
18China’s semiconductor market refers to the value of all semiconductor devices consumed in China by EMSs (electronics manufacturing service providers), OEMs (original equipment manufacturers), and ODMs (original design manufacturers).
19China’s semiconductor industry refers to the sum of all reported revenues of all semiconductor manufacturers in China, including IC design, IC manufacturing and wafer foundries, IC packaging and test, and O-S-D companies.
20See China Semiconductor Industry Association (![]() 2010). Last accessed on February 23, 2012.
2010). Last accessed on February 23, 2012.
industry, generating revenues of U.S. $5.4 billion (46 percent CAGR) in 2010, up from U.S. $178 million in 2001.21
In 2010, China’s semiconductor packaging, assembly, and test (SPA&T) sector also experienced positive growth (~27 percent) with revenues of U.S. $9.3 billion, representing 20 percent of worldwide SPA&T facilities.22 China’s O-S-D sector, in particular its light-emitting diode industries, experienced similar growth with revenues more than twice that of its SPA&T sector (U.S. $23.4 billion). In addition, revenues generated in 2010 by China’s wafer foundries grew by more than 45 percent, accounting for ~11 percent of worldwide foundry revenues.
2.5.3 Contribution to the Global Semiconductor Value Chain
To assess China’s position in the global semiconductor value chain, it is important to assess China’s strengths and weaknesses along each step of the value chain. Table 2-3 reports disaggregated semiconductor value chain revenue generated both by China and worldwide. The data illustrates that China currently acts primarily as a semiconductor consumer, accounting for ~37 percent of the worldwide semiconductor value chain. While the majority of these semiconductors consumed in China were ultimately exported for sale outside of China, more than one-third were used in electronic products consumed within China.
In contrast, China’s contribution as a semiconductor producer, that is, sales, only accounts for ~8 percent (total sales in China divided by total worldwide revenue) of the worldwide value chain. Although its aggregated contributions as a semiconductor provider remains low, China is also a strong contributor to worldwide discrete device revenues and continues to develop its IC design capabilities.
2.5.4: Summary of China’s Position in the Global Semiconductor Value Chain
In the last several years, China has steadily increased its position in the global semiconductor value chain—particularly as a consumer of semiconductor devices. China’s IC design industry has also made significant gains. However, numerous challenges remain that have the potential to reduce China’s overall position in the value chain, as well as to alleviate concerns that the semiconductor value chain is threatened in the near term. While China has certainly emerged as what might be termed the dominant global factory for IT equipment, all products manufactured in China could also be manufactured elsewhere if there was an interruption in trade with China. In addition, the overwhelming majority of suppliers to China’s semiconductor market are foreign companies.
TABLE 2-3 China’s 2010 Contribution to Worldwide Semiconductor Value Chain Revenue (in Billions of U.S. Dollars)
| Worldwide Revenue | Sales | China Consumption | |
| Electronic Design Automation | 4.2 | N/A | 0.31 |
| Semiconductor Intellectual Property | 1.5 | N/A | 0.12 |
| Equipment | 39.5 | 0.10 | 3.63 |
| Materials | 43.6 | 0.43 | 4.15 |
| IDMs | 224.7 | 18.9 | 99.6 |
| Fabless | 73.6 | 5.4 | 32.4 |
| Foundries | 30.2 | 3.2 | 13.4 |
| SATS | 23.6 | 9.1 | 10.4 |
| Total | 440.9 | 36.6 | 164.01 |
Adapted from the PwC report: Continued growth: China’s impact on the semiconductor industry –2011 update, including source material from CSIA, EDAC, Gartner Dataquest, GSA, and SEMI (available at www.pwc.com).
While China’s IC design industry continues to experience strong growth, it lags behind the United States, Japan, Taiwan, and Korea in terms of process technology and design line width. This is partly a result of (1) lacking or technologically inferior Chinese suppliers of electronic design automation tools and software and domestic licensors of IC design-related intellectual property and (2) significant supply-side constraints (e.g., intense competition and price wars) that have bankrupted many of China’s domestic IC houses. In addition, a narrow focus on low- and middle-end consumer products threatens to constrain the growth of China’s IC design industry. By fueling its dependence on
_______________
21See China High-Tech Industry Development Almanac (![]() 2010). Last accessed on February 23, 2012
2010). Last accessed on February 23, 2012
22See semi.org.cn (![]() ). Last accessed on February 23, 2012.
). Last accessed on February 23, 2012.
mature and relatively standardized products, China limits its R&D and semiconductor capability developments. Similarly, it is questionable whether China can sustain its increasing share of total worldwide wafer production as its leading foundries (e.g., SMIC, Shougang NEC Electronics, and HeJian Technology) have experienced dramatic revenue declines in 2010. While it continues to lead in the number of new wafer fabrications, these plants use older technology.
This chapter provides two measures for assessing advanced research efforts related to the key advanced computing technologies described in Chapter 1, as well as for assessing global competitiveness in these technologies. These two measures include (1) descriptions of the global landscape of the commercialization of semiconductor, computing hardware, and software technologies; and (2) bilateral trade data analysis of electronics and ICT ATP products with a focus on technologies specifically relevant to the computing challenges outlined in Chapter 1.
Preliminary observations from a pilot study of a third possible measure, conference publication data, indicate that the United States has maintained its position as a strong contributor of research papers at the technical conferences sampled by the committee over the last 15 years, with particular strengths in the area of architecture research. Early results from the pilot study also demonstrate the value of a more focused examination of a nation’s technology-specific paper contributions (say, compared to a bulk analysis across all advanced computing sectors). The longitudinal data analyses also provide a starting point for identifying trends in national and regional participation in specific technology areas. While these early data suggest a strong U.S. position, a more thorough investigation is necessary.23
The advanced technology product trade data analyses indicate that China is increasingly becoming a major market for advanced electronics products. China also is exhibiting increased competitiveness as both a user and supplier of ICT products; its domestic semiconductor industry also continues to grow. In addition, Taiwanese manufacturing and assembly are increasingly being transferred to China. While the United States has maintained—and is likely to continue in the near term—its leading position as a supplier of leading-edge semiconductor designs, it has a more minor position in semiconductor manufacturing.
Though conference data from the pilot study suggest that China currently lags behind the United States in leading research capabilities (though it is growing, especially in the applications research areas), it is important to consider other indicators of China’s research capabilities—for example, the technology transfer through U.S. education of Chinese foreign nationals. By sending its best students to top U.S. research universities, China can capitalize on the “value added” by American education and bootstrap its manufacturing and design prowess without these capabilities showing up in publication data.
China is already a major consumer of ICT products, which is increasingly shaping product expectations and standards; over time, China’s position in the global semiconductor value chain will continue to improve. Thus, the United States cannot be complacent and needs to be prepared for this long-term shift in competitiveness.
_______________
23For example, as discussed in Appendix F, future iterations of this analysis would ideally take into consideration all papers relevant to the computing performance challenges outlined in Chapter 1, whether published at conferences or in traditional journals, weighted by citations and impact factors, as well as expert judgment.


