
B
Identifying Hubs of Research Activity in Key Areas of S&T Critical to this Study
As a data-gathering experiment, the committee solicited input from experts on their sense of where innovation and engagement are taking place related to the power and performance challenges for sustaining growth in computing performance. In particular, the committee asked experts to identify leading researchers around the globe focused on the challenges of sustaining growth in computer performance in (1) semiconductor device scaling, (2) power efficiency in computing hardware, (3) parallel programming and models to leverage multicore and other novel architecture, (4) chip architectures, and (5) runtime and software infrastructure for power-efficient and scalable computing.
Approximately 170 leading researchers were identified, based on input solicited from a dozen computer scientists, engineers, and recommendations by the committee.1 Approximately three-quarters of those identified were based in the United States. Individuals who were identified by at least three people were deemed to be “hubs” of concentrated research activity for the purposes of the committee’s analysis. Publication data (for the years 2001–2011) for each of these individuals, or hubs, was collected using SciVerse Scopus2 (resulting in a total number of 1,081 publications and 5,685 authors, 1,368 of which are unique authors).
Using this publication data, the committee generated a coauthor publication network map that includes all identified hubs of research activity in semiconductor scaling, architecture, and parallel programming.3,4 A visualization of the publication network for these advanced research areas critical to the computing performance challenge is shown in Figure B-1. The goal of this exercise is not to highlight individually-identified researchers, but rather to present a methodology that allows gleaning, at least in a rough, qualitative sense, of potential insights from the connectedness between the hubs of research activity, as well as between U.S. and international research communities.
Figure B-1 shows a map of highly connected circles. Each circle represents an individual researcher, and each line between two circles represents a coauthored publication. The size5 of each circle corresponds approximately to the total number of papers that researcher has authored, and the width of each line corresponds to the number of coauthored papers shared between two researchers. Hubs of research activity are colored in yellow and labeled with letters corresponding to their institutional affiliation.6 All other circles are
_______________
1The following noncommittee members contributed to this data-collection exercise: Alex Aiken (Stanford University), Mark Bohr (Intel), Robert Colwell (DARPA), Bob Doering (Texas Instruments), Bryan Ford (Yale University), David Patterson (University of California-Berkeley); David Srolovitz (A*STAR), and Dennis Sylvester (University of Michigan).
2See www.scopus.com. Last accessed on August 11, 2012.
3Coauthor publication network maps are not shown for advanced research in power efficiency in computing hardware or in runtime and software infrastructure for power-efficient and scalable computing due to limited overlap in researcher nominations.
4Coauthor publication network maps were generated using the Science of Science (Sci2) Tool, available at http://sci2.cns.iu.edu.
5The size of each node is calculated as a fraction of the largest number of papers authored and/or coauthored by a single individual.
6Affiliations associated with each hotspot are as follows: (A) The University of California, Berkeley; (B) Massachusetts Institute of Technology; (C) Stanford University; (D) University of Illinois at Urbana-Champaign; and (E) Advanced Micro Devices, Inc.
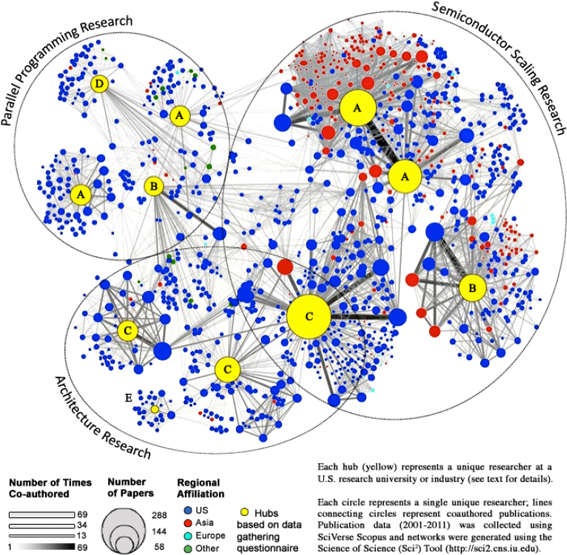
FIGURE B-1 Coauthorship networks of hubs of research activity in three areas of advanced computing research.
colored according to the geographic location of that researcher, as indicated in the figure.7 Three large circles marked by dotted lines are used to bin the hubs of research activity by each of their associated areas of research (e.g., semiconductor scaling, architecture, and parallel programming).
It is worth noting that this mapping approach differs from traditional bibliometric analyses of coauthored publication data because the primary nodes (hubs) examined were identified based on the committee’s data input solicitations (as opposed to selecting hubs on the basis of total number of publications or of most cited
_______________
7Color coding by region (e.g., U.S., Asia, Europe, Other) was determined by using each authors’ geographic location listed on his or her conference publication. Addresses were not mapped using Sci2 software.
publications). While the sampling size of the data solicitations is small, Figure B-1 reveals several interesting features that may be useful for subsequent analysis.
For example, all hubs are located in the United States, and all but one of these hubs are U.S. research universities. The coauthorship network maps show that some areas of research (and some researchers specifically) tend to collaborate on a nation- or region-specific basis or both. For example, chip architecture and parallel programming networks are primarily U.S. based with limited participation by Europe and Asia. In contrast, semiconductor device-scaling networks show a significant number of collaborations with Asia. In particular, Taiwan holds the vast majority share of Asia’s representation, followed by Singapore and Japan (data not shown).
While the individual hubs do not generally show a significant degree of connectivity with one another (with exception to two hubs in the semiconductor scaling networks), the semiconductor scaling and chip architecture networks appear to be highly interconnected. In fact, both of these networks share a common hub. In contrast, researchers within the parallel programming networks display much less connectivity.
Increasing circle size, increasing connectedness between researchers, and widening lines between researchers may all be useful indicators for identifying emerging hubs of research activity. For instance, a small circle with many connections might suggest an individual who publishes less but collaborates frequently and is thereby more intimately connected to the global knowledge network. In addition, a wide line between a small circle and an established research hub might suggest a promising early-career researcher who hails from a strong research lineage. This analysis could also be extended by observing how coauthored publication networks change over time.
In summary, this methodology presents a unique approach for identifying emerging, as well as established, hubs of research activity in three areas of science and technology. However, given the small sampling size of the data solicitations, this experiment is not intended to provide any assessment or interpretation of the hubs themselves (or of trends apparent in the network maps). Rather, the goal of this experiment is to demonstrate an approach that could be extended and/or modified (e.g., to include statistically valid data-gathering methodologies) for subsequent in-depth exploration in any number of research areas.


