
Do Americans live as long as people in other high-income countries? This chapter reviews one of the most reliable sources of information about cross-national health differences, vital statistics on deaths. Unlike measures obtained from survey data, these data pertain to an unambiguous indicator of health. High-quality vital statistics are available for nearly all deaths in high-income countries. Their continuous coverage permits the construction of accurate time series, and the data can be converted into meaningful popular indicators, such as life expectancy at birth, which is an intuitively appealing summary measure that is often used as the basis for evaluating overall health status. Data on mortality by cause of death can also provide important clues about the social and epidemiologic pathways that affect population health.
This chapter examines mortality from multiple perspectives to present a comprehensive picture of the evidence: we examine mortality rates (the number of deaths from particular causes per 100,000 persons), life expectancy at various ages, the probability of living to age 50, and years of life lost from particular causes. We present both the data and the United States’ ranking on these data relative to other high-income countries.1 In
_________________
1We report rankings to simplify comparisons across countries, but it is important to recognize that this is an ordinal measure that does not reflect the size of the difference between one rank and the next. Rankings can change when small differences in rates shift a country’s rank.
this chapter we focus on 17 high-income countries:2 Australia, Austria, Canada, Denmark, Finland, France, Germany, Italy, Japan, Norway, Portugal, Spain, Sweden, Switzerland, the Netherlands, the United Kingdom, and the United States.
For many years, global health statistics compiled by the OECD3 and the World Health Organization (WHO) have documented higher mortality rates in the United States relative to other high-income countries. Among the 17 peer countries examined by the panel, Americans faced the second highest risk of dying from noncommunicable diseases in 2008 (418 per 100,000 persons) and the fourth highest risk of dying from communicable (infectious) diseases in 2008 (World Health Organization, 2011a) (see Figures 1-1 and 1-2).
Death rates from noncommunicable diseases, notably cardiovascular diseases, have declined everywhere but less so in the United States. As of 2009, ischemic heart disease mortality among males in the United States was 129 per 100,000, higher than the other 16 peer countries except Finland (OECD, 2011b).4Table 1-1 provides cause-specific mortality rates
_________________
2The panel selected these 17 as “peer countries” because they are most comparable to the United States. We set three criteria for designating peer countries: (1) high levels of development for a long period of time, (2) sufficient population size to ensure stability of estimates, and (3) data from the Human Mortality Database (2012) of suitable quality and availability for the time period used in our analysis, 2006-2008. Excluded countries did not meet one or more of these criteria. For example, data quality has been a problem in Belgium, and its latest year of available data was 2005; Greece and Korea were not included in the Human Mortality Database at the time of our analysis; and several other high-income countries are former Soviet satellites with atypical mortality experiences. For consistency, this report’s documentation of the U.S. health disadvantage is based on comparisons with these 16 peer countries. The panel uses a more general term, “high-income countries,” to refer to other groups of high-income countries. On occasion, we make comparisons with these other high-income countries and even emerging economies (e.g., Mexico, Russia) because data were available for this larger comparison group, because we cited studies that included these countries, and because for certain conditions (e.g., mortality rates, child poverty) comparisons with emerging economies underscore the United States’ relative position.
3The OECD is a membership organization of 34 member countries that share a commitment to democratic government and the market economy. Well known for its publications and statistics, the work of the OECD covers both economic and social issues, including macroeconomics, trade, employment, education, health, and social welfare. The organization was established in 1961 when the United States and Canada joined the 18 former members of the Organization for European Economic Cooperation (established in 1947 for postwar reconstruction) to work together on shared economic development. The OECD’s 34 members now include countries from North and South America, Europe, and the Asia-Pacific region, and it includes not only most advanced economies, but also such emerging economies as Chile, Mexico, and Turkey.
4U.S. mortality rates from ischemic heart disease are even higher than those of some emerging economies, such as Mexico and Slovenia (OECD, 2011b).
FIGURE 1-1 Mortality from noncommunicable diseases in 17 peer countries, 2008.
SOURCE: Data from World Health Organization (2011a, Table 3).
FIGURE 1-2 Mortality from communicable diseases in 17 peer countries, 2008.
SOURCE: Data from World Health Organization (2011a, Table 3).
TABLE 1-1 Mortality Rates in 17 Peer Countries, 2008
| Australia | Austria | Canada | Denmark | Finland | France | Germany | Italy | Japan | Netherlands | Norway | Portugal | Spain | Sweden | Switzerland | U.K. | U.S. | |
| ALL CAUSES | 378.0 | 420.5 | 401.2 | 500.8 | 446.6 | 397.7 | 440.6 | 383.0 | 349.3 | 427.3 | 425.3 | 467.7 | 397.7 | 409.8 | 371.2 | 462.1 | 504.9 |
| Specific causes | |||||||||||||||||
| Noncommunicable diseases | 329.9 | 372.5 | 345.8 | 440.4 | 377.0 | 336.4 | 393.9 | 342.1 | 273.0 | 376.8 | 363.1 | 393.9 | 351.0 | 3S7.6 | 323.3 | 400.5 | 418.4 |
| Cardiovascular diseasesa | 117.2 | 154.4 | 118.6 | 144.6 | 163.6 | 99.2 | 174.9 | 132.3 | 97.4 | 122.4 | 132.9 | 148.2 | 115.7 | 150.8 | 123.1 | 141.7 | 155.7 |
| Malignant neoplasmsb | 118.8 | 123.6 | 125.8 | 157.7 | 106.5 | 138.4 | 127.5 | 124.2 | 115.1 | 147.1 | 130.3 | 134.3 | 122.0 | 116.4 | 112.7 | 137.0 | 123.8 |
| Other neoplasms | 2.9 | 3.5 | 2.4 | 3.6 | 2.1 | 5.2 | 2.8 | 5.3 | 3.3 | 3.6 | 2.5 | 2.9 | 3.7 | 3.2 | 2.8 | 2.9 | 2.9 |
| Neuropsychiatric conditionsc | 26.2 | 19.6 | 28.2 | 38.8 | 48.4 | 34.0 | 19.5 | 18.8 | 11 | 32.7 | 32.7 | 16.1 | 28.2 | 34.2 | 33.5 | 31.7 | 39.2 |
| Respiratory diseases | 21.6 | 15.5 | 22.4 | 31.2 | 12.7 | 13.3 | 17.3 | 17.3 | 15.8 | 23.9 | 25.4 | 25.6 | 31.1 | 15.5 | 13.4 | 34.4 | 34.3 |
|
• Chronic |
12.8 | 12.9 | 15.4 | 26.8 | 9.1 | 5.4 | 11.9 | 11.5 | 4.0 | 19.0 | 20.8 | 10.5 | 12.6 | 11.7 | 9.9 | 21.5 | 24.3 |
|
• Asthma |
1.2 | 0.9 | 0.5 | 0.8 | 0.8 | 0.8 | 1.0 | 0.4 | 0.7 | 0.3 | 1.2 | 0.6 | 0.8 | 0.6 | 0.5 | 1.1 | 0.9 |
| Digestive diseasesd | 13.0 | 19.4 | 15.5 | 29.5 | 27.2 | 20.4 | 25.7 | 16.4 | 14.5 | 17.4 | 13.7 | 25.6 | 21.3 | 15.1 | 15.9 | 26.7 | 19.8 |
| Diabetes mellitus | 9.9 | 17.4 | 13.4 | 12.3 | 5.5 | 8.1 | 11.1 | 12.4 | 4.5 | 10.1 | 7.4 | 19.3 | 9.4 | 9.2 | 8.2 | 5.0 | 15.2 |
| Genitourinary diseasese | 8.2 | 5.4 | 7.6 | 8.1 | 3.0 | 5.7 | 7.1 | 5.7 | 8.0 | 9.3 | 7.7 | 12.2 | 9.2 | 4.6 | 4.0 | 9.1 | 12.3 |
| Endocrine disorders | 5.2 | 8.1 | 5.1 | 6.5 | 1.6 | 5.8 | 3.5 | 4.3 | 2.6 | 3.5 | 3.8 | 5.3 | 3.4 | 3.2 | 2.7 | 3.1 | 7.1 |
| Congenital anomalies | 3.2 | 3.9 | 3.7 | 4.0 | 3.6 | 2.8 | 2.8 | 2.8 | 2.6 | 3.3 | 3.4 | 2.7 | 2.9 | 2.7 | 3.8 | 3.7 | 4.3 |
| Musculoskeletal diseasesf | 2.8 | 1.5 | 2.4 | 3.4 | 2.3 | 2.5 | 1.2 | 2.0 | 1.7 | 2.4 | 2.6 | 1.4 | 3.0 | 2.1 | 2.8 | 3.5 | 2.9 |
| Skin diseases | 0.8 | 0.3 | 0.5 | 0.6 | 0.3 | 0.9 | 0.3 | 0.5 | 0.3 | 1.1 | 0.7 | 0.1 | 1.0 | 0.5 | 0.5 | 1.5 | 0.8 |
| Oral conditions | 0.1 | 0.0 | 0.0 | 0.1 | 0.1 | 0.0 | 0.0 | 0.0 | 0.0 | 0.1 | 0.1 | 0.0 | 0.0 | 0.0 | 0.0 | 0.0 | 0.0 |
| Injuries | 30.0 | 33.6 | 32.1 | 33.1 | 58.5 | 38.2 | 25.2 | 24.6 | 36.3 | 22.1 | 35.6 | 28.3 | 23.2 | 32.2 | 30.5 | 25.5 | 52.8 |
| Unintentional injuries | 21.0 | 21.2 | 20.6 | 22.3 | 38.6 | 23.3 | 15.4 | 19.0 | 16.1 | 13.7 | 25.2 | 19.3 | 16.7 | 19.7 | 17.2 | 17.4 | 35.5 |
|
• Road traffic accidents |
6.8 | 6.9 | 7.8 | 5.4 | 5.7 | 6.6 | 5.7 | 8.4 | 3.8 | 4.0 | 5.2 | 10.0 | 6.1 | 4.1 | 3.8 | 4.8 | 13.9 |
|
• Poisonings |
3.0 | 0.2 | 2.1 | 3.8 | 13.9 | 1.6 | 0.9 | 0.7 | 0.6 | 0.9 | 6.8 | 0.2 | 1.0 | 3.2 | 1.9 | 2.8 | 8.9 |
|
• Falls |
3.1 | 5.3 | 3.7 | 2.8 | 10.1 | 4.0 | 4.6 | 2.2 | 2.5 | 4.0 | 3.7 | 2.5 | 2.2 | 4.1 | 7.5 | 3.5 | 4.4 |
|
• Fires |
0.3 | 0.3 | 0.6 | 0.9 | 1.2 | 0.6 | 0.3 | 0.2 | 0.7 | 0.3 | 1.0 | 0.5 | 0.3 | 0.7 | 0.1 | 0.5 | 0.9 |
|
• Drowning |
0.9 | 0.8 | 0.8 | 0.8 | 1.8 | 1.3 | 0.5 | 0.6 | 2.4 | 0.4 | 0.8 | 0.7 | 0.9 | 0.9 | 0.6 | 0.4 | 1.2 |
|
• Other |
6.9 | 7.8 | 5.6 | 8.6 | 6.0 | 9.3 | 3.3 | 7.0 | 6.2 | 4.1 | 7.7 | 5.4 | 6.1 | 6.7 | 3.3 | 5.5 | 6.2 |
| Intentional injuries | 9.0 | 12.3 | 11.5 | 10.8 | 19.9 | 14.8 | 9.9 | 5.6 | 20.2 | 8.4 | 10.4 | 9.0 | 6.5 | 12.6 | 13.3 | 8.0 | 17.3 |
|
• Self-inflicted |
7.8 | 11.8 | 9.9 | 10.1 | 17.7 | 13.6 | 9.1 | 4.5 | 19.8 | 7.4 | 9.7 | 7.5 | 5.6 | 11.7 | 12.6 | 6.9 | 10.3 |
| Australia | Austria | Canada | Denmark | Finland | France | Germany | Italy | Japan | Netherlands | Norway | Portugal | Spain | Sweden | Switzerland | U.K. | U.S. | |
|
• Violence |
1.3 | 0.5 | 1.6 | 0.8 | 2.2 | 1.3 | 0.7 | 1.1 | 0.4 | 0.9 | 0.6 | 1.5 | 0.9 | 0.9 | 0.7 | 1.1 | 6.5 |
|
• War |
— | — | — | — | — | 0.0 | — | — | — | 0.1 | 0.0 | 0.0 | — | — | — | — | 0.4 |
| Communicable, maternal, perinatal, and nutritional conditions | 18.1 | 14.4 | 23.3 | 27.3 | 11.1 | 23.1 | 21.5 | 16.3 | 40.0 | 28.4 | 26.6 | 45.5 | 23.6 | 20.0 | 17.3 | 36.1 | 33.7 |
| Respiratory infectionsg | 7.0 | 5.7 | 9.0 | 13.9 | 4.0 | 8.4 | 10.1 | 4.7 | 29.7 | 16.8 | 13.8 | 23.6 | 9.3 | 8.9 | 7.4 | 23.8 | 9.7 |
| Infectious and parasitic diseasesh | 5.9 | 4.7 | 7.6 | 7.6 | 4.4 | 9.0 | 7.4 | 6.8 | 8.1 | 6.9 | 9.2 | 17.5 | 9.8 | 7.8 | 4.7 | 6.7 | 15.4 |
| Maternal conditions | 0.1 | 0.0 | 0.1 | 0.2 | 0.1 | 0.1 | 0.1 | 0.0 | 0.1 | 0.1 | 0.1 | 0.1 | 0.1 | 0.1 | 0.0 | 0.1 | 0.4 |
| Perinatal conditions | 4.6 | 3.8 | 5.9 | 4.4 | 2.5 | 3.6 | 3.6 | 3.8 | 1.3 | 3.6 | 3.1 | 3.4 | 3.7 | 2.4 | 4.8 | 5.2 | 7.1 |
|
• Prematurity and low birth weight |
1.2 | 1.9 | 2.0 | 2.7 | 0.9 | 0.6 | 2.0 | 1.5 | 0.4 | 0.8 | 0.4 | 0.9 | 0.9 | 0.4 | 1.4 | 3.4 | 3.2 |
|
• Birth asphyxia and birth trauma |
0.6 | 0.5 | 1.1 | 0.6 | 0.4 | 0.8 | 0.5 | 1.1 | 0.4 | 0.7 | 0.5 | 0.8 | 0.7 | 0.5 | 0.7 | 0.6 | 0.9 |
|
• Neonatal infections and other conditions |
2.8 | 1.4 | 2.7 | 1.1 | 1.2 | 2.2 | 1.1 | 1.1 | 0.5 | 2.0 | 2.1 | 1.7 | 2.1 | 1.4 | 2.7 | 1.2 | 3.0 |
| Nutritional deficienciesi | 0.5 | 0.2 | 0.7 | 1.2 | 0.1 | 2.0 | 0.4 | 1.0 | 0.8 | 1.0 | 0.4 | 0.9 | 0.7 | 0.9 | 0.4 | 0.3 | 1.0 |
NOTES: Age-adjusted mortality rates in the 17 peer countries show similar relationships when the age-adjusted data are examined separately by sex. However, for some conditions, cross-national patterns change slightly. For example, although the mortality rate for overall injuries (and unintentional injuries) is higher in aggregate in Finland than in the United States, among females only the United States has a higher rate. Similarly, among females, the U.S. mortality rate for infectious and parasitic diseases is higher than that of Portugal, the mortality rate for respiratory diseases is higher than that of the United Kingdom, and the mortality rate for musculoskeletal diseases is higher than that of Spain. Austrian females have a higher mortality rate for cardiovascular diseases, and Swedish and Swiss females have higher rates of mortality for intentional injuries. Among males, the U.S. mortality rate for communicable diseases is higher than that of the United Kingdom; Portugal has a higher mortality rate for noncommunicable diseases in general and genitourinary diseases in particular; Denmark has a higher mortality rate for neuropyshicatric disorders; both Denmark and Austria have higher mortality rates for congenital anomalies; Sweden has a slightly higher mortality rate for cardiovascular diseases; Spain has a higher mortality rate for respiratory diseases; and France and Switzerland have higher mortality rates for musculoskeletal diseases. Not listed here are conditions with relatively low mortality rates (e.g., less than 2 per 100,000), for which the standing of the United States compared with peer countries may differ more substantially by sex.
aPrimarily includes ischemic heart disease but also includes higher death rates from hypertensive and inflammatory heart disease. U.S. death rates from cerebrovascular disease and rheumatic heart disease are at or below average.
bIncludes cancers of the mouth and oropharynx, esophagus, stomach, colon and rectum, liver, pancreas, trachea, bronchus, lung, skin, breast, cervix uteri, corpus uteri, ovary, prostate, and bladder; lymphomas; multiple myeloma; and leukemia.
cIncludes Alzheimer and other dementias, Parkinson disease, multiple sclerosis, and drug use disorders, for which the United States has above-average mortality rates, and the following neuropsychiatric disorders for which the United States has average or below-average mortality rates: unipolar depressive disorder, bipolar disorder, schizophrenia, epilepsy, alcohol use disorder, posttraumatic stress disorder, obsessive-compulsive disorder, panic disorder, insomnia, and migraine.
dIncludes peptic ulcer disease, cirrhosis of the liver, and appendicitis.
ePrimarily nephritis and nephrosis. U.S. death rates from benign prostatic hypertrophy are at or below average.
fIncludes rheumatoid arthritis and osteoarthritis, but U.S. death rates from the latter are at or below average.
gIncludes upper and lower respiratory infections and otitis media.
hIncludes HIV/AIDS and other sexually transmitted infections, tuberculosis, diarrheal diseases, childhood-cluster diseases (e.g., pertussis, poliomyelitis), meningitis, hepatitis B and C, malaria, tropical-cluster diseases (e.g., schistosomiasis, leishmaniasis), leprosy, dengue, Japanese encephalitis, trachoma, and intestinal nematode infections.
iIncludes protein-energy malnutrition, iodine deficiency, Vitamin A deficiency, and iron-deficiency anemia.
SOURCE: Adapted from World Health Organization (2011a, Table 3).
for the 17 peer countries and shows that the United States also experiences relatively high mortality rates for neuropsychiatric conditions, respiratory diseases, diabetes and other endocrine disorders, genitourinary disease, congenital anomalies, infectious diseases, and perinatal conditions. This pattern differs little when the data are examined separately by sex (see Notes in Table 1-1). An interactive graph, which allows a more thorough examination of the data in Table 1-1, is located at http://nationalacademies.org/IntlMortalityRates.
Figure 1-3 shows that in 2008 the United States had the second highest death rate from injuries among the 17 peer countries, exceeded only by Finland (World Health Organization, 2011a, Table 3). Unintentional injuries are the leading cause of death among Americans, from ages 1-44 (National Center for Health Statistics, 2012).
An important contributor has been deaths related to transportation. In 2009, the United States had the highest death rate from transportation-related accidents among the 17 peer countries (and the third highest in the OECD, exceeded only by Mexico and the Russian Federation). The death rate from transportation-related accidents decreased by 42 percent in OECD countries between 1995 and 2009, but by only 11 percent in the United States (OECD, 2011b). Although there are more motorists and miles driven in the United States, calculations of fatality rates per vehicle-kilometer, which correct for this confounding variable, also show that the United States
FIGURE 1-3 Mortality from injuries in 17 peer countries, 2008.
SOURCE: Data from World Health Organization (2011a, Table 3).
FIGURE 1-4 Motor vehicle fatalities in the United States and 15 other high-income countries, 1975-2008.
NOTE: The comparison set of countries in this analysis are Australia, Austria, Belgium, Denmark, Finland, France, Germany, Great Britain, Israel, Japan, the Netherlands, Norway, Slovenia, Sweden, and Switzerland.
SOURCE: Transportation Research Board (2011, Figure 2-2c).
has lost the advantage it once held over other countries. Figure 1-4 shows the trend over three decades. As the Transportation Research Board (2011, p. 40) explains:
Fatality rates per vehicle kilometer have declined greatly in every high-income country in the past several decades, and the absolute disparity of rates among countries has lessened. A comparison of the U.S. experience with that of 15 other high-income countries for which 1975–2008 data are available shows that the U.S. fatality rate was less than half the aggregate rate in the other countries in 1975 but has been higher since 2005. Consequently, total annual traffic deaths in the 15 countries fell by 66 percent in the period, while U.S. deaths fell by only 16 percent. The U.S. fatality rate was among the best before 1990 but has been below the median rate of the group every year since 2001.
The United States also has dramatically higher rates of death from violent injuries, especially from firearms. In a study that compared 23 OECD
countries in 2003, the U.S. homicide rate was 6.9 times higher than the other high-income countries and the rate of firearm homicides was 19.5 times higher. Although overall suicide rates were lower in the United States than in those countries, firearm suicide rates were 5.8 times higher than in other countries. Across the 23 countries in the study, 80 percent of all firearm deaths occurred in the United States (Richardson and Hemenway, 2011). This pattern is not new; data from the early 1990s showed similar results (Krug et al., 1998).
Although the incidence of AIDS has fallen since the early 1990s, the United States still has the highest incidence of AIDS among the 17 peer countries (and the third highest in the OECD, exceeded only by Brazil and South Africa) (OECD, 2011b). The incidence of AIDS in the United States (122 per million) is almost nine times the OECD average (14 per million).5
High mortality rates in the United States relative to other rich nations have been the subject of numerous research studies. A 2005 study reported that U.S. adults aged 15-59 had higher mortality rates than those in nine economically comparable nations: “Compared with other nations in the WHO’s mortality database, in the United States 15-year-old girls rank 38th and 15-year-old boys rank 34th in their likelihood of reaching age 60” (Jenkins and Runyan, 2005, p. 291). These researchers noted that the higher mortality was true for both sexes and throughout the first five decades of life (Jenkins and Runyan, 2005).
The U.S. health disadvantage is not limited to death rates; the United States also has relatively high prevalence rates for disease and disability. Chapter 2 details this morbidity disadvantage by age group, but in Box 1-1 we briefly note the key findings that apply across the entire U.S. population.
The United States does enjoy some health advantages compared with other countries. In 2009, the United States had the third lowest mortality rate from stroke among the 17 peer countries (OECD, 2011b), despite its above-average mortality for ischemic heart disease.6 As of 2009, the U.S. suicide rate (10.5 per 100,000 persons) was also below the average of the 16 peer countries (OECD, 2011b). Finally, although the U.S. incidence rate for cancer is the fourth highest of the 17 peer countries (OECD, 2011b),7 mortality rates for certain cancers (e.g., cervical and colorectal cancer) are lower than most peer countries (World Health Organization, 2011a).
_________________
5The United States has the fifth highest prevalence of HIV infection among 40 OECD countries, exceeded only by Portugal, the Russian Federation, Estonia, and South Africa (OECD, 2011b), and the highest prevalence of HIV infection (for ages 15-49) among the 17 peer countries (World Health Organization, 2010).
6The reasons for this differential pattern are not entirely clear, but they may relate to cross-national differences in risk factors and treatment for cerebrovascular disease.
7The incidence of cancer may be skewed by the intensity of screening programs in the United States and may not accurately reflect the prevalence of the disease.
Table 1-2 lists other conditions for which the U.S. mortality rate is at or below the average of the 16 other peer countries.
CROSS-NATIONAL DIFFERENCES IN LIFE EXPECTANCY
Not surprisingly, higher mortality rates affect life expectancy in the United States. Perhaps the single most impressive achievement of the past century is the striking increase in longevity in nearly all parts of the world. At the turn of the 20th century, North American and Western European countries experienced life expectancies at birth of 40-50 years (Preston and Haines, 1991): 100 years later (in 2007), no country in these regions had a life expectancy of less than 75 years, and most had levels of more than 80 years (Human Mortality Database, 2012).
However, as shown in Table 1-3, there remain large differences in life expectancy at birth among high-income peer countries. In 2007, men in Switzerland and women in Japan enjoyed the longest life expectancies for their sexes. In contrast, the United States ranked last among males and next to last among females.8 These differences with the top-performing countries amount to approximately 3.7 years for males and 5.2 years for females (Ho and Preston, 2011).9
We emphasize that these large cross-national differences are often eclipsed by even larger within-country disparities in life expectancy. As discussed in Box 1-2, such disparities are substantial in the United States (Agency for Healthcare Research and Quality, 2011; Bleich et al., 2012; Braveman et al., 2011a; Satcher et al., 2005; Woolf et al., 2004), and they may be part of the reason that the United States compares so unfavorably with its peers.
The U.S. disadvantage in life expectancy relative to other high-income countries is not a recent phenomenon (although the gap has grown over time), nor is this the first report to call attention to the problem. Jenkins and Runyan (2005) reported that U.S. survival rates for each of the five decades
_________________
8The life expectancy of females was lower in Denmark than in the United States in 2007. Life expectancy in aggregate (for males and females) has historically been lower in Denmark than in the United States, but not since 2005. These findings are from the Human Mortality Database (2012), which provides regularly updated detailed mortality and population data to researchers, students, and others interested in the history of human longevity. It is available at http://www.mortality.org.
9Ho and Preston’s analysis for this panel is modeled on a similar analysis of mortality above age 50 that they conducted for the National Research Council (2011) panel and also published in Ho and Preston (2010). The current analysis draws on data from three sources: the Human Mortality Database, the WHO Mortality Database, and Statistics Canada. The data were downloaded July 2011, and, for each country, the latest year of data available between 2006 and 2008 was extracted. Dana Glei of Georgetown University provided the panel with a focused mid-project technical review of this analysis.
BOX 1-1
The U.S. Morbidity Disadvantage
As of 2010, the United States had the highest prevalence of diabetes (for adults aged 20-79) among the 17 peer countries (and among all OECD countries except Mexico). The U.S. obesity epidemic probably plays a major role in the prevalence of diabetes. The United States has the highest prevalence of adult obesity among the 17 peer countries (and all other OECD countries), a position it has held for decades. As of 2009, the prevalence of obesity in the United States (33.8 percent) was twice the OECD average (16.9 percent) (OECD, 2011b).
In a comparison of the health of Americans and the English across the life span, from birth to age 80, the United States had a higher prevalence of obesity, lipid disorders, diabetes, and asthma (Martinson et al., 2011a). Among females, the United States also had a higher prevalence of hypertension, heart attack and angina, and stroke. The differences were as large for young people as for old people. The researchers found that the English advantage persisted even when the samples were restricted to whites, people with health insurance, nonsmokers, nondrinkers, individuals of normal weight, or those in specific income categories (Martinson et al., 2011a, 2011b).
Studies of risk factors, rather than diseases, have yielded more mixed results. For example, some studies find that hypertension is less common in the United States than in other countries (Danaei et al., 2011a; Wolf-Maier et al., 2003), while others report the opposite (Banks et al., 2006; Martinson et al., 2011a). Similarly, some studies report that serum lipid levels are lower in the United States than in other countries (Farzadfar et al., 2011; Martinson et al., 2011a), but another study that compared biological risk factors in American and Japanese adults over age 20
between ages 15 and 59 were lower than those in nine economically comparable nations. Kunitz and Pesis-Katz (2005) reported that Americans have a shorter life expectancy than their neighbors in Canada. Meslé and Vallin (2006) and Rau et al. (2008) reported that, from 1980 to 2006, life expectancy in the United States grew more slowly than in almost every other high-income country.
The most extensive and recent analysis was a report by the National Research Council (2011). As noted in the Introduction of this report, that earlier report analyzed how life expectancy at age 50 had changed between 1980 and 2007, noting that it had increased by only 2.5 years in the United States compared with increases of 6.4 years in Japan, 5.2 years in Italy, and an average of 3.9 years in nine high-income countries other than the United
found that Americans had a higher summary risk score, including higher levels of serum lipids, glycosylated hemoglobin, and obesity, especially before age 50 (Crimmins et al., 2008).*
The percentage of American adults who describe their health as “good” or “very good” is the highest among people in high-income countries (OECD, 2011b), but this metric is subject to some limitations. Questions about self-rated health may be answered differently across countries due to cultural differences—such as differences in the likelihood or threshold for reporting good health—and may not always track well with objective health indicators. Danish residents, for example, are known to have shorter life expectancy than people in many other countries, but they are more likely to report their health as good or excellent (Oksuzyan et al., 2010). To some extent, this paradox may reflect attitudinal differences across cultures about the relative importance of physical health for a satisfying life. Self-rated health is influenced by mental health, which may differ in the United States from other countries. Finally, questions have been raised about the statistical validity of questions about self-rated health when presented to subjects of varied nationalities. The significance of the high self-rated health of Americans is therefore not entirely clear.
_______________________
*Some of these inconsistencies may reflect cross-national differences in treatment patterns. Americans with hypertension and hyperlipidemia may be more likely than others to receive medication for these conditions (see Chapter 4), and this may account for lower levels of blood pressure and serum lipids observed in some studies.
States. As a result, the U.S. ranking in life expectancy at age 50 fell from the middle of the distribution for peer countries in 1980 to the bottom quartile by 2007. The drop was especially sharp for U.S. women (National Research Council, 2011).
Data on life expectancy at birth reveal an even more alarming pattern. Figure 1-5 shows that, among peer countries, male life expectancy at birth in the United States ranked near the bottom in 1980 and at the bottom in 2006. Figure 1-6 shows that female life expectancy, which had been near the median in 1979, ranked at the bottom in 2006. As documented in Box 1-3, the U.S. ranking on life expectancy has been deteriorating for decades and is now decades behind many peer countries.
A notable exception to this unfavorable pattern is the higher life expectancy
TABLE 1-2 U.S. Death Rates Relative to 16 Peer Countries, 2008
| Cause of Death | Mortality Rate (per 100,000) | ||
| United States | Peer Countries (N = 16) | ||
| Unweighted Mean | Range | ||
| Death Rates Above Average | |||
| Cardiovascular diseasesa | 155.7 | 133.6 | 97.4–174.9 |
| Neuropsychiatry conditionsb | 39.2 | 28.1 | 7.2–48.4 |
| Respiratory disease | 34.3 | 21.0 | 12.7–34.4 |
| Infectious and parasitic diseases | 15.4 | 7.7 | 4.4–17.5 |
| Diabetes mellitus | 15.2 | 10.2 | 4.5–19.3 |
| Genitourinary diseasesc | 12.3 | 7.2 | 3.0–12.2 |
| Endocrine disorders | 7.1 | 4.2 | 1.6–8.1 |
| Congenital anomalies | 4.3 | 3.3 | 2.6–4.0 |
| Musculoskeletal diseasesd | 2.9 | 2.4 | 1.2–3.5 |
| Nutritional deficiencies | 1.0 | 0.7 | 0.1–2.0 |
| Skin diseases | 0.8 | 0.6 | 0.1–1.5 |
| Maternal conditions | 0.4 | 0.1 | 0.0–0.2 |
| Perinatal conditions | 7.1 | 3.7 | 1.3–5.9 |
| Unintentional injuriese | 35.5 | 20.4 | 13.7–38.6 |
| Intentional injuries | 17.3 | 11.4 | 5.6–20.2 |
| Death Rates at or Below Average | |||
| Malignant neoplasmsf | 123.8 | 127.3 | 106.5–157.7 |
| Digestive diseasesg | 19.8 | 19.8 | 13.0–29.5 |
| Respiratory infections | 9.7 | 12.3 | 4.0–29.7 |
| Other neoplasms | 2.9 | 3.3 | 2.1–5.3 |
| Oral conditionsg | 0.0 | 0.0 | 0.0–0.1 |
| Sense organ diseasesh | 0.0 | 0.0 | 0.0 |
NOTE: Higher death rates shown in bold.
aPrimarily ischemic heart disease but also includes higher death rates from hypertensive and inflammatory heart disease. U.S. death rates from cerebrovascular disease and rheumatic heart disease are at or below average.
bThe United States has average or below-average mortality rates for the following neuropsychiatric disorders: unipolar depressive disorder, bipolar disorder, schizophrenia, epilepsy, alcohol use disorder, posttraumatic stress disorder, obsessive-compulsive disorder, panic disorder, insomnia, and migraine.
cPrimarily nephritis and nephrosis. U.S. death rates from benign prostatic hypertrophy are at or below average.
dIncludes rheumatoid arthritis and osteoarthritis, but U.S. death rates from the latter are at or below average.
eThe U.S. rate for “other” unintentional injuries (excluding road traffic accidents, poisonings, fires, and drownings) is equivalent to the peer countries.
fWith the exception of the following malignant neoplasms for which the United States has higher mortality rates: cancers of the trachea, bronchus, and lung; corpus uteri cancer; lymphomas and multiple myeloma; and leukemia.
gIncludes peptic ulcer disease, cirrhosis of the liver, and appendicitis.
hLow mortality rates round to 0.0 per 100,000.
SOURCE: Adapted from World Health Organization (2011a, Table 3).
TABLE 1-3 Life Expectancy at Birth in 17 Peer Countries, 2007
| Males | Females | |||||
| Country | LE | Rank | Country | LE | Rank | |
| Switzerland | 79.33 | 1 | Japan | 85.98 | 1 | |
| Australia | 79.27 | 2 | France | 84.43 | 2 | |
| Japan | 79.20 | 3 | Switzerland | 84.09 | 3 | |
| Sweden | 78.92 | 4 | Italy | 84.09 | 3 | |
| Italy | 78.82 | 5 | Spain | 84.03 | 5 | |
| Canada | 78.35 | 6 | Australia | 83.78 | 6 | |
| Norway | 78.25 | 7 | Canada | 82.95 | 7 | |
| Netherlands | 78.01 | 8 | Sweden | 82.95 | 7 | |
| Spain | 77.62 | 9 | Austria | 82.86 | 9 | |
| United Kingdom | 77.43 | 10 | Finland | 82.86 | 9 | |
| France | 77.41 | 11 | Norway | 82.68 | 11 | |
| Austria | 77.33 | 12 | Germany | 82.44 | 12 | |
| Germany | 77.11 | 13 | Netherlands | 82.31 | 13 | |
| Denmark | 76.13 | 14 | Portugal | 82.19 | 14 | |
| Portugal | 75.87 | 15 | United Kingdom | 81.68 | 15 | |
| Finland | 75.86 | 16 | United States | 80.78 | 16 | |
| United States | 75.64 | 17 | Denmark | 80.53 | 17 | |
NOTE: LE = life expectancy at birth (years), or e0.
SOURCE: Ho and Preston (2011, Table 1).
of very old Americans. Manton and Vaupel (1995) demonstrated that life expectancy from ages 80-95 was higher in the United States than in England, France, Japan, and Sweden.10 Fifteen years later, Ho and Preston (2010) observed the same pattern for adults over age 65. U.S. older adults had among the lowest age-specific mortality rates of 17 peer countries: this pattern has been observed in every decade since 1960, suggesting that the underlying cause is not a recent phenomenon. Researchers are unclear whether this phenomenon reflects unusually aggressive efforts in the United States to identify and treat chronic diseases or a selection process, that is, healthier adults surviving to old age (Finch and Crimmins, 2004; Ho and Preston, 2010; Janssen et al., 2005a).
_________________
10The one exception was for males in Japan, but the difference was not statistically significant.
BOX 1-2
Disparities in Life Expectancy in the United States
The range of life expectancies across U.S. states, which is 7.0 years for males and 6.7 years for females, exceeds the cross-national range between the United States and peer countries, which is 3.7 years for males and 5.2 years for females (see Table 1-3). Although life expectancy is very low in Appalachia and the Deep South, some states in the northern Plains and along the Pacific coast and Eastern seaboard easily outrank many peer countries. For example, males in Minnesota and Hawaii have a higher life expectancy than those in nine peer countries. Females in Hawaii have a life expectancy of 84.8 years, higher than that of every peer country except Japan (Measure of America, 2012).
Even greater disparities are found at the county level. For example, a recent study estimated that life expectancy in 2007 varied dramatically across U.S. counties for both males (from 65.9 to 81.1 years) and females (from 73.5 to 86.0 years), although most U.S. counties still compared unfavorably with the best-performing high-income countries. Merging 3,147 counties into 2,357 county clusters suitable for statistical analysis, researchers found that only 33 counties had a male life expectancy that exceeded the average of 10 leading countries, and only 8 counties had a higher female life expectancy (Kulkarni et al., 2011).
Of course, small geographic areas that compare unfavorably with the best countries can be found anywhere, but this may occur more often in the United States than in other high-income countries. For example, in a comparison of U.S. counties with small geographic units in three peer countries—Japan, Canada, and the United Kingdom—researchers found that 17 percent of U.S. counties had a male life expectancy that was more than 30 years behind that of the top 10 countries, whereas the same was only true for 2 percent of Canadian health areas, for 0.2 percent of British local authorities, and for no Japanese municipalities (Kulkarni et al., 2011).
The large geographic health disparities in the United States, which have been documented to the level of census tracts and neighborhoods (Bay Area Regional Health Inequities Initiative, 2008; Center on Human Needs, 2012b; Ezzati et al., 2008; Krieger et al., 2008), are less about geography than the characteristics of the local population and environment (Hans, 2009): see Chapters 6 and 7. For example, black infants in the United States are more than twice as likely as white infants to die before their first birthday (National Center for Health Statistics, 2012). Among black males with less than 12 years of education, life expectancy in 2008 was 14.2 years shorter than for white males with 16 or more
years of education (Olshansky et al., 2012). Many other poignant examples of major health disparities by race, ethnicity, and socioeconomic status in the United States have been documented (see, e.g., Agency for Healthcare Research and Quality, 2011; Braveman and Egerter, 2008; Institute of Medicine, 2003d; Murray et al., 2006; National Center for Health Statistics, 2012). Disadvantaged Americans living in disadvantaged regions of the United States have very unfavorable health outcomes when compared with other countries. One study found that black and Native Americans in some regions had mortality rates that were almost twice that of the OECD countries with the highest mortality rates (Murray et al., 2006).
Large within-country health disparities in the United States may contribute in important ways to the nation’s overall health disadvantage relative to other high-income countries. Although studies reviewed in this report suggest that the health disadvantage relative to peer countries persists even when the U.S. data are limited to non-Hispanic whites or upper-income populations, the U.S. health disadvantage is clearly far greater among the large proportion of Americans who live amid unfavorable health conditions. And as discussed in Chapters 6 and 7, the health of the entire population may be affected by the conditions that more severely compromise the health of disadvantaged groups.
The National Research Council (2011) study explored potential explanations for the relatively poor U.S. performance at age 50 and older and concluded that the long history of heavy cigarette smoking in the United States accounted for a substantial share of the shortfall. Other contributors to the U.S. disadvantage included a rapid growth in obesity, significant socioeconomic inequalities, and a lack of health insurance for large segments of the population (National Research Council, 2011). These (and other) explanations are examined in Part II of this report.
The panel was charged with looking at “health and disability over the life-cycle” and therefore extended the prior report’s analysis of U.S. health conditions (above age 50) to younger Americans, from birth to age 50, to
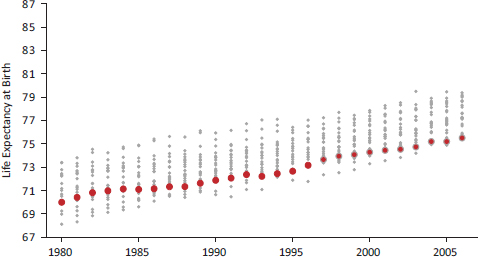
FIGURE 1-5 U.S. male life expectancy at birth relative to 21 other high-income countries, 1980-2006.
NOTES: Red circles depict newborn life expectancy in the United States. Grey circles depict life expectancy values for Australia, Austria, Belgium, Canada, Denmark, Finland, France, Iceland, Ireland, Italy, Japan, Luxembourg, the Netherlands, New Zealand, Norway, Portugal, Spain, Sweden, Switzerland, the United Kingdom, and West Germany.
SOURCE: National Research Council (2011, Figure 1-3).
determine if there is a similar U.S. health disadvantage in life expectancy.11 A cross-national analysis of mortality data from birth to age 50 reveals a U.S. health disadvantage at ages under 50 that is more serious than what has been found for those over age 50 (Ho and Preston, 2011) (see Figures 1-7 and 1-8), which show the probabilities of survival from birth to age 50 since 1980. The United States has clearly fallen far behind its peer countries in life expectancy—both under and over age 50.
Is higher mortality in the United States concentrated at specific ages or is it more general? Figure 1-9 displays the rank order of U.S. mortality relative to the 16 peer countries listed in Table 1-3, stratified by age group. Remarkably, the U.S. rank for either sex is never better than 15th at any age below 75. The United States has the worst ranking in most age groups, especially in the long span that stretches between birth and age 55. In short, in terms of sheer physical survival, people living in the United States fare
_________________
11Chapter 2 examines the U.S. disadvantage on health measures other than life expectancy, including the prevalence of diseases and injuries across the life course.
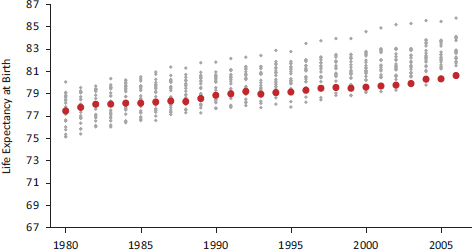
FIGURE 1-6 U.S. female life expectancy at birth relative to 21 other high-income countries, 1980-2006.
NOTES: Red circles depict newborn life expectancy in the United States. Grey circles depict life expectancy values for Australia, Austria, Belgium, Canada, Denmark, Finland, France, Iceland, Ireland, Italy, Japan, Luxembourg, the Netherlands, New Zealand, Norway, Portugal, Spain, Sweden, Switzerland, the United Kingdom, and West Germany.
SOURCE: National Research Council (2011, Figure 1-4).
worse than their counterparts in peer countries except at the very oldest ages.
This finding is not simply a reflection of the racial and ethnic diversity of the U.S. population. When the analysis was limited to non-Hispanic whites in the United States, the poor U.S. ranking hardly changed (see Figure 1-10). At no age below 55 do U.S. non-Hispanic whites rank better than 16th out of 17 countries (for either sex). Therefore, the overall poor position of the United States cannot be attributed to any particular minority group because the disadvantage is observed even among non-Hispanic whites.
Another distinct aspect of the United States is the shape of its survival curve: higher mortality rates among young Americans and the increased survival of the elderly have produced a wider spread12 in the age of death
_________________
12The U.S. survival curve is less “rectangular” (Wilmoth and Horiuchi, 1999) than in other countries. In most peer countries, mortality is declining at a faster rate among younger ages than older ages. This phenomenon appears to be more pronounced in other countries than in the United States.
BOX 1-3
How Many Years Behind Is the United States?
One focus of this report is the U.S. health disadvantage among younger adults. One summary measure of mortality in this age group is the probability that a 15-year-old will die before reaching age 50 (given current age-specific mortality rates). Demographers refer to this measure as 35q15, or the probability of dying in the 35 years following one’s 15th birthday. For females in the 16 peer countries, 35q15 was around 2 percent in 2007 but was approximately twice as high—4 percent—in the United States. This means that the probability of a 15-year-old U.S. female dying within 35 years was double the average for 16 peer high-income countries.
In all high-income countries, including the United States, 35q15 has been declining for more than half a century. But the relative position of the United States has deteriorated since the late 1950s, when it was near the average of its peers. These countries, on average, had reduced their 35q15 for females to the U.S. 2007 level of 4 percent almost 40 years earlier. In this sense, one can say that, in 2007, the United States was 40 years behind the average of its peers (and 50 years behind the leading peer country).
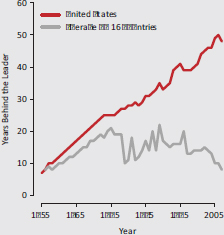
FIGURE 1-3a Number of years behind the leading peer country for the probability of dying between ages 15 and 50 among females, 1958-2007.
NOTES: The figure plots 35q15, or the probability that a 15-year-old female will die before age 50. The y-axis measures how many years earlier the 35q15 values of the 17 peer countries had been achieved by the country with the lowest 35q15 value for that year.
SOURCE: Verguet and Jamison (2011, Figure 6).
This concept of “years behind” provides a useful indicator of how well a given country is keeping pace with other countries. Figure 1-3a, from Verguet and Jamison (2011), plots years behind the leader for both the United States and the average of its peers for the period 1958-2007. It shows that the United States has fallen further behind the leader, while its peer countries began to “catch up” with the leader (albeit at an uneven pace) beginning in the mid-1970s. The net result of these uneven trends has been a steady decline of the U.S. position from near average to far below average.
Figure 1-3b also plots “years behind the leader” for both the United States and the average of its peers, but in this case it shows female mortality rates, by 5-year age groups, for a single year, 2007. These results confirm a U.S. mortality gap for females across the life span. It is most pronounced between the ages of 15 and 50 and diminishes somewhat for women above age 60.
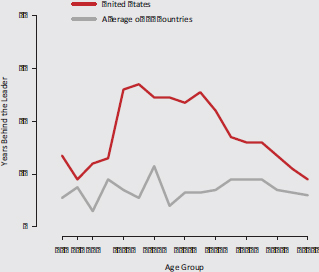
FIGURE 1-3b Number of years behind the leading peer country for female mortality by 5-year age group, 2007.
NOTE: The figure shows how many years earlier female mortality in the 17 peer countries had been achieved by the country with the lowest age-specific mortality for that year.
SOURCE: Verguet and Jamison (2011, Figure 7).
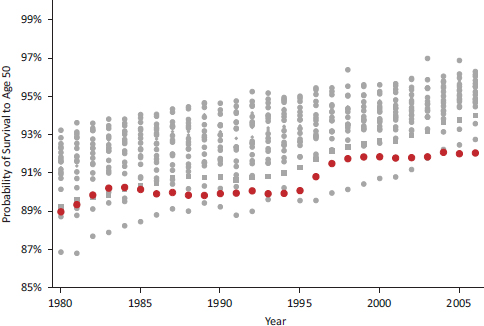
FIGURE 1-7 Probability of survival to age 50 for males in 21 high-income countries, 1980-2006.
NOTES: Red circles show the probability a newborn male in the United States will live to age 50. Grey circles show the probability of survival to age 50 in Australia, Austria, Belgium, Canada, Denmark, Finland, France, Iceland, Ireland, Italy, Japan, Luxembourg, the Netherlands, New Zealand, Norway, Portugal, Spain, Sweden, Switzerland, the United Kingdom, and West Germany.
SOURCE: National Research Council (2011, Figure 1-5).
than in other countries with a similar overall life expectancy (Shkolnikov et al., 2003). As a result, Americans lose more years of life than do those in other high-income countries (Shkolnikov et al., 2011), a topic we address in the next section.
YEARS OF LIFE LOST BEFORE AGE 50
At the turn of the 20th century, an individual born in Western Europe or North America could expect to live no more than 34 years between birth and age 50 (Keyfitz and Flieger, 1990), a loss of 16 years of life. In many countries today, a newborn can expect to live more than 49 of the first 50 years of life.13 These remarkable gains are the result of major reductions in infectious diseases among infants and young children, as well as declines
_________________
13Data are from the Human Mortality Database (2012).
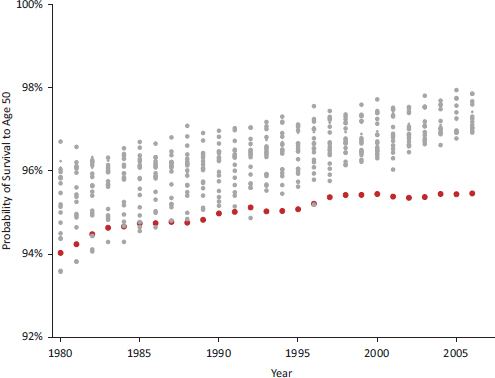
FIGURE 1-8 Probability of survival to age 50 for females in 21 high-income countries, 1980-2006.
NOTES: Red circles show the probability a newborn female in the United States will live to age 50. Grey circles show the probability of survival to age 50 in Australia, Austria, Belgium, Canada, Denmark, Finland, France, Iceland, Ireland, Italy, Japan, Luxembourg, the Netherlands, New Zealand, Norway, Portugal, Spain, Sweden, Switzerland, the United Kingdom, and West Germany.
SOURCE: National Research Council (2011, Figure 1-6).
in maternal mortality, the virtual elimination of infectious diseases among adolescents and middle-aged adults (particularly respiratory tuberculosis), and more recently, lower death rates from cardiovascular diseases from age 35 onward (Cutler and Miller, 2004; Riley, 2001).
Although the United States has shared in these improvements, it still forfeits the most years of potential life before age 50. Figures 1-11 and 1-12 show the number of years lost before age 50 by males and females, respectively, in the 17 peer countries. U.S. male and female newborns can expect to lose about 1.4 years and 0.8 years of life, respectively, before age 50. In the best performing country, Sweden, the corresponding losses are only 0.7 and 0.4 years, respectively. This mortality gap has also grown significantly over time. In 1990, U.S. females and males lost approximately 35 percent more years of life before age 50 than did those in other high-
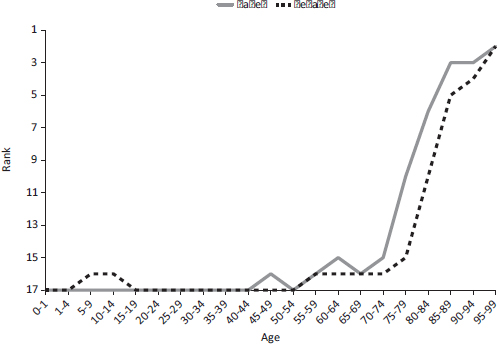
FIGURE 1-9 Ranking of U.S. mortality rates, by age group, among 17 peer countries, 2006-2008.
NOTES: The top rank is number 1, indicating the lowest death rate, and the bottom rank is number 17, indicating the highest death rate. Rankings are based on all-cause mortality rates for 2006-2008. Data for this figure were drawn from (1) the Human Mortality Database, 2011, University of California, Berkeley (USA), and Max Planck Institute for Demographic Research (Germany), available at http://www.mortality.org or http://www.humanmortality.de (data downloaded July 18, 2011) and (2) Arias, Elizabeth, 2011, United States Life Tables, 2007. National Vital Statistics Reports, 59(9), Hyattsville, MD: National Center for Health Statistics.
SOURCE: Adapted from Ho and Preston (2011, Figure 1).
income countries, but by 2009 this figure had grown to nearly 75 percent (Palloni and Yonker, 2012).
What causes of death are responsible for this excess loss of life in the United States? Because deaths in high-income countries are assigned to various causes of death by medical certifiers using internationally accepted criteria, it is possible to examine how life expectancy varies cross-nationally by cause. In this section, the panel presents an analysis of years of life
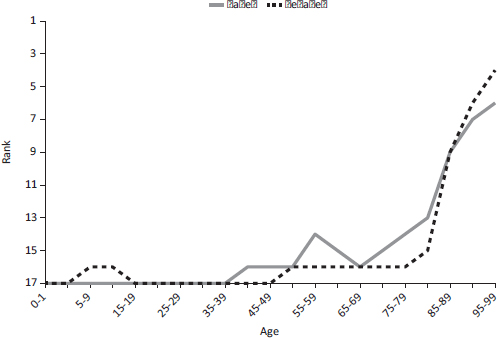
FIGURE 1-10 Ranking of U.S mortality rates for non-Hispanic whites only, by age group, among 17 peer countries, 2006-2008.
NOTES: The top rank is number 1, indicating the lowest death rate, and the bottom rank is number 17, indicating the highest death rate. Rankings are based on all-cause mortality rates for 2006-2008. Data for this figure were drawn from (1) the Human Mortality Database, 2011, University of California, Berkeley (USA), and Max Planck Institute for Demographic Research (Germany), available at http://www.mortality.org or http://www.humanmortality.de (data downloaded on July 18, 2011) and (2) Arias, Elizabeth, 2011, United States Life Tables, 2007, National Vital Statistics Reports, 59(9), Hyattsville, MD: National Center for Health Statistics.
SOURCE: Adapted from Ho and Preston (2011, Figure 2).
lost by cause for age groups under age 50, as reported by Ho and Preston (2011).14 Years of life lost before age 50 is a measure that combines the intensity of a particular cause of death with its age incidence. It indicates how many potential years of life below age 50 are claimed by a particular cause of death—that is, how many additional years would be lived before age 50 if deaths from a particular cause were eliminated.
To facilitate comparisons with the United States, Ho and Preston (2011) created a composite of the other 16 peer countries by calculating an unweighted average of the age- and cause-specific death rates across these countries and grouping causes of death into the major categories used in the
_________________
14For deaths by cause after age 50, see National Research Council (2011).
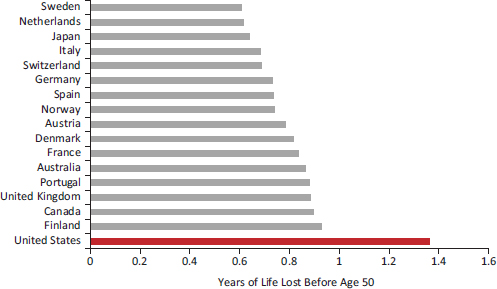
FIGURE 1-11 Years of life lost before age 50 by males in 17 peer countries, 2006-2008.
NOTE: Data for this figure come from the Human Mortality Database (downloaded July 18, 2011, last updated July 13, 2011); the WHO Mortality Database (downloaded July 18, 2011, last updated March 25, 2011); and Statistics Canada (downloaded July 22, 2011, data released February 23, 2010).
SOURCE: Adapted from Ho and Preston (2011, Figure 3).
Global Burden of Disease Study (Mathers et al., 2006). As shown in Figures 1-13 and 1-14, the results show that the United States loses a larger number of years of life to all of the major disease and injury groupings than do the other peer countries. Although communicable diseases and nutritional conditions are no longer a leading cause of premature deaths in most high-income countries, the United States still fares poorly in this category. The gap in years of life lost from noncommunicable diseases—which includes heart disease, cancer, and other conditions not caused by infections—is also large. For both males and females, cardiovascular disease and congenital anomalies together account for more than half of the U.S. excess mortality from noncommunicable diseases. Diabetes, digestive diseases, and respiratory diseases also contribute to the gap.
Intentional and unintentional injuries are also major contributors to the excess years of life lost by Americans before age 50. Intentional injuries—homicide and suicide—are particularly important causes of early deaths among U.S. males. Ho and Preston (2011) found that 69 percent of all U.S. homicide deaths in 2007 (73 percent of homicides before age 50) involved firearms (for both sexes combined), compared with a mean of 26 percent
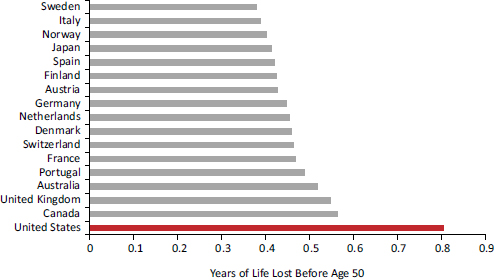
FIGURE 1-12 Years of life lost before age 50 by females in 17 peer countries, 2006-2008.
NOTE: Data for this figure come from the Human Mortality Database (downloaded July 18, 2011, last updated July 13, 2011); the WHO Mortality Database (downloaded July 18, 2011, last updated March 25, 2011); and Statistics Canada (downloaded July 22, 2011, data released February 23, 2010).
SOURCE: Adapted from Ho and Preston (2011, Figure 4).
in the other countries. Both males and females in the United States lose an equivalent number of years of life to unintentional injuries, such as motor vehicle accidents, falls, poisonings, fires, and drowning. Unintentional poisonings are the largest contributor to nontransportation-related accidents: in 2007, they accounted for 64 percent and 72 percent of nontransportation-related U.S. deaths under age 50 among males and females, respectively.
Drug-related deaths are another category in which the United States loses more years of life than other countries. Drug-related deaths include both drug- and alcohol-induced deaths, which account for 76 percent and 24 percent, respectively, of all drug-related deaths before age 50. This category includes deaths from medical conditions or complications induced by alcohol or drugs, selected mental and behavioral disorders due to alcohol or the use of psychoactive substances, accidental or intentional alcohol or drug poisonings or overdoses, and deaths with measurable blood levels of alcohol or other addictive drugs (e.g., opiates, cocaine, hallucinogens, psychotropic drugs). This category does not include deaths from drunk driving or other accidents, homicides, or other deaths that may be indirectly related to alcohol or drug use.
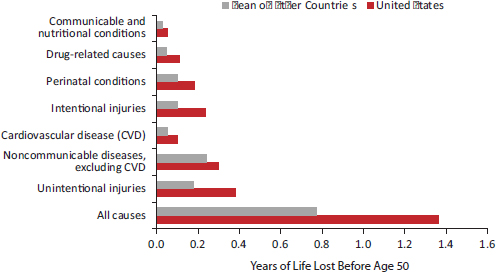
FIGURE 1-13 Years of life lost before age 50 due to specific causes of death among males in 17 peer countries, 2006-2008.
NOTES: Drug-related and other causes are not always mutually exclusive. The largest areas of overlap occur between drug-related causes and noncommunicable diseases and injuries. For example, drug-related digestive diseases (e.g., alcoholic liver disease) and drug-related neuropsychiatric disorders are also included in the noncommunicable disease category. Suicide and homicide by drugs fall under both drug-related causes and intentional injuries, and accidental drug overdoses fall under both drugrelated causes and unintentional injuries. The drug-related causes category is included to illustrate the excess years of life lost from drug-related causes of death in the United States relative to other countries. Data for this figure come from the Human Mortality Database (downloaded July 18, 2011, last updated July 13, 2011); the WHO Mortality Database (downloaded July 18, 2011, last updated March 25, 2011); and Statistics Canada (downloaded July 22, 2011, data released February 23, 2010).
SOURCE: Adapted from Ho and Preston (2011, Figure 5).
The specific conditions responsible for the extra years of life lost in the United States are shown in Figures 1-15 and 1-16. Three causes—homicide, motor vehicle accidents, and nontransportation-related injuries—each contribute between 16 and 19 percent of the U.S. shortfall for males, and suicide contributes another 4 percent. Thus, deaths from injury of one form or another contribute the majority, 57 percent, of the excess mortality among American males under age 50. This is especially noteworthy given that mortality below age 50 accounts for the bulk of the U.S. male disadvantage in longevity. Noncommunicable diseases among men are also not trivial, accounting for 18 percent of the U.S. excess in years of life lost, with 8 percent coming from cardiovascular disease and 10 percent from all other noncommunicable diseases.
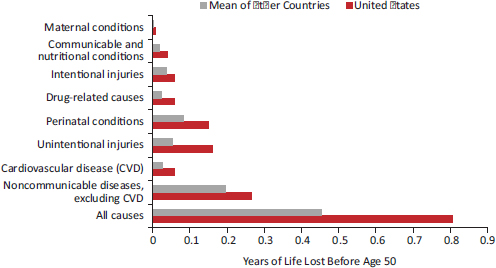
FIGURE 1-14 Years of life lost before age 50 due to specific causes of death among females in 17 peer countries, 2006-2008.
NOTES: Drug-related and other causes are not always mutually exclusive. The largest areas of overlap occur between drug-related causes and noncommunicable diseases and injuries. For example, drug-related digestive diseases (e.g., alcoholic liver disease) and drug-related neuropsychiatric disorders are also included in the noncommunicable disease category. Suicide and homicide by drugs fall under both drug-related causes and intentional injuries, and accidental drug overdoses fall under both drug-related causes and unintentional injuries. The drug-related causes category is included to illustrate the excess years of life lost from drug-related causes of death in the United States relative to other countries. Data for this figure come from the Human Mortality Database (downloaded July 18, 2011, last updated July 13, 2011); the WHO Mortality Database (downloaded July 18, 2011, last updated March 25, 2011); and Statistics Canada (downloaded July 22, 2011, data released February 23, 2010).
SOURCE: Adapted from Ho and Preston (2011, Figure 6).
The causes of the excess years of life lost by U.S. females are more diverse. Homicide, motor vehicle accidents, and nontransportation-related accidents also play an important role, contributing a total of 37 percent of the excess years of life lost in the United States. For intentional injuries, the excess comes from homicide alone, because U.S. women lose fewer years of life to suicide than women in other peer countries. Noncommunicable diseases are more important for women, contributing 29 percent of the U.S. excess in years of life lost compared with 18 percent for men. Of this 29 percent, 9 percent comes from cardiovascular disease and the remaining 20 percent from all other noncommunicable diseases. Perinatal conditions also affect females more than males: they contribute 19 percent to the U.S. excess in years of life lost among females and 13 percent among males (Ho and Preston, 2011).
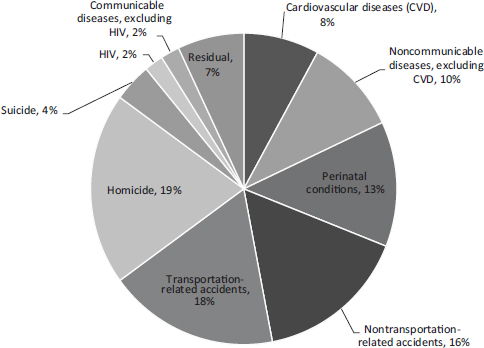
FIGURE 1-15 Contribution of cause-of-death categories to difference in years of life lost before age 50 between the United States and the mean of 16 peer countries, males, 2006-2008.
NOTES: Because of the overlap with other cause-of-death categories, drug-related causes are not included as a separate category in this figure, which shows mutually exclusive contributions of specific causes of death (see NOTES in Figure 1-13). Data for this figure come from the Human Mortality Database (downloaded July 18, 2011, last updated July 13, 2011); the WHO Mortality Database (downloaded July 18, 2011, last updated March 25, 2011); and Statistics Canada (downloaded July 22, 2011, data released February 23, 2010).
SOURCE: Adapted from Ho and Preston (2011, Figure 7).
INFLUENCE OF EARLY DEATHS ON LIFE EXPECTANCY AT BIRTH
It is useful to consider how much of the U.S. disadvantage in life expectancy at birth is attributable to deaths before or after age 50. That is: does the average American newborn have a shorter life expectancy than peers in other countries because of the diseases of old age or because of threats to health earlier in life? Answering this question involves a calculation that combines the actual years of life lost before age 50 (as shown in Figures 1-11 and 1-12) with the probability of surviving to age 50 (as shown in Figures 1-7 and 1-8). The latter is included because individuals who die before age 50 obviously forfeit all years of life beyond that age, but the forfeiture
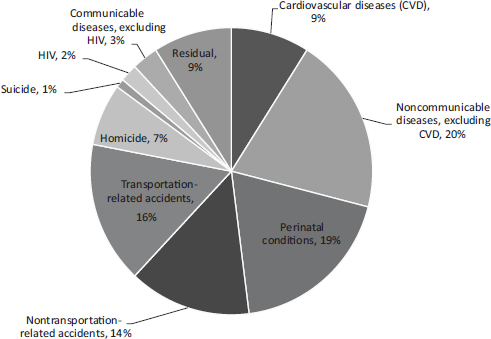
FIGURE 1-16 Contribution of cause-of-death categories to difference in years of life lost before age 50 between the United States and the mean of 16 peer countries, females, 2006-2008.
NOTES: Because of the overlap with other cause-of-death categories, drug-related causes are not included as a separate category in this figure, which shows mutually exclusive contributions of specific causes of death (see NOTES in Figure 1-14). Data for this figure come from the Human Mortality Database (downloaded July 18, 2011, last updated July 13, 2011); the WHO Mortality Database (downloaded July 18, 2011, last updated March 25, 2011); and Statistics Canada (downloaded July 22, 2011, data released February 23, 2010).
SOURCE: Adapted from Ho and Preston (2011, Figure 8).
is attributable to death before age 50. The calculation reveals that about two-thirds of the U.S. shortfall in life expectancy in 2007 relative to France and Japan—two very high-performing countries—were attributable to high U.S. mortality after age 50 (Ho and Preston, 2011).
A somewhat different picture emerges when the results are separated by sex and the comparison is made with the composite of the other 16 peer countries. Deaths after age 50 contributed to 58 percent of the U.S. shortfall in newborn life expectancy among females but only to 32 percent of the shortfall among newborn males (Ho and Preston, 2011). That is, most of the life expectancy difference among males is attributable to high U.S. mortality before age 50. This finding also implicates intentional and unintentional
injuries, discussed above, which together account for a majority of the excess in U.S. male mortality before age 50.
Vital statistics paint a definitive and vivid portrait of the relative position of the United States in cross-national health comparisons. On nearly all indicators of mortality, survival, and life expectancy, the United States ranks at or near the bottom among high-income countries. Its poor performance pertains to both sexes, to all ages below 75, to white non-Hispanics as well as to the population as a whole, and to the most important causes of death.
Although the poor ranking of U.S. life expectancy at birth is partly attributable to relatively higher mortality rates after age 50, that is not the entire story: the United States compares unfavorably on mortality rates up to age 75. U.S. performance is particularly poor from birth to age 50, ranking near the bottom among peer countries. These findings and those from previous research, including the prior National Research Council (2011) report, suggest that throughout the life course people living in the United States fare worse than their peers, except at the oldest ages.
The data reported here highlight specific threats to health early in life, beginning in infancy: the United States has the lowest life expectancy at birth of the 17 peer countries the panel examined. Accidents (unintentional injuries), many of which involve adolescents and young adults, claim about 30 percent of the years lost before age 50, and suicides and violence also contribute to deaths in this age group. Noncommunicable diseases become more of a factor after age 30.
In summary, there is a growing mortality gap between the United States and comparable high-income countries. If the United States experienced the same rates of mortality due to unintentional injuries and noncommunicable diseases as do other peer countries, then almost two-thirds of the excess losses in years of life lost before age 50 would be eliminated (Palloni and Yonker, 2012). To add to the analysis in this chapter, which focuses on life expectancy, the next chapter examines how the United States compares with other countries in terms of quality of life, specifically, health status, the prevalence of disease, and the incidence of injuries.


