
The Process of Unauthorized Crossing at the U.S.–Mexico Border
A discussion of the use of surveys and statistical methods to measure unauthorized border flows needs to be set in the context of border enforcement and the migration process, both current and past. We focus on Mexican migrants since Mexican nationals account for the vast majority of attempted unauthorized border crossings at the U.S.–Mexico border. According to the U.S. Border Patrol (USBP), 90 percent of the people apprehended along the southwest U.S. border in fiscal year 2010 were from Mexico (Sapp, 2011).1
This chapter begins by providing an overview of the population of unauthorized migrants and recent estimates of the stock and flows of undocumented immigrants. It then presents a brief history of unauthorized immigration and policy responses to it, including a short summary of studies looking at the effectiveness of border enforcement. Then, the chapter describes the contemporary border crossing process for unauthorized migrants aiming to enter without inspection. Finally, the chapter discusses what is known about the apparent extent of the involvement of organized crime and drug cartels in migrant smuggling.
_________________
1 This number could be overestimated, as nationals from other countries have an incentive to falsely report that they are Mexican in order to be returned to the Mexican border. This would allow them to attempt re-entry more easily than if they were deported to their home country.
CURRENT UNAUTHORIZED POPULATION: STOCK AND FLOW ESTIMATES
Estimates of the number of unauthorized immigrants living in the United States put this population at around 11 million in 2010 (Passel and Cohn, 2011), which is about 30 percent of the foreign-born population and over 5 percent of the U.S. workforce.2 While approximately 6.1 million are from Mexico, representing 55 percent of the total, other countries contributing substantially to the undocumented population include Brazil, China, Ecuador, El Salvador, Guatemala, Honduras, India, Korea, and the Philippines (Hoefer et al., 2012; Passel et al., 2012). The number of unauthorized residents originating from Mexico is more than 10 times larger than the number of unauthorized residents from any other country. Between 1999 and 2009, Mexican men aged 15 to 50 years old accounted for three-fourths of all apprehensions at the U.S.–Mexico border, and Mexican women aged 15 to 50 years old accounted for an additional one-seventh of apprehensions. The remaining apprehensions are distributed among juvenile Mexican nationals, senior Mexican nationals, and migrants from other countries. Reconciling the rates of apprehensions by nationality and gender with the estimates of the stocks of illegal residents in the United States requires analyses that are beyond the scope of this report.
Data on illegal immigrant flows are even harder to come by than estimates of the stock. Still, changes in the stock of illegal immigrants should roughly capture net flows, once attrition and deaths are subtracted and an upward adjustment is made for the household survey undercount.3 For instance, the unauthorized immigrant population increased in net terms by about 500,000 annually during the early 2000s. After allowing for undercount, mortality, and return migration, the inflow of unauthorized immigrants was estimated at around 850,000 per year during the period 2000 to 2005 (Passel and Cohn, 2010).
Unauthorized immigration slowed considerably during the U.S. housing bust and subsequent recession as unemployment rates soared (Passel and Cohn, 2009a). Return migration may also have increased. As a result, the unauthorized immigrant population decreased slightly between 2007 and 2009 and has since stabilized (Hoefer et al., 2012; Passel and Cohn, 2011). Falling immigration and rising returns were most evident in the Mexican case. According to the Mexican Census, 1.4 million Mexicans and their children left the United States between 2005 and 2010, about the same as the number who are estimated to have entered the country (Passel et al.,
_________________
2 Of the 11 million unauthorized immigrants, 8 million are estimated to be in the labor force (Passel and Cohn, 2011).
3 The limitations of U.S. household surveys in measuring the unauthorized population are discussed in Chapter 4.
2012). Net migration from Mexico was therefore zero or perhaps even slightly negative during this period, compared with net illegal migration of 2.3 million from Mexico between 1995 and 2000. Other studies suggest the rising returns occurred at the tail end of the crisis (cf. Giorguli and Gutiérrez, in press; Rendall et al., 2011). As a result of declining inflows and rising returns, the unauthorized Mexican-born population fell to 6.1 million in 2011, down from 7 million at its peak in 2007 (Passel et al., 2012).
Characteristics of the Unauthorized Population
Not all unauthorized immigrants “enter without inspection” at the border. People who overstay or otherwise violate the terms of their visas, such as by working while on a tourist visa, are also considered unauthorized. Among the unauthorized population, between 25 and 40 percent are thought to be visa overstayers, while the rest entered without inspection (Passel, 2005). The efforts of the U.S. Department of Homeland Security (DHS) to identify and report on overstays have been hindered by the absence of a comprehensive biometric entry and exit system for identifying overstayers (U.S. Government Accountability Office, 2011a).
These population estimates represent unauthorized immigrants who are U.S. residents, i.e., people living in the United States on a longer-term basis (more than 1 year). However, much, and probably most, of the undocumented flow across the U.S. border consists of Mexicans who are coming to the United States for short-term employment, including seasonal work in agriculture and construction. This distinction between longer-terms residents (“settlers”) and short-term residents (“sojourners”) is important in considering data from different sources and policies concerning immigration and admission.
Even among the settler population, many return to their home countries. But in recent years, a larger share of the unauthorized population consists of long-term residents who appear to be permanently settled in the United States (Taylor et al., 2011). Estimates suggest that about one in seven unauthorized immigrants arrived within the past 5 years, and most (almost 60 percent) have lived here for more than a decade (Hoefer et al., 2012). This pattern represents a dramatic change from a decade earlier, when about one-third of unauthorized immigrants had been in the United States for less than 5 years and a minority (44 percent) had been in the country for more than a decade (Taylor et al., 2011). Some research suggests that tougher border enforcement has played a role in reducing circular migration and inducing immigrants to permanently settle in the United States (Angelucci, 2012; Massey and Pren, 2012; Reyes, 2004). Although the typical unauthorized resident is a male aged 18-39, there are
substantial numbers of undocumented women and children, and U.S. births to undocumented immigrant women have risen. Nearly half (46 percent) of unauthorized adults living in the United States have a minor child, and about 80 percent of these children are U.S.-born (Taylor et al., 2011).
Unauthorized immigrants are highly geographically clustered in urban areas but have become more dispersed during the past two decades. Almost 40 percent of unauthorized immigrants reside in just two states, California and Texas. However, while California’s undocumented population remained nearly unchanged during the 2000s, Texas’s population grew. States in the Southeast and Mountain West, such as Georgia, North Carolina, and Nevada, experienced large increases in their unauthorized immigrant populations during the late 1990s and the 2000s (Orrenius and Zavodny, 2012). The changing geography of destinations stems primarily from the deflection of flows away from California. According to census data, two-thirds of Mexicans who entered the United States from 1985 to 1990 went to California. By 1995-2000, the share had dropped to one-third, and it has remained at that level during 2000-2005 and 2005-2010 (Durand et al., 2005; Massey and Capoferro, 2008).
Unauthorized immigrant men have very high rates of labor force participation, which suggests that they enter the United States to work. In 2008, 94 percent of working-age undocumented immigrant men were in the labor force, either working or searching for a job (Passel and Cohn, 2009b). This compares with 83 percent labor force participation for similarly aged U.S.-born men. The undocumented population’s relative youth and lack of access to government transfer programs explains some of the exceptional attachment to the labor force. However, undocumented working-age women are actually less likely to be in the labor force than either U.S. natives or legal immigrants, probably because a greater proportion of them have young children (Passel and Cohn, 2009b).
Unauthorized immigrants tend to have low levels of education and hold low-wage jobs. Almost half of adult unauthorized immigrants have not completed high school, and they make up 22 percent of all non-high school graduates in the United States. Undocumented workers are disproportionately employed in construction; food service; building, grounds keeping, and maintenance; and farming (Passel and Cohn, 2009b).
Unauthorized Immigration in the Pre–World War II Years
The United States had an open immigration policy for much of its early history (with the clear exception of immigration from Africa, which was mostly confined to the transatlantic slave trade until it was banned in 1808). As the young nation depended on immigrants to fill jobs, claim the land, and populate the frontier, immigration restrictions did not begin to
come into effect until the late 19th century. Once implemented, they were of two kinds. One set of laws excluded certain types of individuals, such as criminals and prostitutes (1875), people with mental disorders and others deemed likely to become a public charge (1882), and individuals with pre-arranged labor contracts (1885).4 Other laws excluded entire nationalities, such as the Chinese Exclusion Act of 1882, which banned the entry of all Chinese immigrants, and the so-called Gentlemen’s Agreement of 1907, which ended immigration from Japan (Orrenius and Zavodny, 2010).
Mexican migration across the southwest U.S. border occurred relatively late when compared with inflows of immigrants from most of Europe and East Asia, and it was for the most part unrestricted by law or regulation. Despite the fact that the United States in the mid-19th century acquired a considerable amount of territory previously belonging to Mexico, only around 50,000–100,000 Mexican nationals became U.S. citizens as a result of this territorial redistribution (Henderson, 2011).
Immigration from Mexico remained low for almost five decades, picking up only in the early 20th century. Permanent admissions from Mexico never surpassed 10,000 per decade during the 19th century and were generally below 5,000. The lowest number of admissions per decade, 734, was in the 1890s (U.S. Department of Homeland Security, 2011b:Table 2; see also Orrenius and Zavodny, 2010). With flows from China and Japan barred in the late 19th and early 20th centuries (a ban that would last until the 1940s), Mexican workers were recruited to build railroads, cultivate fields, and work in mines across the U.S. Southwest and parts of the Midwest (Cardoso, 1980; Durand and Arias, 2005; Foerster, 1925; Gamio, 1930). Mexican immigrant inflows reached 31,188 by the first decade of the 1900s (U.S. Department of Homeland Security, 2011b:Table 2). This practice continued and expanded into the 1910s, fueled by the difficulty of transatlantic movement during World War I and imposition of literacy requirements in 1917, which explicitly exempted Mexican workers. The violence of the Mexican Revolution also uprooted thousands of people fleeing the areas with most turmoil in Central and Northern Mexico between 1911 and 1917. The number of Mexican immigrants in the 1910s rose considerably to 185,334 for the decade (U.S. Department of Homeland Security, 2011b).
Mexican immigration rose further in the 1920s to almost one-half million (U.S. Department of Homeland Security, 2011b:Table 2), due in part to increasing restrictions on European immigration. The establishment of the first numerical limits on immigration using national origins quotas in 1921 capped annual admissions by country to 3 percent of the population present in the United States in 1910. The Immigration Act of 1924 lowered
_________________
4 Prospective immigrants circumvented this law by denying that they had a pre-arranged contract.
the quotas to 2 percent of the 1890 population by national origin. USBP was established in the same year and spent its early days stopping European and Asian immigrants seeking to circumvent immigration restrictions and liquor smugglers who violated Prohibition, rather than intercepting illegal immigrants from Mexico (Zolberg, 2006).
Once the economy collapsed during the Great Depression, which followed the crash of the stock market in October 1929, legal immigration from all over the world fell considerably (from 4.3 million admissions in the 1920s to slightly less than 700,000 in the 1930s [U.S. Department of Homeland Security, 2011b:Table 2]). While immigration from Mexico also slowed drastically during this period, to 32,709, hundreds of thousands more returned home, some voluntarily and some as a result of being “pushed out” or deported (Hoffman, 1974; Zolberg, 2006). As a result, the number of Mexicans living in the United States dropped from 641,000 in the 1930 census to 377,000 in 1940.
The Bracero Program and Unauthorized Immigration in the Post–World War II Years
Economic growth resumed during World War II, and labor shortages arose as the war effort intensified. In 1942, the U.S. and Mexican governments crafted the Bracero Program, which would bring in about 200,000 Mexican workers annually over the next 22 years, although flows varied greatly over time. The Bracero Program evolved considerably during its 22 years of existence, going from a binational accord managed by the U.S. Department of Labor and the Mexican Ministry of Foreign Affairs to a unilateral effort managed by the U.S. Immigration and Naturalization Service (Calavita, 1992). It began with 4,200 entries in 1942, rising to 62,000 in 1944, falling to around 20,000 in 1946, and then rebounding to 100,000 by 1949. The flows fluctuated around 200,000 per year from 1951 to 1953, but a large expansion occurred in the late 1950s with annual flows between 400,000 and 450,000 per year before declining in the early 1960s and then being terminated entirely in 1965 (Calavita, 1992; Massey et al., 2002).
Unauthorized migration became more commonplace during the era of the Bracero Program because of robust U.S. labor demand and the temptation of employers and immigrants to circumvent the administrative hassles of complying with the program’s rules in the United States (Calavita, 1992) and Mexico (Fitzgerald, 2009:Chapter 2). During this period, there was no law barring the employment of unauthorized workers; on the contrary, the 1952 immigration law included the so-called Texas proviso, which specifically
permitted the employment of illegal immigrants.5 It would continue to be legal to hire undocumented labor until passage of the Immigration Reform and Control Act (IRCA) 34 years later.
The Bracero Program was intended to admit Mexican workers for short-term employment; it did not allow the migrants to settle in the United States. This is evident from the population data on Mexicans in the United States. Notwithstanding the more than 4 million admissions during the 1942-1964 period, the number of Mexican immigrants living in the United States increased by only about 200,000 over 20 years, from 377,000 in the 1940 census to 576,000 in 1960. With the end of the Bracero Program in 1964, the United States implemented a new immigrant preference system favoring family reunification and, to a lesser extent, certain forms of skilled labor. The 1965 law also imposed a Western Hemispheric cap on permanent resident visas that took effect in 1968. As far as Mexico was concerned, the changes virtually eliminated temporary Mexican worker visas and reduced the number of available permanent visas (Massey et al., 2009). The demand for Mexican labor, however, did not change. Within a short period, employers substituted unauthorized immigrant labor for Bracero workers (Massey and Pren, 2012). At the same time, the nature of Mexican labor migration began to change, with an increasing proportion of workers employed year-round and full-time in non-agricultural jobs (Cornelius, 1992; Riosmena, 2004). Perhaps predictably, undocumented migration increased steadily during the 1970s, ushering in the beginning of what some scholars have called the “Undocumented Era” (Massey et al., 2002).
The early historical experience demonstrates the evolution of the immigration system, driven by two aspects that continue to apply in the present-day context, especially with regard to illegal immigration. First, economic conditions and the state of labor demand (which some refer to as “business interests”) play a central role in immigration law and the extent to which it is implemented and enforced. Second, barring extraordinary events such as the Great Depression, tighter regulations with regard to a particular group’s migration or method of entry (e.g., Bracero permits or unskilled worker visas) often result in a compensatory reaction by another group’s migration or method of entry (e.g., unauthorized entries). Although the immigration system is more likely to “self-correct” under conditions of
_________________
5 Texas growers were deliberately left out of the Bracero agreement initially, at the request of Mexican authorities who cited Texas employers’ abuses of Mexican workers during the prior wave of Mexican immigration. In response, these growers recruited and hired undocumented labor and lobbied against restrictions on this practice. They would become part of the program in its later stages when the Mexican government softened its stance and as the United States continued bringing in Braceros without the direct cooperation of the Mexican government (Calavita, 1992).
relatively weak border enforcement (as the southwest U.S. border can be characterized before the mid-1990s), even increased enforcement has not fundamentally changed this dynamic, as we discuss below.
IRCA and Its Consequences
The unauthorized population was estimated at around 2.1 million in 1980 (Warren and Passel, 1987).6 In response to the growth in undocumented immigration, Congress passed IRCA in 1986. This law represented a landmark change in U.S. policy on unauthorized immigration in several ways. First, it sought to stem future unauthorized immigration by making it illegal to knowingly hire undocumented workers, requiring employers to verify workers’ eligibility for employment, increasing funding for border enforcement, and establishing the H-2A and H-2B programs for temporary agricultural and non-agricultural workers (Orrenius and Zavodny, 2012).
IRCA also included provisions to legalize most of the unauthorized population already in the country. A Legally Authorized Workers program granted legal permanent residence to immigrants who could document continuous presence in the country since January 1, 1982.7 A Special Agricultural Workers program granted legal status to circular and seasonal migrant workers as long as they had worked at least 90 days during the past year. Together, these programs regularized 2.7 million undocumented immigrants, three-fourths of whom were from Mexico (Durand et al., 1999:523; Orrenius and Zavodny, 2003:439; Phillips and Massey, 1999:233).
Despite mass legalization and employer sanctions under IRCA, the number of unauthorized immigrants had increased to 3.4 million by 1992 (Warren, 1994, cited in Espenshade, 1995a:201).8 By 2000, this number had grown to 8.4 million (Passel et al., 2004). Although this growth may be partly exaggerated by different types of data flaws, more present in earlier statistics,9 it is clear even after taking these factors into account that the
_________________
6 In the early 1980s, there was considerable uncertainty about the size of the unauthorized immigrant population, and some contemporary estimates were as high as 10 to 12 million (Edmonston et al., 1990).
7 Approved applicants first received temporary legal status. After 18 months and the successful completion of English language and civics classes, applicants then received permanent legal status (green cards).
8 While these two programs decreased the undocumented population considerably, some migrants did not meet the requirements and others arrived after the application deadline. In addition, it took a good part of the 1990s for all IRCA-related regularizations to go through the Immigration and Naturalization Service backlog (Rytina, 2002).
9 Most importantly, a higher undercount of the immigrant population (and the unauthorized in particular) in the 1990 Census relative to the 2000 Census (cf. Robinson et al., 1993, 2002) may have misallocated some of this growth to the 1990s, when in fact it actually may have occurred prior to 1990.
unauthorized population increased considerably throughout the 1990s and continued to do so until the onset of the 2007-2009 housing collapse and financial crisis. Based on a methodology similar to that of Passel and colleagues (2004), Passel and Cohn (2011) estimate that this number increased to 12 million by 2007 before declining to 11 million by 2010 (Hoefer et al., 2012; Passel and Cohn, 2011).
The Rise of Border Enforcement
IRCA’s various provisions, all designed to stem unauthorized immigration, appear to have had little effect on the flow of unauthorized migrants across the U.S.–Mexico border (Orrenius and Zavodny, 2003). USBP apprehensions, sometimes used as a rough gauge of changes in illicit border crossings (keeping in mind that apprehensions are also a function of U.S. enforcement efforts), declined for three consecutive years after IRCA, but then resumed an upward trend. By the early 1990s, USBP apprehensions were back to pre-IRCA levels (see Figure 2-1).
While successful entries increased steadily between the early 1990s and 2008, apprehensions at the border have fluctuated considerably.10 Around 1970, the number of apprehensions exhibited an upward trend, followed by sizable fluctuations in the 1980s and 1990s, and reached a peak in fiscal year 2000 at almost 1.8 million. Since 2000, the number of apprehensions has plummeted, currently standing at around half a million—a level not recorded since 1972 (U.S. Department of Homeland Security, 2011b:Table 33).
The number of apprehensions clearly depends on the number of attempted crossings, and thus researchers have focused on the changes, if any, in the probability of apprehension. Attempts are influenced by socioeconomic conditions in sending areas and potential destinations; by security conditions on the southern side of the U.S.–Mexico border; and by U.S. immigration policy, including legal immigration opportunities and border and interior enforcement. Potential migrants can consider the immigration system as a whole and assess their best migration options. Greater availability of visas may reduce the probability of migrating illegally, assuming all other factors remain the same. In a similar vein, permissive policies at the ports of entry reduce incentives to cross between ports of entry. Among migrants choosing to cross illegally, more enforcement in one area of the border can increase crossings in another.
_________________
10 Given that the more reliable estimates pertain to stocks estimated indirectly, undocumented flows have surely fluctuated more than scholars are able to measure. Even allowing for this, flows seem to have fluctuated less than apprehensions. Compare Figure 2-1 with Massey and Singer (1995) and Passel and Cohn (2011).
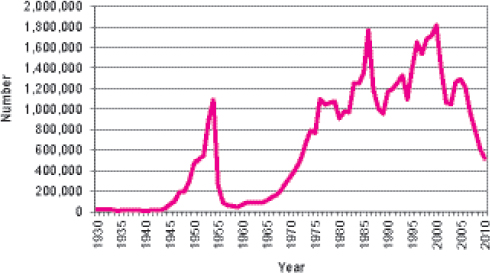
Figure 2-1 Apprehensions of unauthorized immigrants, 1930-2010.
Source: Data from U.S. Department of Homeland Security, 2011b:Table 33.
The probability of apprehension is mostly a function of the level and spatial distribution of border enforcement effort (including not only linewatch personnel and physical infrastructure but also “consequence programs,” described below) and the capacity of migrants and smugglers to anticipate and react to enforcement efforts. In the immigration system, more border enforcement encourages greater use of smugglers and innovative techniques, such as decoys; border fences may lead to digging tunnels; and so on.
Immigration policy in general, and border enforcement policies and practices more specifically, should affect the number of apprehensions through the effectiveness of border enforcement (i.e., the probability of catching people attempting to cross illegally [Espenshade, 1995b; Massey and Singer, 1995]) and by deterring people from attempting to cross (Angelucci, 2012; Cornelius and Salehyan, 2007; Hanson and Spilimbergo, 1999; Massey and Riosmena, 2010; Orrenius and Zavodny, 2005). We discuss these two factors in a separate section, “Effectiveness of Border Enforcement.”
Continuing undocumented inflows in the early 1990s prompted USBP to change strategies and adopt a “prevention through deterrence” strategy, which “called for reducing unauthorized migration by placing agents and resources directly on the border along population centers in order to deter would-be migrants from entering the country” (Nuñez-Neto and Viña, 2006:1; U.S. General Accounting Office, 1999). In 1993, the El Paso sector
launched Operation Hold the Line, which deterred crossings in the urban corridor by constructing barriers/fences and stationing agents close together.
The new strategy led to a drastic decline in apprehensions in the El Paso sector, and similar operations were subsequently launched in San Diego in 1994 (Operation Gatekeeper), Nogales, Arizona, in 1997 (Operation Safeguard), and South Texas in 1997 (Operation Rio Grande). Operation Gatekeeper was by far the most important of these initiatives, given that the great majority of unauthorized migrants at that time were crossing into California through Tijuana-San Diego.
The site-specific crackdowns resulted in two responses by border crossers, neither of which suggests that overall illegal immigration was deterred. First, operations such as Gatekeeper deflected attempted crossings away from areas with increased USBP activity toward less-patrolled territory. Migrants initially attempted to cross in these areas within the same sector (Nuñez-Neto and Viña, 2006:8-12). Eventually, migrants moved to other sectors, such as Arizona and, to a lesser extent, South Texas (Massey et al., 2002; Spener, 2009:46). Second, within highly trafficked corridors, migrants began crossing through remote country, away from built-up, settled areas. More perilous crossings led to a higher number of deaths among unauthorized border crossers (Cornelius, 2001; Eschbach et al., 1999; U.S. Government Accountability Office, 2006).
Between 1990 and 2000, the USBP budget increased 205 percent in real terms and the number of USBP agents assigned to southwest border sectors rose 165 percent, from 3,226 in 1990 to 8,525 in 2000.11 Border enforcement rose further in the 2000s; the budget increased an additional 157 percent in real terms between 2000 and 201112 and the number of agents on the southwest U.S. border more than doubled to 18,506 in 2011.13 Since 1990, USBP has also implemented the use of more advanced technology, including double fences and watch towers, ground sensors, remote video surveillance, and aerial and marine surveillance. According to USBP, as of February 2012, 651 miles of the 1,969 miles along the U.S.–Mexico border are fenced, 352 miles with a primary pedestrian fence and 299 miles with a vehicle fence.14 There is also a secondary fence built along specific parts of urban corridors.
_________________
11 Agents data through 2000 are from http://trac.syr.edu/immigration/reports/143/ include/rep143table2.html (May 14, 2012) and are for September of each year.
12 Border Patrol budget data by fiscal year from http://www.cbp.gov/linkhandler/cgov/border_security/border_patrol /usbp_statistics/budget_stats.ctt/budget_stats.pdf (May 14, 2012), converted to real dollars using CPI-U.
13 See http://www.cbp.gov/linkhandler/cgov/border_security/ border_patrol/usbp_statistics/ staffing_92_10.ctt/staffing_92_11.pdf (May 14, 2012).
14 See http://www.cbp.gov/xp/cgov/border_security/ti/ti_news/sbi_fence/ (April 10, 2012).
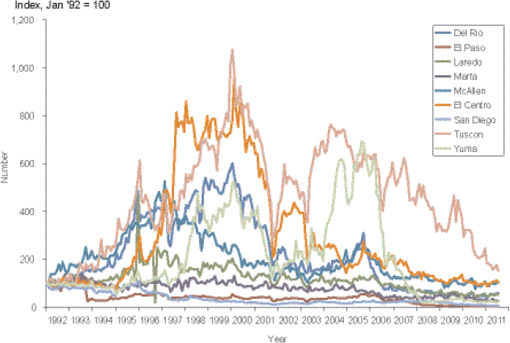
The spillovers in the immigration-enforcement system are readily apparent by comparing apprehensions in sectors with and without increased enforcement operations. Figure 2-2 is an indexed chart of apprehensions by sector for the period 1992 to 2011. Around the time of Operations Hold the Line and Gatekeeper, the decline in activity in the El Paso and San Diego sectors is notable. It is followed by a rise in apprehensions in El Centro, the Arizona sectors (Tucson and Yuma) and Del Rio, Texas. The share of apprehensions in San Diego and El Paso fell from 71 percent in 1992 to 16 percent in 2000.
Consequence Policies
Notwithstanding this unprecedented border buildup, illegal immigration continued, reaching new highs during the U.S. economic boom and Mexican peso crisis of the mid- to late 1990s. Although apprehensions also increased, the undocumented flow continued, and the unauthorized population expanded rapidly (Orrenius, 2001). Migrants may not have been deterred by this increased enforcement in part due to the USBP’s “catch and release” policy, whereby most apprehended migrants who were from Mexico signed voluntary departure contracts and boarded a bus back to the border, after which they would simply try to cross again within a day or two (Kossoudji, 1992). USBP also had difficulty identifying repeat offenders and smugglers because, when apprehended, migrants would provide different names (Koslowski, 2002).
Whereas the first phase of enforcement, still underway, focused on apprehending unauthorized crossers, the next phase attempted to address how to best prevent re-entry attempts. Efforts to deter repeat attempts centered on better recordkeeping (for example, universal finger printing since the late 1990s and crosschecking with the Federal Bureau of Investigation [FBI] IAFIS database since 2004) and harsher punishments for repeat crossers. Harsher and speedier punishment for illegal entry came to be referred to as “consequence policies” (Fisher, 2011). The Illegal Immigration Reform and Immigrant Responsibility Act of 1996 (IIRIRA) laid the groundwork for consequence policies by instituting expedited removal, interior repatriation, and 3- and 10-year admission bars for previously unauthorized immigrants seeking to be admitted legally to the United States.15 Expedited removal is the process by which a non-U.S. citizen present in the country for less than 14 days and located within 100 miles of the border can be physically
_________________
15 The law also set harsher punishment for smugglers. In addition, IIRIRA increased funding for border and interior enforcement and launched Basic Pilot (an employment verification program that was the precursor to E-Verify) (Orrenius and Zavodny, 2012).
removed from the United States with limited legal recourse.16 Customs and Border Protection (CBP) officers, including USBP, issue expedited removal orders in a short proceeding, which also carries a 5-year re-entry bar. Expedited removal of non-Mexicans requires detention space, and expansion of expedited removal in 2005 to include all USBP sectors could only come about once authorities secured sufficient jail beds to house the undocumented aliens (National Research Council, 2011).
Over the past decade, USBP implemented the consequence policies laid out in IIRIRA in addition to its own initiatives. In 2003, USBP in Arizona launched a program of lateral repatriation: the practice of returning apprehended migrants to points along the border that are distant from the USBP station where the apprehension took place. The stated purpose of lateral repatriation was to prevent deaths in the Arizona desert, but it also results in the separation of migrants from their smugglers, complicating re-entry attempts.
USBP also launched Operation Streamline in the Del Rio sector in Texas in 2005, and by 2009 six of the nine southwestern USBP sectors had implemented versions of it (Lydgate, 2010). Under Operation Streamline, USBP and the U.S. Department of Justice cooperate to subject as many migrants as possible to federal criminal prosecution (see National Research Council [2011:Chapter 4] for further details). Although most such offenses are misdemeanors and result in very short jail terms, the punishment marks a dramatic shift away from the catch and release tactics of the 1980s and 1990s, in which migrants were quickly returned to Mexico.17
MOTIVATIONS FOR MIGRATION
Much of the research on the decision to illegally migrate to the United States considers the Mexican case (see Massey et al., 1998:Chapter 3). As noted above, Mexico–U.S. migration has a long history of responding largely to changes in labor demand in the United States. The combination of job opportunities and higher U.S. wages has always been a powerful incentive for Mexican migration. When jobs—particularly in the construction sector—dried up in the recession that began in 2008, unauthorized immigration plummeted (Papademetriou and Terrazas, 2009). In contrast, legal permanent immigration was largely unresponsive to the economic
_________________
16 IIRIRA originally mandated expedited removal for arriving aliens at ports of entry but gave the U.S. Department of Justice the option of applying it more broadly, which it later did (Siskin et al., 2006:11).
17 However, returning non-Mexican migrants to their home countries has always been a lengthy process, during which the migrants have typically been detained.
downturn, given its emphasis on family reunification and the large backlog in applications (Papademetriou and Terrazas, 2009).
Economic opportunity in sending areas, or the lack thereof, also motivates migration (Stark and Bloom, 1985). Families create safeguards against different kinds of shocks (e.g., employment loss or inflation caused by economic crises, crop failure caused by droughts) by diversifying their sources of income through the allocation of family labor abroad. Migration serves as a mechanism for risk management if market conditions in destinations are negatively or weakly correlated with those in the sending community; if local economic conditions deteriorate, the household can then rely on migrant remittances for support. This is particularly important when origin communities lack established financial institutions, such as banks and insurance companies, or when families do not have access to loans or insurance even if the appropriate institutions exist.
The absence of formal credit markets leads to another motivation for migration: target savings. Low wages and limited lending make it very difficult for families to accumulate capital. Many migrants are therefore target earners, engaging in temporary migration for the express purpose of accumulating a set amount of money. Research has found evidence consistent with these motivations in the Mexican case (Hamilton and Villarreal, 2011; Lindstrom, 1996; Lindstrom and Lauster, 2001; Massey and Espinosa, 1997; Massey and Parrado, 1998). Such target earners would probably not settle in the United States but rather are likely to return to Mexico once they have met their savings target.
Typically it is not a lack of development or absolute poverty per se that motivates migration. Mexican migrants are not a random sample of the Mexican population; they self-select and tend to be young, male, and from the middle of the education distribution (Chiquiar and Hanson, 2005; Feliciano, 2005; Ibarraran and Lubotsky, 2007; Moraga, 2010). An important factor preventing the poorest, least-educated Mexicans from international migration is the cost of illegal border crossing. The highly educated Mexicans, meanwhile, typically do not have the need to migrate or the willingness to cross the border illegally, given the risks. Economic and institutional changes, such as urbanization, technological change, the entry of women into the labor force, or the disruption of local livelihoods associated with the development process, can displace workers and also provide reasons to migrate (Sassen, 1988).
Because the development process is uneven and social mobility is low in many sending areas, migration may also be motivated by relative deprivation—i.e., migration for the purpose of improving one’s social rank in the sending community (Jones, 1998). Relative deprivation can be caused by the migration and capital accumulation of other community members.
This is one mechanism by which the momentum created by initial migration may lead to additional movement of people (Massey, 1990).
New areas of emigration in Mexico have emerged as a result of these economic transformations (Riosmena and Massey, 2012). Mexican out-migration has traditionally been concentrated in localities in the central-western states of Guanajuato, Jalisco, Michoacán, San Luis Potosí, and Zacatecas. Since the first massive wave of Mexican immigration in the early 20th century, these states have accounted for a majority of U.S. migrants (Durand et al., 2001). However, areas of origin have become increasingly dispersed over time. Over the past three decades, new sending regions have slowly emerged (Durand and Massey, 2003), particularly in areas south and east of Mexico City, reducing the importance of the central-western region of Mexico to less than half of the flow for the first time since the initiation of Mexican migration (Durand and Massey, 2003).
Migrant networks and, more generally, connections between sending and destination areas created by the migration process are another strong facilitator of migration. While economically motivated at its core, Mexico–U.S. migration became much more complex once Mexican communities were established in the United States. Models of network migration have been able to better explain migration trends and settlement patterns than just wage and income gaps between the places of origin and destination (Massey and Espinosa, 1997; Massey and Riosmena, 2010; Massey and Zenteno, 1999). Given that the demand for immigrant labor continued after the end of the Bracero Program, and given that major changes in immigration law in the late 1960s eliminated provisions for legal temporary and permanent labor migration,18 social networks have played an even larger role in facilitating undocumented migration from Mexico (Massey and Riosmena, 2010).
Secular social and economic changes in both the United States and in sending areas, in addition to changes in immigration policy that affect the supply of certain types of visas, have had an effect on individuals’ decisions to engage in undocumented migration. These changes need to be taken into consideration when quantifying or forecasting illegal immigration and evaluating the effectiveness of border enforcement. The immigration system is dynamic. Sending areas change, and migrant motivations evolve. For example, the drastic decline in Mexican fertility over the past 40 years
_________________
18 Because most Braceros circulated back and forth between Mexico and the United States and only a minority stayed and became permanent residents, family reunification was not a choice for most Mexican migrants prior to the passing of IRCA. Settlement occurred more steadily during the Undocumented Era, both due to secular changes in the character of Mexican migration to the United States (Cornelius, 1992; Riosmena, 2004) and because of the unintended consequences of immigration policy (Angelucci, 2012; Reyes, 2004).
is taken as evidence that a resurgence of mass unauthorized migration is unlikely (Passel and Cohn, 2012).
EFFECTIVENESS OF BORDER ENFORCEMENT
The steady growth of the unauthorized population in the United States during the past several decades might suggest at first glance that border enforcement has been ineffective. Conversely, the fact that the number of apprehensions and stock of undocumented migrants has decreased in more recent years might suggest that the stepped-up enforcement efforts at the border have been effective. As discussed briefly in the previous section, the incentives to engage in unauthorized migration have been changing due to economic and social changes in destination and sending areas and due to the expansion of migrant networks. An appropriate evaluation of immigration enforcement must consider a counterfactual scenario in which other migration factors are held constant as border enforcement is increased. This would indicate whether and to what extent border enforcement is a deterrent.19
Studies of migration tend to find evidence of small but significant deterrent effects of border enforcement. Gathmann (2008) found that the border buildup between 1986 and 2004 raised smugglers’ fees by 17 percent and increased the time costs of crossing by 2 to 5 additional days. Orrenius (1999) found that a 20 percent increase in the smuggling fee caused a 13 to 21 percent decline in the probability of migrating. Spener (2009) notes that enforcement operations drive smuggling prices up both by requiring migrants to buy a more complex portfolio of smuggling services than in the past and by pushing traffic to remote areas, making it harder to cross the border undetected. A number of studies have found that more border enforcement negatively affects the probability of undocumented migration after accounting for the role of other forces influencing this decision, although the size of deterrence effects in most of these studies is generally modest (Amuedo-Dorantes and Bansak, 2011; Angelucci, 2012; Cornelius and Salehyan, 2007; Hanson and Spilimbergo, 1999; Massey and Riosmena, 2010; Orrenius and Zavodny, 2005). Angelucci (2012) finds that the elasticity of illegal inflows to border enforcement is between –0.4 and –0.8 and that sensitivity to enforcement has increased over time. Amuedo-Dorantes and Bansak (2011) find that an increase of one-half million linewatch hours—the average yearly increase along the U.S.–Mexico border between 1990 and 2003—reduced intentions to re-migrate among a sample of male return migrants by about 14 percent. The deterrence effects can also be short-lived: Dávila and colleagues (2002) found that, although
_________________
19 In other words, although undocumented migration increased, it could have been even higher in the absence of increased enforcement.
increased linewatch hours reduced apprehensions initially, the effect dissipated as migrants adapted their behavior.20
By using estimates or reports of unauthorized migration among people who reportedly managed to cross into the United States, these studies have looked at the net effect of enforcement on successful crossings, not on attempted ones. These studies thus assessed the combined effectiveness of border enforcement in deterring attempts and in catching migrants attempting to cross without inspection. Assuming, however, that these studies are mostly indicating the role of border enforcement on deterring an initial attempt to cross the border, the probability of apprehension would still need to be analyzed separately.
The probability of apprehension in the 1980s and early 1990s ranged between 30 percent and 40 percent (Massey and Singer, 1995). The Mexican Migration Project (MMP), which is described in Chapter 3, also publishes updated estimates of apprehension probabilities.21 While the probabilities estimated by the MMP are somewhat lower than those presented by Massey and Singer—around 20-25 percent for the 1980s, dipping to 15-20 percent in the early 1990s—the MMP estimates indicate a sizable subsequent rise in the probability of apprehension to levels between 30 and 40 percent during the 2000s. It is difficult to determine if the increase is related to the changing composition of communities in the MMP data or to real changes at the border. If one assumes that the trend is a result of the latter,22 then the probability of apprehension during the last decade was around one in three, a relatively low number.
It is also worth noting that increased enforcement during the past decade in the U.S. interior has worsened the labor market and living conditions of undocumented immigrants in the United States (Orrenius and Zavodny, 2009) and may have a deterrent effect on attempted crossings (Wein et al., 2009). However, scholarship on the subject has mostly been devoted to understanding how interior enforcement affects immigration to particular localities. For instance, Parrado (2012) finds that the 287(g) program23 has only been effective in deterring immigration at a few large
_________________
20 Enforcement can still affect the selection of people who cross, regardless of whether it affects the total number of people who cross successfully (Lozano and Lopez, 2010; Orrenius and Zavodny, 2005).
21 See http://mmp.opr.princeton.edu/results/008apprehension-en.aspx (April 13, 2012).
22 The step decline in the probability of apprehension between 2010 and 2011 is most likely due to a drop in the number of MMP communities available for these analyses.
23 The Section 287(g) program was established in 1996 but implemented primarily after 2005. Under this program, state and local law enforcement agents receive DHS training and supervision to check the immigration status of arrestees in jails and prisons and to apprehend suspected unauthorized immigrants through traffic stops or other community interventions (National Research Council, 2011:42-43).
immigrant gateways: it has not been effective in stemming immigration into most cities where the program has been implemented.
THE PROCESS OF ATTEMPTING TO CROSS THE BORDER WITHOUT INSPECTION
Even before the buildup of border enforcement, migrants would travel to the border region and attempt to cross, generally in groups and typically assisted by a guide or smuggler, known as a coyote or pollero. Smugglers typically require partial payment up front; full payment is due once the migrant is delivered to awaiting friends or relatives in the United States. Fees for smuggling services often allow for multiple attempts to cross the border, in the event that a migrant is apprehended by USBP one or more times. The share of migrants using smugglers has increased from about 80 percent in 1990 to roughly 90 percent today.24 Smuggler prices have risen in inflation-adjusted terms from about $600-$1,000 in 1990 to $2,500 in 2010 (Roberts et al., 2010). Prices also vary by region and mode: anecdotal accounts indicate that crossing into the United States by boat in the San Diego sector is about two to three times as expensive as crossing by land, which suggests that the probability of apprehension during unauthorized maritime crossings is low.
Figure 2-3 shows a stylized version of the undocumented border crossing process, along with the sources of survey and administrative data (which are described and evaluated in Chapters 3, 4, and 5) that can potentially and partially measure these flows. The process starts in the home community, where people decide to travel to the border region and attempt an unauthorized crossing. In some cases, individuals may use border-crossing cards or visas to cross and then work in the United States (Chávez, 2011), although this is less common for Mexicans (particularly those who do not reside in the border region)25 than for people of other nationalities (Massey and Riosmena, 2010:304-305).
As noted above, a majority of migrants use the services of smugglers, especially those attempting to cross for the first time (López Castro, 1997; Orrenius, 1999; Roberts et al., 2010:4; Spener, 2009:81). Once a smuggler is hired, migrants attempt to cross through nonfenced, more remote areas
_________________
24 Data on smuggling usage and price are from the Mexican Migration Project website at http://mmp.opr.princeton.edu/results/results-en.aspx (March 19, 2012).
25 Using the same regional classification of Mexican states provided in Riosmena and Massey (2012), the panel’s own calculations using 2006 and 2009 ENADID data, described in Chapter 3, suggest that migrants coming from the Mexican border region have considerably lower shares of the undocumented (35 percent and 29 percent) compared to migrants from the central-western (68 percent and 67 percent), central (86 percent and 79 percent), and southeast (85 percent and 79 percent) regions.
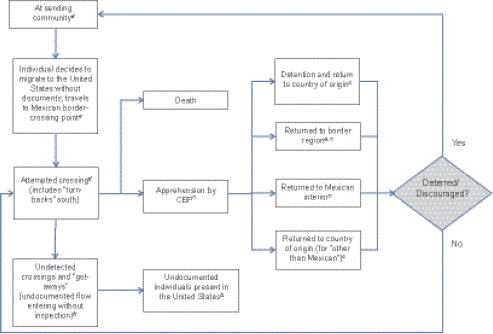
Figure 2-3 The undocumented border crossing process: Survey and administrative data sources.
NOTES: Data sets potentially (partially) measuring each component:
aEMIF-N, (MMP/MMFRP).
bACS/CPS (indirectly), ENADID, ENOE, Mexican Census, MxFLS.
cCBP’s ENFORCE database.
dMMP/MMFRP.
|
ACS: |
American Community Survey |
|
CPS: |
Current Population Survey |
|
EMIF-N: |
Survey of Migration at the Northern Border of Mexico |
|
ENADID: |
National Survey of Population Dynamics |
|
ENOE: |
National Survey of Occupation and Employment |
|
MMFRP: |
Mexican Migration Field Research Program |
|
MMP: |
Mexican Migration Project |
|
MxFLS: |
Mexican Family Life Survey |
or by climbing over the double fence in more transited areas (López Castro, 1997). If migrants are spotted while still close to the line, they generally choose to return to the Mexican side in order to attempt another crossing. This is what USBP calls a “turn-back south.” USBP reportedly keeps records of the number of turn-backs south detected during a shift, but these have not been publicly released, nor does the panel know of any other data source that reports numbers of turn-backs south. In any case, such attempts are not individually identifiable and linkable to prior or subsequent attempts and apprehensions.
An undocumented crossing can result in three different outcomes (other than a turn-back south). First, some undocumented crossers succeed in eluding USBP after being detected; these are termed “got-aways” and become part of the unauthorized population, along with individuals who manage to cross undetected by USBP. If DHS could estimate the number of attempted crossings, they would then be able to indirectly estimate the number of migrants who cross undetected as the difference between the total number of attempts and the sum of turn-backs south, getaways, and apprehensions. The ratio of apprehensions to the total number of attempts is a proxy for the effectiveness of USBP in actually catching the migrants they encounter in the field, a measure DHS officials call the “interdiction rate.”26
Death is another possible outcome of an illicit border crossing, typically brought about by exposure to extreme hot or cold temperatures and dehydration. Deaths at the border have increased (Cornelius, 2001; Eschbach et al., 1999) as more migrants have been crossing through desolate parts of the Arizona desert and remote parts of Texas, typically walking for several days in order to circumvent USBP checkpoints on the highways.
Finally, a crossing attempt can be stopped by USBP (or other federal law enforcement body), at which point the migrant is fingerprinted and photographed and his identity is run through an FBI database to check for prior criminal convictions. After the apprehending agent reviews the individual’s migration history and checks for any prior apprehensions, the officer applies a “consequence” and the migrant is eventually returned to his homeland. Possible outcomes under consequence policies include voluntary return, a formal removal order, or criminal charges. The choice of the consequence depends on the migration and criminal history of the migrant, as well as on applicable USBP policies in effect in the vicinity of the apprehension.27 Depending on the consequence applied to the migrants, they
_________________
26 We did not have access to these measures or to data that would allow us to calculate these rates, and we know no published source that shows estimates of them.
27 This description is based on the discussion of enforcement pipelines in National Research Council (2011:Chapter 4).
can be returned to the closest border point, a distant border point (through lateral repatriation), or the Mexican interior. After release, they may be deterred from crossing again or may attempt re-entry, in which case they may succeed (i.e., get away), be apprehended, or die. Since around 2000, USBP has kept better records of individuals processed at its stations, identifying them through biometric measures such as fingerprints. These records are stored in the ENFORCE database, which we describe in Chapter 5.
The Role of Drug Cartels
Human and drug smuggling have typically been separate businesses along the U.S.–Mexico border. With severe penalties for drug smuggling and relatively light penalties for entering without inspection, migrants and their coyotes have had strong incentives to avoid carrying drugs for traffickers (Spener, 2010). Existing evidence also suggests that most human smugglers on the U.S.–Mexico border are not affiliated with organized crime (Fuentes and García, 2009; Izcara Palacios, 2012; Spener, 2004; United Nations Office on Drugs and Crime, 2010). Mexicans tend to rely on smugglers who they know personally or who they know of through their social networks. It is relatively easy for anyone with some border crossing knowledge and experience to guide another person across the border and charge money for this service. The border area is also geographically large and varied, and it would be difficult for criminal syndicates to guard the myriad crossing places in order to enforce control over all independent operators.28
While organized crime may not be dominating human smuggling on the U.S.–Mexico border, it appears to be playing an increasingly important role over time. According to federal authorities, the role of organized crime in human smuggling has increased (National Gang Intelligence Center, 2011). As Mexican drug cartels become more powerful, display an increasing capacity for violence, and are subject to heightened pressures from U.S. and Mexican enforcement, migrant smugglers may find it increasingly necessary to negotiate agreements with local “plaza bosses” who control specific segments of the border. The growing role of organized crime could also have something to do with the rising numbers of non-Mexican border crossers (United Nations Office on Drugs and Crime, 2010). Non-Mexicans have limited access to migrant networks and so may be more likely than Mexicans
_________________
28 During their visit to the southwest U.S. border, panel members were given the impression by USBP that drug cartels currently play a prominent role, if not a dominant role, in regulating the flow of unauthorized migrants across the border. This is at odds with what is in the research literature. In this regard, the literature may be somewhat dated—although USBP’s perceptions of the importance of cartels may also be exaggerated.
to contract with a criminal syndicate that offers smuggling services. Non-Mexicans may require assistance traveling illegally through the interior of Mexico, another service more likely to be provided by transnational cartels than by local small-scale smugglers in Mexican sending villages or at the U.S.–Mexico border.
CONCLUSION
The decision to engage in unauthorized migration is highly complex, as more formal models by Chang and colleagues (2012), Guzman and colleagues (2008), MITRE Corporation (2008), and Wein and colleagues (2009) portray. It is influenced by economic, social, and environmental conditions in sending and destination areas; immigration policies; and interior and border enforcement. Furthermore, the border itself can be seen as a “system” of its own, in which enforcement efforts and policy changes can have spillover effects and generate adaptive responses by unauthorized migrants and others. As can be seen in Figure 2-3, none of the existing survey and administrative data sources captures the entire migration process.
All of these factors have evolved over the past 50 years, as have the numbers and profiles of migrants. Crossing routes, modes, and the roles of smugglers (who are separate from, but may be increasingly connected to, organized crime and drug cartels) have also changed considerably in recent times. Survey designs and modeling approaches that may be well suited for capturing certain aspects of unauthorized migration flows today may not be able to do so with the same reliability and validity in the future. The methods and assumptions used to estimate flows should be accordingly flexible.
• Conclusion 2.1: To understand migration flows in any one sector, it is important to view the entire border as a system; localized increases in border enforcement may simply change where migrants cross without reducing the overall flow in the long run.
• Conclusion 2.2: The migration process is complex and dynamic. Undocumented migration is the outcome of many interrelated factors that can vary widely across people, space, and time; migrant characteristics and the geography of sending and destination areas are changing constantly. This complexity and dynamism should be incorporated into the analytical approaches and study designs used to estimate flows of unauthorized migrants.


