
STRAIN-RESOLVED COMMUNITY GENOMIC ANALYSIS OF GUT MICROBIAL COLONIZATION IN A PREMATURE INFANT1
Michael J. Morowitz,2,3Vincent J. Denef,4Elizabeth K. Costello,5,6,7Brian C. Thomas,4Valeriy Poroyko,2David A. Relman,5,6,7and Jillian F. Banfield4,8,9
___________
1 Reprinted with permission from Proceedings of the National Academy of Sciences, Morowitz et al. (2010). Strain-resolved community genomic analysis of gut microbial colonization in a premature infant. doi: 10.1073/pnas.1010992108. A correction has been published http://www.pnas.org/content/108/11/4512.3.short.
2 Department of Surgery, University of Chicago Pritzker School of Medicine, Chicago, IL 60637.
3 Present address: Department of Surgery, University of Pittsburgh Medical Center, Pittsburgh, PA 15213.
4 Department of Earth and Planetary Science, University of California, Berkeley, CA 94720.
5 Department of Microbiology and Immunology, Stanford University School of Medicine, Stanford, CA 94305.
6 Department of Medicine, Stanford University School of Medicine, Stanford, CA 94305.
7 Veteran’s Affairs Palo Alto Heath Care System, Palo Alto, CA 94304.
8 Department of Environmental Science, Policy, and Management, University of California, Berkeley, CA 94720.
9 To whom correspondence should be addressed. E-mail: jbanfield@berkeley.edu.
Author contributions: M.J.M., V.J.D., and J.F.B. designed research; M.J.M., V.J.D., E.K.C., B.C.T., V.P., and J.F.B. performed research; V.J.D., B.C.T., and J.F.B. contributed new reagents/analytic tools; M.J.M., V.J.D., E.K.C., D.A.R., and J.F.B. analyzed data; and M.J.M., V.J.D., E.K.C., D.A.R., and J.F.B. wrote the paper.
The authors declare no conflict of interest.
This Direct Submission article had a prearranged editor. Edited by Jeffrey I. Gordon, Washington University School of Medicine, St. Louis, MO, and approved November 30, 2010 (received for review August 7, 2010).
Freely available online through the PNAS open access option. Data deposition: The sequences reported in this paper have been deposited in the Sequence Read Archive (accession no. SRA026959) and GenBank database.
This article contains supporting information online at www.pnas.org/lookup/suppl/doi:10.1073/pnas.1010992108/-/DCSupplemental.
The intestinal microbiome is a critical determinant of human health. Alterations in its composition have been correlated with chronic disorders, such as obesity and inflammatory bowel disease in adults, and may be associated with neonatal necrotizing enterocolitis in premature infants. Increasing evidence suggests that strain-level genomic variation may underpin distinct ecological trajectories within mixed populations, yet there have been few strain-resolved analyses of genotype–phenotype connections in the context of the human ecosystem. Here, we document strainlevel genomic divergence during the first 3 wk of life within the fecal microbiota of an infant born at 28-wk gestation. We observed three compositional phases during colonization, and reconstructed and intensively curated population genomic datasets from the third phase. The relative abundance of two Citrobacter strains sharing ~99% nucleotide identity changed significantly over time within a community dominated by a nearly clonal Serratia population and harboring a lower abundance Enterococcus population and multiple plasmids and bacteriophage. Modeling of Citrobacter strain abundance suggests differences in growth rates and host colonization patterns. We identified genotypic variation potentially responsible for divergent strain ecologies, including hotspots of sequence variation in regulatory genes and intergenic regions, and in genes involved in transport, flagellar biosynthesis, substrate metabolism, and host colonization, as well as differences in the complements of these genes. Our results demonstrate that a community genomic approach can elucidate gut microbial colonization at the resolution required to discern medically relevant strain and species population dynamics, and hence improve our ability to diagnose and treat microbial community-mediated disorders.
Intestinal microbes influence human health through harvesting of energy from dietary substrates, production of essential nutrients, and protection against colonization by pathogens (Dethlefsen et al., 2007; Hooper et al., 2002). Although the adult gut microbiota is highly variable between individuals, it displays limited diversity at the phylum level: only two bacterial phyla (Bacteroidetes and Firmicutes) contribute∼90% of all microbes (Eckburg et al., 2005). In infants, early assembly of the gut microbiota has been linked to development of innate immune responses and terminal differentiation of intestinal structures (Hooper et al., 2001). The dynamic process of colonization has been well studied at high taxonomic levels (Palmer et al., 2007) and seems predictable based on competitive interactions between and within the dominant phyla (Trosvik et al., 2010). Yet at lower taxonomic levels, and at early stages of development, our knowledge of this process is incomplete.
Strain-level analyses of clinical isolates using multilocus sequence typing (MLST) and comparative genomics have been used to differentiate closely related organisms (Hanage et al., 2009; Palmer et al., 2010). However, important contextual information may be lost when interpreting genomic variation between
strains isolated from different communities. Microbial population dynamics can be strongly influenced by synergism and competition with coexisting microorganisms and through phage predation (Sandaa et al., 2009). The mobile element pool, which is generally excluded when analyzing isolates, can rapidly give rise to the genomic variation that underpins strain differentiation (Oliver et al., 2009).
Cultivation-independent genomic analyses of time-series samples provide a way to link shifts in population abundance to genetic characteristics that underlie physiological traits, such as virulence. Here, we analyzed human intestinal colonization during the neonatal period. We conducted a 16S rRNA gene-based survey of fecal samples collected daily during the first 3 wk of life of a premature infant and reconstructed and manually curated population genomic datasets for the dominant gut microorganisms in the third of three colonization phases. We chose to focus on the premature infant microbiome because, in addition to its medical relevance, the limited number of dominant bacterial species in the community allows for deep sequence coverage of multiple subpopulations.
Results and Discussion
Study Subject
We studied fecal samples from a female infant delivered by caesarean section at 28-wk gestation due to premature rupture of membranes. She was treated empirically with broad-spectrum antibiotics (ampicillin/gentamicin) for the first 7 d of life but did not receive antibiotics during the remainder of the study period. She received enteral feedings with maternal breast milk between the fourth and ninth days of life. Feedings were withheld between days 9 and 13 because of abdominal distension. On day 13, feedings were slowly resumed with artificial infant formula (Similac Special Care 20 cal/fl oz; Abbott Nutrition). She also received parenteral nutrition until caloric intake from enteral nutrition was adequate (day 28). She had no major illnesses during her hospitalization and was discharged to home at 64 d of life. Fecal samples were collected daily as available between days 5 and 21.
Day-to-Day Dynamics of Community Composition
Sequencing of amplified bacterial 16S rRNA genes (SI Materials and Methods and Table S1 A and B) from 15 fecal samples collected on different days during the first 3 wk revealed three distinct community configurations demarcated by rapid transitions. This finding is consistent with previously reported colonization patterns in term infants: relative stability over days to months punctuated by rapid compositional change (Koenig et al., 2010; Palmer et al., 2007). Marked shifts in abundant lineages around days 9 and 15 seemed to follow dietary adjustments. On days 5 through 9, communities were largely composed of Leuconostoc,
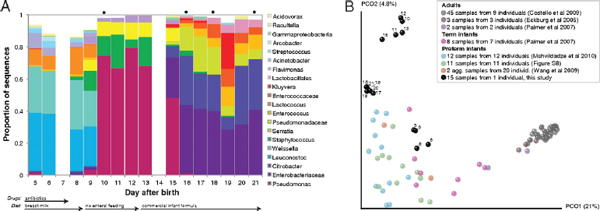
FIGURE A1-1 Multiple stable compositional states in the developing gut microbiota of the premature infant. (A) Relative abundance of the 20 most dominant bacterial taxa in 15 fecal samples collected between days 5 and 21. Sequences were classified to the highest taxonomic level to which they could be confidently assigned. Dots indicate metagenomic survey dates. Relevant clinical features are shown along thex axis. (B) Principal coordinates analysis of unweighted UniFrac distances between fecal microbiotas shown in A and those from recently published surveys of adults (Costello et al., 2009; Eckburg et al., 2005; Palmer et al., 2007), term infants (Palmer et al., 2007), and preterm infants (Mshvildadze et al., 2010; Wang et al., 2009), and from a survey of gut microbes from premature infants in a companion study (Fig. S8). Each circle corresponds to a collection of 16S rRNA gene sequences colored according to study. Samples from this work (black circles) are labeled by day. The percentage of variation explained by the plotted principal coordinates is indicated on the axes. Large-scale alterations in the infant’s gut microbiota composition occurred around days 9 and 15.
Weissella, and Lactococcus (Fig. A1-1A). The genera Pseudomonas and Staphylococcus, which were relatively scarce on days 8 and 9, became abundant by day 10. On days 10 through 13, species richness and evenness were relatively low (Table S1) and Pseudomonadaceae predominated (Fig. A1-1A). After resuming feedings on day 13, taxa characteristic of the next phase appeared (Fig. A1-1A). On days 16 through 21, species richness and evenness recovered (Table S1) and the family Enterobacteriaceae and its constituent genera Citrobacter and Serratia came into the majority. Sample clustering based on community-wide similarity in membership and structure (Fig. A1-1B and Fig. S1 C–F) further delineated three microbiome configurations. Bacterial community membership and structure were significantly more similar within, than between these colonization phases (P < 0.001; PERMANOVA with Monte Carlo). A crossstudy comparison suggests that the infant studied here harbored similar bacteria to those found in other premature infants surveyed using equivalent methods, especially during the first and third colonization phases (Fig. A1-1B) (de la Cochetiere et al., 2004; Gewolb et al., 1999; Palmer et al., 2007; Mackie et al., 1999; Magne et al., 2006; Millar et al., 1996; Mshvildadze et al., 2010; Schwiertz et al., 2003; Wang et al., 2009).
Metagenomic Data Processing
Genome-wide sequencing of DNA from fecal samples collected on days 10, 16, 18, and 21 yielded 245 Mbp of metagenomic sequence data. These data were coassembled using Newbler, keeping track of each read’s sample of origin for quantification. Quantification of community composition based on read abundance can be confounded by DNA extraction and sequencing biases (Morgan et al., 2010). However, we could analyze relative abundance shifts across the third colonization phase because the same biases were expected in all samples (Fig. A1-2). We identified three major sequence “bins” for Serratia, Citrobacter, and Enterococcus, which dominated the third phase of colonization (Figs. A1-1A and A1-2). Projecting the smaller contig data (500–1,500 bp) onto an emergent self-organizing map generated based on tetranucleotide frequencies of contigs >1,500 bp and reference genomes allowed us to assign additional fragments to Enterococcus and provide partial coverage for one or more Pseudomonas populations from the day 10 sample (SI Materials and Methods and Fig. S2). Most fragments from other minor populations were assigned to higher taxonomic levels (mostly Enterobacteriaceae) (Table S3 in Dataset S1). We also identified multiple plasmid and phage populations, some of which were completely sequenced (Table S4 in Dataset S1).
Manual curation resulted in a Serratia genome (strain UC1SER) with nine gaps, seven of which involve rRNA operons. Based on the sequence coverage of Serratia (∼17×) compared with other bacterial contigs (Table S2), UC1SER dominated the community genomic datasets from the formula fed (third) phase. We detected remarkably low levels of nucleotide polymorphisms in the UC1SER
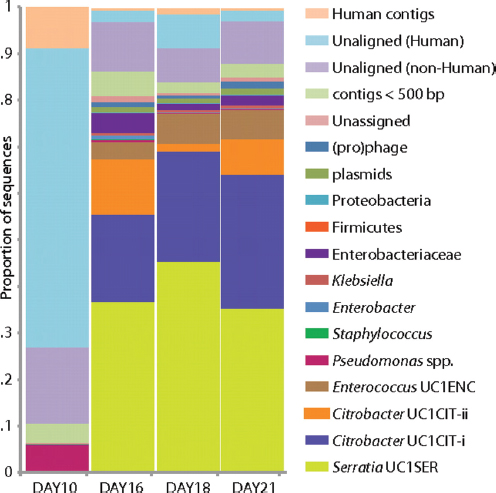
FIGURE A1-2 Population dynamics based on metagenomic profiling. Distribution of the reads over the curated sequence bins across each library (as percentage of all reads in the libraries from day 10, 16, 18, and 21, respectively).
sequences (close to the expected sequencing substitution error rate), and only very few regions in which gene content varied.
Serratia, a genus comprising motile, facultative anaerobes from the family Enterobacteriaceae, is found in many environments. The UC1SER genome assembled de novo from metagenomic data was compared with the publicly available genomes of Serratia proteamaculans (21) and Serratia marcescens (Sanger Institute, United Kingdom). S. marcescens is an important opportunistic pathogen and a known cause of nosocomial disease in neonatal intensive care units (22). S. proteamaculans is an endophytic bacterium rarely identified in human specimens. All curated UC1SER genome fragments (up to 2.36 Mb in length) share a syntenous backbone with the previously reported genomes, although numerous genomic
differences were noted relative to the previously sequenced species (Table S5 in Dataset S1). For syntenous orthologs, UC1SER predicted proteins share 97.3% average amino acid identity (AAI) over 4,089 genes and 88.6% AAI over 3,672 genes with S. marcescens and S. proteamaculans, respectively. Given the overall synteny with S. marcescens and S. proteamaculans across reconstructed genome fragments, we ordered the nine UC1SER genome fragments according to the reference genomes (Table S5 in Dataset S1).
Assembly of a Near-Clonal Serratia Genome and Comparative Genomics
Within syntenous regions in UC1SER, there are small clusters of genes that occur elsewhere in S. marcescens and S. proteamaculans. These clusters encode proteins involved in protocatechuate utilization, fimbrial biosynthesis and export, nitrate reduction, general secretion, siderophore (enterobactin) synthesis and transport, tetrathionate reduction and regulation, osmoprotectant transport, and general metabolism, including amino acid biosynthesis. These rearranged or “indel” regions show elevated sequence divergence relative to syntenous orthologs (AAI of 77 and 58% relative to S. marcescens and S. proteamaculans, respectively). Thus, these regions may contribute to metabolic variation that differentiates these species.
Regions of the UC1SER genome that are absent in one or both of the other Serratia species encode factors involved in transport (most notably iron uptake) and regulation, outer membrane and exopolysaccharide biosynthesis, adhesion, antibiotic biosynthesis, virulence, quorum sensing, biosynthesis of the redox cofactor pyrroloquinoline quinone, arsenate resistance, and propanoate metabolism (Table S5 in Dataset S1). Only UC1SER contains pga operon genes involved in polysaccharide synthesis for biofilm adhesion and a regulon for allantoin utilization, which may be associated with virulence (Chou et al., 2004). It is also the only genome with yjf-sga operon genes (phosphotransferase system components sgaH, U, E), which enable some strains of gut bacteria to use vitamin C as an energy source (Campos et al., 2008). UC1SERalso has a large nonribosomal peptide biosynthesis protein not found in the other genomes. In contrast to the other reconstructed genomes in this study, UC1SER contains few mobile element-derived sequences.
Analyses of Two Ecologically Distinct Citrobacter Subpopulations
Based on 16S rRNA gene sequences on assembled contigs, Citrobacter in the third colonization phase is closely related to Citrobacter freundii. Despite average coverage of ∼13× on larger Citrobacter fragments, automated assembly resulted in a highly fragmented genome. Citrobacter contigs displayed many diallelic sites among their reads that were almost always linked (i.e., no evidence for homologous recombination), indicating the presence of two coassembled strain
populations. Examination of most contig ends revealed path bifurcation (Fig. A1-3A) because of local strain sequence divergence, differences in gene content, and intergenic region length (see below).
Manual curation resolved these bifurcations and reduced the number of Citrobacter contigs from ∼1,400 to 10 (the largest curated contig is 2.55 Mb) (Fig. A1-3B). The final contigs are generally syntenous with the Citrobacter 30_2 strain draft genome (Broad Institute, Cambridge, MA) and the complete Citrobacter koseri ATCC BAA-895 genome (Washington University, St. Louis, MO). Consequently, the fragments were oriented and ordered by reference to the C. koseri genome to generate a final genome representation for the dominant strain, UC1CIT-i (Table S6 in Dataset S2). Of the ten genome gaps, eight are the rRNA-encoding regions that could not be resolved, one is within a prophage, and one is in the intergenic region between genes on contig ends that are adjacent in both isolate genomes.
Citrobacter species are facultative anaerobes from the family Enterobacteriaceae and are commonly found as commensals within the mammalian intestinal tract. Like Serratia, they have been frequently documented as pathogens in premature newborns (Doran, 1999) (e.g., in cases of neonatal meningitis). Citrobacter 30_2 was isolated from a patient with Crohn disease, whereas C. koseri was isolated from an infant with meningitis. UC1CIT strains lack a “supercontig” of 402 genes reported as part of Citrobacter 30_2; based on our assembly and the functional annotation, we suspect this supercontig derives from a megaplasmid.
As expected based upon the known physiology of human-associated Citrobacter strains (Doran, 1999), the UC1CIT strains have numerous genes for uptake and utilization of a wide variety of substrates. Similar to C. koseri and Citrobacter 30_2, the UC1CIT strains are predicted to express curli and fimbriae that mediate biofilm formation and binding to host epithelial cells (Barnhart and Chapman, 2006) (Table S6 in Dataset S2). Interestingly, the UC1CIT strains and C. koseri have dual flagellar systems but Citrobacter sp. 30_2 lacks a lateral flagellar apparatus (Table S7 in Dataset S2). Lateral flagella confer swarming motility in viscous fluids (e.g., mucus) and have been associated with virulence, adhesion, and biofilm formation (Gavín et al., 2002; Merino et al., 2006).
UC1CIT sequence variation occurs genome-wide, but one sequence type dominates at most loci (Table S6 in Dataset S2). Given evidence for clonal rather than recombined strains, we defined the minor strain type (UC1CIT-ii) by separating reads primarily using polymorphism patterns in Strainer (Eppley et al., 2007) (Fig. A1-3C), which allowed for direct comparison of the two aligned strains. UC1CIT-ii sequence blocks (up to a few kilobases in length) share 98.5% average nucleotide identity with UC1CIT-i. In regions of shared gene content, ∼90% of the UC1CIT-ii genome was reconstructed. When the UC1CIT-ii strain blocks were linked and intervening gaps filled by UC1CIT-i sequence, the strains shared 99.1 ± 0.3% average nucleotide identity across their genomes (Table S8 in Dataset S2). The true level of similarity for orthologous sequences likely lies between these values.
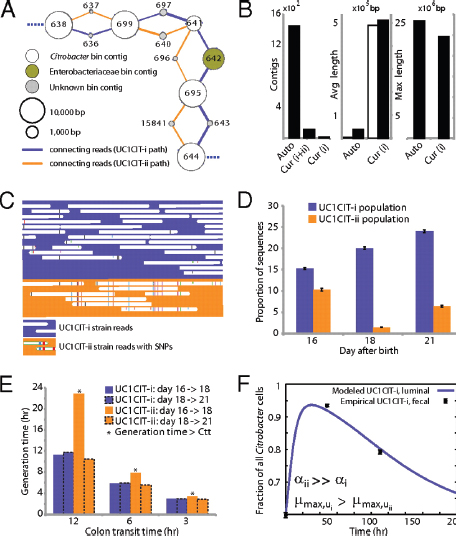
FIGURE A1-3 Analyses of two ecologically divergent Citrobacter UC1CIT subpopulations. (A) Schematic representation of part of the fragmented UC1CIT assembly. At the ends of many Citrobacter contigs (e.g., contig number 699), reads that partially coassembled led to two sequence paths because they became too divergent (e.g., reads placed in contigs 697 vs. 640) or contained completely novel sequence (reads placed in 642 vs. 696). (B) Condensing of these paths by manual curation reduced the number of contigs, increased average (white bar, left axis) and maximum contig length (black bars, right axis), and reduced cumulative length of contigs (auto, automatic assembly, cur (i+ii), curated UC1CIT-i and -ii strain contigs; cur (i), curated UC1CIT-i contigs). (C) After curation, reads from the strains were grouped based on single nucleotide polymorphism patterns using Strainer. (D) Shifts in proportion (of the respective library total number of reads) of UC1CIT-i and UC1CIT-ii reads over time. Error bar indicates SD between UC1CIT contigs. (E) A chemostat model of the colon, only allowing for differences in growth rate, was used to predict generation time differences needed to explain the observed dynamics in D. (F) Simulation based on a model that incorporated intestinal wall attachment fitted to the observed strain abundances when strain UC1CIT-ii had a higher affinity α to the intestinal wall and the UC1CIT-i luminal maximum growth rate µmax,u was higher than the growth rate of UC1CIT-ii.
Based on the relative frequency of strain-associated reads in the combined dataset for days 10, 16, 18, and 21, UC1CIT-i comprised 77% of the Citrobacter population (SI Materials and Methods and Table S8 in Dataset S2). However, the relative abundance of the strains changed dramatically during the third colonization phase (Fig. A1-3D and Table S8 in Dataset S2). Possible explanations for the strain abundance shifts include: (i) a bloom of a strain-specific phage that decimated the UC1CIT-ii population around day 18; (ii) a reduced growth rate of UC1CIT-ii when it was outcompeted for resources by UC1CIT-i, Serratia or Enterococcus populations; and (iii) a higher potential of UC1CIT-ii for intestinal wall colonization, leading to an observed decrease in the luminal (fecal) population.
A phage bloom is unlikely because we did not observe an increase in the abundance of Citrobacter phage sequences across the time series. To evaluate the other hypotheses, we constructed two models of bacterial growth in the colon (SI Materials and Methods and Fig. S3). First, using a simplified colon chemostat model, we calculated the differences in growth rates needed to fit the strain population abundance shifts from days 16 to 18 and days 18 to 21 (Fig. A1-3E). Assuming approximately equal numbers of cells per milliliter luminal content, the model predicts nearly constant generation times for UC1CIT-i. The UC1CITii generation time estimates equaled those for UC1CIT-i between days 18 and 21, but increased above the colon transit time (CTT) between days 16 and 18, resulting in washout between days 16 and 18. Based on CTT in children (12–84 h) (Wagener et al., 2004) and estimates for Escherichia coli generation times in animal models (∼2 h) (Rang et al., 1999), results from this model guided us to select parameters for a second model (SI Materials and Methods). The second model incorporated intestinal wall-associated growth and enabled fitting of the empirical data by assuming three orders of magnitude higher intestinal-wall affinity for UC1CIT-ii compared with UC1CIT-i (Fig. A1-3F and Fig. S3). In addition, to avoid rapid washout of UC1CIT-i, its maximum growth rate had to be doubled relative to UC1CIT-ii and the maximum growth rate of wall-adherent cells had to be lowered by an order of magnitude relative to luminal cells. Because these models were built upon a small amount of data, they are inherently limited in their ability to explain the Citrobacter strain behavior. However, they do strongly suggest that the strain shifts are not the result of random fluctuations. Regardless of whether the growth rates and intestinal niches differ, these Citrobacter strains are distinct in their ability to persist in, and interact with, the human host. The availability of genomic data for both strains provides the opportunity to identify possible metabolic characteristics upon which their physiological and ecological divergence is founded.
A prominent form of variation that differentiated the two UC1CIT strains involved insertions and deletions in intergenic regions (Fig. A1-4 and Table S9 in Dataset S2). In most of the 31 observed cases, intergenic regions differed in length between the strains by >10% and in most cases differed by ≥ 30%. Most
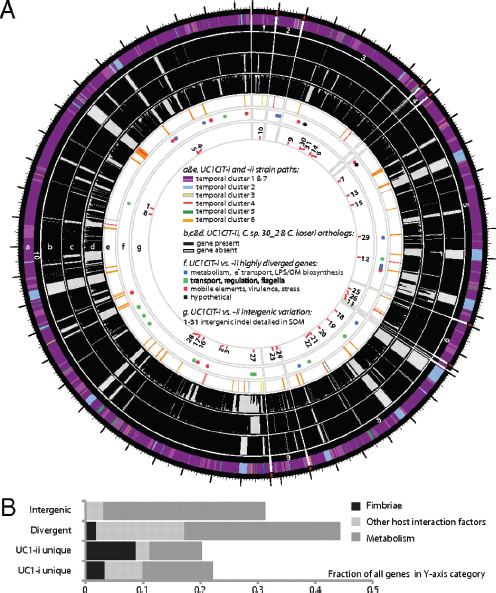
FIGURE A1-4 (A) Citrobacter UC1CIT genomic overview. A larger version of this figure is included as Fig. S9. (a) Outside circle represents the ten contigs of the UC1CIT-i genome. Coloring indicates read temporal distribution clusters of the contigs condensed during curation. Genes unique to UC1CIT-i are generally located in areas colored in blue (Fig. S2 cluster 2, Table S11 in Dataset S2). (b) Orthologs to UC1CIT-i in UC1CIT-ii. (c and d) Orthologs to UC1CIT-i in Citrobacter sp. 30_2 and C. koseri. (e) UC1CIT-ii paths with gene content not shared by UC1CIT-i, colored based on read temporal distribution clusters (Table S12 in Dataset S2). (f) Highly divergent genes between the UC1CIT strains, colored by functional class. (Tables S6 and S10 in Dataset S2). (g) Intergenic regions marked by indels that differentiate the UC1CIT strains (Table S9 in Dataset S2). (B) Summary of genomic differences between the UC1CIT strains.
variable intergenic segments were flanked by gene sequences that were nearly identical in both strains. Transcriptional regulators [25% of cases; e.g., the LexA repressor, and the NanR regulator of fimbrial adhesins previously shown to be affected by sequence variation (Sohanpal et al., 2004)] and transporters (30% of cases) were common among the flanking genes. We identified strong predicted secondary structure for many divergent intergenic regions and shared sequence similarity with known E. coli sRNAs (Fig. S4).
Hotspots of sequence variation that differentiated the UC1CIT strains (mostly substitutions rather than sequence insertions/deletions) also occurred within genes involved in transport, regulation, motility, cell-surface composition, carbohydrate metabolism, virulence, and stress response (Tables S6 and S10 in Dataset S2). Sequence polymorphisms that could potentially affect pathogenicity included the misL-like gene (autotransporter), fimbrial proteins, and a polysaccharide antigen-chain regulator. Interestingly, a large gene encoding RatA, believed to promote intestinal colonization, was a hotspot for microdiversity and was found to be absent in both Citrobacter sp. 30_2 and C. koseri. In Salmonella Typhimurium, RatB (and ShdA, see below) are associated blarwith cecal colonization and fecal shedding, and the gene encoding this protein exhibits strain-associated sequence variation in the form of variable-number direct repeats (Kingsley et al., 2003). If RatA were associated with similar phenotypes, then sequence variation between the two strains could explain differences in niche-partitioning and fecal abundance. We also observed unusually high amino acid sequence divergence in lateral flagellar genes between the UC1CIT strains, which could impact interactions with host cell surfaces (Table S7 in Dataset S2) (Lüneberg et al., 1998). High divergence between the UC1CIT strains in both copies of the gene encoding carbonic anhydrase is also notable because this gene is involved in pH homeostasis and has been identified as a colonization factor in some pathogens (Bury-Moné et al., 2008).
Finally, gene content differentiated the UC1CIT strains (Tables S6, S11, and S12 in Dataset S2). Although many strain-specific genes were clearly associated with phage, several may confer specific metabolic traits. Potentially important genes that were found in both C1CIT-i and Citrobacter sp. 30_2 but not in UC1CIT-ii encoded (i) ShdA, a large virulence protein that is part of a pathogenicity island in Salmonella Typhimurium and essential for successful intestinal colonization (Kingsley et al., 2003); (ii) the inner membrane protein YjfL; (iii) a permease specific for transport of products of pectinolysis (KdgT); (iv) a cluster of four proteins involved in cyclic nucleotide metabolism; (v) fimbrial proteins; (vi) a cluster of 13 proteins involved in phenylacetate degradation; and (vii) genes involved in lipopolysaccharide and polysaccharide/O antigen biosynthesis (abequose). Genes unique to UC1CIT-ii included many fimbrial genes, and genes enabling fructose and other sugar import, streptomycin 3 biosynthesis, and acetoacetate metabolism.
In summary, comparative genomic analyses of the UC1CIT strains highlight metabolic and host interaction traits with the potential to influence strain ecology (Fig. A1-4B). The observation that both regulatory genes and large intergenic regions are hotspots for sequence divergence indicates that one basis for physiological differentiation involves gene regulation, consistent with prior studies implicating regulation as an evolutionary mechanism underlying early ecological differentiation (Denef et al., 2010; Konstantinidis et al., 2009).
Enterococcus
The Enterococcus population increased in abundance during the third phase of colonization (Figs. A1-1 and A1-2). The 16S rRNA gene sequence of strain UC1ENC (from our data) is identical to those of several E. faecalis isolates. UC1ENC shares 98.7% AAI with E. faecalis V583 (Paulsen et al., 2003). We mapped the UC1ENC contigs and reads to the V583 genome and recovered ∼81% of the latter (Fig. S5 and Table S14 in Dataset S1). The genome size is similar to that of E. faecalis T3 and T11 [available in high-quality draft (Palmer et al., 2010)]. Absence of multiple UC1ENC contigs covering the same genomic region and low SNP frequency indicated that only one strain was present (Fig. S5).
We compared the sequences of seven UC1ENC genes to sequences of genes used in MLST analyses of clinical isolates (http://efaecalis.mlst.net/), and found that UC1ENC was identical at all seven MLST loci to a sequence type 179, the profile of an isolate recovered from a hospitalized patient’s blood sample in The Netherlands. Furthermore, six out of seven loci were identical to sequence type 16 from an isolate found in a Norwegian infant’s fecal sample (Solheim et al., 2009). Consistent with physiological characterization of the latter isolate, we found genes linked to antibiotic transport or modification and genes encoding virulence factors including collagen-binding adhesin, aggregation substance, enterococcal surface protein, gelatinase (gelE), and cytolysin (Solheim et al., 2009). Additional predicted virulence factors included an exfoliative toxin A and a serine protease known to be transcribed with gelE (Fisher and Phillips, 2009). Comparison with the V583 genome revealed the absence in UC1ENC of the mobile element containing the vancomycin resistance genes (except for vanZ), as well as small sections of the pathogenicity island and most of the plasmid regions and prophages (Fig. S5).
Mobile Elements and Minor Bacterial Populations
Manual curation allowed for genomic reconstruction of a Citrobacter plasmid distinct from the above-mentioned megaplasmid of Citrobacter sp. 30_2, except for two shared regions encoding arsenate and Cu/Ag resistance (∼85% AAI). Unlike the UC1CIT plasmid, the putative Citrobacter sp. 30_2 megaplasmid encodes tellurite resistance genes, which have been speculated to confer
protection against mammalian host defenses (e.g., by counteracting toxic substances produced by macrophages) (Taylor, 1999). The UC1CIT plasmid (∼1.4 plasmid copies per cell) has two variants that differ slightly in gene content and have read distributions across the libraries matching the UC1CIT-i and UC1CIT-ii strains, suggesting that they are strain-specific (Table S4 in Dataset S1). Several phage-like contigs were also recovered, and some displayed boom-and-bust dynamics, indicative of a lytic phage. We also reconstructed two plasmids and two phage of Enterococcus with fluctuating copy numbers (Fig. S6 and Table S4 in Dataset S1). No plasmids or phages were linked to the Serratia population. Low-abundance bacterial populations were genomically sampled as well. As predicted by the daily 16S rRNA screening (Fig. A1-1), genomic sequence-abundance data suggest that Pseudomonas peaked around day 10, whereas Enterobacter peaked on day 16, and the Klebsiella population fluctuated over time (Fig. A1-2 and Fig. S6). Several mobile elements have dynamics corresponding to the minor Klebsiella and Enterobacter populations and may derive from them (Fig. S6).
We performed a community-level analysis of functional potential using genomic information from all populations (Fig. S7). This analysis involved comparison of the microbiome of the preterm infant studied here to the core human microbiome (Qin et al., 2010). Most of the core adult orthologous groups missing from the UC1 infant communities have poorly characterized and unknown functions. There is also a depletion of functions related to carbohydrate metabolism in the infant studied, perhaps because of differences in diet and species composition, with a notable absence of lineages typical of adults from the phyla Firmicutes, Bacteroidetes, and Actinobacteria.
Conclusions
Attempts to correlate gut microbial community structure with onset of disease in premature infants have yielded conflicting results. For example, in some studies, infants with and without necrotizing enterocolitis (NEC) harbored similar species, whereas in other studies samples from infants with this disease were enriched for a particular species (e.g., Clostridium perfringens) or a particular phylum (e.g., Proteobacteria) (de la Cochetiere et al., 2004; Wang et al., 2009). In a recent study, Citrobacter was detected in fecal samples from three of four infants with NEC, but in none of the 17 control samples (Mshvildadze et al., 2010). Although it remains possible that Citrobacter is a causative agent for NEC, its presence in samples from the unaffected infant in this study highlights the difficulty in connecting a specific bacterium to disease.
We infer from the results of this study that substantial shifts in Citrobacter strain abundances arise as a result of strain-specific physiology, despite a level of sequence similarity that would typically result in classification of these species as functionally comparable. Given the differences in genetic, especially pathogenic, potential among the otherwise closely related Citrobacter strains reported here, it
is perhaps not surprising that medical comparisons at the species or higher level are often inconclusive. The intriguing differences between the UC1CIT strains in size and sequence of a subset of intergenic regions with similarity to small regulatory RNAs, as well as sequence divergence in regulatory genes emphasize the understudied importance of the evolution of gene expression in strain ecology (Denef et al., 2010).
Application of our approach to more complex microbial communities is feasible if organisms of interest within those communities can be deeply sampled, an objective that can be achieved with current platforms for high throughput sequencing. In fact, a recent study of adult gut communities that used ∼10 times more sequencing than did our study succeeded in deeply sampling several populations (Turnbaugh et al., 2010). Thus, ultimately, strain-resolved community genomic approaches can provide the resolution needed for appropriate diagnosis and treatment of a range of microbial community associated conditions.
Materials and Methods
Sample Collection
The protocol for sample collection and processing was approved by the Institutional Review Board of The University of Chicago (IRB #15895A). The sampling method involved manual perineal stimulation with a lubricated cotton swab, which induced prompt defecation. Samples were placed at −80 °C within 10 min.
Sequence Analysis of 16S rRNA Genes
Bacterial 16S rRNA genes were amplified using the broad-range bacterial primers 8–27F and 788–806R. Sequences were processed using the QIIME software package (Caporaso et al., 2010) (SI Materials and Methods, Fig. S1, and Table S1). Fecal 16S rRNA gene sequences from previous studies were obtained directly from GenBank or provided by the authors. Pairwise UniFrac distances were calculated and subjected to principal coordinates analysis (SI Materials and Methods).
Metagenomic Data Analyses
Sequencing reads from the four libraries were coassembled using Newbler (GSassembler v. 2.0.01; Roche) after removal of replicated reads (SI Materials and Methods). We annotated contigs larger than 1,500 bp with an in-house annotation pipeline. Sequence bin assignments were based on a combination of manual assembly curation, blastn, blastp, GC%, sequencing depth, SNP density, and emergent self-organizing maps (eSOM) based on tetranucleotide frequency
in combination with a K-means clustering of the temporal profiles of the reads of each contig (SI Materials and Methods). In cases of ambiguity, contigs were assigned to a higher phylogenetic category. Contigs of virus and plasmid origin were primarily identified based on boom-and-bust dynamics deduced from read temporal profiles, colocalization with plasmid/phage reference genome fragments on the eSOM map, and functional annotation information. Contigs between 500 and 1,500 bp were assigned to genomic bins based on an approach similar to that used for the large contigs, except for the use of eSOM projection. Contigs smaller than 500 nt that were not incorporated during manual assembly curation were not further analyzed.
Assemblies for the dominant bacterial, viral, and plasmid populations were manually curated in Consed (Gordon et al., 1998). Sequences that matched the human genome (blastn e-value cutoff of 1e−35) were removed from the dataset. For each Citrobacter contig, sequence types were identified based on SNP patterns and separated for downstream analyses in Strainer (Eppley et al., 2007). Details on the straining process and identification of variation hotspots is described in SI Materials and Methods. Modeling of Citrobacter strain dynamics relied on a simplified model of interstrain competition within the colon, assuming chemostat dynamics (Ballyk et al., 2001) (SI Materials and Methods and Fig. S6). The ORFs predicted on all contigs >500 bp were contrasted to the 4,055 core adult microbiome orthologous groups by blastp analysis using the same parameters and database used by Qin et al. (Qin et al., 2010).
Acknowledgements
The authors thank the Sanger Institute for S. marcescens genome data access; Dr. J. Raes for details on the adult core metagenome dataset; Dr. V. Mai for sharing 16S rRNA sequence data; Dr. C. Fischer for help with MatLab simulations; and C. Sun, N. Justice and Dr. C. Miller for comments on the manuscript. This work was supported in part by the Surgical Infection Society and the March of Dimes Foundation research Grant 5-FY10-103 (to M.J.M.), Department of Energy Genomic Science program Grant DE-FG02-05ER64134 (to J.F.B.), a Walter V. and Idun Berry Postdoctoral Fellowhip (to E.K.C.), National Institutes of Health Pioneer Award DP1OD000964 (to D.A.R.), and by the National Institute of Allergy and Infectious Diseases, National Institutes of Health, and Department of Health and Human Services (Contracts HHSN27220090018C and HHSN266200400001C; Broad Institute Citrobacter sp. 30_2 sequencing). D.A.R. is supported by the Thomas C. and Joan M. Merigan Endowment at Stanford University.
References
Ballyk MM, Jones DA, Smith HL (2001) Microbial competition in reactors with wall attachment. Microb Ecol 41:210–221.
Barnhart MM, Chapman MR (2006) Curli biogenesis and function. Annu Rev Microbiol 60:131–147.
Bury-Moné S, et al. (2008) Roles of alpha and beta carbonic anhydrases of Helicobacter pylori in the urease-dependent response to acidity and in colonization of the murine gastric mucosa. Infect Immun 76:497–509.
Campos E, et al. (2008) The yiaKLX1X2PQRS and ulaABCDEFG gene systems are required for the aerobic utilization of L-ascorbate in Klebsiella pneumoniae strain 13882 with L-ascorbate-6-phosphate as the inducer. J Bacteriol 190:6615–6624.
Caporaso JG, et al. (2010) QIIME allows analysis of high-throughput community sequencing data. Nat Methods 7:335–336.
Chou HC, et al. (2004) Isolation of a chromosomal region of Klebsiella pneumonia associated with allantoin metabolism and liver infection. Infect Immun 72:3783–3792.
Costello EK, et al. (2009) Bacterial community variation in human body habitats across space and time. Science 326:1694–1697.
de la Cochetiere MF, et al. (2004) Early intestinal bacterial colonization and necrotizing enterocolitis in premature infants: The putative role of Clostridium. Pediatr Res 56:366–370.
Denef VJ, et al. (2010) Proteogenomic basis for ecological divergence of closely related bacteria in natural acidophilic microbial communities. Proc Natl Acad Sci USA 107:2383–2390.
Dethlefsen L, McFall-Ngai M, Relman DA (2007) An ecological and evolutionary perspective on human-microbe mutualism and disease. Nature 449:811–818.
Doran TI (1999) The role of Citrobacter in clinical disease of children: Review. Clin Infect Dis 28:384–394.
Eckburg PB, et al. (2005) Diversity of the human intestinal microbial flora. Science 308:1635–1638.
Eppley JM, Tyson GW, Getz WM, Banfield JF (2007) Strainer: Software for analysis of population variation in community genomic datasets. BMC Bioinformatics 8:398.
Fisher K, Phillips C (2009) The ecology, epidemiology and virulence of Enterococcus. Microbiology 155:1749–1757.
Gavín R, et al. (2002) Lateral flagella of Aeromonas species are essential for epithelial cell adherence and biofilm formation. Mol Microbiol 43:383–397.
Gewolb IH, Schwalbe RS, Taciak VL, Harrison TS, Panigrahi P (1999) Stool microflora in extremely low birthweight infants. Arch Dis Child Fetal Neonatal Ed 80:F167–F173.
Gordon D, Abajian C, Green P (1998) Consed: A graphical tool for sequence finishing. Genome Res 8:195–202.
Hanage WP, Fraser C, Tang J, Connor TR, Corander J (2009) Hyper-recombination, diversity, and antibiotic resistance in pneumococcus. Science 324:1454–1457.
Hooper LV, et al. (2001) Molecular analysis of commensal host-microbial relationships in the intestine. Science 291:881–884.
Hooper LV, Midtvedt T, Gordon JI (2002) How host-microbial interactions shape the nutrient environment of the mammalian intestine. Annu Rev Nutr 22:283–307.
Kingsley RA, et al. (2003) Molecular and phenotypic analysis of the CS54 island of Salmonella enterica serotype typhimurium: Identification of intestinal colonization and persistence determinants. Infect Immun 71:629–640.
Koenig JE, et al. (2010) Succession of microbial consortia in the developing infant gut microbiome. Proc Natl Acad Sci USA, 10.1073/pnas.1000081107.
Konstantinidis KT, et al. (2009) Comparative systems biology across an evolutionary gradient within the Shewanella genus. Proc Natl Acad Sci USA 106:15909–15914.
Lüneberg E, Glenn-Calvo E, Hartmann M, Bär W, Frosch M (1998) The central, surface-exposed region of the flagellar hook protein FlgE of Campylobacter jejuni shows hypervariability among strains. J Bacteriol 180:3711–3714.
Mackie RI, Sghir A, Gaskins HR (1999) Developmental microbial ecology of the neonatal gastrointestinal tract. Am J Clin Nutr 69:1035S–1045S.
Magne F, et al. (2006) Low species diversity and high interindividual variability in faeces of preterm infants as revealed by sequences of 16S rRNA genes and PCR-temporal temperature gradient gel electrophoresis profiles. FEMS Microbiol Ecol 57:128–138.
Merino S, Shaw JG, Tomás JM (2006) Bacterial lateral flagella: An inducible flagella system. FEMS Microbiol Lett 263:127–135.
Millar MR, et al. (1996) Application of 16S rRNA gene PCR to study bowel flora of preterm infants with and without necrotizing enterocolitis. J Clin Microbiol 34:2506–2510.
Morgan JL, Darling AE, Eisen JA (2010) Metagenomic sequencing of an in vitrosimulated microbial community. PLoS ONE 5:e10209.
Mshvildadze M, et al. (2010) Intestinal microbial ecology in premature infants assessed with non-culture-based techniques. J Pediatr 156:20–25.
Oliver KM, Degnan PH, Hunter MS, Moran NA (2009) Bacteriophages encode factors required for protection in a symbiotic mutualism. Science 325:992–994.
Palmer C, Bik EM, DiGiulio DB, Relman DA, Brown PO (2007) Development of the human infant intestinal microbiota. PLoS Biol 5(7):e177.
Palmer KL, et al. (2010) High-quality draft genome sequences of 28 Enterococcus sp. isolates. J Bacteriol 192:2469–2470.
Paulsen IT, et al. (2003) Role of mobile DNA in the evolution of vancomycin-resistant Enterococcus faecalis. Science 299:2071–2074.
Qin J, et al. (2010) A human gut microbial gene catalogue established by metagenomic sequencing. Nature 464:59–65.
Rang CU, et al. (1999) Estimation of growth rates of Escherichia coli BJ4 in streptomycin-treated and previously germfree mice by in situ rRNA hybridization. Clin Diagn Lab Immunol 6:434–436.
Sandaa R-A, et al. (2009) Viral control of bacterial biodiversity—Evidence from a nutrient-enriched marine mesocosm experiment. Environ Microbiol 11:2585–2597.
Schwiertz A, et al. (2003) Development of the intestinal bacterial composition in hospitalized preterm infants in comparison with breast-fed, full-term infants. Pediatr Res 54:393–399.
Sohanpal BK, El-Labany S, Lahooti M, Plumbridge JA, Blomfield IC (2004) Integrated regulatory responses of fimB to N-acetylneuraminic (sialic) acid and GlcNAc in Escherichia coli K-12. Proc Natl Acad Sci USA 101:16322–16327.
Solheim M, Aakra A, Snipen LG, Brede DA, Nes IF (2009) Comparative genomics of Enterococcus faecalis from healthy Norwegian infants. BMC Genomics 10:194.
Taghavi S, et al. (2008) Genome survey and characterization of endophytic bacteria exhibiting a beneficial effect on growth and development of poplar. Appl Environ Microbiol 75:748–757.
Taylor DE (1999) Bacterial tellurite resistance. Trends Microbiol 7:111–115.
Trosvik P, Stenseth NC, Rudi K (2010) Convergent temporal dynamics of the human infant gut microbiota. ISME J 4:151–158.
Turnbaugh PJ, et al. (2010) Organismal, genetic, and transcriptional variation in the deeply sequenced gut microbiomes of identical twins. Proc Natl Acad Sci USA 107:7503–7508.
Voelz A, et al. (2010) Outbreaks of Serratia marcescens in neonatal and pediatric intensive care units: Clinical aspects, risk factors and management. Int J Hyg Environ Health 213:79–87.
Wagener S, Shankar KR, Turnock RR, Lamont GL, Baillie CT (2004) Colonic transit time—What is normal? J Pediatr Surg 39:166–169.
Wang Y, et al. (2009) 16S rRNA gene-based analysis of fecal microbiota from preterm infants with and without necrotizing enterocolitis. ISME J 3:944–954.
EVOLUTION OF VIRULENCE IN OPPORTUNISTIC PATHOGENS:
GENERALISM, PLASTICITY, AND CONTROL10
Sam P. Brown,11Daniel M. Cornforth,11 and Nicole Mideo11
Standard virulence evolution theory assumes that virulence factors are maintained because they aid parasitic exploitation, increasing growth within and/or transmission between hosts. An increasing number of studies now demonstrate that many opportunistic pathogens (OPs) do not conform to these assumptions, with virulence factors maintained instead because of advantages in non-parasitic contexts. Here we review virulence evolution theory in the context of OPs and highlight the importance of incorporating environments outside a focal virulence site. We illustrate that virulence selection is constrained by correlations between these external and focal settings and pinpoint drivers of key environmental correlations, with a focus on generalist strategies and phenotypic plasticity. We end with a summary of key theoretical and empirical challenges to be met for a fuller understanding of OPs.
Opportunistic Pathogens and a Challenge to Virulence Evolution Theory
The study of infectious diseases has become a major focus within evolutionary biology; however, remarkably little attention has been paid to an extremely broad class of pathogens, the opportunists. This oversight stems from the theoretical convenience of treating host–parasite interactions as closed systems in which a single, obligate pathogen specialises on a single host (Alizon et al., 2009; Anderson and May, 1982). Most pathogens actually fail to meet these assumptions, with many coexisting relatively peacefully with their human host (i.e., they are not obligately pathogenic) or even exploiting an entirely different environment outside of human hosts (Woolhouse et al., 2001).
Opportunistic pathogens (OPs) are typically characterised in the medical literature as organisms that can become pathogenic following a perturbation to their host (e.g., disease, wound, medication, prior infection, immunodeficiency, and ageing). These opportunists can emerge from among the ranks of normally
___________
10 This article was published in Trends in Microbiology, Volume 20, Brown et al., Evolution of virulence in opportunistic pathogens: Generalism, plasticity, and control, Pages 336-342, Copyright 2012.
11 Centre for Immunity, Infection, and Evolution, School of Biological Sciences, University of Edinburgh, West Mains Road, Edinburgh EH9 3JT, UK.
Corresponding author: Brown, S.P. (sam.brown@ed.ac.uk), (sampaulbrown@gmail.com).
Keywords: virulence; pathogenicity; evolution; plasticity; regulation; antivirulence drugs.
commensal symbionts (e.g., Streptococcus pneumoniae and Staphylococcus aureus) or from environmentally acquired microbes (e.g., Pseudomonas aeruginosa and Burkholderia cepacia). Many more pathogens are recognised as opportunists in the sense that although they regularly cause disease in health humans, they are also zoonotic and exploit numerous other hosts (e.g. Bacillus anthracis and rabies virus).
We propose a broad and simple definition of OPs: non-obligate and/or nonspecialist parasites of a focal host. Thus, if the classic assumptions (obligate parasite and specialist on one host) of virulence evolution theory fail, we have an OP. In Table A2-1 we outline, with examples, how the combinations of these two conditions give us a classification of OPs into commensal opportunists, environmental opportunists and parasite opportunists (or zoonoses).
Given the failure of the two key assumptions of classical virulence evolution theory (Table A2-1), what can this body of theory tell us about OPs? For some parasites, the strict failure to meet these assumptions might not be important if the approximation is reasonable in practice, for instance if humans are the major source of parasite transmission (to any host) and the parasite does not routinely enter a commensal stage (e.g., Salmonella enterica among humans living in dense and unsanitary conditions). In these cases, standard predictions from virulence evolution theory may still apply, such as a trade-off between transmission and virulence (Fraser et al., 2007; Mackinnon and Read, 1999). Yet as the biological reality moves further away from these assumptions, we are left only with the prediction that multi-environment opportunists are likely to experience non-optimal virulence in a given host (Bull and Ebert, 2008; Gandon, 2004). However, ecological and evolutionary theory offers an increasing number of insights into other key features of many opportunists, in particular plasticity and generalism. All human OPs are generalists in the sense that they are able to grow in more than one environment. In addition, many OPs display remarkable phenotypic
TABLE A2-1 An Ecological Classification of Pathogens with Representative Examples
| Obligate Parasite | Facultative parasite | |
| Specialist on humans | Current virulence evolution paradigm: Plasmodium falciparum, HIV, influenza virus (A, B, C), Mycobacterium tuberculosis | Commensal opportunists: Staphylococcus aureus, Enterococcus faecalis, Haemophillus influenza, Streptococcus pneumoniae |
| Non-specialist on humans (generalist) | Parasite opportunists (zoonoses): Borrelia burgdorferi, rabies virus, Salmonella spp., Bartonella henselae | Environmental opportunists: Pseudomonas aeruginosa, Burkholderia cepacia, Rhodococcus equi, Mycobacterium marinum, Vibrio vulnificus |
plasticity, being able to modify phenotypic expression as a function of their changing environmental context.
If we can understand microbial plasticity and generalism, we can understand why opportunistic bugs become pathogens, when they are likely to do this and how we can interfere with their plastic responses to control their virulence in a sustainable manner. In this review, we aim to develop a general and integrative framework for the understanding and management (on ecological and evolutionary time scales) of opportunistic pathogens.
What is Virulence, and Why Damage Your Host?
For population biologists, virulence is typically the increase in host mortality resulting from parasite infection (Anderson and May, 1982). Although this is an explicit and measurable quantity, it ignores many aspects of parasite biology that cause harm without death (Bull, 1994; Casadevall and Pirofski, 1999; Gandon, 2004; Read, 1994). For medical microbiologists, virulence is understood as harm or morbidity to the host, but the focus is on the mechanistic basis of harm, such as identifying virulence determinants or factors (VFs). VFs are typically defined as pathogen components whose loss specifically impairs virulence but not viability (in rich media); classic bacterial examples include toxins, exoenzymes, adhesins, and secretion systems (Brogden et al., 2007).
VFs can be mechanistically complex and therefore are presumably products of natural selection. However, the nature of selection for maintaining and strengthening VFs remains controversial. Levin and Svanborg Edén made an important distinction between direct and coincidental selection for VFs (Levin and Svanborg Edén, 1990). Under direct selection (by far the most influential model), expression of the VF is correlated with the ability of the parasite to exploit and/or be transmitted from the host; in other words, parasitic VF expression (and consequent costs in terms of host mortality) is rewarded by some benefit. These benefits can either be gained through transmission (Alizon et al., 2009; Anderson and May, 1982) or through within-host growth Levin and Bull, 1994). This dichotomy, highlighting the importance of multiple scales in disease processes (Mideo et al., 2008), forms the basis of the standard evolutionary view of virulence.
By contrast, purely coincidental selection argues that VF expression is not positively correlated with any measure of parasitic success within the focal host; in other words, there are no benefits in the parasitic context. VFs are then fascinating spandrels (Gould and Lewontin, 1979; Levin, 1996), byproducts of selection for adaptations not related to disease. The mystery of why a VF exists must then be answered elsewhere in the parasite life history, with VF maintenance caused by some benefit in an extra-host habitat or a within-host habitat in which the organism does not cause disease. In this case, can we still make general statements about the dynamics (ecological and evolutionary) of virulence, or are we relegated to case-by-case considerations (Ebert and Bull, 2003; Levin and Svanborg
Edén, 1990)? To begin to answer this challenge, we develop a descriptive model framework to outline how four key selective pressures (coincidental, colonisation, export, and within-host) can combine to shape the evolutionary dynamics of VFs.
Virulence Factor Dynamics Across Multiple Environments
A characteristic of all opportunistic pathogens is compartmentalisation into environments where they cause disease (e.g., burn wounds for P. aeurignosa and the circulatory system for S. pneumoniae) and environments where they do not (soil and nasopharynx, respectively). This compartmentalisation can be within a focal host (in particular, either side of mucosal barriers) or between a focal host and another environment (e.g., animal reservoirs vs human hosts). To conceptualise this split, we divide the world of a microbe into two compartments: the virulence compartment V, the sensitive parts of a focal host where microbial VFs result in disease symptoms; and the asymptomatic compartment A, which is everywhere else it can grow (Figure A2-1a, schema inspired by [Margolis and Levin, 2007]). In Figure A2-1b–d, we illustrate how four selective pressures (coincidental, colonisation, export and within-host; the four arrows in Figure A2-1a) can combine to recover existing theories on the evolution of virulence (Box A2-1).
The analysis in Box A2-1 illustrates that if the within-host and transmission (colonisation and export) pressures select against VFs, then there are no countervailing benefits of VFs during host exploitation or transmission (and VFs will be less common in virulence compartments, variation permitting): we are left with purely coincidental virulence (Figure A2-1c). Pure coincidental virulence implies a positive association with damage but not growth or transmission from V. A classic example is found in the soil bacterium Clostridium botulinum: botulinum toxin is an extremely potent virulence factor when introduced into humans, but C. botulinum itself cannot grow in, let alone be transmitted from, humans (Levin and Svanborg Edén, 1990) (thus, humans are an ecological sink [Sokurenko et al., 2006]). The simple formulation in Box A2-1 therefore clarifies how and why some empirical studies may fail to find a selective advantage to VFs in infections (site V). Even without any benefit in site V, selection could favour VF expression, depending on the frequency at which bacteria encounter sites A and V and the relative magnitude of benefits (replication in site A) and costs (growth in site V or movement between A and V). We now use the framework outlined in Figure A2-1 and Box A2-1 to discuss the importance of positive and negative correlations between bacterial environments A and V.
Pre-Adaptation
Pure coincidental selection as exemplified by C. botulinum virulence is, however, an extreme situation: coincidental selection can also coexist with positive within-host and/or transmission selection for VFs. In these cases, the VFs are
BOX A2-1
Ecological and Evolutionary Dynamics in Structured Environments
In Figure A2-1a, we introduce a simple diagrammatic sketch of bacterial population growth in two compartments, one incurring virulence (site V) and the other asymptomatic (site A). To track population dynamics across these two compartments, we define the number of microbes of strain i in each compartment as NAi and NVi. Microbes replicate in the asymptomatic site, A, at a net per capita rate g and leave this site to colonise the symptomatic (virulence) site, V, at rate c. Within this symptomatic site of the host, microbes grow at rate r and are released back into the asymptomatic site (e.g., through bacterial shedding) at rate e. Each microbial strain may have unique rates for these processes, so each rate parameter is subscripted by i. This gives rise to the dynamic equations below for tracking the strain-specific population dynamics of bacteria in each compartment:
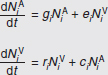
To address evolutionary questions of change in VF investment, we allow each of these vital rates (g, c, r, e) to be functions of VF expression, v. Here, the trait v could be the number of VFs expressed or the level of expression of a given VF. We can now use the epidemiological Price equation approach to study the forces acting on v in sites A and B (Day and Gandon, 2006). Following the maths in Day and Gandon (2006) (but ignoring mutation between types), the rate of change in the average level of VF expression, ,v– in each site is given by:
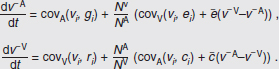
In both equations, the first terms represent the effects of direct selection on v in each site. In other words, natural selection will favour an increase in the average value of v in site A (or V) if bacteria with higher VF expression also have higher growth rates in site A (or V). The second and third terms represent changes in the average v as a result of movement between sites A and V, weighted by the population sizes in the two sites. For example, the average value of v in site A will tend to increase if bacteria with higher VF expression also have higher rates of export from site V to A [i.e., covV(vi,ei) is positive]. The average value of v could also increase by export if the average v in site V is higher than in site A. The average value of v in site V could similarly change through colonisation from A to V. In the main text, the importance of the four highlighted covariance terms is discussed, along with their relationship to existing theories for the evolution of virulence (Figure A2-1).
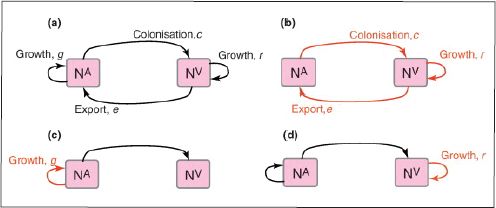
FIGURE A2-1 Ecological and evolutionary dynamics of virulence factors across two growth environments. NA and NV represent bacterial densities in the asymptomatic and virulence sites, respectively. Arrows represent demographic processes of growth (g, r) and transmission (colonisation c, export e). Red arrows represent a positive selective impact of VF expression. (a) Our basic ecological model (see Box A2-1 for analysis). (b) Epidemiological selection (Alizon et al., 2009; Anderson and May, 1982); the dominant theoretical paradigm for virulence evolution states that virulence factors yield a net benefit during parasitic exploitation because of positive effects on within-host growth and/or transmission. (c) Purely coincidental selection (Levin and Svanborg Edén, 1990). (d) Purely within-host selection (Levin and Bull, 1994).
multi-functional. If we assume that environment A is the primary site of adaptation, then we can conclude that selection in site A generates pre-adaptations for the virulent exploitation of site V (i.e., once in site V, the VF confers some advantage in terms of growth or transmission, but evolution of the VF was driven by selection in site A). If, for example, both coincidental and within-host selection favour VF expression, then there is a positive environmental correlation between growth in environment A and that in environment V (the site of virulence, Figure A2-2).
An emerging paradigm of VF pre-adaptation driven by environmental correlation is the ability of bacteria to generalise mechanisms for resisting protists for use in other situations. Protists are an important class of bacterial predators across diverse environments (including within host-associated microbiotas), and increasing evidence points to the evolution of resistance to protist predation pre-adapting certain environmental microbes for survival and even proliferation within human macrophages (Brüssow, 2007; Cirillo et al., 1999; Harb et al., 2000; Lainhart et al., 2009; Matz and Kjelleberg, 2005; Rasmussen et al., 2005; Steinberg and Levin, 2007). For example, Steinberg and Levin demonstrated that a Shiga toxin VF of Escherichia coli O157:H7 increases survival in the presence of grazing protozoa (Steinberg and Levin, 2007). This result suggests that protozoan predation within ruminants or in the soil may have selected for the VFs
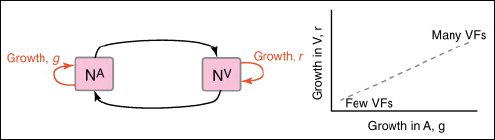
FIGURE A2-2 Adaptation to a benign environment A can pre-adapt an opportunistic pathogen for virulent growth in V if there is a significant positive association between the properties of environments A and V (i.e., if fast growth in A, g, is correlated with fast growth in V, r, or cov(g,r) > 0).
that drive pathogenicity and, in particular, export and transmission through Shiga toxin-induced diarrhoea in humans.
Other potential examples of pre-adaptation include selection for capsule carriage (a VF increasing the risk of invasive disease) among pneumococcal strains in the nasopharynx (Lysenko et al., 2010). The most common disease states caused by S. pneumoniae are pneumonia, otitis media and sepsis, and these are not contagious conditions and therefore represent a dead end, especially when the result is rapid demise of the host (Musher, 2003). Rather, transmission occurs from the reservoir of pneumococci residing asymptomatically in the nasopharynx during the organism’s commensal state (Austrian, 1986). However, among the more than 92 types of pneumococci expressing structurally distinct capsular polysaccharides, only a few are potentially virulent (Hausdorff et al., 2000, 2005). So why has the pneumococcus evolved or maintained the capacity for virulent, invasive behaviour through the expression of certain thick capsular polysaccharide coats? The results of Lysenko et al. demonstrate that capsule selection is driven in the nasopharynx by competitive interactions with another commensal, Haemophillus influenzae (Lysenko et al., 2010). While pneumococcal growth is suppressed by H. influenzae, the capsule offers a survival advantage by reducing susceptibility to this suppression. These results also present an important reminder that OPs will often face many distinct non-virulent environments (various A, A′, etc.), such as environments with or without a key predator or competitor (here, H. influenzae).
Lysenko et al. illustrate that growth in a crowded, immunogenic nasopharynx selects for serum resistance, which then pre-adapts S. pneumoniae for growth in blood (Lysenko et al., 2010). Similarly, survival against protists (in soil, say) selects for survival against macrophages (in human hosts) (Brüssow, 2007; Cirillo et al., 1999; Harb et al., 2000; Lainhart et al., 2009; Matz and Kjelleberg, 2005; Rasmussen et al., 2005; Steinberg and Levin, 2007). Both of these examples highlight that shared or similar environmental challenges can shape the potential
for new outbreaks, by building positive correlations between environments (Figure A2-2).
Environmental Tradeoffs: Specialism and Plasticity
The examples above describe cases in which selection for VFs may have occurred in a setting outside of infection, but incidentally provides some benefit in terms of transmission or within-host growth (Figure A2-2). Alternatively, the association between growth in A and V can be negative (Figure A2-3). How do OPs deal with such environmental trade-offs? A first possibility is that they do not: the focal lineage continues to adapt to its primary environment A, and in certain V environments, bacteria will be unsuccessful. This would be a reasonable strategy if V environments were infrequently encountered and/or unproductive (C. botulinum is a candidate here). However, if bacteria frequently encounter environments across which the costs of the trade-off are felt (and if sufficient genetic variation exists), then something is likely to give: evolution in the face of an important trade-off can lead to a loss of the trade-off (if the underlying constraint is weak), specialisation or plasticity.
A common motor of bacterial specialisation is horizontal gene transfer and loss; plasmids and phages shuttle an array of genes conferring local adaptations to heterogeneous environments (Frost et al., 2005; Rankin et al., 2010), including a strikingly large number of VFs (Levin and Svanborg Edén, 1990; Nogueira et al., 2009; Smith, 2001). The acquisition of VFs via horizontal transfer can render harmless bugs more pathogenic, switching (specializing) or even extending (generalizing) their environmental repertoire. Turner et al. posed the question as to whether generalists or specialists would be better able to exploit an entirely
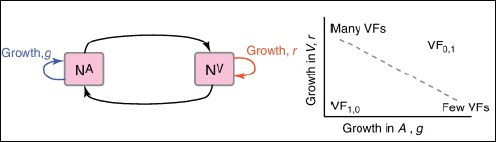
FIGURE A2-3 Adaptation to a benign environment A can reduce the capacity for virulent growth in V (and vice versa) if there is a significant negative association (trade-off) between growth rates g and r. (A negative selective impact of virulence factor expression is denoted by the blue arrow.) Plasticity can decouple the trade-off by expressing the V-specific virulence factor (VF) in V and not in A (VF0,1, where the subscripts denote expression in the two environments). However, plasticity also allows a ‘worst of all worlds’ outcome, VF1,0, whereby virulence factors are expressed inappropriately (here, only in A).
novel host type, previously unseen by either line (Turner et al., 2010). In other words, which would make the better OP? They illustrated that specialist RNA viruses (evolved under a single host condition) were able to outperform generalists in specific novel host challenges, highlighting the importance of coincidental (or indirect) selection. However, generalists tended to be more consistent across a range of novel challenges, suggesting that consistency is characteristic of generalists. Generalist phenotypes, whether selected directly or indirectly, result from either increased phenotypic constancy across environmental variation or plasticity (phenotypic switching) (de Visser et al., 2003). For OPs there are many examples of remarkable plasticity that we now discuss.
Plasticity is the ability of an organism to change its phenotype without corresponding changes in genotype. Mechanisms such as altering gene expression can allow an organism to display different phenotypes in different environments (Schlichting and Pigliucci, 1998), and when these responses match the changing environmental requirements (i.e., improve the organism’s fitness in that environment) this is called adaptive phenotypic plasticity. Standard theory for virulence evolution has only recently started to incorporate phenotypic plasticity (Choisy and de Roode, 2010; Taylor et al., 2006), but for OPs this phenomenon is of clear importance.
Bacterial VFs are by definition “optional extras” and are often under regulatory control and are not always on, with expression responsive to both physical (e.g., pH and temperature) and social (e.g., density and diversity) environmental dimensions (Bielecki et al., 2011; Duan and Surette, 2007; Kümmerli et al., 2009; Kümmerli and Brown, 2010). The underlying regulatory machinery is highly complex and variable in extent, with the number of global regulatory sigma factors varying from three in the specialist Helicobacter pylori to 24 in the generalist P. aeruginosa (Dale and Park, 2010). This variation in regulatory investment makes sense in the light of plasticity theory: it is only the challenge of frequent exposure to distinct environments that selects for adaptive phenotypic plasticity, in which case the benefits of adaptive plasticity outweigh the likely costs of the machinery necessary to generate such plasticity (DeWitt et al., 1998).
Although the direct costs and benefits of a complex regulatory machinery are readily appreciated, there is also potential for indirect costs of making “bad decisions” (Figure A2-3), as hinted by recent findings for P. aeruginosa. On initial colonisation of a mammalian host, P. aeruginosa upregulates an array of VFs (Bielecki et al., 2011; Duan and Surette, 2007). However, during subsequent evolution in chronically infected cystic fibrosis patients, many of these VFs are subsequently lost, leading to a reduction in the ability to cause acute disease and mortality (Bragonzi et al., 2009; Smith et al., 2006; Woolhouse et al., 2001). It has been argued that the loss of secreted VFs may be caused by social interactions favouring “cheater” strains that do not pay the costs of collectively useful VF production (Griffin et al., 2004; Jiricny et al., 2010). However, the continued ability of these strains to persist chronically (Bragonzi et al., 2009) suggests the
possibility that VFs are redundant in the cystic fibrosis lung, and their initial upregulation was a “bad decision” (alternatively, the benefits of VF expression may change through the course of infection as the infection environment develops).
The causes of some aspects of this decision-making have been brought into closer focus for the P. aeruginosa toxin pyocyanin, expression of which is driven by exposure to N-acetylglucosamine and its polymer peptidoglycan, commonly shed by Gram-positive bacteria (Korgaonkar and Whiteley, 2011). In addition to damaging eukaryotic cells, pyocyanin is a potent antimicrobial, suggesting that N-acetylglucosamine-dependent pyocyanin expression is an antimicrobial mechanism in environments rich in competitors (Korgaonkar and Whiteley, 2011); this may then be triggered inappropriately in the cystic fibrosis lung due to human-derived N-acetylglucosamine. There are also many well-studied examples of global regulation in quorum-sensing and stress responses (like RpoS in many proteobacteria) that strongly impact virulence (Antunes et al., 2010; Dong and Schellhorn, 2010). The impressive and expanding mechanistic understanding of bacterial plasticity (regulatory control) provides a particularly rich arena for evolutionary investigation, with clear importance for applied questions of bacterial control.
Managing Antibiotic Resistance and Virulence
Finally, we turn to the implications of opportunism for parasite control. If most human pathogens are largely shaped by selective pressures outside of disease-causing compartments, then why is antibiotic resistance such a clear and growing problem? A major part of the answer is that for many VFs discussed above, antibiotic resistance genes can confer advantages outside of the context of human medical interventions via resistance to bacterially derived antimicrobial compounds. Consistent with this broader functionality, resistance to a range of antibiotics have been found in ancient DNA from 30,000-year-old permafrost sediments (D’Costa et al., 2011). Nevertheless, antibiotic resistance has spread rapidly in many bacteria since the introduction of antibiotics into medical and farming practice (Palumbi, 2001), indicating that selective pressures are stronger in patients than in nature.
For commensal opportunists, exposure to antibiotics is routine because of their specialisation on human hosts, and therefore the emergence of antibiotic resistance in these species poses little puzzle. By contrast, non-specialists may encounter humans merely as a dynamical “sink” (Sokurenko et al., 2006), and thus human interactions are unlikely to drive the evolution of antibiotic resistance genes among these populations. However, resistance may pose a significant problem in these lineages because of to a mix of innate resistance properties (Poole, 2001) and shuttling of resistance genes by horizontal gene transfer, particularly during chains of human–human transmission (Winstanley et al., 2009).
Interest is now growing in the use of antivirulence drugs that directly target the expression of virulence factors (André and Godelle, 2005; Clatworthy et al., 2007; Defoirdt et al., 2010; Maeda et al., 2011; Mellbye and Schuster, 2011; Rasko and Sperandio, 2010). It has been argued that these drugs will limit the evolution of resistance, because they do not kill or halt the growth of their targets (Clatworthy et al., 2007; Rasko and Sperandio, 2010). How does this claim stand up in the context of OPs? If bacteria only see the drug in V (the virulence site) and the VF is only selected for in A (purely “coincidental selection”), then the drugs have potential: the antivirulence drug in this context will enhance a natural tendency towards virulence attenuation within hosts. However, if bacteria see the drug in their “non-virulent” compartment (A) and/or the VF is positively correlated with transmission, then the risks are far greater. A simple implication is that these drugs will hold more long-term promise for the treatment of environmental opportunists because of greater isolation between compartments A and V.
Concluding Remarks
Although there is a broad range of conceptual models for the evolution of virulence (Figure A2-1, Box A2-1), formal mathematical treatments have focused overwhelmingly on the most tractable subset, the specialist, obligate parasite (Alizon et al., 2009; Anderson and May, 1982; Frank, 1996). Here we argue that this bias has hindered effective evolutionary studies of opportunistic pathogens. The admission of multiple growth environments inevitably makes the mathematics more complex (Box A2-1) (Gandon, 2004; Regoes et al., 2000). More importantly, it also highlights the extent to which biological details matter, with selection on VFs dependent on a complex web of environmental correlations that are only beginning to be picked apart via careful study of bacterial population biology inside and outside of the sites where bacteria cause disease (Brüssow, 2007; Cirillo et al., 1999; Harb et al., 2000; Lainhart et al., 2009; Lysenko et al., 2010; Matz and Kjelleberg, 2005; Rasmussen et al., 2005; Steinberg and Levin, 2007).
Our formal treatment was presented in the context of distinct physical environments (e.g., blood versus mucosa); however, the control of bacterial VF expression in response to contrasting social conditions highlights an even greater complexity and a key theoretical challenge. For instance, many bacteria can discriminate between low-and high-density environments, and even clonal versus polymicrobial conditions, via quorum-sensing mechanisms (Bassler, 1999; Fuqua et al., 1994; Williams et al., 2007) and cues (Korgaonkar and Whitele, 2011). The development and testing of a novel theory integrating the molecular, ecological and evolutionary dynamics of VFs across complex social and physical environments hold real promise for accelerating our understanding of VFs and their potential as targets for evolutionarily robust antivirulence drugs.
Acknowledgements
We thank Nick Colegrave, Rolf Kümmerli, Stuart West, and Marvin Whiteley’s laboratory for helpful comments, and the Wellcome Trust for funding (Grant No. WT082273).
References
Alizon, S. et al. (2009) Virulence evolution and the trade-off hypothesis: history, current state of affairs and the future. J. Evol. Biol. 22, 245–259.
Anderson, R. and May, R. (1982) Coevolution of hosts and parasites. Parasitology 85, 411–426.
Antunes, L.C.M. et al. (2010) Quorum sensing in bacterial virulence. Microbiology 156, 2271–2282.
Austrian, R. (1986) Some aspects of the pneumococcal carrier state. J. Antimicrob. Chemother. 18 (Suppl. A), 35–45.
Bielecki, P. et al. (2011) In-vivo expression profiling of Pseudomonas aeruginosa infections reveals niche-specific and strain-independent transcriptional programs. PLoS ONE 6, e24235.
Bragonzi, A. et al. (2009) Pseudomonas aeruginosa microevolution during cystic fibrosis lung infection establishes clones with adapted virulence. Am. J. Respir. Crit. Care Med. 180, 138–145.
Brogden, K.A. et al. (2007) Virulence Mechanisms of Bacterial Pathogens, (1st edn), ASM Press.
Brüssow, H. (2007) Bacteria between protists and phages: from antipredation strategies to the evolution of pathogenicity. Mol. Microbiol. 65, 583–589.
Bull, J.J. (1994) Perspective: virulence. Evolution 48, 1423–1437.
Bull, J.J. and Ebert, D. (2008) Invasion thresholds and the evolution of nonequilibrium virulence. Evol. Appl. 1, 172–182.
Casadevall, A. and Pirofski, L. (1999) Host–pathogen interactions: redefining the basic concepts of virulence and pathogenicity. Infect. Immun. 67, 3703–3713.
Choisy, M. and de Roode, J.C. (2010) Mixed infections and the evolution of virulence: effects of resource competition, parasite plasticity, and impaired host immunity. Am. Nat. 175, E105–E118.
Cirillo, J.D. et al. (1999) Intracellular growth in Acanthamoeba castellanii affects monocyte entry mechanisms and enhances virulence of Legionella pneumophila. Infect. Immun. 67, 4427–4434.
Dale, J.W. and Park, S.F. (2010) Molecular Genetics of Bacteria, (5th edn), Wiley.
D’Costa, V.M. et al. (2011) Antibiotic resistance is ancient. Nature 477, 457–461.
de Visser, J.A.G.M. et al. (2003) Perspective: evolution and detection of genetic robustness. Evolution 57, 1959–1972.
DeWitt, T.J. et al. (1998) Costs and limits of phenotypic plasticity. Trends Ecol. Evol. 13, 77–81.
Dong, T. and Schellhorn, H.E. (2010) Role of RpoS in virulence of pathogens. Infect. Immun. 78, 887–897.
Duan, K. and Surette, M.G. (2007) Environmental regulation of Pseudomonas aeruginosa PAO1 Las and Rhl quorum-sensing systems. J. Bacteriol. 189, 4827–4836.
Ebert, D. and Bull, J.J. (2003) Challenging the trade-off model for the evolution of virulence: is virulence management feasible? Trends Microbiol. 11, 15–20.
Fraser, C. et al. (2007) Variation in HIV-1 set-point viral load: epidemiological analysis and an evolutionary hypothesis. Proc. Natl. Acad. Sci. U.S.A. 104, 17441–17446.
Frost, L.S. et al. (2005) Mobile genetic elements: the agents of open source evolution. Nat. Rev. Microbiol. 3, 722–732.
Gandon, S. (2004) Evolution of multihost parasites. Evolution 58, 455–469.
Gould, S.J. and Lewontin, R.C. (1979) The spandrels of San Marco and the Panglossian paradigm: a critique of the adaptationist programme. Proc. R. Soc. Lond. Ser. B. Biol. Sci. 205, 581–598.
Griffin, A.S. et al. (2004) Cooperation and competition in pathogenic bacteria. Nature 430, 1024–1027.
Harb, O.S. et al. (2000) From protozoa to mammalian cells: a new paradigm in the life cycle of intracellular bacterial pathogens. Environ. Microbiol. 2, 251–265.
Hausdorff, W.P. et al. (2000) Which pneumococcal serogroups cause the most invasive disease: implications for conjugate vaccine formulation and use, part I. Clin. Infect. Dis. 30, 100–121.
Hausdorff, W.P. et al. (2005) Epidemiological differences among pneumococcal serotypes. Lancet Infect. Dis. 5, 83–93.
Jiricny, N. et al. (2010) Fitness correlates with the extent of cheating in a bacterium. J. Evol. Biol. 23, 738–747.
Korgaonkar, A.K. and Whiteley, M. (2011) Pseudomonas aeruginosa enhances production of an antimicrobial in response to Nacetylglucosamine and peptidoglycan. J. Bacteriol. 193, 909–917.
Kümmerli, R. and Brown, S.P. (2010) Molecular and regulatory properties of a public good shape the evolution of cooperation. Proc. Natl. Acad. Sci. U.S.A. 107, 18921–18926.
Kümmerli, R. et al. (2009) Phenotypic plasticity of a cooperative behaviour in bacteria. J. Evol. Biol. 22, 589–598.
Lainhart, W. et al. (2009) Shiga toxin as a bacterial defense against a eukaryotic predator, Tetrahymena thermophila. J. Bacteriol. 191, 5116.
Levin, B.R. (1996) The evolution and maintenance of virulence in microparasites. Emerg. Infect. Dis. 2, 93–102.
Levin, B.R. and Bull, J.J. (1994) Short-sighted evolution and the virulence of pathogenic microorganisms. Trends Microbiol. 2, 76–81.
Levin, B.R. and Svanborg Edén, C. (1990) Selection and evolution of virulence in bacteria: an ecumenical excursion and modest suggestion. Parasitology 100 (Suppl.), S103–S115.
Lysenko, E.S. et al. (2010) Within-host competition drives selection for the capsule virulence determinant of Streptococcus pneumoniae. Curr. Biol. 20, 1222–1226.
Mackinnon, M.J. and Read, A.F. (1999) Genetic relationships between parasite virulence and transmission in the rodent malaria Plasmodium chabaudi. Evolution 53, 689–70.
Margolis, E. and Levin, B.R. (2007) The evolution of bacteria–host interactions: virulence and the immune over-response. In Evolutionary Biology of Bacterial and Fungal Pathogens (Baquero, F. et al., eds), pp. 3–12, ASM Press.
Matz, C. and Kjelleberg, S. (2005) Off the hook – how bacteria survive protozoan grazing. Trends Microbiol. 13, 302–307.
Mideo, N. et al. (2008) Linking within- and between-host dynamics in the evolutionary epidemiology of infectious diseases. Trends Ecol. Evol. 23, 511–517.
Musher, D.M. (2003) How contagious are common respiratory tract infections? N. Engl. J. Med. 348, 1256–1266.
Nogueira, T. et al. (2009) Horizontal gene transfer of the secretome drives the evolution of bacterial cooperation and virulence. Curr. Biol. 19, 1683–1691.
Palumbi, S.R. (2001) Humans as the world’s greatest evolutionary force. Science 293, 1786.
Poole, K. (2001) Multidrug efflux pumps and antimicrobial resistance in Pseudomonas aeruginosa and related organisms. J. Mol. Microbiol. Biotechnol. 3, 255–264.
Rankin, D. et al. (2010) What traits are carried on mobile genetic elements, and why? Heredity 106, 1–10.
Rasmussen, M.A. et al. (2005) Exposure to rumen protozoa leads to enhancement of pathogenicity of and invasion by multiple-antibiotic-resistant Salmonella enterica bearing SGI1. Infect. Immun. 73, 4668–4675.
Read, A.F. (1994) The evolution of virulence. Trends Microbiol. 2, 73–76.
Schlichting, C. and Pigliucci, M. (1998) Phenotypic Evolution: A Reaction Norm Perspective, Sinauer.
Smith, E.E. et al. (2006) Genetic adaptation by Pseudomonas aeruginosa to the airways of cystic fibrosis patients. Proc. Natl. Acad. Sci. U.S.A. 103, 8487–8492.
Smith, J. (2001) The social evolution of bacterial pathogenesis. Proc. R. Soc. Ser. B. Biol. Sci. 268, 61–69.
Sokurenko, E.V. et al. (2006) Source–sink dynamics of virulence evolution. Nat. Rev. Microbiol. 4, 548–555.
Steinberg, K.M. and Levin, B.R. (2007) Grazing protozoa and the evolution of the Escherichia coli O157: H7 Shiga toxin-encoding prophage. Proc. R. Soc. B. Biol. Sci. 274, 1921–1929.
Taylor, P.D. et al. (2006) The evolutionary consequences of plasticity in host–pathogen interactions. Theor. Popul. Biol. 69, 323–331.
Turner, P.E. et al. (2010) Role of evolved host breadth in the initial emergence of an RNA virus. Evolution 64, 3273–3286.
Woolhouse, M.E. et al. (2001) Population biology of multihost pathogens. Science 292, 1109–1112. Woolhouse, M.E.J. et al. (2001) Population biology of multihost pathogens. Science 292, 1109.
FREE-LIVING TUBE WORM ENDOSYMBIONTS FOUND AT DEEP-SEA VENTS†
Tara L. Harmer,12‡Andrea D. Nussbaumer,13Monika Bright,13Andrew W. Ng,12Eric G. DeChaine,14and Colleen M. Cavanaugh12
Recent evidence suggests that deep-sea vestimentiferan tube worms acquire their endosymbiotic bacteria from the environment each generation; thus, free-living symbionts should exist. Here, free-living tube worm symbiont phylotypes were detected in vent seawater and in biofilms at multiple deep-sea vent habitats by PCR amplification, DNA sequence analysis, and fluorescence in situ hybridization. These findings support environmental transmission as a means of symbiont acquisition for deep-sea tube worms.
The mode by which symbionts are passed between successive host generations is a primary question in symbiosis research. Symbiont transmission typically occurs vertically via transfer from parent to offspring, horizontally between
___________
12 Organismic and Evolutionary Biology, Harvard University, 16 Divinity Avenue, Cambridge, Massachusetts 02138.
13 Marine Biology, University of Vienna, Althanstrasse 14, A-1090 Vienna, Austria.
14 Biology Department MS 9160,Western Washington University, 516 High Street, Bellingham, Washington 98225.
Received 1 November 2007/Accepted 7 April 2008.
* Corresponding author. Mailing address: Organismic and Evolutionary Biology, Harvard University, 16 Divinity Avenue, Cambridge, MA 02138. Phone: (617) 495-1138. Fax: (617) 496-6933. E-mail: cavanaug@fas.harvard.edu.
† Reprinted with permission from Applied and Environmental Microbiology. Harmer et al., Free-living tube worm endosymbionts found at deep-sea vents. Volume 74, pages 3895-3898. Copyright 2008. Supplemental material for this article may be found at http://aem.asm.org/.
‡ Present address: Division of Natural Sciences and Mathematics, The Richard Stockton College of New Jersey, P.O. Box 195, Pomona, NJ 08240.
co-occurring host individuals, or environmentally via uptake from a freeliving population (Buchner, 1965). Determining which of these mechanisms operates within a symbiosis is critical, as the transmission mode impacts fundamental ecological and evolutionary processes, including genome evolution, symbiont-host specificity, and coevolution (for examples, see references Dale and Moran, 2006; Moya et al., 2008; and Stewart et al., 2005). Deep-sea vestimentiferan tube worms, which dominate the fauna at hydrothermal vents and cold seeps, are hypothesized to acquire their bacterial symbionts environmentally from a free-living population. Attempts to detect tube worm symbionts in host eggs and larvae by the use of microscopy and PCR have been unsuccessful (Cary et al., 1989; Cary et al., 1993; Cavanaugh et al., 1981; and Jones and Gardiner, 1988), suggesting that transmission does not occur vertically. Furthermore, most vent vestimentiferan species host symbionts that share identical 16S rRNA sequences, which is also consistent with the hypothesis of environmental transmission (Laue and Nelson, 1997; Nelson and Fisher, 2000). Unlike adults, the larvae and small juveniles of vestimentiferan tube worms have a mouth and gut, suggesting environmental acquisition via the ingestion of symbionts during larval development (Jones and Gardiner, 1988; Southward, 1988). However, Nussbaumer et al. (2006) recently demonstrated that bacterial symbionts are found on the developing tubes of settled larvae, entering the host worm through the epidermis and body wall of both larvae and young juveniles (Nussbaumer et al., 2006). These studies strongly suggest that tube worms acquire their symbionts from the surrounding environment and, therefore, that these endosymbionts should be detectable in a free-living form.
Sample Collection
A systematic search for the free-living counterpart to the gammaproteobacterial endosymbiont phylotype shared by three species of vestimentiferan tube worms, Riftia pachyptila, Oasisia alvinae, and Tevnia jerichonana, was conducted at the Tica hydrothermal vent site (~2,600-m depth) on the East Pacific Rise (EPR) (9°50.447′N, 104°17.493′W) during December 2002 and December 2003. Symbiont-containing tissue was dissected from all three vestimentiferan tube worm hosts (from the trophosome) and from Calyptogena magnifica clams (from the gills) at the Tica vent site for future use as positive and negative controls, respectively. Environmental samples were collected from two distinct habitats: surface-attached biofilms and seawater.
Symbionts in surface-attached biofilms were collected on bacterial settlement devices deployed in four hydrothermal vent environments at increasing distances from tube worm clusters: (i) among tube worms, (ii) adjacent to tube worms, (iii) away from tube worms (~10 m), and (iv) off-axis (~100 m) outside the axial summit of the caldera) (see Fig. S1 in the supplemental material). Settlement devices were constructed of polyvinyl chloride holders containing three to five basalt pieces (8 by 1 by 1 cm) and 4 to 12 glass microscope slides that were washed,
autoclaved, and kept sterile until deployment. Devices were collected within 1 month or after 1 year. Upon collection, the basalt pieces were examined under a dissecting microscope to detect any settled tube worm larvae or juveniles and then immediately stored at ~80°C. Pieces with observable tube worms were excluded to eliminate the risk of detecting symbionts living within host tissue. Microscope slides were fixed for fluorescence in situ hybridization (FISH) analysis in 4% paraformaldehyde and stored in 70% ethanol at 4°C.
Seawater samples were collected 1 m away from an R. pachyptila tube worm cluster using a McLane large-volume water transfer system water pump attached to the deep submergence vehicle Alvin. Samples (200 liters each) were filtered in situ through a 1-µm Petex prefilter (Sefar) and then through a 0.45-µm mixed-cellulose ester filter (Millipore). Control seawater samples (80 liters each) were collected from the ocean surface above the EPR and from the Atlantic Ocean in Nahant, MA. All filters were stored at −80°C until DNA extraction.
16S rRNA Gene Sequence Analyses
PCR amplification and DNA sequence analyses were used to test for the presence of the vestimentiferan symbiont in biofilm and seawater samples. DNA was extracted by standard methods (Sambrook and Russel, 2001). The vestimentiferan symbiont 16S rRNA gene (a 401-bp fragment) was PCR amplified using primers specific for the shared 16S phylotype: RifTO44 (5′-GGCCTAGATT-GACGCTGCGGTA-3′) (this study) and RifTO445 (23). To detect contamination by host tissue, primers specific for the genes encoding the vestimentiferan host exoskeleton protein RP43 (GenBank accession no. AF233595), RifTOExoF (5′-CTAAAGGCAGTGTCAAGAGCGGGAC-3′) and RifTOExoR (5′-TTCCTC-GAAGTTGCCGTATGCCG-3′), were used. PCR products were cloned into a pCR2 cloning vector (Invitrogen) and sequenced by standard methods using BigDye Terminator cycle sequencing reaction kits (PE Biosystems) with M13 forward and reverse primers. Symbiont- and host-specific primers amplified their target genes in the control symbiont-containing tissue samples from R. pachyptila, T. jerichonana, and O. alvinae worms, while vestimentiferan symbionts were not amplified from C. magnifica gill tissue, the negative control.
The free-living vestimentiferan symbiont 16S rRNA phylotype was detected in both biofilm and seawater samples collected at the Tica vent site. The symbiont phylotype (GenBank accession no. U77478) (Feldman et al., 1997) was amplified from all basalt pieces retrieved after 1 month and after 1 year, including those from the off-axis site, away from active venting, and those from vent seawater samples on both 0.45- and 1-µm-pore-size water filters (Table A3-1). Host tissue was detected only on a single prefilter (1 µm) water sample. PCR amplifications from surface seawater control samples yielded positive PCR results with universal Bacteria primers (27f and 1492r) (Lane, 1991) but yielded negative results when either the vestimentiferan symbiont- or host-specific primers were used,
| Time of collection and type of deployment | Total no. of blocksd | No. of blocks with positive result by: | |||
| PCR amplificationb | |||||
| Bacteria positive control | Tube worm symbiont | Tube worm host | Sequence verificationc | ||
| ~1 mo | |||||
| Among R. pachyptila | 3 | 3 | 3 | NDe | 3 |
| Near R. pachyptila | 4 | 4 | 2 | ND | 3 |
| Away from R. pachyptila | 5 | 5 | 4 | ND | 3 |
| Off-axis | 3 | 2 | 5 | ND | 1 |
| 1 yr | |||||
| Among R. pachyptila | 1 | 1 | 1 | ND | 1 |
| Near R. pachyptila | 2 | 2 | 2 | ND | NAf |
| Away from R. pachyptila | 3 | 3 | 3 | ND | 3 |
| Off-axis | 3 | 3 | 3 | ND | 3 |
a Basalt blocks, deployed at various distances from R. pachyptila tube worm clusters at the Tica vent site along the EPR, were collected and analyzed after ~1 month and after 1 year.
b PCR amplification was performed using primers for universal Bacteria (27f and 1492r), vestimentiferan host-specific primers (for RP43, RifTOExoF and RifTOExoR), and symbiont-specific primers (RifTO44 and RifTO445).
c A subset of basalt biofilm samples was analyzed to verify the presence of the free-living tube worm symbiont phylotype.
d Number of basalt blocks analyzed for each deployment location and time.
e Tube worm hosts were not detected (ND) on any analyzed samples; samples with tube worm hosts were discarded.
f Only one sample was not analyzed (NA) because sequencing reactions did not work (including positive controls), perhaps due to inhibitory substrates in the DNA.
suggesting that symbiont phylotypes were present only in deep-seawater samples. Little is yet known about the metabolic state or energy source for symbionts outside of their tube worm hosts, but it is possible that free-living symbionts may be cystic or quiescent while awaiting the inoculation of larval or juvenile tube worms.
FISH
FISH was used to provide direct visual evidence of the tube worm symbiont on glass slides recovered from bacterial settlement devices. For each slide, a universal Bacteria probe,
Eub338 (1), either 5′end labeled with fluorescein or stained with the DNA-binding fluorescent dye 4′, 6′-diamidino-2-phenylindole (DAPI), was used as a positive control along with the symbiont-specific probe RifTO147, RifTO445, or
RifTO830 that was 5′end labeled with Cy3 (Nussbaumer et al., 2006). The images from the control and symbiont-specific probes were then overlaid. The probe specificity was tested on R. pachyptila trophosome tissue, and the formamide concentration was increased until no probe remained hybridized (probe dependent, 20% [for Fig. S2 in the supplemental material] or 35% [for Fig. A3-1]). On each slide, either a nonsense probe, NON338 (Nussbaumer et al., 2006), or a 1-base-mismatch probe was used as a negative control. Hybridized slides were viewed and digitally photographed using a Leica model DMRB fluorescence microscope.
The tube worm symbiont phylotype was detected using FISH on all slides tested (Fig. A3-1; see Fig. S2 in the supplemental material) with the exception of the off-axis samples that were collected from devices deployed for less than 1 month. Although not directly quantified, the overall bacterial abundance appeared to be greatest on slides deployed for 1 year among, adjacent to, or away from the tube worms. The direct detection of the tube worm symbiont in biofilms supports the hypothesis that these bacteria exist in the free-living vent environment.
Indeed, in a coastal marine endosymbiosis, the 16S phylotype of bacterial symbionts of Codakia orbicularis clams is readily found in the sea grass sediment surrounding their hosts (Gros et al., 2003).
Endosymbiont ITS Diversity
If vestimentiferan tube worms acquire their symbionts from a diverse environmental source population, it can be hypothesized that the symbiont population within a host may consist of multiple closely related phylotypes (DeChaine et al., 2006; Won et al., 2003). The symbiont internal transcribed spacer (ITS), which is under relaxed selection relative to the 16S and has been used extensively to assess strain-level variation in bacteria (Stewart et al., 2007), was cloned and sequenced to test for the presence of multiple symbiont phylotypes within individual tube worms. The ITS, located between the 16S and 23S rRNA genes in the bacterial rRNA operon, occurs as a single copy in the vestimentiferan symbiont genome (Markert et al., 2007; Robidart et al., 2008). By using symbionts-pecific primers embedded in the 16S and 23S rRNA genes (Sym-ITS-1322F and Sym-ITS-23SR) (31), the ITS was PCR amplified (30 cycles with Taq polymerase) from DNA extracted from the trophosomes of three adult R. pachyptila worms. PCR products were cloned and sequenced (96 clones per specimen; 288 in total).
Analysis of the ITS sequences from the three R. pachyptila symbiont clone libraries revealed high levels of genetic homogeneity in intracellular symbiont populations. Sequence analysis revealed one dominant symbiont phylotype within each of the three host specimens (accounting for 65, 77, and 41% of the sequences, respectively), and the third specimen hosted a second phylotype (27%), which consistently differed by the same two nucleotides. The majority of the remaining ITS sequences were singletons that cannot be distinguished from errors
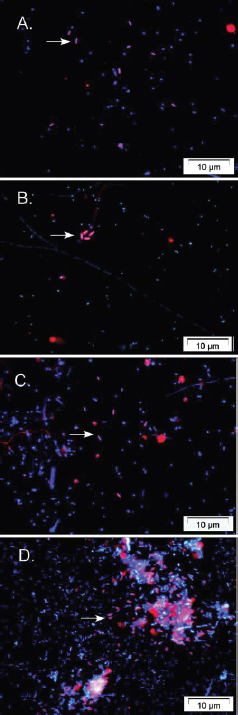
FIGURE A3-1 FISH detection of freeliving vestimentiferan bacterial symbionts. Representative slides deployed at the Tica hydrothermal vent site on the EPR for ~1 month among Riftia pachyptila tube worms (A), near tube worms (B and C), and 10 m away from tube worms (D) are shown. The overlay of two images with symbiont-specific probes (red [Cy3]) and DAPI (blue) shows the free-living symbionts (arrows) labeled with the symbiont-specific probes RifTO830 (A and C), RifTO147 (B), and RifTO445 (D).
resulting from PCR or Taq analyses. The detection of diverse ITS sequences in R. pachyptila worms further supports the acquisition of bacteria from the environment, but the diversity of free-living symbionts has not yet been investigated.
Evidence for Environmental Symbiont Acquisition
Detection of the free-living tube worm symbiont phylotype supports the hypothesis that newly settled tube worms obtain their bacteria from the vent environment. Along a spatial gradient, free-living symbionts were present among, adjacent to, and away from (within 10 m) tube worms and were also detected 100 m outside the areas of hydrothermal activity. The presence of free-living symbiotic bacteria at multiple spatial scales within a vent site suggests a potentially large environmental pool of symbionts. During host larval development and the colonization of new vents (Marsh et al., 2001; Mullineaux et al., 2000, 2005), an abundant free-living bacterial population would facilitate the initiation of the symbiosis. The environmental transmission of symbionts seems to be a risky strategy for obligate tube worm symbioses, as the survival of the mouthless and gutless adult host requires that developing larvae or juveniles successfully acquire their symbionts from a potentially unstable free-living source population. However, this developmental mode might be beneficial if it provides the host with opportunities to acquire specific, locally adapted symbiont genotypes.
Influence of Symbiotic Bacteria on Free-Living Microbial Diversity
Symbioses, notably those that are facultative, clearly have an impact on and may be a driving force of local microbial diversity in varied ecosystems (Baker, 2003; Finlay, 2005). Indeed, the bacterial symbionts of the shrimp Rimicaris exoculata make up a major component of the surrounding microbial community at hydrothermal vents in the Atlantic Ocean (Polz and Cavanaugh, 1995). Likewise, a free-living counterpart to the bioluminescent symbiotic bacterium Vibrio fischeri of squid has been identified in coastal environments, revealing a connection between the symbiotic relationship and microbial abundance and distribution (Lee and Ruby, 1992). The same situation appears to be true in legume-rhizobium symbioses; the host species is thought to be a major factor in determining the characteristics of the soil microbial community (Miethling et al., 2000). Endosymbiont and free-living populations may affect each other via positive feedback cycles, whereby the host inoculates the free-living population, and the free-living population inoculates the host (Polz et al., 2000). This study serves as the basis for future investigations of the biodiversity and biogeography of free-living marine symbionts at multiple spatial scales.
We thank Chief Scientists Charles Fisher and Craig Cary; George Silva, Gary Chiljean, and the crew of the research vessel Atlantis; and the deep submergence vehicle Alvin group for collaborative expeditions, expert sample deployment, and
collection. We thank Alan Fleer for instruction and use of the McLane pumps, Ansel Payne for technical assistance, and Thomas Auchtung, Stephanie Huff, and Irene Garcia Newton for assistance both on land and at sea. The paper was greatly improved thanks to Frank Stewart and four anonymous reviewers. This work was supported by grants from the Austria Science Foundation (FWF H00087 and P13762) and the Austrian Academy of Science to M.B., the National Science Foundation (NSF DBI-0400591) to E.G.D, and the NOAA National Undersea Research Center for the West Coast and Polar Regions (UAF 03-0092) and the NSF (OCE-0453901) to C.M.C., which we gratefully acknowledge.
References
Amann, R. I., B. J. Binder, R. J. Olson, S. W. Chisholm, R. Devereux, and D. A. Stahl. 1990. Combination of 16S rRNA-targeted oligonucleotide probes with flow cytometry for analyzing mixed microbial populations. Appl. Environ. Microbiol. 56:1919–1925.
Baker, A. C. 2003. Flexibility and specificity in coral-algal symbiosis: diversity, ecology, and biogeography of Symbiodinium. Annu. Rev. Ecol. Evol. Syst. 34:661–689.
Buchner, P. 1965. Endosymbiosis of animals with plant microorganisms. Interscience Publishers, Inc., New York, NY.
Cary, S. C., H. Felbeck, and N. D. Holland. 1989. Observations on the reproductive biology of the hydrothermal vent tubeworm Riftia pachyptila. Mar. Ecol. Prog. Ser. 52:89–94.
Cary, S. C., W. Warren, E. Anderson, and S. J. Giovannoni. 1993. Identification and localization of bacterial endosymbionts in hydrothermal vent taxa with symbiont-specific polymerase chain reaction amplification and in situ hybridization techniques. Mol. Mar. Biol. Biotechnol. 2:51–62.
Cavanaugh, C. M., S. L. Gardiner, M. L. Jones, H. W. Jannasch, and J. B. Waterbury. 1981. Prokaryotic cells in the hydrothermal vent tube worm Riftia pachyptila Jones: possible chemoautotrophic symbionts. Science 213:340–342.
Dale, C., and N. A. Moran. 2006. Molecular interactions between bacterial symbionts and their hosts. Cell 126:453–465.
DeChaine, E. G., A. E. Bates, T. M. Shank, and C. M. Cavanaugh. 2006. Off-axis symbiosis found: characterization and biogeography of bacterial symbionts of Bathymodiolus mussels from Lost City hydrothermal vents. Environ. Microbiol. 8:1902–1912.
Feldman, R., M. Black, C. Cary, R. Lutz, and R. Vrijenhoek. 1997. Molecular phylogenetics of bacterial endosymbionts and their vestimentiferan hosts. Mol. Mar. Biol. Biotechnol. 6:268–277.
Finlay, R. D. 2005. Mycorrhizal symbiosis: myths, misconceptions, new perspectives and future research priorities. Mycologist 19:90–95.
Gros, O., M. Liberge, A. Heddi, C. Khatchadourian, and H. Felbeck. 2003. Detection of the freeliving forms of sulfide-oxidizing gill endosymbionts in the lucinid habitat (Thalassia testudinum environment). Appl. Environ. Microbiol. 69:6264–6267.
Jones, M. L., and S. L. Gardiner. 1988. Evidence for a transient digestive tract in Vestimentifera. Proc. Biol. Soc. Wash. 101:423–433.
Lane, D. J. 1991. 16S/23S rRNA sequencing, p. 115–175. In E. Stackebrandt and M. Goodfellow (ed.), Nucleic acid techniques in bacterial systematics. John Wiley & Sons, New York, NY.
Laue, B. E., and D. C. Nelson. 1997. Sulfur-oxidizing symbionts have not co-evolved with their hydrothermal vent tubeworm hosts: RFLP analysis. Mol. Mar. Biol. Biotechnol. 6:180–188.
Lee, K.-H., and E. G. Ruby. 1992. Detection of the light organ symbiont, Vibrio fischeri, in Hawaiian seawater by using lux gene probes. Appl. Environ. Microbiol. 58:942–947.
Markert, S., C. Arndt, H. Felbeck, D. Becher, S. M. Sievert, M. Hugler, D. Albrecht, J. Robidart, S. Bench, R. A. Feldman, M. Hecker, and T. Schweder. 2007. Physiological proteomics of the uncultured symbiont of Riftia pachyptila. Science 315:247–250.
Marsh, A. G., L. S. Mullineaux, C. M. Young, and D. T. Manahan. 2001. Larval dispersal potential of the tubeworm Riftia pachyptila at deep-sea hydrothermal vents. Nature 411:77–80.
Miethling, R., G. Wieland, H. Backhaus, and G. C. Tebbe. 2000. Variation of microbial rhizosphere communities in response to crop species, soil origin, and inoculation with Sinorhizobium meliloti L33. Microb. Ecol. 40:43–56.
Moya, A., J. Pereto, R. Gil, and A. Latorre. 2008. Learning how to live together: genomic insights into prokaryote-animal symbioses. Nat. Rev. Genet. 9:218–229.
Mullineaux, L. S., C. R. Fisher, C. H. Peterson, and S. W. Schaeffer. 2000. Tubeworm succession at hydrothermal vents: use of biogenic cues to reduce habitat selection error? Oecologia 123:275–284.
Mullineaux, L. S., S. W. Mills, A. K. Sweetman, A. H. Beaudreau, A. Metaxas, and H. L. Hunt. 2005. Vertical, lateral and temporal structure in larval distributions at hydrothermal vents. Mar. Ecol. Prog. Ser. 293:1–16.
Nelson, K., and C. R. Fisher. 2000. Absence of cospeciation in deep-sea vestimentiferan tube worms and their bacterial endosymbionts. Symbiosis 28:1–15.
Nussbaumer, A. D., C. R. Fisher, and M. Bright. 2006. Horizontal endosymbiont transmission in hydrothermal vent tubeworms. Nature 441:345–348.
Polz, M. F., and C. M. Cavanaugh. 1995. Dominance of one bacterial phylotype at a Mid-Atlantic Ridge hydrothermal vent site. Proc. Natl. Acad. Sci. USA 92:7232–7236.
Polz, M. F., J. A. Ott, M. Bright, and C. M. Cavanaugh. 2000. When bacteria hitch a ride: associations between sulfur-oxidizing bacteria and eukaryotes represent spectacular adaptations to environmental gradients. ASM News 66:531–539.
Robidart, J. C., S. R. Bench, R. A. Feldman, A. Novoradovsky, S. B. Podell, T. Gaasterland, E. E. Allen, and H. Felbeck. 2008. Metabolic versatility of the Riftia pachyptila endosymbiont revealed through metagenomics. Environ. Microbiol. 10:727–737.
Sambrook, J., and D. W. Russell. 2001. Molecular cloning: a laboratory manual, 3rd ed. Cold Spring Harbor Laboratory, Cold Spring Harbor, NY.
Southward, E. C. 1988. Development of the gut and segmentation of newly settled stages of Ridgeia (Vestimentifera): implications for relationships between Vestimentifera and Pogonophora. J. Mar. Biol. Assoc. U.K. 68:465–487.
Stewart, F. J., and C. M. Cavanaugh. 2007. Intragenomic variation and evolution of the internal transcribed spacer of the rRNA operon in bacteria. J. Mol. Evol. 65:44–67.
Stewart, F. J., I. L. Newton, and C. M. Cavanaugh. 2005. Chemosynthetic endosymbioses: adaptations to oxic-anoxic interfaces. Trends Microbiol. 13: 439–448.
Won, Y.-J., S. J. Hallam, G. D. O’Mullan, I. L. Pan, K. R. Buck, and R. C. Vrijenhoek. 2003. Environmental acquisition of thiotrophic endosymbionts by deep-sea mussels of the genus Bathymodiolus. Appl. Environ. Microbiol. 69:6785–6792.
PARASITES MAY HELP STABILIZE COOPERATIVE RELATIONSHIPS15
Ainslie E. F. Little16,17,18 and Cameron R. Currie16,17,18,*
Abstract
Background
The persistence of cooperative relationships is an evolutionary paradox; selection should favor those individuals that exploit their partners (cheating), resulting in the breakdown of cooperation over evolutionary time. Our current understanding of the evolutionary stability of mutualisms (cooperation between species) is strongly shaped by the view that they are often maintained by partners having mechanisms to avoid or retaliate against exploitation by cheaters. In contrast, we empirically and theoretically examine how additional symbionts, specifically specialized parasites, potentially influence the stability of bipartite mutualistic associations. In our empirical work we focus on the obligate mutualism between fungus-growing ants and the fungi they cultivate for food. This mutualism is exploited by specialized microfungal parasites (genus Escovopsis) that infect the ant’s fungal gardens. Using sub-colonies of fungus-growing ants, we investigate the interactions between the fungus garden parasite and cooperative and experimentally-enforced uncooperative (“cheating”) pairs of ants and fungi. To further examine if parasites have the potential to help stabilize some mutualisms we conduct Iterative Prisoner’s Dilemma (IPD) simulations, a
___________
15 Reprinted from Little et al., 2009. Parasites may help stabilize cooperative relationships, originally published in BMC Evolutionary Biology, Volume 9.
16 Department of Bacteriology, University of Wisconsin-Madison, Madison, WI 53706, USA.
17 Smithsonian Tropical Research Institute, Apartado Box 2072, Balboa, Ancon, Panama.
18 Department of Ecology and Evolutionary Biology, University of Kansas, Lawrence, KS 66045, USA.
* currie@bact.wisc.edu
Published: 1 June 2009
BMC Evolutionary Biology 2009, 9:124 doi:10.1186/1471-2148-9-124
Received: 17 April 2009
Accepted: 1 June 2009
This article is available from: http://www.biomedcentral.com/1471-2148/9/124
© 2009 Little and Currie; licensee BioMed Central Ltd.
This is an Open Access article distributed under the terms of the Creative Commons Attribution License (http://creativecommons.org/licenses/by/2.0), which permits unrestricted use, distribution, and reproduction in any medium, provided the original work is properly cited.
common framework for predicting the outcomes of cooperative/non-cooperative interactions, which incorporate parasitism as an additional factor.
Results
In our empirical work employing sub-colonies of fungus-growing ants, we found that Escovopsis-infected sub-colonies composed of cheating populations of ants or fungi lost significantly more garden biomass than sub-colonies subjected to infection or cheating (ants or fungi) alone. Since the loss of fungus garden compromises the fitness of both mutualists, our findings suggest that the potential benefit received by the ants or fungi for cheating is outweighed by the increased concomitant cost of parasitism engendered by non-cooperation (cheating). IPD simulations support our empirical results by confirming that a purely cooperative strategy, which is unsuccessful in the classic IPD model, becomes stable when parasites are included.
Conclusion
Here we suggest, and provide evidence for, parasitism being an external force that has the potential to help stabilize cooperation by aligning the selfish interests of cooperative partners in opposition to a common enemy. Specifically, our empirical results and IPD simulations suggest that when two mutualists share a common enemy selection can favor cooperation over cheating, which may help explain the evolutionary stability of some mutualisms.
Background
The stability of cooperation is an evolutionary paradox—partners should be selected to cheat, pursuing their own selfish interests by obtaining benefits without providing a reward in return. Despite the inherent selfishness of individuals, cooperation within and between species is common in nature (Aanen et al., 2002; Chapela et al., 1994; Pellmyr and Huth, 1994). Hamilton’s Kin Selection Theory (Hamilton, 1964) helps explain cooperation among closely related individuals: organisms increase their fitness through altruism with close relatives due to their shared genes. The main theories used to help explain cooperation among unrelated individuals have been categorized as either directed reciprocation or by-product benefits (Sachs et al., 2004). Many of the models that fit the former category, including host sanction and partner fidelity, have developed out of, and are supported by, years of game theory modelling and focus on how individuals avoid being exploited by their partners (Bergstrom et al., 2003; Bull and Rice, 1991; Doebeli and Hauert, 2005; Dugatkin, 1997; Nowak, 2004). Specifically, within directed reciprocation cooperation is thought to be maintained when partners prevent one another from pursuing their own selfish interests (“cheating”),
such as retaliation against cheating. However, empirical support for mechanisms of directed reciprocation that stabilize interspecific mutualisms is mostly lacking (Bergstrom et al., 2003; Bull and Rice, 1991; Doebeli and Hauert, 2005; Dugatkin, 1997; Nowak, 2004; Sachs et al., 2004).
Studies on the stability of mutualisms have generated extensive and valuable information about cooperation between unrelated individuals. However, these studies have primarily been framed within the traditional view of pair-wise partner associations occurring in isolation (Bergstrom et al., 2003; Bronstein and Barbosa, 2002; Stanton, 2003), while it is becoming increasingly clear that mutualisms are usually embedded within complex ecological communities (Althoff et al., 2004; Bronstein and Barbosa, 2002; Bronstein, 2001; Currie et al., 1999; Curry et al., 2006; Currie et al., 1999; Irwin, 2006; Little and Currie, 2008; Morris et al., 2003; Segrages et al., 2005; Strauss et al., 2004), and that these additional symbionts or interactants (tertiary, quaternary etc.) play important roles in mutualism dynamics. Indeed, third parties have been shown to alter the intensity, outcomes, and ultimately even the symbiotic state (mutualistic or parasitic) of an association (see [Bronstein and Barbosa, 2002] for review). For example, some mutualisms are known to exist only in the presence of other species, such as protective mutualisms where the presence of natural enemies is required for benefits to be conferred (Agrawal and Fordyce, 2000; Fischer and Shingleton, 2001; Currie et al., 1999; Morales, 2000; Palmeret al., 2008). In addition, recent work on bird-dispersed pine trees has revealed that the presence/absence of a competitor, pine squirrels, alters selection on a trait specifically associated with the bird-pine mutualism (Siepielski and Benkman, 2007). This illustrates that selection imposed on a mutualism by a third party can disrupt the success and/or stability of the association. Despite mounting evidence to support the importance of additional symbionts and community members in the biology of mutualisms, the concept has not yet been extensively explored with respect to the evolutionary stability of mutualisms.
Parasites of mutualisms may be particularly important in altering the dynamics of cooperative relationships in ways that influence their stability. Parasites not only drive host evolution, they also shape community dynamics by indirectly influencing the organisms their hosts interact with. The indirect influence of parasites should be especially pronounced within mutualistic relationships, as increased morbidity and mortality caused by a parasite of one partner will significantly influence the success of the other partner (Currie, 2001; Oliver et al., 2005). Since cooperative partners frequently face a “common enemy” in the form of parasites, we hypothesize that the presence of an abundant and virulent parasite of one member of a mutualism could provide selective pressure such that cooperation between partners is favored over exploitation. Our hypothesis is similar to triadic models developed by social scientists to investigate the role of third parties in cooperative dynamics among humans (Lee et al., 1994), however
as mentioned above, the impact of additional players on the evolutionary stability of mutualisms has not been examined empirically.
The mutualism between fungus-growing ants and the fungi they cultivate for food is an example of a cooperative relationship that has persisted over evolutionary time despite continual impact from a virulent parasite (Chapela et al., 1994); Currie, 2001; Currie et al., 2003; Little et al., 2006; Mueller et al., 2001). To test our hypothesis that parasites may stabilize cooperative relationships, we experimentally manipulated sub-colonies of fungus-growing ants to determine the impact of parasites on (i) ants with fungal partners who provide decreased benefit to ants (cheater fungi), and (ii) fungi being tended by ants who provide limited benefits and increased costs to the fungus garden (cheater ants). We explore our empirical results further by utilizing the classic Iterative Prisoner’s Dilemma model (Axelrod and Hamilton, 1981) to confirm how the addition of a virulent parasite influences the traditional victors of the model: Always Defect and Tit for Tat.
Methods
Fungus-Growing Ant Symbiosis
Ants in the tribe Attini engage in an obligate mutualism with basidiomycetous fungi (Lepiotaceae and Pterulaceae) (Chapela et al., 1994; Munkacsi et al., 2004). The fungus is maintained in specialized gardens, often subterranean, and ant workers forage for substrate to support the growth of their fungal mutualist and help protect it from potential competitors or parasites. The fungus is vertically transmitted between generations, with new queens carrying a fungal pellet, collected from their natal garden, on the nuptial flight (Weber, 1972). In exchange for these benefits, the fungus serves as the primary food source for the ant colony. Fungal cultivation in ants has a single origin, ~45 million years ago (Schultz and Brady, 2008). The subsequent evolutionary history has generated a diverse collection of ants (more than 230 species) and fungi.
The fungus-growing ant symbiosis is a good model system to investigate the ecological and evolutionary effects parasites have on mutualists for several reasons. First, the symbionts are widely distributed in the new world tropics, and are conspicuous and populous enough to allow for adequate collection. Second, symbionts are amenable to laboratory maintenance, being readily cultivable, thus allowing researchers to study and manipulate each symbiont separately and in combination. Third, an entire tribe of ants culture fungi for food. Each lineage in the tribe tends specific fungal cultivars, which each host specialized mycoparasites in the genus Escovopsis (Ascomycota: Hypocreales). Escovopsis exploits the ant-fungal mutualism by extracting nutrients from the fungal mycelium at a significant cost to both the ants (indirectly) and fungi (directly) (Currie, 2001; Reynolds and Currie, 2004). The high prevalence of Escovopsis and early origin
in the ant-fungal symbiosis (Currie, 2001; Currie et al., 2003) suggests that it could help stabilize the ant-fungal mutualism over evolutionary time by aligning the selfish interests of the partners against the parasite.
Experimental Design and Overview
To empirically test the potential role Escovopsis plays in stabilizing cooperation between fungus-growing ants and their cultivated fungi, we investigated the interaction between the fungus garden parasite and cooperative and uncooperative (“cheating”) pairs of ants and fungi. The benefits gained by cheating could be diminished if there is a severe parasitic infection which results in increased costs to ants or fungi. In this instance, Escovopsis could help stabilize the ant-fungus mutualism, by selecting against cheaters. More specifically, if cheating by either mutualist results in increased morbidity due to the garden parasite, then the selective advantage of cheating would be reduced or potentially nullified. We examine this possibility by using a two-by-two factorial design, crossing the presence/absence of parasitism with the presence/absence of a cheating partner. Sub-colonies were randomly assigned to one of four treatments: i) no infection and no cheating, ii) no infection and cheating, iii) infection and no cheating or, iv) infection and cheating. “Ant-cheating” was simulated by altering the male to female ratio (worker castes are always female, while the only function of males is reproduction) in Trachymyrmex cf. zeteki sub-colonies. The ant-cheating treatment mimics ant colonies investing more energy into colony reproduction and less into workers that tend the garden. Consequently, there is less investment in colony/garden maintenance (by worker ants), and additional costs imposed on the fungus garden while males inhabit the nest. In separate Atta colombica sub-colonies, “fungus-cheating” was simulated by removing the specialized nutrient-rich hyphal swellings (gongylidia) produced by the cultivated fungus for the ants to feed on. Gongylidia benefit ants but they are not necessary for cultivar growth or survival (Bass and Cherrett, 1995), thus removing gongylidia simulates fungal cheating by decreasing the nutrient benefit the fungus provides the ants. Colony fitness following treatment was assessed by measuring fungal garden biomass fluctuations (note: number of ant workers within colonies and colony production of reproductives is highly correlated to fungus garden biomass) (Currie, 2001). The parasitism treatment involved infecting the ants’ fungus garden with the specialized parasite Escovopsis. Each treatment is described in detail below.
Sub-Colony Setup
Ten six-month-old queenright A. colombica colonies and 10 queenright T. cf. zeteki colonies with a single fungus chamber were collected in Gamboa, Panama. Sub-colonies of A. colombica were composed of 1.0 g of fungus garden and ~115 ants (consistent ratio of worker size and age castes, and brood), and were
maintained in plastic dual chambers (one housing the garden, and one for feeding, foraging, and dumping of refuse) connected by plastic tubes. Trachymyrmex cf. zeteki sub-colonies were composed of 0.1 g of fungal cultivar and four ants, and housed in plastic Petri dishes (60 mm diameter). Colonies were placed on mineral oil islands to prevent potential transfer of microbes between sub-colonies via vectors (e.g., mites), were given unrestricted access to foliage (A. colombica) or a mixture of dried oats and oak catkins (T. cf. zeteki), and watered three times a week. All sub-colonies used in the experiment were healthy, stable, incorporating new substrate into the fungus garden, and free of detectable Escovopsis infection (Currie et al., 1999).
Simulation of Cheating by Ants
To simulate cheating by the ants the sex ratio of T. cf. zeteki sub-colonies was altered; in cheater sub-colonies two females and two males were present, while four females and zero males were present in control sub-colonies. We use colonies of T. cf. zeteki to simulate cheating by the ants because this species regularly produces males in the laboratory (A. colombica do not). All worker ants are female, and female reproductives (gynes) are responsible for maternal vertical transmission of the fungal mutualist. Males are reared on the nutrients of the fungal mutualist and stay within the fungus garden prior to the nuptial flight however they do not contribute towards tending the fungus garden. Thus, male ants are a direct cost to the fungus garden; they provide no known benefit to the ant’s fungal mutualist, neither dispersing nor contributing to fungus garden maintenance (Mueller et al., 2001).
Simulation of Cheating Fungi
To simulate cheating by the fungal mutualist, 10% of A. colombica garden biomass (containing ~276 gongylidia clusters) and all gongylidia clusters on the top surface of the garden (~265 clusters per nest) were removed. Gongylidia removal was done by hand, using a dissecting scope (Accu-Scope, Sea Cliff, NY) and jewel-tip forceps (Bioquip, Rancho Dominguez, CA). Atta colombica was used to simulate cheating by the fungal mutualist because the cultivated fungus of this species produces large, tightly clustered, nutrient-rich hyphal swellings, called gongylidia. Worker ants preferentially feed on gongylidia and harvest them as nutrients to support the growth of larvae (Mueller et al., 2001; Quinlan and Cherrett, 1978). The production of gongylidia by the cultivated fungi provides no apparent benefit to the fungus, but instead serves as a food source that is more beneficial to the ants than the regular hyphae of the fungus (Bass and Cherrett, 1995; Quinlan nd Cherrett, 1978). Gongylidia do not directly benefit the fungus garden and they do not help defend the garden from Escovopsis (see below). While T. cf. zeteki fungi also produce gongylidia, they are smaller, less abundant
and fewer per cluster than those of A. colombica (A. Little pers. obs.). To achieve sufficient gongylidia removal and limit fungus garden destruction during sub-colony treatment preparation, it was necessary to use A. colombica, rather than T. cf. zeteki sub-colonies to mimic fungal cheating.
Infection of Sub-Colonies with Escovopsis
Escovopsis strains used in experiments were isolated in Gamboa, Panama from T. cf. zeteki and A. colombica colonies. Isolates were grown on potato dextrose agar (PDA) (Difco, Sparks, MD) with 1000 iu/ml of penicillin-streptomycin (MP Biomedicals Inc., Aurora, OH). Spores were added to ddH2O with Tween 20 [5 × 10⁻⁵] (Fisher Scientific, Pittsburgh, PA) to evenly disperse spores in solution. Trachymyrmex cf. zeteki and A. colombica colonies received 0.05 and 0.5 ml of solution, respectively (ca 6000 spores/T. cf. zeteki sub-colony, ca. 20000 spores/A. colombica sub-colony) via mist inoculation. Sub-colony biomass was measured prior to, and 72 hours after treatment. The relative changes in biomass/sub-colony/treatment were subjected to 2-way ANOVA in Minitab (2003). The success of the ants is directly dependent upon the health and biomass of the fungus gardens, therefore, as in other studies (Bot et al., 2001; Currie and Stuart, 2001), we use garden biomass as an indirect fitness indicator for the ant in the ant-cheating experiment.
Prisoner’s Dilemma Computer Simulation
Using the classic Prisoner’s Dilemma model (PD) (Axelrod and Hamilton, 1981), we further explore our empirical results that indicate parasites can play a role in stabilizing cooperation. In the PD two players interact, each has the ability to cooperate or cheat. Cooperation provides the opponent a benefit (b), while incurring a cost (c) to the player (b > c > 0). The highest payoff is received when a player cheats while its partner cooperates: the cheater benefits without paying the cost of cooperation (Temptation to cheat T = b). If both players cooperate each receives a net benefit (Reward) of R = b - c, while mutual cheating results in a Punishment payoff of P = 0. The lowest payoff is received by a player that cooperates while its opponent cheats (Suckers payoff S = -c). In single interactions, cheating is the best strategy (T > R > P > S). Our results from ant-fungal manipulations suggest that the presence of a parasite would alter the PD payoff matrix such that pure cooperation is the best strategy. More specifically, cheating by either ants or fungi results in an increased parasite impact, reducing the benefit of “temptation” to cheat (R > T = P > S). In addition, because cooperation by one player (i.e. ants) provides some degree of defense against parasitism (i.e. Escovopsis) further alters the payoff matrix to favor cooperation (R > T = P = S).
The Iterative Prisoner’s Dilemma Model (IPD), where players engage in multiple interactions, is much more relevant to natural system. Based on the
alteration of the payoff matrix of the single interaction PD model (see above), it is clear that if parasites impact every interaction in the IPD model they will help favor cooperation over cheating. However, it is very unlikely that parasites are so ubiquitous in natural populations that they influence every interaction. Thus, we utilized a computer program called DILEMMA to determine what level of parasite prevalence is required to potentially help stabilize cooperation within the IPD model [see Additional file 1].
Using DILEMMA, we explored the role of parasites in altering the dynamics within the IPD model by conducting simulations involving various combinations of strategies in the presence and absence of parasites. Simulations involved populations of 10,000 individuals, each individual engaged in 25 interactions per generation. Simulations were run for 500 generations, which we previously determined to be sufficient to obtain a stable proportion of strategies across generations. The average of 100 independent runs for each different simulation is presented. In the first simulation a 50:50 ratio of individuals playing “always defect” (uncooperative strategy), and “always cooperate,” (cooperation in every interaction) was used. Subsequently, simulations using the same 50:50 ratio with parasites present were run. Ten independent runs (500 generations each) were run with proportions of parasitism increasing by increments of 10%, and the means of the final frequencies of each strategy in the population were plotted by proportion of population infected with parasites. A second set of simulations was conducted, with three additional strategies (“tit for tat,” “sneaker,” and “random” [see Additional file 1]). All strategies started with a 20% frequency in the population. As above, this simulation was run in the absence of parasites for 500 generations, and then parasites were added with varying prevalence up to infection rates of 100%.
Results
Empirical Test of Hypothesis
In our experiments we found that infected sub-colonies with cheating populations of ants or fungi each lost significantly more garden biomass than sub-colonies subjected to infection or cheating (ants or fungi) alone (2-way ANOVA p < 0.001 df = 3, for both treatments) (Fig. A4-1). When a cheater is present, the cost of Escovopsis infection is substantially greater than it is in sub-colonies with only cooperative partners. This suggests that the negative consequences Escovopsis has on ant and fungal health could result in parasite-induced selection eliminating cheating by either mutualist. There are several reasons colonies with cheaters are likely to be less successful at fighting garden infection, than those with cooperative ants and fungi. Increased virulence of Escovopsis in the “cheating ant” treatment is likely because the enforced shift to a 50% male:worker ratio results in fewer worker ants present to defend the garden from infection (Currie and Stuart, 2001). In the“cheating-fungi” treatment, the mechanism(s) causing a
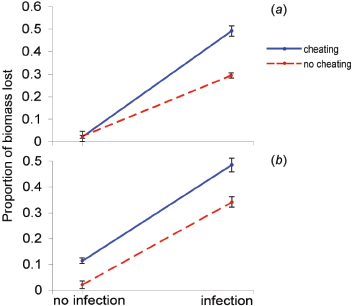
FIGURE A4-1 Cheating/infection experiments. Two-way interaction graph illustrating the impact of experimental infection and cheating ants or mutualistic fungi on the garden biomass in two types of fungus-growing ant colonies. A) Trachymyrmex cf.zeteki sub-colonies (n = 40), treated with crossing the presence/absence of fungus garden infection with the presence/absence of cheating ants, shows significantly higher loss of garden biomass when exposed to cheating and infection simultaneously than in all other treatments (2-way ANOVA p < 0.001 df = 3). B) Atta colombica sub-colonies (n = 80), crossing the presence absence of fungus garden infection with the presence/absence of cheating fungi, shows a significantly greater loss in garden biomass when cheating and infection are experienced simultaneously than in all other treatments (2-way ANOVA p < 0.001 df = 3). Non-parallel lines shown in ‘A’ and ‘B’ illustrate significance (2-way ANOVA analyses) of the interaction between infection and cheating treatments.
greater impact of infection is less clear. The high concentration of nutrients found in gongylidia may be a necessary energy source for worker ants that remove parasitic spores. The ants may also retaliate against fungal cheaters by allocating less effort into garden maintenance, which would result in greater garden biomass loss during infection.
Prisoner’s Dilemma Simulations
In the classic model, when one partner always cooperates and the other always cheats, the cheater population quickly out-competes the cooperator population (Fig. A4-2a). In contrast, parasite infection rates of 51% or higher results in the strategy “always cooperate” being successful and stable (Fig. A4-2b). In the
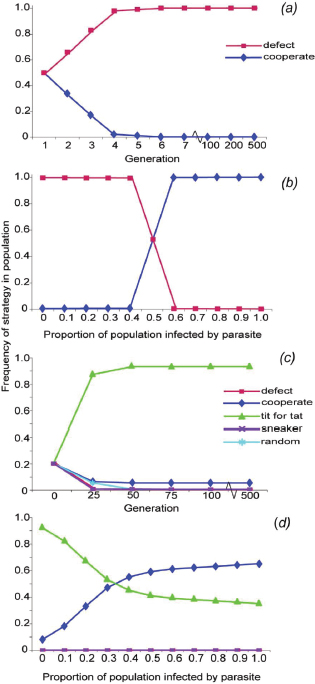
FIGURE A4-2 Prisoner’s Dilemma simulations. Graphical output from DILEMMA, a computer program simulating the Iterated Prisoner’s Dilemma (IPD) with the ability to incorporate parasites into the classic model to determine how prevalent parasite would need to be within populations to help favour cooperation over cheating. A) In the traditional IPD, the strategy “always defect” quickly eliminates the purely cooperative strategy“always cooperate” from the population. B) When parasitism is introduced into the population, “always cooperate” becomes a dominant strategy when infection rates are greater than 50% in the population. C) Strategies that combine cooperation with retaliation, such as “tit for tat,” are successful in a heterogeneous population of strategies in the IPD (strategies defined in Supplementary Table 2). D) In the presence of parasites, “always cooperate” becomes a viable and dominant strategy in a heterogeneous population at parasitism levels as low as 35%. Output was generated using populations of 10,000 individuals, which engaged in 25 interactions per generation, for 500 generations. Each graph depicts the mean of 100 independent runs of the DILEMMA program. Standard error (SE) bars are not shown because values are less than 4.92 × 10⁻³, with the exception of the data points at 0.5 parasitism (b), which have SEs of 0.479.
classic model cooperation is successful and stable if cooperative strategies can retaliate against cheating, such as the well-known IPD strategy “tit for tat” (TFT, Fig. A4-2c). In our DILEMMA simulations, when cooperative strategies capable of retaliation against cheaters (i.e., TFT) are included, the strategy “always cooperate” forms a stable population at infection levels of 10%, and out-competes TFT when infection levels are greater than 35% (Fig. A4-2d). These simulations support our empirical results by indicating that when parasites are common, cooperation is stable as the benefits gained by cheating are outweighed by the increased cost of infection.
Discussion
Despite the important role mutually beneficial associations play in shaping all levels of biological organization, how these relationships establish and maintain stability is not well understood. The challenge is elucidating the factor(s) that prevent selection from favoring partners who pursue their own selfish interests, cheaters who obtain benefits without providing rewards in return. Most theories proposed to help explain the evolutionary stability of mutualism argue that cooperation is stabilized by individuals employing mechanisms to avoid being exploited by their partners (e.g., host sanctions, partner choice) (Bull and Rice, 1991; Kiers et al., 2003). In contrast to this typical view that partners enforce reciprocity within beneficial exchanges, here we suggest, and provide empirical and theoretic evidence for, the possibility that an external force, such as parasitism, can help stabilize cooperation by aligning the selfish interests of partners.
One way parasites may help stabilize mutualisms is if “cheating” by one partner results in greater parasite-induced morbidity or mortality in one or both partners, resulting in a net loss to the “cheater” (i.e., the benefits obtained from “cheating” are diminished by the increased costs from more severe infection by the parasite). Indeed, here we found, using the fungus-growing ant mutualism as a model system, that cheaters can suffer disproportionately more in the presence of a parasite than their non-cheater counterparts. More specifically, enforced cheating by either the ants or their fungal partner had little to no negative impact on the health of the fungus garden, which both mutualists obligately depend on. In the presence of the garden parasite, cheating by either mutualist resulted in significantly higher parasite induced garden morbidity, as compared to controls involving garden infections with cooperative mutualist partners. Thus, our empirical results indicate that the increased impact of parasitism in the presence of cheating can reduce the inherent conflict (Herre et al., 1999; Mueller, 2002; Poulsen and Boomsma, 2005) between mutualists (Fig. A4-3), potentially contributing to the stability of the beneficial association.
Escovopsis can be extremely prevalent, infecting more than 75% of colonies of fungus-growing ant nests in some populations, and is known to be virulent (Currie et al, 1999; Currie, 2001). Thus, we believe our results indicate
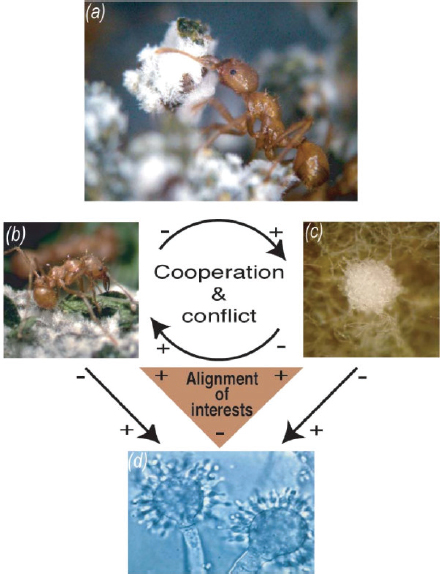
FIGURE A4-3 Cooperation and conflict within the fungus-growing ant microbe symbiosis. A) Fungus-growing ants forage for substrate to nourish their cultivated fungus, which they also groom to help remove garden parasites. B) In return, the fungus serves as the primary food source for the ants; with some species producing nutrient-rich hyphal swellings (gongylidia) that the ants preferentially feed on. Cooperation and conflict is inherent to the ant-fungus mutualism (black arrows, head points toward recipient of benefit), with each symbiont receiving a benefit (+), at a cost to the other (-). Natural selection favors symbionts that increase their own fitness selfishly by exploiting their partner, receiving a benefit (+) without paying the cost (-) associated with providing a benefit in return. C) The mutualism is parasitized by specialized fungi in the genus Escovopsis, which acquire nutrients from the fungus garden at a direct and indirect cost to the cultivated fungus and ants, respectively. Cooperation is enforced, and cheaters minimized, because the selfish interests of both ants and cultivated fungus are aligned (orange triangle) against the parasite Escovopsis.
that cheating by either ants or fungi could be rapidly eliminated within natural populations by previously established infections or by new infections of the horizontally transmitted parasite. The alignment of interests between the ants and their cultivated fungi, in opposition to the garden parasite, is further illustrated by the contribution the ants make to cultivar defense. Specifically, the ants employ specialized behaviors to physically remove parasitic inoculum from the fungus garden (Currie and Stuart, 2001). Without ant behavioral defenses, the garden is rapidly overgrown by the parasite (Currie et al., 1999), indicating that defense against Escovopsis requires cooperation between ants and their fungal mutualists. The early origin of Escovopsis within the symbiosis and its coevolutionary history with the ants and their fungal cultivar (Currie et al., 2003), suggests that the parasite may have been a stabilizing force within the ant-fungal mutualism for millions of years.
Our view of the stability of cooperation has largely developed out of game theory, especially the PD model (Axelrod and Hamilton, 1981). In the classic single interaction model, cheating is always favored over cooperation (T > R > P > S, see methods above and Fig. A4-2a). However, when the model involves multiple interactions among players (IPD), strategies that are cooperative but capable of retaliating against cheating can out-compete cheating strategies (e.g., the well-known TFT). As outlined above, our empirical results indicate that a parasite has the potential to alter the payoff matrix so that cooperation is favored over cheating in the single interaction PD model. This illustrates the potential for third parties to alter the dynamics of cooperation in ways that shape mutualism stability. Our simulations revealed that even at relatively low prevalence parasitism can select for stability of a cooperative strategy that is incapable of retaliating against cheating. Specifically, “always cooperative” out-competes “always defect” when 51% of interacting partners in a population are infected, which is well within the known infection rates in the fungus-growing ant mutualism. When TFT was integrated into the simulation, surprisingly, we found that “always cooperative” forms a stable population at infection levels of 10%, and out-competes TFT when parasite prevalence is greater than 35%. These findings provide theoretical support to our empirical results from the fungus-growing ant mutualism, further suggesting that parasites can provide an external sanction against one partner’s cheating, or simply alter the costs and benefits received from cooperation versus cheating in such a way that natural selection favors cooperation.
We believe our findings are applicable beyond the fungus-growing ant microbe-symbiosis. Mutualisms in which survival and reproduction are tightly linked to cooperation are especially likely to be stabilized by antagonists, as morbidity and mortality in one partner is expected to have a significant cost to the other; this is complimentary to partner fidelity feedback (Bull and Rice, 1991). Protective mutualisms, in which one partner defends the other from a natural enemy, are common in nature. Just as fungus-growing ants protect their mutualistic fungi from parasites, there are ants that protect plants from herbivores (Huxley et al., 1991), bacteria that protect their insect hosts from disease (Oliver et al.,
2005), and endophytic fungi that protect their plant hosts from herbivores via secondary metabolite production (Tanaka et al., 2005). Our results support the prediction that in these interactions it is likely that when the threat imposed by a tertiary symbiont (i.e. predator, parasite) is absent, the protective mutualism may break down. Indeed, a recent paper by Palmer et al. (2008) revealed the breakdown of an ant-plant mutualism in the absence of large-herbivores. Furthermore, the contribution symbionts make to protect their hosts, which appear to be widespread (see Haine [2008]) may be evidence of parasites aligning the interests of mutualists.
Conclusion
Cooperative relationships that occur in natural systems persist in complex ecological communities where interspecific interactions are continuous. In some instances one, or a combination, of the models included in the Sachs et al. framework of directed reciprocation, shared genes, and by-product benefits, adequately explains stable cooperation among organisms. However, our results suggest that a third species eliciting selective pressure on one member of a mutualism can limit cheating by a mechanism that does not neatly fit the current framework. Cooperative dynamics in which two partners have their selfish interests aligned in opposition to a third (parasitic) party, can provide a stabilizing force that helps maintain cooperation between species, that is neither a by-product (e.g. coincident of a selfish action), nor directed reciprocation. Additionally, it is important to be clear that parasitism need not be a mutually exclusive factor stabilizing cooperation. It is possible, and perhaps likely, that parasite pressure works in concert with other well-defined mechanisms that promote cooperation. It would be interesting to empirically test how the addition of a third parasitic species influences cooperative interactions that are believed to be governed by reciprocation, by-product benefits or shared genes.
Author’s Contributions
AL and CC conceived and designed the experiments. AL performed the experiments and analyzed the data. AL and CC wrote the paper and approved the final manuscript.
Acknowledgements
We are grateful to STRI and ANAM of the Republic of Panama for facilitating the research and granting collecting permits. For valuable logistical support we thank: M. Bergsbaken, M. Cafaro, S. Covington, P. Foley, S. Ingram, M. Le-one, H. Reynolds, and M. Tourtellot. We are thankful to K. Boomsma, J. Bull, E. Caldera, N. Gerardo, K. Grubbs, H. Goodrich-Blair, S. Hoover, J. Kelly, A. Pinto, M. Poulsen, G. Roberts, R. Steffensen, and S. West for invaluable comments on
this study and/or paper. This work was supported by NSF IRCEB grant DEB-0110073 to CRC, NSF CAREER grant DEB-747002 to CRC, and NSF Doctoral Dissertation Improvement Grant DEB-0608078 to CRC and AEFL.
Additional Material
Additional file 1
Dilemma information
Available at: http://www.biomedcentral.com/content/supplementary/1471-21489-124-S1.doc
References
Aanen DK, Eggleton P, Rouland-Lefevre C, Guldberg-Froslev T, Rosendahl S, Boomsma JJ: The evolution of fungus-growing termites and their mutualistic fungal symbionts. Proc Natl Acad Sci USA 2002, 99(23):14887-14892.
Agrawal AA, Fordyce JA: Induced indirect defence in a lycaenidant association: the regulation of a resource in a mutualism. P Roy Soc Lond B Bio 2000, 267(1455):1857-1861.
Althoff DM, Segraves KA, Sparks JP: Characterizing the interaction between the bogus yucca moth and yuccas: do bogus yucca moths impact yucca reproductive success? Oecologia 2004, 140(2):321-327.
Axelrod R, Hamilton WD: The Evolution of Cooperation. Science 1981, 211(4489):1390-1396.
Bass M, Cherrett JM: Fungal Hyphae as a Source of Nutrients for the Leaf-Cutting Ant Atta Sexdens. Physiological Entomology 1995, 20(1):1-6.
Bergstrom CT, Bronstein JL, Bshary R, Connor RC, Daly M, Frank SA, Gintis H, Keller L, Leimar O, Noe R, et al.: Interspecific mutualism. In Genetic and cultural evolution of cooperation. vol. Workshop Report 90 Edited by: Hammerstein P. Cambridge: MIT Press; 2003:242-256.
Bot ANM, Rehner SA, Boomsma JJ: Partial incompatibility between ants and symbiotic fungi in two sympatric species of Acromyrmex leaf-cutting ants. Evolution 2001, 55(10):1980-1991.
Bronstein JL: The exploitation of mutualisms. Ecol Lett 2001, 4(3):277-287.
Bronstein JL, Barbosa P: Multitrophic/multispecies mutualistic interactions: the role of non-mutualists in shaping and mediating mutualisms. In Multitrophic level interactions Edited by: Tscharntke T, Hawkins BA. Cambridge; New York: Cambridge University Press; 2002:44-66.
Bull JJ, Rice WR: Distinguishing mechanisms for the evolution of cooperation. J Theo Biol 1991, 149(1):63-74.
Chapela IH, Rehner SA, Schultz TR, Mueller UG: Evolutionary history of the symbiosis between fungus-growing ants and their fungi. Science 1994, 266(5191):1691-1694.
Currie CR: Prevalence and impact of a virulent parasite on a tripartite mutualism. Oecologia 2001, 128(1):99-106.
Currie CR, Mueller UG, Malloch D: The agricultural pathology of ant fungus gardens. Proc Natl Acad Sci USA 1999, 96(14):7998-8002.
Currie CR, Poulsen M, Mendenhall J, Boomsma JJ, Billen J: Coevolved crypts and exocrine glands support mutualistic bacteria in fungus-growing ants. Science 2006, 311(5757):81-83.
Currie CR, Scott JA, Summerbell RC, Malloch D: Fungus-growing ants use antibiotic-producing bacteria to control garden parasites. Nature 1999, 398(6729):701-704.
Currie CR, Stuart AE: Weeding and grooming of pathogens in agriculture by ants. Proc Roy Soc Lond B Bio 2001, 268(1471):1033-1039.
Currie CR, Wong B, Stuart AE, Schultz TR, Rehner SA, Mueller UG, Sung GH, Spatafora JW, Straus NA: Ancient tripartite coevolution in the attine ant-microbe symbiosis. Science 2003, 299(5605):386-388.
Doebeli M, Hauert C: Models of cooperation based on the Prisoner’s Dilemma and the Snowdrift game. Ecol Lett 2005, 8(7):748-766.
Dugatkin LA: Cooperation among animals: an evolutionary perspective. New York: Oxford University Press; 1997.
Fischer MK, Shingleton AW: Host plant and ants influence the honeydew sugar composition of aphids. Funct Ecol 2001, 15(4):544-550.
Haine ER: Symbiont mediated protection. Proc Roy Soc Lond B Bio2008, 275:353-361. Hamilton WD: The genetical theory of social behaviour I, II. J Theo Biol 1964, 7:1-52.
Herre EA, Knowlton N, Mueller UG, Rehner SA: The evolution of mutualisms: exploring the paths between conflict and cooperation. Trends Ecol Evol 1999, 14(2):49-53.
Huxley CR, Cutler DF, Linnean Society of London., University of Oxford. Dept. of Zoology., University of Oxford. Dept. of Plant Sciences: Ant-plant interactions. Oxford; New York: Oxford University Press; 1991.
Irwin RE: The consequences of direct versus indirect species interactions to selection on traits: Pollination and nectar robbing in Ipomopsis aggregata. Am Nat 2006, 167(3):315-328.
Kiers ET, Rousseau RA, West SA, Denison RF: Host sanctions and the legume-rhizobium mutualism. Nature 2003, 425(6953):78-81.
Lee SC, Muncaster RG, Zinnes DA: The friend of my enemy is my enemy: modeling triadic interaction relationships. Synthese 1994, 100:333-358.
Little AEF, Currie CR: Black yeast symbionts compromise the efficiency of antibiotic defenses in fungus-growing ants. Ecology 2008, 89(5):1216-1222.
Little AEF, Murakami T, Mueller UG, Currie CR: Defending against parasites: fungus-growing ants combine specialized behaviours and microbial symbionts to protect their fungus gardens. Biol Lett 2006, 2:12-16.
Minitab statistical software. 14th edition. USA: Minitab Inc; 2003.
Morales Ma: Survivorship of an ant-tended membracid as a function of ant recruitment. Oikos 2000, 90(3):469-476.
Morris WF, Bronstein JL, Wilson WG: Three-way coexistence in obligate mutualist-exploiter interactions: The potential role of competition. Am Nat 2003, 161(6):860-875.
Mueller UG: Ant versus fungus versus mutualism: Ant-cultivar conflict and the deconstruction of the attine ant-fungus symbiosis. Am Nat 2002, 160:S67-S98. 47. Poulsen M, Boomsma JJ: Mutualistic fungi control crop diversity in fungus-growing ants. Science 2005, 307(5710):741-744.
Mueller UG, Schultz TR, Currie CR, Adams RMM, Malloch D: The origin of the attine ant-fungus mutualism. Quart Rev Biol 2001, 76(2):169-197.
Munkacsi AB, Pan JJ, Villesen P, Mueller UG, Blackwell M, McLaughlin DJ: Convergent coevolution in the domestication of coral mushrooms by fungus-growing ants. Proc Roy Soc Lond B Bio 2004, 271(1550):1777-1782.
Nowak MA, Sigmund K: Evolutionary dynamics of biological games. Science 2004, 303(5659):793-799.
Oliver KM, Moran NA, Hunter MS: Variation in resistance to parasitism in aphids is due to symbionts not host genotype. Proc Natl Acad Sci USA 2005, 102(36):12795-12800.
Palmer TM, Stanton ML, Young TP, Goheen JR, Pringle RM, Karban R: Breakdown of an ant-plant mutualism follows the loss of large herbivores from an African savanna. Science 2008, 319(192–195):192-195.
Pellmyr O, Huth CJ: Evolutionary stability of mutualism between yuccas and yucca moths. Nature 1994, 372(6503):257-260.
Quinlan RJ, Cherrett JM: Aspects of Symbiosis of Leaf-Cutting Ant Acromyrmex-Octospinosus (Reich) and Its Food Fungus. Ecological Entomology 1978, 3(3):221-230.
Quinlan RJ, Cherrett JM: Role of Fungus in the Diet of the Leaf-Cutting Ant Atta-Cephalotes (L). Ecological Entomology 1979, 4(2):151-160.
Reynolds HT, Currie CR: Pathogenicity of Escovopsis weberi: The parasite of the attine ant-microbe symbiosis directly consumes the ant-cultivated fungus. Mycologia 2004, 96(5):955-959.
Sachs JL, Mueller UG, Wilcox TP, Bull JJ: The evolution of cooperation. Quart Rev Biol 2004, 79(2):135-160.
Schultz TR, Brady SG: Major evolutionary transitions in ant agriculture. Proc Natl Acad Sci USA 2008, 105:5435-5440.
Segraves KA, Althoff DM, Pellmyr O: Limiting cheaters in mutualism: evidence from hybridization between mutualist and cheater yucca moths. P Roy Soc B-Biol Sci 2005, 272(1577):2195-2201.
Siepielski AM, Benkman CW: Selection by a predispersal seed predator constrains the evolution of avian seed dispersal in pines. Funct Ecol 2007, 21(3):611-618.
Stanton ML: Interacting guilds: moving beyond the pairwise perspective on mutualisms. Am Nat 2003, 162:S10-S23.
Strauss SY, Irwin RE, Lambrix VM: Optimal defence theory and flower petal colour predict variation in the secondary chemistry of wild radish. J Ecol 2004, 92(1):132-141.
Tanaka A, Tapper BA, Popay A, Parker EJ, Scott B: A symbiosis expressed non-ribosomal peptide synthetase from a mutualistic fungal endophyte of perennial ryegrass confers protection to the symbiotum from insect herbivory. Mol Microbiol 2005, 57(4):1036-1050.
Weber NA: Gardening Ants: The Attines. Philadelphia: American Philosophical Society; 1972.
METAGENOMIC AND METAPROTEOMIC INSIGHTS INTO BACTERIAL COMMUNITITES IN LEAF-CUTTER ANT FUNGUS GARDENS19
Frank O. Aylward20,21Kristin E. Burnum,22Jarrod J. Scott20,21,23Garret Suen,21Susannah G. Tringe,24Sandra M. Adams,21Kerrie W. Barry,24Carrie D. Nicora,22Paul D. Piehowski,22Samuel O. Purvine,22Gabriel J. Starrett,21Lynne A. Goodwin,24Richard D. Smith,22Mary S. Lipton,22 and Cameron R. Currie20,21,23
___________
19 Reprinted with kind permission from Nature Publishing Group.
20 Department of Bacteriology, University of Wisconsin-Madison, Madison, WI, USA.
21 Department of Energy Great Lakes Bioenergy Research Center, University of Wisconsin-Madison, Madison, WI, USA.
22 Biological Sciences Division, Pacific Northwest National Laboratory, Richland, WA, USA.
23 Smithsonian Tropical Research Institute, Balboa, Ancon, Panama.
24 Department of Energy Joint Genome Institute, Walnut Creek, CA, USA.
The ISME Journal advance online publication, 1 March 2012; doi:10.1038/ismej.2012.10
Subject Category: Integrated genomics and post-genomics approaches in microbial ecology
Keywords: leaf-cutter ants; symbiosis; Leucoagaricus gongylophorus; microbial consortia; Atta
Correspondence: CR Currie, Department of Bacteriology, University of Wisconsin-Madison, 6155 Microbial Sciences Building, 1550 Linden Drive, Madison, WI 53706, USA.
E-mail: currie@bact.wisc.edu
Received 9 August 2011; revised 12 December 2011; accepted 21 January 2012.
Herbivores gain access to nutrients stored in plant biomass largely by harnessing the metabolic activities of microbes. Leaf-cutter ants of the genus Atta are a hallmark example; these dominant neotropical herbivores cultivate symbiotic fungus gardens on large quantities of fresh plant forage. As the external digestive system of the ants, fungus gardens facilitate the production and sustenance of millions of workers. Using metagenomic and metaproteomic techniques, we characterize the bacterial diversity and physiological potential of fungus gardens from two species of Atta. Our analysis of over 1.2Gbp of community metagenomic sequence and three 16S pyrotag libraries reveals that in addition to harboring the dominant fungal crop, these ecosystems contain abundant populations of Enterobacteriaceae, including the genera Enterobacter, Pantoea, Klebsiella, Citrobacter and Escherichia. We show that these bacterial communities possess genes associated with lignocellulose degradation and diverse biosynthetic pathways, suggesting that they play a role in nutrient cycling by converting the nitrogen-poor forage of the ants into B-vitamins, amino acids and other cellular components. Our metaproteomic analysis confirms that bacterial glycosyl hydrolases and proteins with putative biosynthetic functions are produced in both field-collected and laboratory-reared colonies. These results are consistent with the hypothesis that fungus gardens are specialized fungus–bacteria communities that convert plant material into energy for their ant hosts. Together with recent investigations into the microbial symbionts of vertebrates, our work underscores the importance of microbial communities in the ecology and evolution of herbivorous metazoans.
Introduction
Ants are critical components of terrestrial ecosystems around the world (Hölldobler and Wilson, 1990). Among ants, leaf-cutters in the genus Atta (Figure A5-1a) are particularly dominant, with mature colonies achieving immense sizes and housing millions of workers (Hölldobler and Wilson, 2008, 2010). Ranging from the southern United States to Argentina, species of leaf-cutter ants can construct elaborate subterranean nests containing hundreds of chambers and displacing up to 40 000 kg of soil (Hölldobler and Wilson, 2010). The ant societies housed within these nests are equally impressive, with an intricate division of labor observed between different castes of workers (Hölldobler and Wilson, 2010). Associated with this division of labor is substantial worker-size polymorphism: the dry weight of individual workers in the same colony can differ by 200-fold (Hölldobler and Wilson, 2010). The success of leaf-cutter ants is largely attributed to their obligate mutualism with a basidiomycetous fungus (Leucoagaricus gongylophorus) that they culture for food in specialized gardens (Figure A5-1b) (Weber, 1966; Hölldobler and Wilson, 2008, 2010). Fresh plant forage collected by the ants serves to nourish the fungus, which in turn is thought to have originated 8–12 million years ago, and numerous adaptations in both the
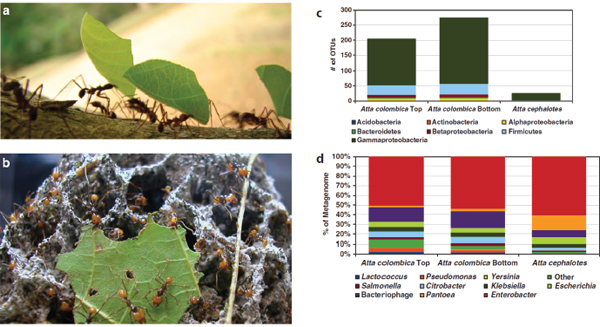
FIGURE A5-1 Leaf cutter ants forage on plant material (a) that they use as manure for specialized fungus gardens (b). Pyrosequencing of bacterial 16S genes from fungus gardens of the leaf-cutter ants A. colombica and A. cephalotes recovered 8000–12000 sequences representing 25–274 OTUs (OTUs, 97% identity cutoff) (c). Microbial community composition was then investigated by directly pyrosequencing 382–441 Mbp of DNA from the same leaf-cutter ant fungus gardens and using the Genome Abundance and Average Size tool to estimate the relative abundance of different microbial groups (d) (photo credits: a, Jarrod J Scott; b, Austin D Lynch).
ants and the fungus have occurred over this long history of agriculture (Weber, 1966; Chapela et al., 1994; Schultz and Brady, 2008).
The fresh-foliar biomass leaf-cutter ants integrate into their fungus gardens is composed largely of recalcitrant lignocellulosic polymers. The ants presumably gain indirect access to the carbon stored in plant cell walls through the metabolic activities of their fungus gardens, which act as an ancillary digestive system (Pinto-Tomas et al., 2009). Despite being a critical aspect of leaf-cutter ant biology, the process through which fungus gardens degrade plant forage has only recently been intensely investigated (De Fine Licht et al., 2010; Schiott et al., 2010; Suen et al., 2010; Semenova et al., 2011). Originally it was thought that the fungal cultivar primarily degraded cellulose, and that this was the main polymer converted into nutrients for the ants (Martin and Weber, 1969). However, the cellulolytic capacity of this fungus has come into question, as it has been shown that pure cultures cannot grow on cellulose as a sole carbon source (Abril and Bucher, 2002). This has led to the suggestion that cellulose is not deconstructed in leaf-cutter ant fungus gardens, but rather that the fungal cultivar uses a variety of hemicellulases to deconstruct primarily starch, xylan and other plant polymers (Gomes De Siqueira et al., 1998; Silva et al., 2006a,b; Schiott et al., 2008).
Another model posits that plant cell wall degradation in fungus gardens is partially mediated by lignocellulolytic bacteria. There is some support for this model. Importantly, recent work has found evidence for substantial cellulose deconstruction in the fungus gardens of Atta colombica and the presence of lignocellulolytic bacteria in these ecosystems (Suen et al., 2010). Another study, employing the culture-independent analysis of membrane-lipid markers, has supported the hypothesis that a distinct community of predominantly Gram-negative bacteria resides in fungus gardens (Scott et al., 2010), and the presence of symbiotic nitrogen-fixing bacteria in the genera Pantoea and Klebsiella has also been shown (Pinto-Tomas et al., 2009). Together with culture-dependent investigations recovering microbial groups with a broad array of metabolic activities (Bacci et al., 1995; Santos et al., 2004), these experiments have led to the suggestion that fungus gardens represent specialized fungus–bacteria consortia selected for by the ants, and that the bacteria have essential roles, including plant biomass degradation, nutrient biosynthesis, and competitive or antibiotic-mediated exclusion of pathogens (Mueller et al., 2005; Haeder et al., 2009; Pinto-Tomas et al., 2009; Suen et al., 2010).
Using a combination of metagenomics and metaproteomics, we provide insights into the microbial activities in leaf-cutter ant fungus gardens. Culture independent investigations have previously been performed on leaf-cutter ant fungus gardens (Scott et al., 2010; Suen et al., 2010), but to date only a small quantity of bacterial sequences (~6 Mb) from the fungus gardens of a single ant species have been characterized. Here, by expanding on previous work, we sought to document the non-eukaryotic component of fungus gardens, describe the similarity of communities from different ant species and examine potential microbial activities in
situ. To this end, we generated three 16S pyrotag libraries of over 8,000 sequences each and over 1.2 Gbp of raw 454 Titanium community metagenomic data from the bacterial component of A. cephalotes and A. colombica fungus gardens. To account for potential differences in microbial communities due to the extent of plant biomass degradation, we individually examined the top and bottom strata of A. colombica fungus gardens, which correspond to where the ants integrate fresh forage and remove partially degraded plant substrate, respectively. We then conducted metaproteomic analyses on whole fungus gardens to identify proteins produced in these ecosystems and examine the physiology of resident bacteria in more detail. We found that similar bacterial communities inhabit all fungus garden samples analyzed, and that the metabolic potential of resident bacteria includes nutrient biosynthesis, hemicellulose and oligosaccharide degradation, and other functions that potentially enhance plant biomass processing in these ecosystems. Below we discuss a novel framework for understanding the complex interplay between leafcutter ants and the symbiotic communities residing in their fungus gardens.
Materials and Methods
Sample Processing for Community Metagenomes and 16S Pyrotag Libraries
Fungus gardens from healthy A. cephalotes and A. colombica colonies were collected from nests near Gamboa, Panama, in April 2009. Whole A. cephalotes gardens were combined for subsequent analyses, whereas fungus gardens of A. colombica were laterally bisected to separate the top and bottom strata. Immediately after collection, the bacterial fraction of the samples was isolated and DNA was extracted as previously described (Suen et al., 2010). Briefly, plant, ant and fungal material were removed from all samples through a series of washing or centrifugation steps using 1×PBS (137mM NaCl, 2.7mM KCl, 10mM Na2HPO4, 2mM KH2PO4). DNA was subsequently extracted from the remaining bacterial fraction using a Qiagen DNeasy Plant Maxi Kit (Qiagen Sciences, Germantown, MD, USA). One community metagenome and one 16S library were generated from each of the three samples using 454 Titanium-pyrosequencing technology (Margulies et al., 2005). Draft genomes of three bacteria isolated from Atta fungus gardens were also generated to supplement the reference databases used for the phylogenetic binning of metagenomic data. Technical details for the sequencing, assembly, and annotation of all data can be found in the Supplementary Information.
Metaproteomics
Metaproteomic analysis was conducted on fungus garden material collected in Gamboa, Panama, from a nest of A. colombica distinct from that used for
metagenomic analyses. Moreover, we also conducted metaproteomic analyses on a lab-reared colony of A. sexdens for comparison. Detailed methods can be found in Supplementary Information. Briefly, proteins were extracted from whole fungus-garden material, and the resulting protein solution was digested into peptides and subsequently analyzed by liquid chromatography tandem mass spectrometry (LC-MS/MS). The resulting peptide tandem mass spectra were compared with predicted protein datasets of the three community metagenomes individually. Peptide matches were filtered using Sequest (Eng et al., 1994) scores, MSGF spectral probabilities (Kim et al., 2008), and false discovery rates. We restricted our functional analyses to peptides mapped to proteins phylogenetically binned as bacterial, and the IMG-ER and KEGG annotations of these proteins were inspected to identify those potentially involved in biomass degradation or nutrient cycling (Table A5-5). Peptides mapping to these select proteins were inspected manually (Figure A5-5, Supplementary Dataset 6).
Results
Community metagenomes and 16S pyrotag libraries Pyrosequencing of the V6–V8 variable region of the bacterial 16S rRNA gene for the same three samples yielded between 8000–12,000 reads (termed “pyrotags”) each (Table A5-2). Previous attempts to recover Archaeal 16S sequences from fungus gardens were unsuccessful (Suen et al., 2010), and amplification of these genes was not attempted here. Pyrosequencing of community DNA from three samples, representing both the individual top and bottom strata of A. colombica fungus gardens as well as the combined strata of A. cephalotes gardens, each yielded 382–441Mb of raw sequence data (Table A5-1). Reads from each library were assembled into community metagenomes comprising 40–100 Mbp of sequence data.
Microbial Diversity in Fungus Gardens
Clustering of sequences in the 16S pyrotag libraries from the A. colombica top, A. colombica bottom and A. cephalotes fungus-garden samples recovered
TABLE A5-1 Sequencing Statistics of the Community Metagenomes
| Ant species | A. colombica top | A. colombica bottom | A. cephalotes | |
| Number of trimmed reads | 998 047 | 862 246 | 1 068 791 | |
| Amount of raw sequence (Mbp) | 441.2 | 382.1 | 431.0 | |
| Number of contigs | 28 034 | 21 203 | 17 914 | |
| Largest contig (kbp) | 359.8 | 361.9 | 168.3 | |
| N50 contig size (kbp) | 1.8 | 1.8 | 4.7 | |
| Number of singleton reads | 188 523 | 161 267 | 55 949 | |
| Protein coding genes | 240 966 | 199 019 | 73 881 | |
| Size of assembled data (Mbp) | 100.9 | 83.2 | 40.6 | |
| Family | A. colombica top | A. colombica bottom | A. cephalotes | ||||||
| OTUs | Clones OTUs (%) | OTUs | Clones | OTUs (%) | OTUs | Clones | OTUs (%) | ||
| Acetobacteraceae | 1 | 3 0.49 | 2 | 36 | 0.73 | 1 | 2 | 4.00 | |
| Aeromonadaceae | 5 | 13 2.45 | 0 | 0 | 0.00 | 0 | 0 | 0.00 | |
| Alcaligenaceae | 1 | 7 0.49 | 2 | 3 | 0.73 | 0 | 0 | 0.00 | |
| Aurantimonadaceae | 0 | 0 0.00 | 0 | 0 | 0.00 | 0 | 0 | 0.00 | |
| Bacillaceae | 5 | 45 2.45 | 8 | 156 | 2.92 | 1 | 5 | 4.00 | |
| Carnobacteriaceae | 3 | 197 1.47 | 6 | 273 | 2.19 | 1 | 2 | 4.00 | |
| Clostridiaceae | 3 | 3 1.47 | 1 | 1 | 0.36 | 0 | 0 | 0.00 | |
| Comamonadaceae | 7 | 474 3.43 | 5 | 296 | 1.82 | 0 | 0 | 0.00 | |
| Enterobacteriaceae | 129 | 6502 63.24 | 202 | 10 706 | 73.72 | 19 | 10 496 | 76.00 | |
| Enterococcaceae | 5 | 66 2.45 | 0 | 0 | 0.00 | 0 | 0 | 0.00 | |
| Flavobacteriaceae | 3 | 33 1.47 | 2 | 21 | 0.73 | 0 | 0 | 0.00 | |
| Moraxellaceae | 3 | 167 1.47 | 2 | 64 | 0.73 | 1 | 2 | 4.00 | |
| Paenibacillaceae | 2 | 15 0.98 | 3 | 3 | 1.09 | 0 | 0 | 0.00 | |
| Pseudomonadaceae | 10 | 335 4.90 | 9 | 345 | 3.28 | 1 | 3 | 4.00 | |
| Ruminococcaceae | 3 | 7 1.47 | 4 | 14 | 1.46 | 0 | 0 | 0.00 | |
| Sphingomonadaceae | 3 | 11 1.47 | 2 | 4 | 0.73 | 0 | 0 | 0.00 | |
| Staphylococcaceae | 4 | 13 1.96 | 4 | 6 | 1.46 | 0 | 0 | 0.00 | |
| Veillonellaceae | 0 | 0 0.00 | 4 | 96 | 1.46 | 0 | 0 | 0.00 | |
| Xanthomonadaceae | 4 | 134 1.96 | 2 | 60 | 0.73 | 1 | 1 | 4.00 | |
| Other | 13 | 163 6.00 | 16 | 86 | 6.00 | 0 | 0 | 0.00 | |
| Total | 204 | 8188 100 | 274 | 12 170 | 100 | 25 | 10 511 | 100 | |
204, 274 and 25 operational taxonomic units (OTUs, 97% identity cutoff), respectively. The majority of the OTUs were most similar to sequences of Gammaproteobacteria and Firmicutes (22–217 OTUs, 72–89% of OTUs, and 2–35 OTUs, 5–12% of OTUs, respectively), and only OTUs corresponding to those phyla were represented in all three samples (Figure A5-1c). Phyla represented in lower abundance and more sporadically included the Betaproteobacteria (≤10 OTUs, ≤4.9% of OTUs), Alphaproteobacteria (≤7 OTUs, ≤3.4% of OTUs), Bacteriodetes (≤4 OTUs, ≤2% of OTUs), Acidobacteria (≤1 OTU, ≤1% of OTUs) and Actinobacteria (≤1 OTU, ≤4% of OTUs) (Figure A5-1c). Most pyrotags corresponded to the Gammaproteobacterial family Enterobacteriaceae (79–99% of individual pyrotags, Table A5-2). Although taxonomic profiles were similar in all three pyrotag libraries, the bacterial diversity of each of the A. colombica samples was greater than that recovered from the A. cephalotes fungus garden sample.
Community metagenomic analyses recovered primarily bacterial sequences (71–80% of total assembled bp) (Table A5-3). Consistent with the 16S pyrotag libraries, the majority of sequences in all three data sets matched most closely to Gammaproteobacteria (69–72%), especially Enterobacteriaceae (53–70%). To refine taxonomic resolution and infer the relative abundance of microbial groups, raw reads were phylogenetically classified using the Genome relative Abundance and Average Size (GAAS) tool (Angly et al., 2009). Estimates based on GAAS analyses indicate that the Gammaproteobacteria were particularly abundant, with the genus Enterobacter comprising over 50% of the bacterial population in all the three metagenomes (Figure A5-1d). The community metagenomes also contained representative sequences from the genera Klebsiella (3.8–4.9%), Pantoea (1.8–15.6%), Escherichia (5.3–6.3%), Citrobacter (3–5.8%), Pseudomonas (0.04–4.2%) and Lactococcus (0.01–2.2%). BLAST-based classification of the assembly indicated that B1% of the sequences corresponded to bacteriophage in each of the community metagenomes (Table A5-3), whereas the GAAS tool estimated that 15.1%, 16.8% and 6.8% of the A. colombica top, A. colombica bottom and A. cephalotes metagenomes could be comprised of bacteriophage, respectively.
Consistent with the GAAS- and BLAST-based analyses, the largest phylogenetic bins created by phymmBL were assigned to the genera Enterobacter, Pantoea, Klebsiella, Escherichia, Citrobacter and Pseudomonas. The Enterobacter bins were by far the largest, containing 15.3–29.5Mb of sequence. The majority of these sequences were most similar to the draft genome of Enterobacter FGI 35, a strain isolated in this study from an A. colombica fungus garden. The Pantoea bins were the next largest, containing between 5–7.2Mb of sequence each.
Metabolic Potential of Bacterial Lineages
To compare the coding potential of different bacterial groups in fungus gardens, we analyzed genus-level phylogenetic bins of sequences constructed
| Classification | kb of sequence (% of assembly) | |||||
| A. cephalotes | A. colombica top | A. colombica bottom | ||||
| Bacteria | 29 058.8 | (71.5%) | 78 823.2 | (78.1%) | 66 803.1 | (80.3%) |
| Proteobacteria | 28 985.3 | (71.4%) | 75 187.6 | (74.5%) | 63 493.9 | (76.3%) |
| Gammaproteobacteria | 28 697.4 | (70.6%) | 69 374 | (68.8%) | 59 665.8 | (71.7%) |
| Enterobacteriaceae | 28 225.4 | (69.5%) | 53 004.3 | (52.5%) | 49 280.1 | (59.3%) |
| Pseudomonadaceae | 222.8 | (0.55%) | 8973.2 | (8.9%) | 6741.7 | (8.1%) |
| Betaproteobacteria | 185.6 | (0.45%) | 4940.9 | (4.9%) | 3171 | (3.8%) |
| Alphaproteobacteria | 99.4 | (0.24%) | 822.5 | (0.82%) | 612.1 | (0.74%) |
| Firmicutes | 29.1 | (0.07%) | 3167.7 | (3.1%) | 3043.64 | (3.6%) |
| Actinobacteria | 19.4 | (0.05%) | 106.6 | (0.11%) | 82.5 | (0.01%) |
| Bacteroidetes | 17.9 | (0.04%) | 281.8 | (0.28%) | 124.1 | (0.15%) |
| Eukaryota | 661.3 | (1.6%) | 145.1 | (0.14%) | 133.5 | (0.16%) |
| Fungi | 495.6 | (1.2%) | 14.2 | (0.01%) | 25.1 | (0.03%) |
| Metazoa | 19.8 | (0.05%) | 81.5 | (0.08%) | 66.4 | (0.08%) |
| Viridiplantae | 143.4 | (0.35%) | 35.6 | (0.04%) | 35.2 | (0.04%) |
| Viruses | 102.2 | (0.25%) | 727.6 | (0.72%) | 947.6 | (1.1%) |
| dsDNA viruses | 85.9 | (0.21%) | 713.9 | (0.71%) | 579.6 | (0.7%) |
| ssDNA viruses | 15.3 | (0.04%) | 11.6 | (0.01%) | 367.25 | (0.44%) |
| Other | 60.1 | (<0.01%) | 132.8 | (<0.01%) | 105.8 | (<0.01%) |
| Unclassified | 10 741 | (26.4%) | 21 076.2 | (20.9%) | 15 177.1 | (18.2%) |
BLASTN was used to compare all sequences to NCBI’s non-redundant nucleotide database.
from the community metagenomes. Comparison of the coding potential in the bins with the KEGG database (Kanehisa et al., 2008) recovered well-represented sugar metabolism pathways in most of the Enterobacteriaceae bins (Figure A5-2). Moreover, pathways involved in B-vitamin and amino-acid metabolism were found to be highly represented in both the Pseudomonas and Enterobacteriaceae bins. The Lactococcus bins showed relatively low representation in most of these pathways. Clustering of phylogenetic bins from each of the metagenomes by their KEGG pathway representation indicated that bacterial members corresponding to the same genus, with the exception of Citrobacter, had similar metabolic profiles.
To examine how leaf-cutter ant fungus garden microbial communities differed from other environments, we predicted Clusters of Orthologous Groups (COGs) (Tatusov et al., 2001) from all contigs and reads from the three fungusgarden metagenomes and compared these with COG profiles from all other metagenomes available on the Integrated Microbial Genomes/Microbiomes (IMG/M) database (Markowitz et al., 2008) (Figure A5-3). COG profiles for the three fungus-garden metagenomes were found to be highly similar. Compared with all other metagenomes on IMG, many COG categories were overrepresented in fungus gardens (Fisher’s exact test, P < 0.01), including amino-acid transport and metabolism, carbohydrate transport and metabolism, and inorganic ion transport and metabolism (Figure A5-3). Specific COGs involved in carbohydrate transport and metabolism were analyzed in more detail to investigate possible bacterial roles in polysaccharide degradation, and sugar transporters and phosphotransferase system components in particular were found to be significantly overrepresented in the fungus-garden metagenomes (Fisher’s exact test, P < 0.01) (Supplementary Dataset S2).
To further investigate potential bacterial roles in plant-polymer deconstruction, we compared all predicted proteins in the three community metagenomes with the carbohydrate active enzymes (CAZy) database (Cantarel et al., 2009) and identified numerous enzymes potentially involved in this process (Table A5-4). The largest proportion of the identified proteins were most similar to oligosaccharidedegrading enzymes (176–566 CAZymes, 28–30%), and relatively few were found to be predicted cellulases (4–5 CAZymes, 0.2–0.6%). Compared with other well-known lignocellulose-degrading communities such as the Tammar wallaby foregut (Pope et al., 2010) and termite hindgut (Warnecke et al., 2007), fungus gardens contained relatively fewer cellulases and hemicellulases, but similar numbers of oligosaccharide-degrading enzymes.
Comparison of Enterobacter Populations
To identify the similarities between the Enterobacter populations across different metagenomes, we performed a fragment recruitment analysis comparing all predicted genes from the Enterobacter FGI 35 phylogenetic bins from each metagenome with the draft Enterobacter FGI 35 genome (Figure A5-4). The
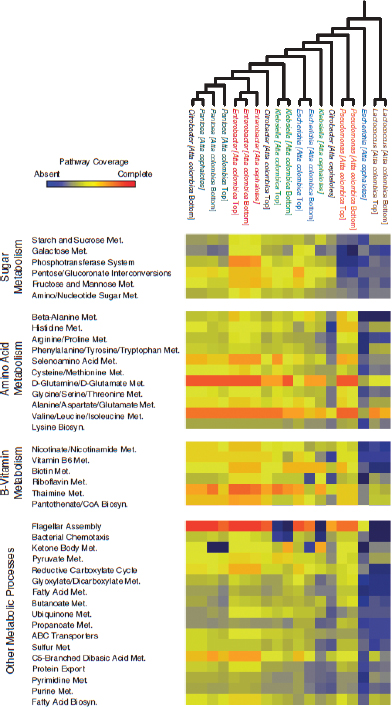
FIGURE A5-2 Reconstruction of KEGG pathways recovered from phylogenetic bins generated from the leaf-cutter ant fungus-garden metagenomes. KEGG profiles normalized by the number of predicted proteins in each phylogenetic bin were used for the clustering analysis. Pathways involved in the metabolism of carbohydrates, amino acids and B-vitamins were among the most highly represented and are shown here.
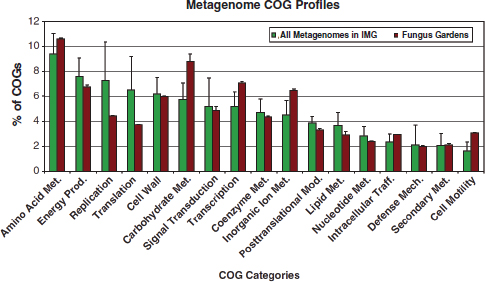
FIGURE A5-3 Comparison of the COG category distributions of the three combined fungus-garden metagenomes (A. colombica top, A. colombica bottom, and A. cephalotes combined) and all other metagenomes available in IMG. The average COG values are shown ±s.d.
fragment-recruitment analysis identified near-uniform coverage of >95% nucleic acid identity BLAST hits across the 33 Enterobacter FGI 35 contigs, with the exception of four regions between 18–66 kb large that we termed variable regions I–IV. Moreover, we found that there was also near-uniform coverage of 70–85% identity BLASTN hits across the draft genome. Investigation of the coding potential in these conserved regions identified genes required for the synthesis of thiamine, pyridoxine, nicotinate, nicotinamide, pantothenate, folate and 19 amino acids. Only the later stages of the histidine biosynthetic pathway could be identified, although the full pathway is present in other Enterobacter contigs. These regions also encoded ABC transporters and phosphotransferase system components predicted to uptake cellobiose, xylose, glucose, sucrose, b-glucosides, arbutin or salicin, N-acetyl-muramic acid, mannitol, mannose, sorbitol, galactitol, L-ascorbate, fructose, ribose, L-arabinose, methylgalactoside, sulfate, sulfonate, spermidine/putrescine, 2- aminoethylphosphonate, iron and other nutrients. The variable regions were found to contain primarily hypothetical genes and genes of unknown function, although some phage integrases were also identified.
Metaproteomics
Individual searches of the metaproteomic data against the predicted protein databases of each community metagenome recovered a total of 1186 redundant and 869 non-redundant peptides. Of all the distinct peptides recovered, 129 were
| A. colombica top | A. colombica bottom | A.cephalotes | Wallaby | Termite | Known activity | |
| Cellulases | ||||||
| GH5 | 5 | 2 | 2 | 20 | 97 | Cellulase, mannnosidase |
| GH6 | 0 | 0 | 2 | 0 | 0 | Endocellulase, cellobiohydrolase |
| GH9 | 0 | 2 | 0 | 4 | 39 | Endocellulase, cellobiohydrolase |
| GH44 | 0 | 0 | 0 | 0 | 4 | Endoglucanase, xyloglucanase |
| GH45 | 0 | 0 | 0 | 0 | 6 | Endoglucanase |
| Total | 5 (0.26%) | 4 (0.24%) | 4 (0.63%) | 24 (2.3%) | 146 (10.1%) | |
| Hemicellulases | ||||||
| GH8 | 36 | 30 | 13 | 2 | 17 | Cellulase, xylanase, chitosanase |
| GH10 | 0 | 1 | 3 | 18 | 92 | Xylanase |
| GH11 | 0 | 0 | 0 | 0 | 18 | Xylanase |
| GH28 | 13 | 11 | 3 | 10 | 13 | Polygalacturonase |
| GH26 | 1 | 0 | 0 | 8 | 19 | Xylanase, mannanase |
| GH53 | 1 | 4 | 0 | 3 | 5 | Endogalactanase |
| Total | 51 (2.6%) | 46 (2.8%) | 19 (2.9%) | 41 (3.9%) | 164 (11.3%) | |
| Debranching enzymes | ||||||
| GH51 | 4 | 2 | 0 | 18 | 26 | Arabinofuranosidase |
| GH67 | 2 | 0 | 0 | 0 | 6 | Glucuronidase |
| GH78 | 25 | 14 | 4 | 52 | 7 | Rhamnosidases |
| Total | 31 (1.6%) | 16 (0.98%) | 6 (0.63%) | 70 (6.8%) | 39 (2.7%) | |
| A. colombica top | A. colombica bottom | A.cephalotes | Wallaby | Termite | Known activity | |
| Oligosaccharide degrading enzymes | ||||||
| GH1 | 256 | 243 | 77 | 84 | 27 | Glucosidase, galactosidase, mannosidase |
| GH2 | 23 | 22 | 8 | 33 | 30 | Galactosidase, mannosidase, glucuronidase |
| GH3 | 95 | 76 | 29 | 98 | 108 | Glucosidase, xylosidase |
| GH4 | 61 | 55 | 35 | 3 | 17 | Galactosidase, glucosidase |
| GH29 | 20 | 4 | 0 | 5 | 12 | Fucosidase |
| GH35 | 11 | 1 | 0 | 10 | 6 | Galactosidase, glucosaminidase, |
| GH36 | 26 | 24 | 9 | 29 | 4 | Galactosidase, N-acetylgalactosaminidase |
| GH38 | 21 | 11 | 4 | 3 | 26 | Mannosidase |
| GH39 | 1 | 0 | 0 | 3 | 11 | Xylosidase, iduronidase |
| GH42 | 13 | 14 | 3 | 17 | 34 | Galactosidase |
| GH43 | 39 | 36 | 11 | 3 | 57 | Arabinase, xylosidase |
| GH52 | 0 | 0 | 0 | 0 | 3 | Xylosidase |
| Total | 566 (28.9%) | 486 (29.6%) | 176 (27.6%) | 288 (27.9%) | 335 (23.1%) | |
The raw number of enzymes is given, as well as the percent of all CAZymes identified in individual metagenomes.
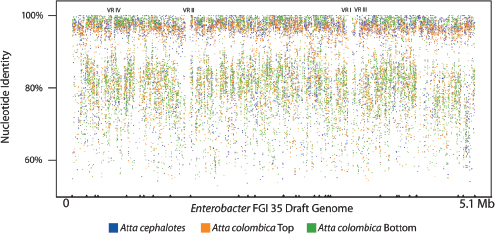
FIGURE A5-4 Fragment recruitment analysis of genes phylogenetically binned to Enterobacter FGI 35 against the draft Enterobacter FGI 35 genome. Each point indicates the best BLASTN match of a gene. Tick marks on the bottom indicate contig boundaries of the FGI 35 draft genome. Regions showing little or no coverage in the recruitment are marked on the top.
found in both laboratory and field samples, while 351 were unique to the laboratory sample and 389 were unique to the field sample. A total of 747, 238 and 201 peptides were recovered for the searches against the A. cephalotes, A. colombica top and A. colombica bottom datasets, respectively. These peptides were mapped onto a total of 653 proteins, of which 354 were predicted from contigs or singletons that were phylogenetically binned as bacterial (see Supplementary Information for details on the phylogenetic binning procedure). The majority of bacterial proteins identified were predicted to belong to the Enterobacteriaceae, and functions predicted from these proteins included a variety of metabolic processes (Table A5-5, Supplementary Dataset 5). Figure A5-5 highlights the overlap observed between laboratory-reared samples and field-collected samples for one peptide mapped to a predicted glycosyl hydrolase. Details for all mass spectra and the annotations for the bacterial proteins they mapped to can be found in Supplementary Datasets 3 and 5, respectively.
Discussion
Leaf-cutter ants are dominant New World herbivores, foraging on up to 17% of the foliar biomass in some ecosystems (Costa et al., 2009). In 1874 Thomas Belt established that leaf-cutters do not consume leaf material directly, as had been previously assumed, but instead use it as manure to cultivate a fungus for food in specialized gardens (Belt, 1874). For over a hundred years after Belt’s pioneering discovery it was believed that the fungus gardens of leaf-cutter ants
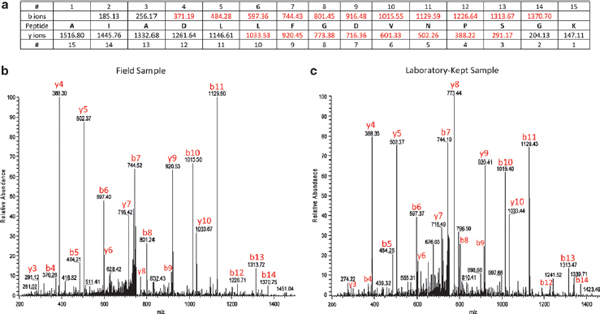
FIGURE A5-5 Example of overlap between field-collected and laboratory-reared fungus-garden samples for the glycoside hydrolase family 3 peptide N.AIADLLFGDVNPSGK.L. (a) Theoretical b and y ions, identified m/z values are highlighted in red. (b) Field sample MS/MS spectra; instrument, LTQ Orbitrap (high mass accuracy MS, low mass accuracy MS/MS); parent ion p.p.m. error, 4.03; peptide charge state, +2; retention time, 42.72 min; XCorr, 4.19; MS-GF spectra probability, 1.42 × 10⁻¹³. (c) Laboratory-kept sample MS/MS spectra; instrument, LTQ Orbitrap (high mass accuracy MS, low mass accuracy MS/MS); parent ion p.p.m. error, 3.06; peptide charge state, +2; retention time, 33.36 min; XCorr, 4.08; MS-GF spectra probability, 1.67 × 10⁻¹². Manual annotation of additional peptides of interest can be found in Supplementary Dataset 6.
| Function | IMG/M ID | Unique peptides | Coverage (%) | Metagenome | Phylogenetic bin | KEGG pathway annotation |
| Maltooligosaccharide ABC transporter | 2030379576 | 1 | 11.5 | Atta cephalotes | Enterobacter | ABC transporters |
| ABC-type Fe3+-siderophore transporter | 2030400032 | 1 | 15.0 | Atta cephalotes | Cronobacter | ABC transporters |
| Molybdenum ABC transporter | 2030421739 | 1 | 23.6 | Atta cephalotes | Enterobacter | ABC transporters |
| ABC-type metal ion transport system | 2030424448 | 1 | 17.5 | Atta colombica top | Cronobacter | ABC transporters |
| ABC-type sugar transport systems | 2030547071 | 1 | 5.6 | Atta colombica top | Enterobacter | ABC transporters |
| Nickel ABC transporter | 2030618419 | 1 | 13.7 | Atta cephalotes | Enterobacter | ABC transporters |
| Nickel ABC transporter | 2030715302 | 1 | 13.7 | Atta colombica bottom | Enterobacter | ABC transporters |
| Xylose-binding protein | 2030740215 | 1 | 20.3 | Atta colombica bottom | Enterobacter | ABC transporters |
| Sulfate ABC transporter, permease protein | 2030755690 | 1 | 11.3 | Atta colombica bottom | Escherichia | ABC transporters |
| ABC-type Fe2+-enterobactin transport system | 2030873639 | 1 | 19.7 | Atta colombica bottom | Citrobacter | ABC transporters |
| Glutamate 5-kinase | 2030382776 | 1 | 30.6 | Atta cephalotes | Citrobacter | Arginine and proline metabolism |
| Arginine/lysine/ornithine decarboxylases | 2030746280 | 1 | 18.3 | Atta colombica bottom | Shigella | Arginine and proline metabolism |
| Function | IMG/M ID | Unique peptides | Coverage (%) | Metagenome | Phylogenetic bin | KEGG pathway annotation |
| Argininosuccinate lyase | 2030440723 | 1 | 26.8 | Atta colombica top | Escherichia | Arginine and proline metabolism; alanine, aspartate and glutamate metabolism |
| Dihydrolipoamide dehydrogenase | 2030822927 | 1 | 17.7 | Atta colombica bottom | Escherichia | Glycine, serine and threonine metabolism; pyruvate metabolism |
| Dihydrolipoamide dehydrogenase | 2030836212 | 1 | 16.2 | Atta colombica bottom | Pantoea | Glycine, serine and threonine metabolism; pyruvate metabolism |
| Phosphoserine phosphatase | 2030692072 | 1 | 9.9 | Atta colombica bottom | Cronobacter | Glycine, serine and threonine metabolism |
| Serine hydroxymethyltransferase | 2030486384 | 2 | 26.8 | Atta colombica top | Erwinia | Glycine, serine and threonine metabolism |
| Serine hydroxymethyltransferase | 2030517753 | 1 | 12.6 | Atta colombica top | Citrobacter | Glycine, serine and threonine metabolism |
| Serine hydroxymethyltransferase | 2030694137 | 1 | 14.4 | Atta colombica bottom | Pantoea | Glycine, serine and threonine metabolism |
| Function | IMG/M ID | Unique peptides | Coverage (%) | Metagenome | Phylogenetic bin | KEGG pathway annotation |
| Phosphoglycerate dehydrogenase | 2030414422 | 1 | 5.3 | Atta cephalotes | Pantoea | Glycine, serine and threonine metabolism; glyoxylate metabolism |
| Phosphoglycerate dehydrogenase | 2030784320 | 1 | 11.0 | Atta colombica bottom | Pantoea | Glycine, serine and threonine metabolism; glyoxylate metabolism |
| N-formylglutamate amidohydrolase | 2030458338 | 1 | 21.5 | Atta colombica top | Pseudomonas | Histidine metabolism |
| UDP-N-acetylmuramyl pentapeptide synthase | 2030358109 | 1 | 9.9 | Atta cephalotes | Cronobacter | Lysine biosynthesis; peptidoglycan biosynthesis. |
| Assimilatory nitrate reductase (NADH) beta subunit | 2030622199 | 1 | 16.7 | Atta colombica top | Enterobacter | Nitrogen metabolism |
| Ketopantoate reductase | 2030492465 | 1 | 11.5 | Atta colombica top | Salmonella | Pantothenate and CoA biosynthesis |
| Dephospho-CoA kinase | 2030638227 | 1 | 8.3 | Atta colombica top | Cronobacter | Pantothenate and CoA biosynthesis |
| Dephospho-CoA kinase | 2030765884 | 1 | 8.3 | Atta colombica bottom | Cronobacter | Pantothenate and CoA biosynthesis |
| Ketol-acid reductoisomerase | 2030484311 | 1 | 14.7 | Atta colombica top | Cronobacter | Pantothenate and CoA biosynthesis; valine, leucine and isoleucine biosynthesis |
| Function | IMG/M ID | Unique peptides | Coverage (%) | Metagenome | Phylogenetic bin | KEGG pathway annotation |
| Ketol-acid reductoisomerase | 2030706777 | 1 | 14.4 | Atta colombica bottom | Enterobacter | Pantothenate and CoA biosynthesis; valine, leucine and isoleucine biosynthesis |
| 2,3-Dihydroxyphenylpropionate 1,2-dioxygenase | 2030383282 | 1 | 16.3 | Atta cephalotes | Escherichia | Phenylalanine metabolism |
| Phenylacetaldehyde dehydrogenase | 2030382676 | 1 | 6.0 | Atta cephalotes | Enterobacter | Phenylalanine metabolism |
| Phosphoribosylanthranilate isomerase | 2030473537 | 1 | 23.5 | Atta colombica top | Pseudomonas | Phenylalanine, tyrosine and tryptophan biosynthesis |
| PTS system IIB component | 2030657658 | 1 | 11.0 | Atta colombica top | Enterobacter | Phosphotransferase system |
| PTS system IIB component | 2030453403 | 1 | 11.5 | Atta colombica bottom | Enterobacter | Phosphotransferase system |
| PTS system N-acetylglucosamine-specific | 2030849317 | 1 | 8.4 | Atta cephalotes | Klebsiella | Phosphotransferase system |
| Coproporphyrinogen III oxidase | 2030365066 | 1 | 5.3 | Atta cephalotes | Klebsiella | Porphyrin and chlorophyll metabolism |
| Alpha-1,4-glucan 6-glycosyltransferase | 2030357778 | 1 | 4.7 | Atta cephalotes | Enterobacter | Starch and sucrose metabolism |
| Glycosyl hydrolase family 3 | 2030378568 | 1 | 11.5 | Atta colombica top | Herbaspirillum | Starch and sucrose metabolism |
| Function | IMG/M ID | Unique peptides | Coverage (%) | Metagenome | Phylogenetic bin | KEGG pathway annotation |
| Glycosyl hydrolase family 4 | 2030380706 | 1 | 8.1 | Atta cephalotes | Enterobacter | Starch and sucrose metabolism |
| Sulfite reductase (NADPH) | 2030777085 | 1 | 7.3 | Atta colombica bottom | Cronobacter | Sulfur metabolism |
| Cysteine synthase | 2030364558 | 2 | 14.2 | Atta cephalotes | Enterobacter | Sulfur metabolism; cysteine and methionine metabolism |
| Cysteine synthase | 2030392152 | 1 | 10.2 | Atta cephalotes | Cronobacter | Sulfur metabolism; cysteine and methionine metabolism |
| Cysteine synthase | 2030462672 | 1 | 12.4 | Atta colombica top | Enterobacter | Sulfur metabolism; Cysteine and methionine metabolism |
Proteins of interest are listed with their annotation, unique IMG/M identifiers, number of peptides matching, % coverage in the proteome, metagenome of origin, phyogenetic bin, and predicted KEGG pathway. The peptides used to construct this table were manually annotated, and details are available in Supplementary Dataset S6. All bacterial proteins characterized in the metaproteome can be seen in Supplementary Dataset S5, and details of all peptides identified can be found in Supplementary Dataset S3.
represented a monoculture of the fungal cultivar that degraded plant cellwall material and converted it into nutrients for the ants (Weber, 1966; Martin and Weber, 1969). However, both the lignocellulolytic capacity of the cultivar and the view that fungus gardens are composed solely of the fungal mutualist have been recently challenged (Gomes De Siqueira et al., 1998; Abril and Bucher, 2002; Scott et al., 2010; Suen et al., 2010). In this study, we explored the hypothesis that bacteria are common constituents of fungus gardens that could be participating in plant biomass degradation and nutrient cycling.
Our work demonstrates that a distinct community of bacteria resides in the fungus gardens of A. colombica and A. cephalotes leaf cutter ants. Our identification of similar bacterial groups in fungus-garden samples taken from different ant species and garden strata supports this conclusion. Moreover, this is consistent with our finding that relatively few bacterial genera comprise the majority of the metagenomic sequences recovered in this study (see below). This, combined with the previous work on nitrogen fixation, plant biomass degradation and membrane-lipid profiles in these ecosystems, indicates that bacteria are long-term residents of fungus gardens and not merely allochthonous organisms introduced from leaf material or the surrounding soil (Bacci et al., 1995; Pinto-Tomas et al., 2009; Scott et al., 2010; Suen et al., 2010). Thus, the term “fungus garden” may be misleading, as these environments are composed of a fungus–bacteria community.
The bacterial component of the microbial ecosystem in fungus gardens appears to be dominated by only a few groups. Specifically, the genera Enterobacter, Klebsiella, Citrobacter, Escherichia and Pantoea represent over two-thirds of the bacterial component in each of the community metagenomes (Figure A5-1d). This narrow genus-level diversity is likely the result of both the nutrient composition of the plant–fungal matrix and the meticulous hygienic practices of the ants. For example, leaf-cutters continuously weed their gardens to remove areas infected with microbial pathogens (Currie and Stuart, 2001), and also apply antimicrobials derived from both glandular secretions and symbiotic actinobacteria (Currie et al., 1999; Fernández-Marín et al., 2006). The extent of plant biomass degradation could also affect microbial diversity, but if this was a critical factor we would expect to find distinct communities between top and bottom garden strata, which contain fresh leaf material and largely degraded biomass, respectively. The similarity between different strata observed here, consistent with previous work reporting little difference between 16S libraries constructed from these two regions (Suen et al., 2010), indicates that the extent of plant biomass degradation is not a major contributor to community structuring. The consistent presence of bacterial groups within the Enterobacteriaceae throughout different garden strata and leaf-cutter ant species implicates them as having a consistent role in fungus gardens, and suggests that these environments represent highly structured communities rather than a random collection of opportunistic microbes. Although it remains a possibility that while removing the fungal matrix and plant debris from fungus gardens our analysis excluded microbial groups adhering to fungal
or plant biomass, thereby skewing the composition of the metagenomes, our results are generally consistent with previous culture-independent investigations that either analyzed whole fungus gardens or utilized different methods to isolate bacterial cells (Scott et al., 2010; Suen et al., 2010). Moreover, our processing of fresh rather than frozen fungusgarden material may be partially responsible for our success in removing fungal or plant debris from our samples.
Bacteria of the genus Enterobacter appear to be particularly prevalent in fungus gardens. In contrast to the narrow genus-level diversity observed in these environments, multiple species of Enterobacter appear to be present in all the gardens analyzed. Our fragment-recruitment analysis demonstrates that populations of bacteria with>95% and 70–85% nucleic acid identity to the reference Enterobacter FGI 35 genome exist in these environments (Figure A5-4). The four large gaps identified in the recruitment plot likely represent prophage or other variable elements in the reference genome. Because Enterobacter FGI 35 was isolated from an A. colombica fungus garden, the near-uniform coverage of genes at >95% identity across all metagenomes indicates that highly similar strains of Enterobacter are present in all of the samples analyzed. The near-uniform coverage of genes at 70–85% identity likely represents multiple distinct species, as it is improbable that genes from a single population of bacteria would have such a large range of nucleotide identity to a single reference genome. Genes 70–85% identical to the Enterobacter FGI 35 genome may represent divergent Enterobacter species or even novel Enterobacteriaceae for which an appropriate reference for phylogenetic binning does not exist. That different species of leaf-cutter ant harbor abundant Enterobacter populations indicates that this group may be an important constituent of the fungus garden community.
The overall functional potential of the metagenomes includes a diversity of bacterial genes associated with plant biomass degradation, supporting previous work that has suggested a role for bacteria in this process. The vast majority of CAZymes identified in the metagenomes are associated with oligosaccharide degradation or simple sugar metabolism, suggesting that bacteria are processing partially degraded plant material. We also found KEGG pathways involved in hexose and pentose sugar metabolism to be highly represented in the Enterobacteriaceae, indicating that sugar monomers can be readily metabolized by many of these bacteria. Moreover, our KEGG, COG and metaproteomic analyses recovered numerous sugar transporters (Figure A5-2, Table A5-5, Supplementary Dataset 2), including a large number of cellobiose-specific phosphotransferase system components that are known to be involved in the uptake of the byproducts of cellulose hydrolysis (Figure A5-1, Table A5-5, Supplementary Dataset 2). Together, these data suggest that bacterial community members are metabolizing predominantly partially degraded plant material, although it remains a possibility that unidentified bacterial lignocellulases also have a role in the degradation of more recalcitrant biomass.
Bacterial lineages in fungus gardens were also found to possess diverse biosynthetic pathways. Pathways involved in amino-acid and B-vitamin metabolism were particularly well-represented in the detected Enterobacteriaceae and Pseudomonas sequences, and biosynthetic pathways for thiamin, pyridoxine, nicotinate, nicotinamide, pantothenate, folate, and all 20 amino acids could be reconstructed from the Enterobacter bins. As mentioned above, enzymes involved in the metabolism of oligosaccharides and simple sugars were also identified in many of these groups, indicating that they may convert carbon-rich plant biomass into amino acids, B-vitamins, proteins or other nutrients. Previous work has indicated that bacteria have a role in the introduction and cycling of nitrogen in fungus gardens (Pinto-Tomas et al., 2009). Together with our work, this suggests that the combined metabolism of resident bacteria may enrich the nutrient composition of fungus gardens through the conversion of carbohydrate-rich oligosaccharides into a variety of other nutrients that could promote the growth of the fungal cultivar or even nourish the ants themselves.
Our metaproteomic analysis recovered peptides mapping to bacterial proteins predicted to participate in biomass degradation and nutrient biosynthesis, supporting the results of our metagenomic characterization and further indicating that bacteria are involved in these processes (Table A5-5, Supplementary Datasets 3, 5, and 6). Our manual inspection of the metaproteomic data identified multiple peptides belonging to glycoside hydrolases, sugar transporters and amino acid and B-vitamin biosynthetic pathways. That multiple peptides could be assigned to proteins with similar predicted functions indicates that these processes may be prevalent in fungus gardens. Moreover, many of the mapped peptides originated from both laboratoryreared and field-collected samples, including one that belonged to a family 3 glycosyl hydrolase (Figure A5-5). Although these data should be interpreted cautiously due to the few bacterial proteins identified overall, this may indicate physiological similarities between bacteria in laboratoryreared versus field-collected colonies.
Not all bacteria in fungus gardens were found to have substantial biosynthetic capacity, and in particular the Lactococcus groups appeared to have limited coding potential in the majority of pathways analyzed. This may be a result of lower sequencing coverage, as only a relatively small fraction of the metagenomes was predicted to belong to these groups. Alternatively, these groups may not be contributing substantially to nutrient cycling and are able to subsist on free sugars and other nutrients available in fungus gardens. Importantly, the byproducts of Lactococci metabolism may acidify fungus gardens and contribute to the maintenance of the lower pH in these ecosystems, which has previously been observed at 4.4–5.0 (Powell and Stradling, 1986). Regulation of the pH of fungus gardens to this narrow range has been hypothesized to be critical to the growth of fungal cultivar, but the mechanism through which this occurs has remained unknown (Powell and Stradling, 1986). Few peptides from our metaproteomic
data sets were recovered from this group, indicating that they may be present in low abundance.
In addition to bacteria, we also found that fungus gardens contain substantial populations of bacteriophage (Figure A5-1). These organisms could play key roles by limiting bacterial abundance or decreasing ecosystem productivity. Moreover, because fungus gardens contain numerous closely related genera in the Enterobacteriaceae, bacteriophage could provide a common mechanism for gene transfer between lineages. The presence of bacteriophage in fungus gardens adds to the number of organisms that are shaping these ecosystems and introduces a new layer of complexity into the ecology of fungus gardens.
Metagenomics and metaproteomics have previously been shown to be invaluable tools for analyzing microbial communities (Ram et al., 2005; Gill et al., 2006; Woyke et al., 2006; Kalyuzhnaya et al., 2008; Wilmes et al., 2008; Allgaier et al., 2009; Verberkmoes et al., 2009; Burnum et al., 2011), including those associated with herbivores (Warnecke et al., 2007; Brulc et al., 2009; Pope et al., 2010; Burnum et al., 2011). Here we use these techniques to provide insight into the fungus gardens of leaf-cutter ants. Our work shows that relatively few genera dominate the bacterial fraction of these communities, and that the genus Enterobacter appears to be particularly prevalent. We show that bacteria have diverse metabolic potential associated with the degradation of plant biomass, and we confirm the production of two bacterial glycoside hydrolases in situ. Moreover, we show that bacteria in fungus gardens likely participate in the biosynthesis of amino acids, B-vitamins and other nutrients that potentially enhance the growth or biomass-processing efficiency of the fungal cultivar. This is consistent with a model of synergistic biomass degradation by a fungus–bacteria consortium. Our work enhances our knowledge of how leaf-cutter ants process massive quantities of plant biomass in their ancillary digestive systems, and underscores the importance of symbiotic communities on the evolution and ecology of herbivores.
Acknowledgements
We thank the staff of the Joint Genome Institute, Pacific Northwest National Laboratories, and the Smithsonian Tropical Research Institute for their expertise and support in the collection and processing of all samples, in particular S Malfatti, L Seid, Y Clemons, R Urriola, M Paz and O Arosemena. We thank all members of the Currie lab for their comments on the manuscript. We also thank three anonymous reviewers for their comments on the manuscript. The US Department of Energy Joint Genome Institute effort was supported by the Office of Science of the US Department of Energy under Contract No. DE-AC02-05CH11231. Proteomic work was performed in the Environmental Molecular Sciences Laboratory, a US Department of Energy (DOE) Office of Biological and Environmental Research national scientific user facility on the Pacific Northwest National Laboratory (PNNL) campus. Portions of this research were supported by the US
Department of Energy’s (DOE) Office of Biological and Environmental Research (OBER) Panomics program. PNNL is a multiprogram national laboratory operated by Battelle for the DOE under Contract DE-AC05-76RL01830. This work is also supported by the National Science Foundation (grants DEB-0747002, MCB-0702025, and MCB-0731822 to CRC) and the DOE Great Lakes Bioenergy Research Center (DOE Office of Science BER DE-FC02- 07ER64494).
References
Abril AB, Bucher EH. (2002). Evidence that the fungus cultured by leaf-cutting ants does not metabolize cellulose. Ecol Lett 5: 325–328.
Allgaier M, Reddy A, Park JI, Ivanova N, D’Haeseleer P, Lowry S et al. (2009). Targeted discovery of glycoside hydrolases from a switchgrass-adapted compost community.
PLoS One 5: e8812.
Angly FE, Willner D, Prieto-Davo A, Edwards RA, Schmieder R, Vega-Thurber R et al. (2009). The GAAS metagenomic tool and its estimations of viral and microbial average genome size in four major biomes. PLoS Comput Biol 5: e1000593.
Bacci M, Ribeiro SB, Casarotto MEF, Pagnocca FC. (1995). Biopolymer-degrading bacteria from nests of the leafcutting ant Atta Sexdens Rubropilosa. Braz J Med Biol Res 28: 79–82.
Belt T. (1874). The Naturalist in Nicaragua. E. Bumpus: London.
Brulc JM, Antonopoulos DA, Miller ME, Wilson MK, Yannarell AC, Dinsdale EA et al. (2009). Gene-centric metagenomics of the fiber-adherent bovine rumen microbiome reveals forage specific glycoside hydrolases. Proc Natl Acad Sci USA 106: 1948–1953.
Burnum KE, Callister SJ, Nicora CD, Purvine SO, Hugenholtz P, Warnecke F et al. (2011). Proteome insights into the symbiotic relationship between a captive colony of Nasutitermes corniger and its hindgut microbiome. ISME J 5: 161–164.
Cantarel BL, Coutinho PM, Rancurel C, Bernard T, Lombard V, Henrissat B. (2009). The Carbohydrate-Active EnZymes database (CAZy): an expert resource for glycogenomics. Nucleic Acids Res 37(Database issue): D233–D238.
Chapela IH, Rehner SA, Schultz TR, Mueller UG. (1994). Evolutionary history of the symbiosis between fungus-growing ants and their fungi. Science 266: 1691–1694.
Costa AN, Vasconcelos HL, Vieira-Neto EHM, Bruna EM. (2009). Do herbivores exert top-down effects in Neotropical savannas? Estimates of biomass consumption by leaf-cutter ants. J Veg Sci 19: 849–854.
Currie CR, Scott JA, Summerbell RC, Malloch D. (1999). Fungus-growing ants use antibiotic-producing bacteria to control garden parasites. Nature 398: 701–704.
Currie CR, Stuart AE. (2001). Weeding and grooming of pathogens in agriculture by ants. Proc R Soc Lond B Biol Sci 268: 1033–1039.
De Fine Licht HH, Schiott M, Mueller UG, Boomsma JJ. (2010). Evolutionary transitions in enzyme activity of ant fungus gardens. Evolution 64: 2055–2069.
Eng J, McCormack A, Yates J. (1994). An approach to correlate tandem mass spectral data of peptides with amino acid sequences in a protein database. J Am Soc Mass Spectrom 5: 976–989.
Fernández-Marín H, Zimmerman JK, Rehner SA, Wcislo WT. (2006). Active use of the metaplural glands by ants in controlling fungal infection. Proc R Soc London B Biol Sci 273: 1689–1695.
Gill SR, Pop M, Deboy RT, Eckburg PB, Turnbaugh PJ, Samuel BS et al. (2006). Metagenomic analysis of the human distal gut microbiome. Science 312: 1355–1359.
Gomes De Siqueira C, Bacci Jr M, Pagnocca FC, Bueno OC, Hebling MJA. (1998). Metabolism of plant polysaccharides by Leucoagaricus gongylophorus, the symbiotic fungus of the leaf-cutting ant Atta sexdens. Appl Environ Microbiol 64: 4820–4822.
Haeder S, Wirth R, Herz H, Spiteller D. (2009). Candicidinproducing Streptomyces support leafcutting ants to protect their fungus garden against the pathogenic fungus Escovopsis. Proc Natl Acad Sci USA 106: 4742–4746.
Hölldobler B, Wilson EO. (1990). The Ants. Harvard University Press: Cambridge, MA.
Hölldobler B, Wilson EO. (2008). The Superorganism: The Beauty, Elegance, and Strangeness of Insect Societies. W. W. Norton & Company: New York, NY.
Hölldobler B, Wilson EO. (2010). The Leafcutter Ants: Civilization by Instinct. W. W. Norton & Company: New York, NY.
Kalyuzhnaya MG, Lapidus A, Ivanova N, Copeland AC, McHardy AC, Szeto E et al. (2008). High-resolution metagenomics targets specific functional types in complex microbial communities. Nat Biotechnol 26: 1029–1034.
Kanehisa M, Araki M, Goto S, Hattori M, Hirakawa M, Itoh M et al. (2008). KEGG for linking genomes to life and the environment. Nucleic Acids Res 36(Database issue): D480–D484.
Kim S, Gupta N, Pevzner PA. (2008). Spectral probabilities and generating functions of tandem mass spectra: a strike against decoy databases. J Proteome Res 7: 3354–3363.
Margulies M, Egholm M, Altman WE, Attiya S, Bader JS, Bemben LA et al. (2005). Genome sequencing in microfabricated high-density picolitre reactors. Nature 437: 376–380.
Markowitz VM, Ivanova NN, Szeto E, Palaniappan K, Chu K, Dalevi D et al. (2008). IMG/M: a data management and analysis system for metagenomes. Nucleic Acids Res 36(Database issue): D534–D538.
Martin MM, Weber NA. (1969). The cellulose-utilizing capability of the fungus cultured by the attine ant Atta colombica tonsipes. Ann Entomol Soc Am 62: 1386–1387.
Mueller U, Gerardo N, Aanen D, Six D, Schultz T. (2005). The evolution of agriculture in insects. Annu Rev Ecol Evol Syst 36: 563–595.
Pinto-Tomas AA, Anderson MA, Suen G, Stevenson DM, Chu FS, Cleland WWet al. (2009). Symbiotic nitrogen fixation in the fungus gardens of leaf-cutter ants. Science 326: 1120–1123.
Pope PB, Denman SE, Jones M, Tringe SG, Barry K, Malfatti SA et al. (2010). Adaptation to herbivory by the Tammar wallaby includes bacterial and glycoside hydrolase profiles different from other herbivores. Proc Natl Acad Sci USA 107: 14793–14798.
Powell RJ, Stradling DJ. (1986). Factors influencing the growth of Attamyces bromatificus, a symbiont of the attine ants. Trans Br Mycol Soc 87: 205–213.
Ram RJ, Verberkmoes NC, Thelen MP, Tyson GW, Baker BJ, Blake II RC et al. (2005). Community proteomics of a natural microbial biofilm. Science 308: 1915–1920.
Santos AV, Dillon RJ, Dillon VM, Reynolds SE, Samuels RI. (2004). Ocurrence of the antibiotic producing bacterium Burkholderia sp. in colonies of the leafcutting ant Atta sexdens rubropilosa. FEMS Microbiol Lett 239: 319–323.
Schiott M, De Fine Licht HH, Lange L, Boomsma JJ. (2008). Towards a molecular understanding of symbiont function: identification of a fungal gene for the degradation of xylan in the fungus gardens of leafcutting ants. BMC Microbiol 8: 40.
Schiott M, Rogowska-Wrzesinska A, Roepstorff P, Boomsma JJ. (2010). Leaf-cutting ant fungi produce cell wall degrading pectinase complexes reminiscent of phytopathogenic fungi. BMC Biol 8: 156.
Schultz TR, Brady SG. (2008). Major evolutionary transitions in ant agriculture. Proc Natl Acad Sci USA 105: 5435–5440.
Scott JJ, Budsberg KJ, Suen G, Wixon DL, Balser TC, Currie CR. (2010). Microbial community structure of leafcutter ant fungus gardens and refuse dumps. PLoS One 5: e9922.
Semenova TA, Hughes DP, Boomsma JJ, Schiott M. (2011). Evolutionary patterns of proteinase activity in attine ant fungus gardens. BMC Microbiol 11: 15.
Silva A, Bacci Jr M, Pagnocca FC, Bueno OC, Hebling MJ. (2006a). Production of polysaccharidases in different carbon sources by Leucoagaricus gongylophorus Moller (Singer), the symbiotic fungus of the leaf-cutting ant Atta sexdens Linnaeus. Curr Microbiol 53: 68–71.
Silva A, Bacci Jr M, Pagnocca FC, Bueno OC, Hebling MJ. (2006b). Starch metabolism in Leucoagaricus gongylophorus, the symbiotic fungus of leaf-cutting ants. Microbiol Res 161: 299–303.
Suen G, Scott JJ, Aylward FO, Adams SM, Tringe SG, Pinto-Tomas AA et al. (2010). An insect herbivore microbiome with high plant biomass-degrading capacity. PLoS Genet 6: e1001129.
Tatusov RL, Natale DA, Garkavtsev IV, Tatusova TA, Shankavaram UT, Rao BS et al. (2001). The COG database: new developments in phylogenetic classification of proteins from complete genomes. Nucleic Acids Res 29: 22–28.
Verberkmoes NC, Russell AL, Shah M, Godzik A, Rosenquist M, Halfvarson J et al. (2009). Shotgun metaproteomics of the human distal gut microbiota. ISME J 3: 179–189.
Warnecke F, Luginbuhl P, Ivanova N, Ghassemian M, Richardson TH, Stege JT et al. (2007). Metagenomic and functional analysis of hindgut microbiota of a wood-feeding higher termite. Nature 450: 560–565.
Weber NA. (1966). Fungus-growing ants. Science 153: 587–604.
Wilmes P, Wexler M, Bond PL. (2008). Metaproteomics provides functional insight into activated sludge wastewater treatment. PLoS One 3: e1778.
Woyke T, Teeling H, Ivanova NN, Huntemann M, Richter M, Gloeckner FO et al. (2006). Symbiosis insights through metagenomic analysis of a microbial consortium. Nature 443: 950–955.
Supplementary Information accompanies the paper on The ISME Journal website (http://www.nature.com/ismej)
PHYLOGENETIC AND PHYLOGENOMIC APPROACHES TO STUDIES OF MICROBIAL COMMUNITIES†
Jonathan A. Eisen25
Note: this paper is based on a transcript of a talk given at the IOM Forum on Microbial Threats in March, 2012. Only minor modifications have been made (e.g., additional of section headers, addition of references, removal of side comments) in order to as accurately as possible reflect the presentation. A recording of the talk with slides is available on YouTube at http://www.youtube.com/watch?v=ddGyEExi-FI&feature=share&list=PL3E32A3B8B2642F62. Because my presentation was in essence a review of my work in the area, this should not be viewed as a review of the field but rather of my work in this area.
Acknowledgements and Introduction
Thank you. I guess I have the awkward after-lunch talk here, so I will try not to use the most complicated slide I used, although I am not so sure about that.
___________
25 University of California, Davis, California.
† Adapted from remarks presented at the IOM Forum on Microbial Threats March 2012 Workshop, The Social Biology of Microbial Communities.
Since I frequently don’t get to my last slide, I just want to do like some other people have been doing, acknowledgements at the beginning. And what I am going to talk about is work funded by a lot of different agencies that has gone on in my lab for about 10, 15 years, including in particular work funded by the Department of Energy, the National Science Foundation, the Gordon and Betty Moore Foundation, and recently Homeland Security, all related to phylogenetic analysis of genomes and metagenomes. And there are a lot of people I will mention, many of the people involved in this. But this is the trans-disciplinary type of work. It hurts my head a lot of time to think of all the people involved in some of these projects, but I will try to acknowledge as many of them as possible.
So what I am going to do is give just a quick introduction to phylogeny and then talk about three examples of the uses of phylogeny in studying microbial communities via DNA sequencing—phylotyping, functional prediction (just a tiny bit, because I want to raise the point as [the topic] has come up a few times [at this meeting], and then selection of organisms for study. And then I will end with just a couple of things about future directions.
What Is Phylogeny?
I assume most people here know what phylogeny is, but just [a quick reminder]: phylogeny is a representation of the history of entities, and that could be the history of genes, the history of genomes, the history of species. And in many cases, people have represented this history by a bifurcating tree-like structure. Phylogeny doesn’t have to be represented as a bifurcating tree-like structure. We can have reticulation events, like recombination and lateral gene transfer. I include all those complexities within the concepts of phylogeny, so I am not trying to discriminate between vertical evolution versus lateral evolution, but really this sort of representation of the history of organisms. I am also not going to get into the debates about what that exact history is. People are still trying to resolve the evolutionary history of microbes as well as other organisms, and it is a constant area of research.
Whatever your belief of the latest model is, in my opinion if you incorporate phylogenetic approaches in your analysis of genome and metagenome and other data, it can improve what you are doing relative to not trying to incorporate phylogenetic approaches. And what I am going to do is try and walk you through a couple of examples of this.
Example I: Phylotyping
The first one I want to talk about is phylotyping, which we have heard either directly or indirectly a lot about at this meeting. Phylotyping, I was exposed to as a young, budding scientist in the lab of Colleen Cavanaugh. I was an undergraduate at Harvard and ended up in Colleen’s lab, and I spent a year and a
half sequencing one 16s ribosomal RNA gene. But I got a paper out of that one 16s ribosomal RNA gene (Eisen et al., 1992). And the point of sequencing that 16s ribosomal RNA gene, as well as the point, even today in many cases, of ribosomal RNA sequencing, is to try and figure out what the organism is related to where that 16s came from.
And the way phylotyping works, this is basically developed by Norm Pace and colleagues (e.g., Hugenholtz et al., 1988). You collect DNA from your sample, you clone out some sequence like ribosomal RNA, you build an evolutionary tree of that sequence. So this is where the phylo part comes in phylotyping, a phylogenetic tree of that sequence. And you compare your unknowns to known things that are out there. And this is the tree from our Solemya velum chemosynthetic symbiont 16s, which by the way was accepted 20 years ago tomorrow, I think, my first scientific paper (see Figure A6-1).
Ribosomal RNA phylotyping has been amazing at revolutionizing our understanding of microbes in the world. I assume most people here appreciate the vast diversity of things that have been discovered by using phylogenetic trees of ribosomal RNAs from the environment to understand what the organisms are that those ribosomal RNAs came from. I am not going to go into the whole history of this. What I really want to talk about is three challenges that now come up with phylogenetic typing that largely relate to this issue of the cost of sequencing dropping and dropping and dropping and getting easier and easier and easier, accelerating at a rate faster than Moore’s Law.
And with new sequencing machines being announced every 2 or 3 days, not that all of them work, but there are all sorts of cool things coming out there. And so this affects things like PCR amplification of ribosomal RNA sequences. We now have literally trillions of ribosomal RNA sequences to analyze, as opposed to that one that I got a paper out of. It also is really important in terms of revolutionizing metagenomic approaches. And I appreciate what Jo [Handelsman] was talking about, with metagenomics is not everything about a community, but the cheaper sequencing is, the more data we are going to have for metagenomics. Even though it doesn’t tell us everything we need to analyze that data. And a third challenge is that most of the DNA sequencing technologies that people have been using generate short sequence reads, as opposed to long contigs that are easier to analyze.
And so it is sort of obvious that when metagenomic data was generated, you could scan through the metagenomic data to build evolutionary trees of sequences that were in that data. And this is what I did with Craig Venter in the analysis of the Sargasso Sea data (Venter et al., 2004). You can scan through the metagenomes, find ribosomal RNA sequences, and build evolutionary trees of those ribosomal RNAs just like we did with PCR amplified data (Figure A6-2).
The great thing about metagenomic data is, we can build phylogenetic trees of other genes that are good phylogenetic markers that we never could really get a good sample of most of these because PCR amplification of protein coding genes
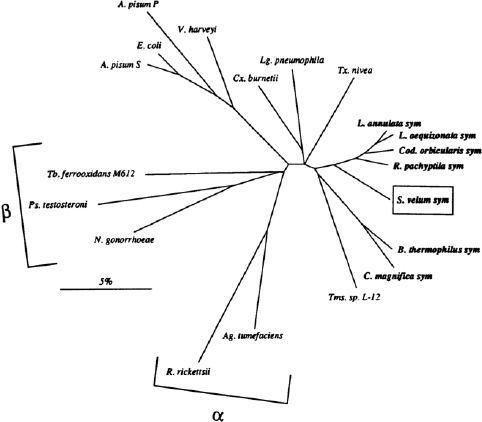
FIGURE A6-1 Unrooted phylogenetic tree showing the position of the S. velum symbionts in relation to that of other Proteobacteria species on the basis of 16s rRNA gene sequences. The tree was constructed from evolutionary distances in Table 1. Members of the alpha and beta subclasses of the Proteobacteria are bracketed; all others are of the gamma subclass. Chemoautotrophic symbionts (sym) are listed in boldface type. Full species names listed in Table A6-1. Scale bar represents percent similarity.
SOURCE: Eisen et al. (1992).
across broad diversity does not work very well. So now with metagenomic data we can look at protein coding genes and compare and contrast the results with those to the results with ribosomal RNA. I have been obsessed with the RecA gene for a long time (e.g., Eisen, 199526), so I always end up working on RecA (Figure A6-3).
But there are lots of others genes that you can analyze, and we did this in the Sargasso Sea analysis. And if you compare and contrast the results that you
___________
26 Eisen J. A. 1995. The RecA protein as a model molecule for molecular systematic studies of bacteria: Comparison of trees of RecAs and 16S rRNAs from the same species. Journal of Molecular Evolution 41(6):1105-23.
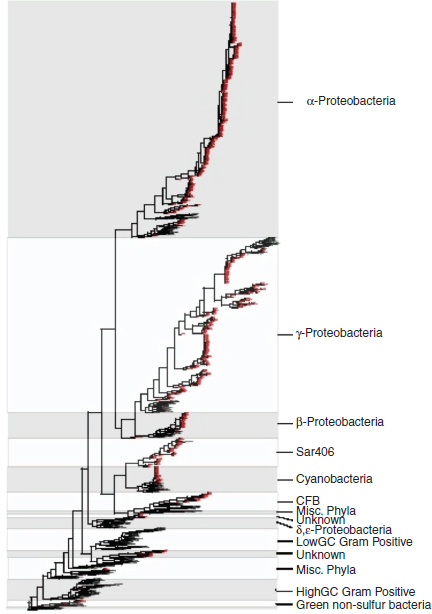
FIGURE A6-2 rRNA tree. Phylogenetic tree of 16s rRNA. Phylogenetic trees are shown for this gene, with sequences from this study colored red, and with major phylogenetic groups outlined (clades of sequences that could not be assigned to any group are labeled as “Unknown”). Only the bacterial portions of the tree are shown. The phylogenetic tree of rRNAs was generated by (1) aligning each Sargasso Sea rRNA of greater than 400 bp against its closest match in the alignments from the Ribosomal Database Project – II (RDP II) database and then using that alignment to align the new sequence to the complete RDP database; (2) a phylogenetic tree was generated using the dnapars algorithm of the Phylip package in which all new Sargasso sequences were included as were all sequences from complete genomes and sequences from representatives of major phylogenetic groups. Only complete genomes were used for comparison so that each tree can be compared to the others without differences in species sampling complicating the comparison.
SOURCE: Venter et al. (2004).
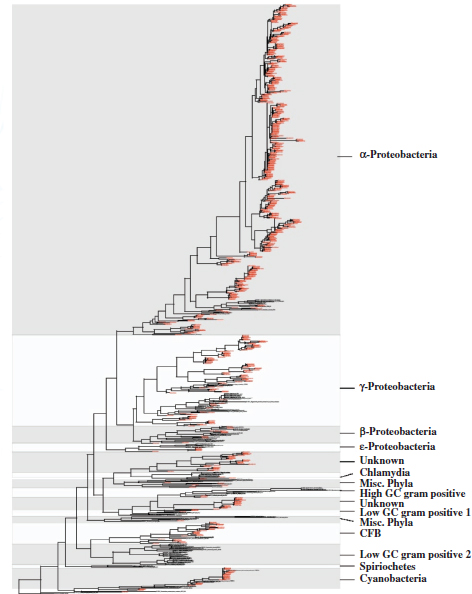
FIGURE A6-3 RecA tree. Phylogenetic tree of 16s rRNA. Phylogenetic trees are shown for this gene, with sequences from this study colored Red, and with major phylogenetic groups outlined (clades of sequences that could not be assigned to any group are labeled as “Unknown”). Only the bacterial portions of the tree are shown. The phylogenetic tree was generated in the following way: (1) homologs of each protein were identified in the Sargasso predicted protein set and in complete genome sequences using blastp and Hidden Markov Model (HMM) searches; (2) distant paralogs of each protein were excluded using a reciprocal-top match filter; (3) all sequences were aligned to each other using the HMM as a template; (4) poorly aligned regions were identified and removed using a conservation-score based filter; (5) all sequences that did not have>50% overlap with the E. coli ortholog were excluded; and (6) phylogenetic trees were generated using the protein parsimony algorithm in Phylip (parsimony was used to better deal with the limited overlap between many pairs of sequences). Only complete genomes were used for comparison so that each tree can be compared to the others without differences in species sampling complicating the comparison.
SOURCE: Venter et al. (2004).
get with phylogenetic typing of protein coding genes and assigning those types into phyla, into bins that correspond to the phyla of organisms, you see some interesting patterns (Figure A6-4).
There are some differences between what you get with ribosomal RNA and what you get with protein coding genes. I think a lot of this is due to the differences in copy number. So if you estimate relative abundance of organisms from ribosomal RNA, the copy number of ribosomal RNA varies a lot between taxa, but the copy number of many protein coding genes does not vary a lot between taxa. So the protein coding genes, even though they are not as richly sampled, are
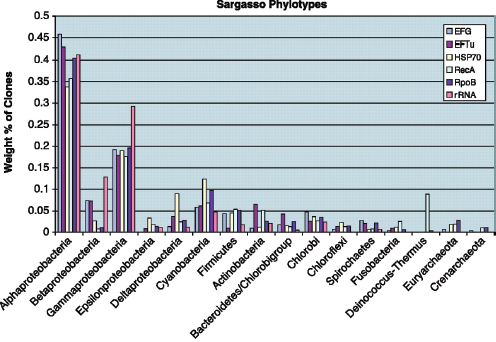
FIGURE A6-4 Phylogenetic diversity of Sargasso Sea sequences using multiple phylogenetic markers. The relative contribution of organisms from different major phylogenetic groups (phylotypes) was measured using multiple phylogenetic markers that have been used previously in phylogenetic studies of prokaryotes: 16S rRNA, RecA, EF-Tu, EF-G, HSP70, and RNA polymerase B (RpoB). The relative proportion of different phylotypes for each sequence (weighted by the depth of coverage of the contigs from which those sequences came) is shown. The phylotype distribution was determined as follows: (1) Sequences in the Sargasso data set corresponding to each of these genes were identified using HMM and BLAST searches. (2) Phylogenetic analysis was performed for each phylogenetic marker identified in the Sargasso data separately compared with all members of that gene family in all complete genome sequences (only complete genomes were used to control for the differential sampling of these markers in GenBank). (3) The phylogenetic affinity of each sequence was assigned based on the classification of the nearest neighbor in the phylogenetic tree.
SOURCE: Venter et al. (2004).
probably better markers for estimating relative abundance than ribosomal RNA sequences. People have been doing this now with metagenomic data in many different contexts.
Need for Automation
I am not going to cover all of the phylogenetic approaches to metagenomic data. But what I want to talk about is this issue of automation. I think as we get more and more sequence data, we can’t look at trees any more. We can’t look at sequence alignments. We can’t even handle all the data at all. But we certainly need to automate everything.
There are multiple strategies to trying to automate phylogenetic typing of ribosomal RNA or metagenomic data. And one of them has been to use the BLAST program (Altschul et al., 1990), or analogs of the BLAST program, which basically looks at sequence similarity of your sequence to sequences in databases. This is not the best approach to analyzing data. Percent similarity or other measures of similarity are not a good indicator of evolutionary relatedness and can produce misleading patterns about the taxonomy and other parts of information that you want to analyze (Eisen, 1998). There are also approaches that look at compositional and word frequencies. Now both of these approaches are very fast, so you can generate a lot of results very rapidly, and that can be an advantage in many cases. But phylogenetic analysis is generally better than most of these approaches, and the challenge is, how do you implement phylogenetic analysis on a massive scale?
And so what I am going to do is just give you sort of four examples of some of the issues related to implementing automated phylogenetic analysis on a large scale.
Method 1: Each Sequence Is an Island
You can scan through the data and say I am going to take each individual sequence, each individual new thing that I get, and build an evolutionary tree of it relative to known things. So in essence, each sequence is an island in and of itself. So we have done this with a variety of tools. We built our automated ribosomal RNA tool called STAP (Wu et al., 2008), which goes through and takes a reference alignment of known ribosomal RNAs and then for each new sequence aligns your new sequence to that and builds an evolutionary tree in a completely automated manner, and then can scan through the tree to look at the taxonomy results from the tree (Figure A6-5).
We also built a tool that will do this with protein coating genes, called AMPHORA (Wu and Eisen, 2008). So it can automatically scan through metagenomic data, find homologues of particular protein families, build an alignment of them, build an evolutionary tree of them (Figure A6-6). And if you have a good reference alignment from known organisms, you can identify a
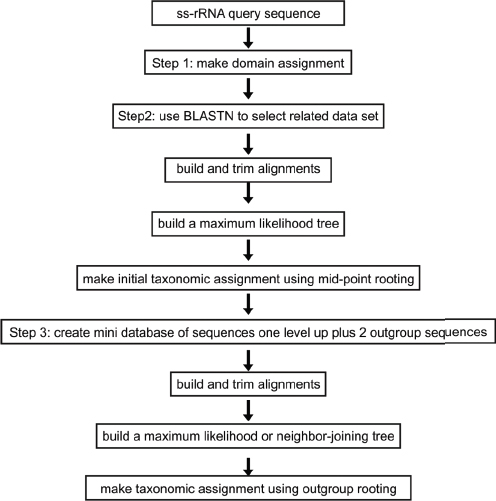
FIGURE A6-5 A flow chart of the STAP pipeline.
SOURCE: Wu et al. (2008).
candidate—sort of identify what those protein coating genes come from in your environmental sample (Figure A6-7).
Now having a good reference database is challenging for protein coating sequences, whereas we have now trillions of ribosomal RNA sequences and tens of thousands of complete ribosomal RNA sequences. We don’t have good databases of protein coating sequences. All of the good data are now coming from genome sequencing projects. So whatever has been sequenced in terms of genomes is basically our source of protein coating genes for building these evolutionary trees. And so you build a reference tree from the genomes, you take your new data, stream them against the reference tree, build a new tree with that, and assign your new sequence to somewhere compared to the reference
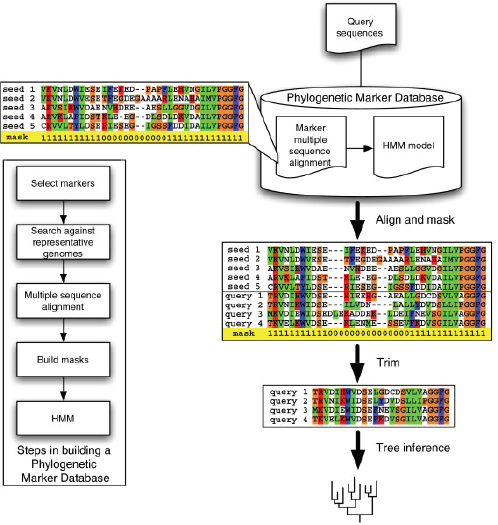
FIGURE A6-6 A flow chart illustrating the major components of AMPHORA. The marker protein sequences from representative genomes are retrieved, aligned, and masked. Profile hidden Markov models (HMMs) are then built from those “seed” alignments. New sequences of interest are rapidly and accurately aligned to the trusted seed alignments through HMMs. Predefined masks embedded within the “seed” alignment are then applied to trim off regions of ambiguity before phylogenetic inference. Alignment columns marked with “1” or “0” were included or excluded, respectively, during further phylogenetic analysis.
SOURCE: Wu and Eisen (2008).
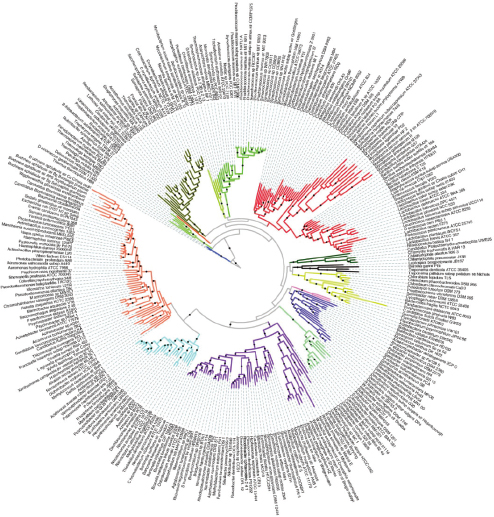
FIGURE A6-7 An unrooted maximum likelihood bacterial genome tree. The tree was constructed from concatenated protein sequence alignments derived from 31 housekeeping genes. All major phyla are separated into their monophyletic groups and are highlighted by color. The branches with bootstrap support of more than 80 (out of 100 replicates) are indicated with black dots. Although the relationships among the phyla are not strongly supported, those below the phylum level show very respectable support. The radial tree was generated using iTOL.
SOURCE: Wu and Eisen (2008).
data. And we have done this with this AMPHORA. It can allow you to stream through massive metagenomic data sets, and do taxonomic assignments for a suite of protein coating genes, just again like you would do with ribosomal RNA sequences (Figure A6-8).
And again, I think this is very advantageous in particular because of the copy number variation with ribosomal RNA. We have shown that it is better than similarity-based approaches (Figure A6-9).
Method 2: Most in the Family
This [approach involves] analyzing each individual sequence on its own. But of course, when you sequence from a new environment, you also want to compare the new sequences to each other. You don’t want to compare each one individually to the reference data. And so there are a lot of methods that people have been trying to develop to build evolutionary trees of all the new sequences compared to each other.
One of the challenges with this is when you have metagenomic data in particular, the new sequences that you get might not correspond to the entire length of the reference sequences that you are analyzing. So you might have an alignment that looks like this (Figure A6-10).
One solution to this is to just trim the alignment and only pick out regions from the metagenomic data that overlap with everything in your reference database. We and other people have built methods to do this, to go through, take all the new sequences, align them to the reference data, and chop out a core region that everything has, and build an evolutionary tree of that region (Figure A6-11).
I did this by hand, to analyze the Sargasso data with ribosomal RNAs and a variety of other sequences including RecA, et cetera. All of that was done by hand. It is much better to automate this. So we have added a step in this for this ribosomal RNA pipeline. There are many other tools to do this with ribosomal RNA. Qiime (Caporaso et al., 2010), mother (Schloss et al., 2009), a lot of tools out there will build alignments for you with ribosomal RNA and help you build trees of everything. Usually these work best when you have all the sequences overlap with each other. So the challenge again is, what do you do in cases where the sequences don’t overlap with each other completely, as you would get with metagenomic data.
Again, I did this by hand but we have developed methods that can allow you to do this for protein coating sequences and compare them all to each other. So in the Sargasso data, in red were sequences from the Sargasso Sea and in black were sequences that were from genomes. So you can see how those new sequences relate to each other, in addition to how they relate to the reference data. (See Figures A6-2 and A6-3.)
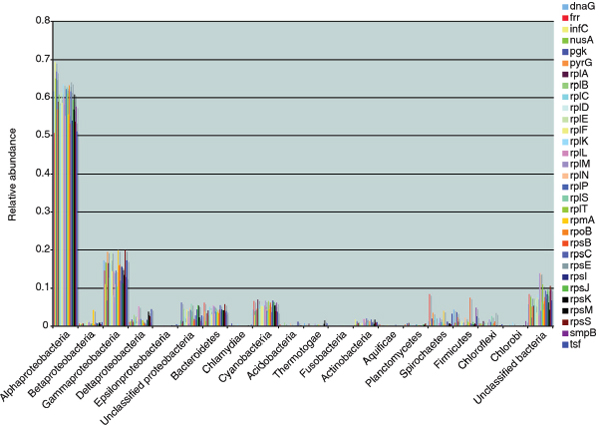
FIGURE A6-8 Major phylotypes identified in Sargasso Sea metagenomic data. The metagenomic data previously obtained from the Sargasso Sea was reanalyzed using AMPHORA and the 31 protein phylogenetic markers. The microbial diversity profiles obtained from individual markers are remarkably consistent. The breakdown of the phylotyping assignments by markers and major taxonomic groups is listed in Additional data file 5.
SOURCE: Wu and Eisen (2008).
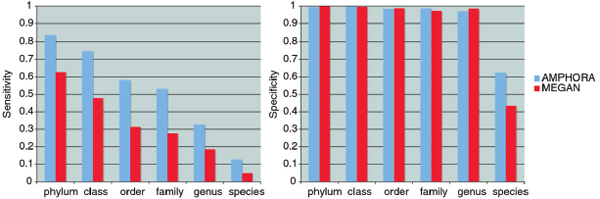
FIGURE A6-9 Comparison of the phylotyping performance by AMPHORA and MEGAN. The sensitivity and specificity of the phylotyping methods were measured across taxonomic ranks using simulated Sanger shotgun sequences of 31 genes from 100 representative bacterial genomes. The figure shows that AMPHORA significantly outperforms MEGAN in sensitivity without sacrificing specificity.
SOURCE: Wu and Eisen (2008).
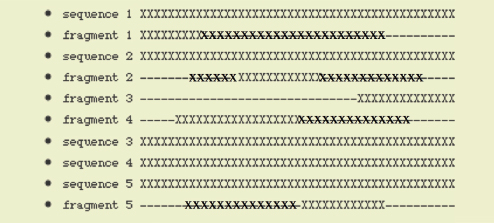
FIGURE A6-10 Hypothetical multiple sequence alignment including full length “reference” sequences as well as fragmentary sequences from metagenomic data. Xs represent areas where a sequence lines up with other sequences. Dashes represent gaps in the alignment (e.g., due to some sequences being fragments). Figure by J. A. Eisen.
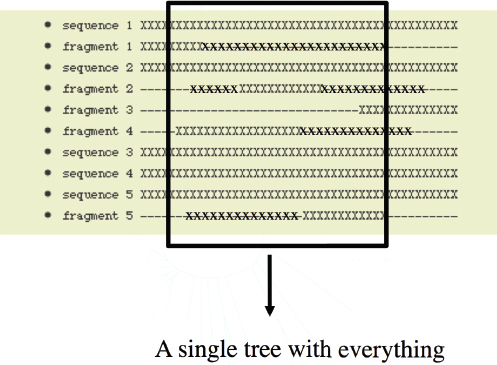
FIGURE A6-11 Hypothetical multiple sequence alignment showing one approach to carrying out phylogenetic analysis of metagenomic data—to extract a “core” region of the alignment and only analyze sequences that contain most of this core. Xs represent areas where a sequence lines up with other sequences. Dashes represent gaps in the alignment (e.g., due to some sequences being fragments). Figure by J. A. Eisen.
Method 3: All in the Family
Method 2 is limited in that it involves constraining yourself to this core region of the sequence alignment. But there are methods available that people have used, primarily in analysis of morphological data or of express sequence tag (EST) data, where you can build an evolutionary tree of sequences that don’t overlap with each other at all (Figure A6-12).
So if you have good reference data, and you have a sequence that matches the left hand of the reference data and a sequence that matches the right hand of the reference data, that is sort of like if you went to an archaeological or paleontological dig and you had a femur bone from one organism and maybe some teeth from another. And you can figure out in essence whether or not they might have come from the same organism by comparing them to references. You can do the same thing with sequences. And the latest in the phylogenetic analysis of metagenomic data has been to try and build methods that will build evolutionary trees even when sequences don’t overlap with each other at all, by using the reference sequences as your anchor.
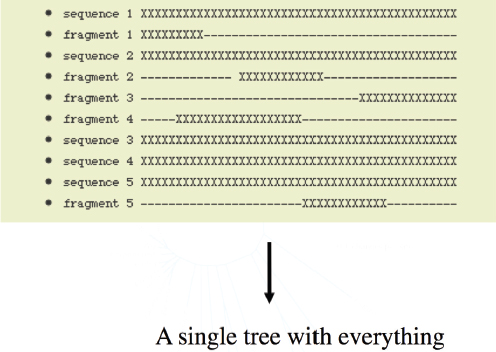
FIGURE A6-12 Hypothetical multiple sequence alignment showing an alternative strategy for phylogenetic analysis of metagenomic data—to analyze everything even if some sequences do not overlap with each other. Xs represent areas where a sequence lines up with other sequences. Dashes represent gaps in the alignment (e.g., due to some sequences being fragments). Figure by J. A. Eisen.
We have developed a few tools in my lab, in collaboration with Katie Pollard and Jessica Green that take this “all in the family” approach. One is called PhylOTU (Sharpton et al., 2011), which identifies operational taxonomic units (OTUs) using this approach (Figure A6-13).
We have another one called PhyloSift, which is like the new version of AMPHORA, that will do this for protein coating genes (see https://github.com/gjospin/PhyloSift).
There is a great method called pplacer (Matsen et al., 2010) that we have integrated in PhyloSift from Erick Matsen. That has been developed to do this exact type of thing. Again, you can build trees for sequences even if they don’t overlap with each other.
Method 4: All in the Genome
So the final frontier in this is to try and build trees, even with different genes, when they do not overlap with each other. We did a little test case of this in collaboration with Stephen Kembel and Jessica Green in Oregon, where we basically took all of the genes that we had been analyzing in that AMPHORA package,
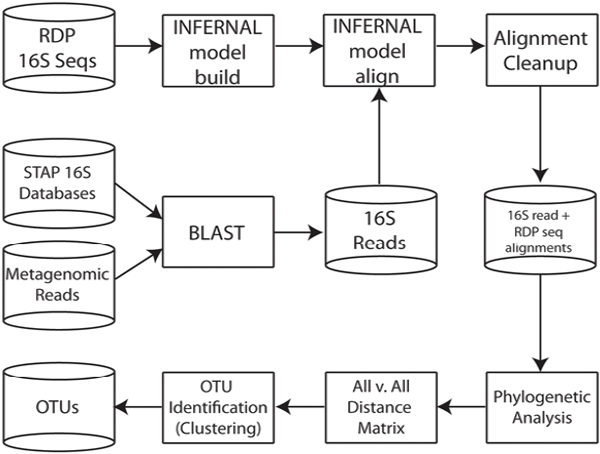
FIGURE A6-13 Computational processes are represented as squares and databases are represented as cylinders in this generalized workflow of PhylOTU.
SOURCE: Sharpton et al. (2011).
found homologues of those, and now built a reference tree of a concatenation of all of those sequences (Kembel et al., 2011). For each sequence that matched any of those individual sequences, different protein families in the environmental data, we can build an evolutionary tree that fits them relative to this anchor of the concatenated alignment of all sequences (Figures A6-14 and A6-15).
So in the long run, I think this is what we are going to want to do with environmental data, is for all genomes, build up a reference tree of all the gene families in those genomes, and then anchor environmental data to that reference tree. And you can figure out much more precisely where those sequences came from, even if they are not part of a traditional sort of evolutionary marker gene family.
Steve Kembel did this analysis, not to do phylotyping, but because he wanted an evolutionary tree to do what is called phylogenetic ecology. Many people are probably familiar with UniFrac analysis to compare the diversity of communities by their overlap in the amount of phylogenetic tree that they cover from the two communities, the unique fraction of the evolutionary tree (Figure A6-16).
That is an approach that could generally be called phylogenetic ecology. And Steve Kembel was really interested in comparing phylogenetic diversity between communities with metagenomic data. And the reason he wanted to concatenate all of these different genes was, we didn’t have enough sequences from individual
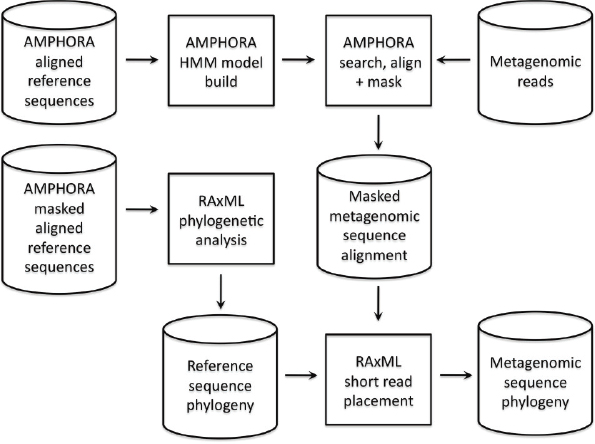
FIGURE A6-14 Conceptual overview of approach to infer phylogenetic relationships among sequences from metagenomic data sets.
SOURCE: Kembel et al. (2011).
FIGURE A6-15 Phylogenetic tree linking metagenomic sequences from 31 gene families along an oceanic depth gradient at the HOT ALOHA site (DeLong et al., 2006). The depth from which sequences were collected is indicated by bar color (green = photic zone (< 200 m depth), blue = nonphotic zone). The displayed tree is the one that was identified as having the maximum likelihood by placing metagenomic reads on a reference phylogeny inferred with a WAG + G model partitioned by gene family in RAxML (Stamatakis, 2006). The phylogeny is arbitrarily rooted at Thermus for display purposes.
SOURCE: Kembel et al. (2011).
FIGURE A6-16 Taxonomic diversity and standardized phylogenetic diversity versus depth in environmental samples along an oceanic depth gradient at the HOT ALOHA site. Taxonomic diversity is calculated as OTU richness (number of OTUs) based on binning of SSU-rRNA gene sequences into OTUs at a 95% and 99% similarity cutoff. Phylogenetic diversity is calculated as the standardized effect size of the mean pairwise phylogenetic distances (SESMPD) among SSU-rRNA gene sequences (blue symbols) and metagenomic sequences from the 31 AMPHORA gene families (red symbols). Standardized phylogenetic diversity values less than zero indicate phylogenetic clustering (sequences more closely related than expected); values greater than zero indicate phylogenetic evenness (sequences more distantly
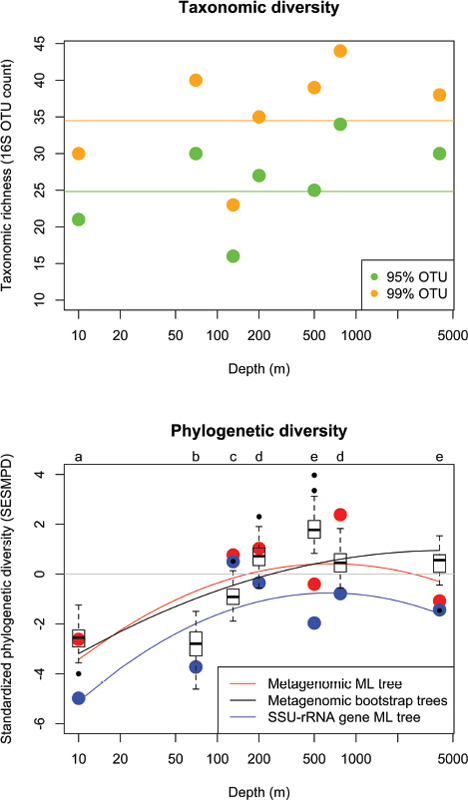
related than expected). Phylogenetic diversity was estimated from the maximum likelihood phylogenies for SSU-rRNA gene and metagenomic data, as well as for 100 replicate phylogenies inferred from the metagenomic data with a phylogenetic bootstrap (black symbols). Lines indicate best-fit from quadratic regressions of diversity versus depth; the slopes of regressions of taxonomic diversity versus depth were not significantly different than zero (P> 0.05). At all depths, standardized phylogenetic diversity across 100 bootstrap phylogenies differed significantly from the null expectation of zero (t-test, P< 0.05). Phylogenetic diversity based on the 100 bootstrap phylogenies differed significantly among samples that do not share a letter label at the top of the panel (Tukey’s HSD test, P < 0.05).
SOURCE: Kembel et al. (2011).
genes to have enough signal. But if you have 100 genes that you can analyze at once from across the genomes, you can build up enough signal to ask questions about beta diversity, et cetera, in ecological communities.
Method 5: Novel Lineages and Decluttering
So another thing that I am very interested in, and have been interested in for awhile, is to look for novel lineages in metagenomic data. We wanted to do this a long time ago, and we ran into some bioinformatic roadblocks. So what I really wanted to do was scan through metagenomic data to find whether or not there was evidence for a fourth branch in the tree, or something to that effect, things that were really phylogenetically novel compared to other sequences (Figure A6-17).
We had this problem, which was, if we did this for any type of data set, like RecA, at the time, we had something like 10,000 RecA sequences from bacteria, 200 from Archaea, and 200 from Eukaryotes. And at the time, building evolutionary trees of 10,000 sequences or more were challenging. So we wanted to sort
BOX A6-1
Questions During Talk
PARTICIPANT: (off microphone) question about long branches in Figure A6-15.
Answer: The question is what is the meaning of the especially long branches? In this case I think it is taxa that actually evolve rapidly. So in the reference data here we have some organisms like endosymbionts, mycoplasmas, et cetera, that every one of their genes evolves on a long branch. You can get artifacts in some of these cases where you have too small of a fragment, and the phylogenetic methods just get confused by that and give you a really long branch length. I don’t think that’s the case here. So I think most of the cases here are where taxa are known to evolve more rapidly. And the branch length is in essence a representation of evolutionary rate.
PARTICIPANT: (off microphone) question about meaning of colors in Figure A6-15.
Answer: The colors were different. Sorry, I didn’t want to go into the ecological detail here. What Steve analyzes was Ed DeLong’s Hawaii Ocean Time Series Data, re-analyzed that, and the colors correspond to different samples from Ed’s data. What he was asking basically was primarily whether or not phylogenetic approaches to calculating beta diversity gave different answers than taxonomic approaches to calculating beta diversity, where you just count organisms as opposed to comparing the phylogenetic relatedness of organisms. So again, it is analogous to UniFrac, but now you can do it with metagenomic data, not just with ribosomal RNA data.
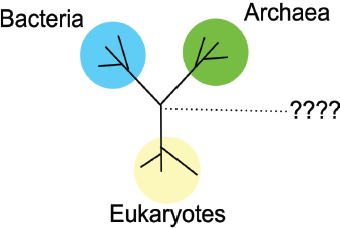
FIGURE A6-17 Searching for novel phylogenetic lineages. One key question we have been trying to answer in my lab is “Are there sequences out there that fall in between the current main groups on the tree of life?” Figure by J. A. Eisen.
of remove many of the bacterial sequences and only analyze a couple of them, as opposed to analyzing the 10,000 bacterial sequences. And what we did was develop a method that is an analog of something called Lek clustering, where you take sequences, you group them together, in essence into subfamilies, and you can identify sets of sequences that are related to each other really rapidly. And that is what we use to find, to flag different subgroups in these massive data sets of 10,000, 15,000, 100,000 sequences (Wu et al., 2011).
And when we do this for RecA or RNA polymerase or other protein family sequences, and scan through metagenomic data, you find lineages that don’t group into any known current lineages of organisms (Figures A6-18 and A6-19).
These novel sequences easily could be coming from viruses that are out there in the environment, they could be new paralogs of RecA that are previously uncharacterized. Or they could be coming from phylogenetically very novel lineages that are out there in the environment. And the way to find phylogenetically novel lineages is to build evolutionary trees of all the sequences that you can get from environmental samples. I don’t know if Jill [Banfield] is going to talk about this. I know Jill has done this and found novel archaeal lineages, for example, in metagenomic data, within the archaea. What we were looking for here was basically is there anything that can show up between bacteria, archaea, and eukaryotes. My guess is these are not cellular organisms. They are just DNA sequences, and they are probably from viruses or something to that effect. But again, phylogenetic approaches are the way to scan through this type of data to find novel lineages.
I am not going to talk about this, but phylotyping is also very useful for binning metagenomic data, for trying to pull things together into one group that corresponds to a particular organism. We have done this previously with endosymbionts, for example (Wu et al., 2006). But you can use it with any type of data.
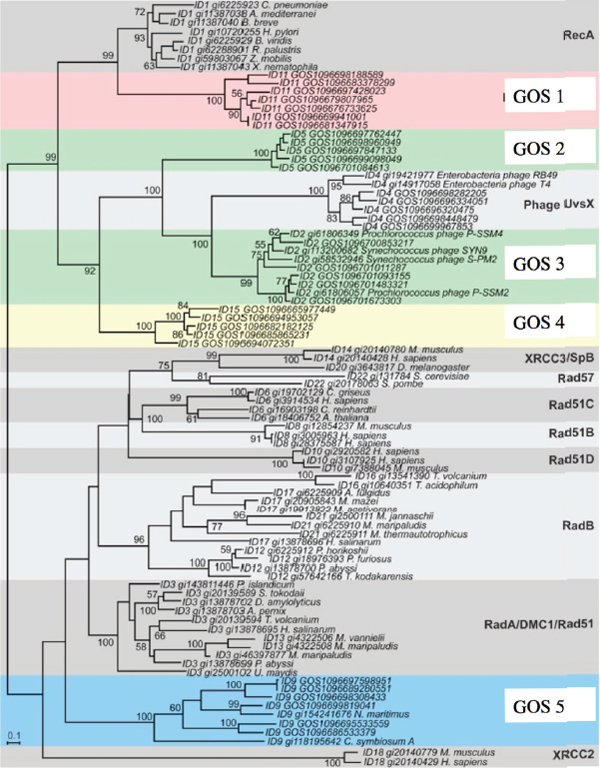
FIGURE A6-18 Phylogenetic tree of the RecA superfamily. All RecA sequences were grouped into clusters using the Lek algorithm. Representatives of each cluster that contained>2 members were then selected and aligned using MUSCLE. A phylogenetic tree was built from this alignment using PHYML; bootstrap values are based on 100 replicas. The Lek cluster ID precedes each sequence accession ID. Proposed subfamilies in the RecA superfamily are shaded and given a name on the right. Five of the proposed subfamilies contained only GOS sequences at the time of our initial analysis (RecA-like SAR, Phage SAR1, Phage SAR2, Unknown 1 and Unknown 2) and are highlighted by colored shading. As noted on the tree and in the text, sequences from two Archaea that were released after our initial analysis group in the Unknown 2 subfamily.
SOURCE: Wu et al. (2011).
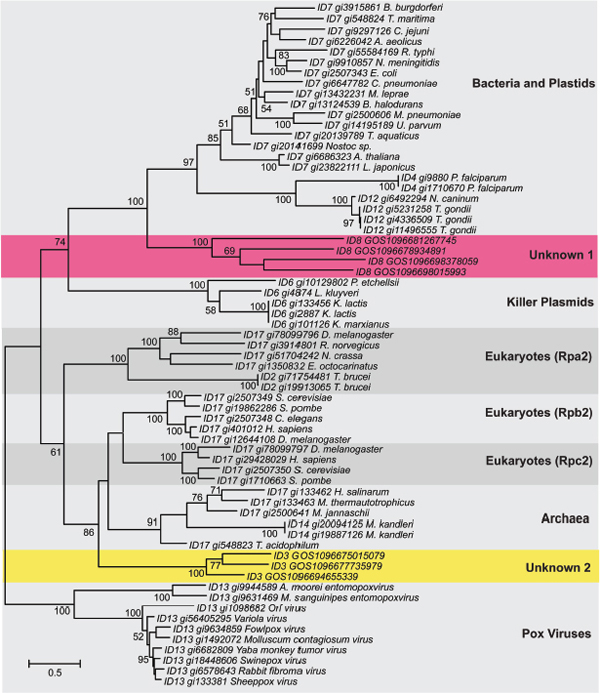
FIGURE A6-19 Phylogenetic tree of the RpoB superfamily. All RpoB sequences were grouped into clusters using the Lek algorithm. Representatives of each cluster that contained>2 members were then selected and aligned using MUSCLE. A phylogenetic tree was built from this alignment using PHYML; bootstrap values are based on 100 replicas. The Lek cluster ID precedes each sequence accession ID. Proposed subfamilies in the RpoB superfamily are shaded and given a name on the right. The two novel RpoB clades that contain only GOS sequences are highlighted by the colored panels.
SOURCE: Wu et al. (2011).
Example II: Function
So I want to shift gears. I think phylotyping is a really important area, and we are doing a lot of research on it, as are many others. And I want to shift gears just quickly to talk about a few other uses of phylogenetic analysis for studying microbial communities or microbes. And one relates to functional diversity and functional prediction, and I have spent a lot of time working on this over the years, and I have been very interested in basically when you have new sequence data, how do you make a prediction of the function of that gene.
We have talked about this a little bit at this meeting with the examples of the cytochrome, oxidases, and a few other examples here. How do you make a robust prediction for a sequence of a gene? And I think just like analyzing ribosome RNA sequences to understand an organism by building an evolutionary tree of those sequences, you should build an evolutionary tree of protein family sequences in order to understand the functional diversity in a family.
I developed an approach that I originally called phylogenomics (Figure A6-20), to do this many years ago. And [the approach] is basically: you take a sequence, you compare it to its homologues, you build an evolutionary tree of that sequence and its homologues, you overlay experimentally determined functions onto the tree. And then you use character state reconstruction methods to predict the functions of unknowns.
Sound familiar, anybody? It’s phylotyping. I in essence co-opted this from the ribosome RNA world (Figure A6-21). But you can apply it to functions as opposed to organisms. And it is a very powerful tool in predicting functions for uncharacterized genes.
Again, placing them in their phylogenetic context is incredibly powerful. I think in the interest of time I won’t go into the multiple examples that I have of this. I would be happy to talk to people about this. This is routinely used now in many genome analysis projects to build evolutionary trees of various sequences. You could do it with whatever sequences you want from environmental data as well as from sequence genomes.
The latest thing in functional prediction, which I think is really interesting, is to use non-homology functional prediction methods, which look at things like distribution of patterns of genes across organisms (e.g., see our use of phylogenetic profiling [Wu et al., 2005]). You can also use distribution patterns of genes across environments to try and help you make predictions of functions of genes. This has been done in a variety of metagenomic projects. Exactly how you group genes and analyze the correlation between the distribution pattern of a gene and the taxa present in a sample, and the metadata of the sample, is still sort of a work in progress.
We have now been collaborating with Simon Levin and others as part of a project that Simon Levin was in charge of. In this “DARPA fundamental laws of biology” project we have been working to apply non-homology methods to metagenomic data (Jiang et al., in press).
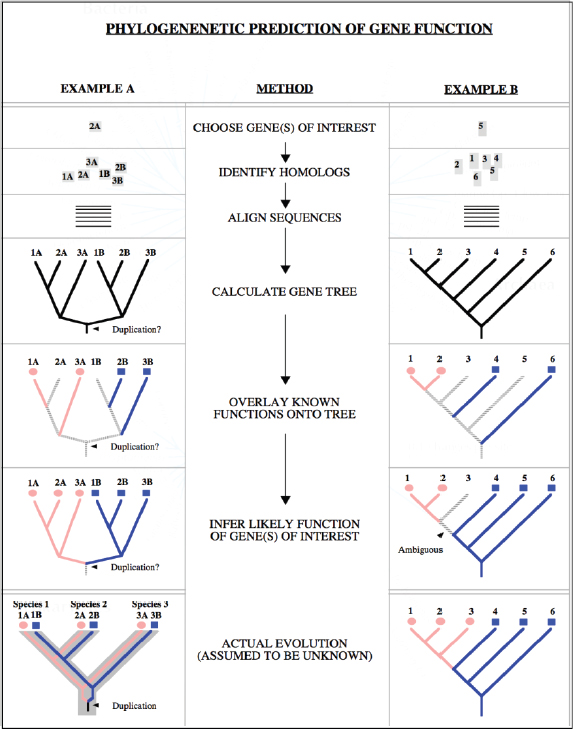
FIGURE A6-20 Outline of a phylogenomic methodology. In this method, information about the evolutionary relationships among genes is used to predict the functions of uncharacterized genes (see text for details). Two hypothetical scenarios are presented and the path of trying to infer the function of two uncharacterized genes in each case is traced. (A) A gene family has undergone a gene duplication that was accompanied by functional divergence. (B) Gene function has changed in one lineage. The true tree (which is assumed to be unknown) is shown at the bottom. The genes are referred to by numbers (which represent the species from which these genes come) and letters (which in A represent different genes within a species). The thin branches in the evolutionary trees correspond to the gene phylogeny and the thick gray branches in A (bottom) correspond to the phylogeny of the species in which the duplicate genes evolve in parallel (as paralogs). Different colors (and symbols) represent different gene functions; gray (with hatching) represents either unknown or unpredictable functions.
SOURCE: Eisen (1998).

FIGURE A6-21 Phylogenomic functional prediction is based on the concept of phylotyping. This figure is a merging of Figure 1 and Figure 20. By J. A. Eisen.
Example III: Selecting Organisms to Study
The last thing I want to talk about is this issue of selecting organisms for study. A different use of phylogenetics is to try and understand what we have known about in the diversity of life. And so if you go through the ribosomal RNA tree of life there are many different lineages of bacteria (Figure A6-22). In 2000, when we first sort of noted this ourselves, most of the genomes came from three phyla. That is still basically true. There were some genome sequences available from other lineages, but most lineages were poorly sampled. The same trend is true for eukaryotes, true for archaea, and true for viruses (e.g., see Eisen [2000]).
We had a project when I was at TIGR to sequence eight representatives of novel phyla for which genomes were not available that was funded by the National Science Foundation. More recently I have been coordinating a project called the genomic encyclopedia of bacteria and archaea at the Department of Energy (DOE) Joint Genome Institute where we have been really filling in the tree of bacteria and archaea, of cultured organisms with representative genome sequences.
This is one of these massive projects with hundreds of people involved, and it has been this amazing collaboration with the DOE JGI and the DSMZ culture collection. What we did is basically go through the tree of life, select the genomes to sequence by their phylogenetic novelty, and then ask questions about whether or not phylogeny ended up being a useful guide in selecting genome sequences. And we have shown now about five or six areas where phylogenetic sampling has improved our analysis of genome or metagenome data. So one is in functional predictions of genes, another is in discovery of genetic diversity. So a phylogenetically novel organism, if all else is equal, is more likely to have new protein families than a phylogenetically not novel organism (Figure A6-23).
And we also showed that these phylogenetically novel organisms could help you analyze metagenomic data, by providing more reference data across the tree in essence. But when we did this, there was very little benefit to analyzing the metagenomic data, from the first 50 or even 100 genomes that we sequenced from this genomic encyclopedia project (Wu et al., 2009). And the reason for this is we need to adapt many of the methods that we are doing to improve our ability to make use of this phylogenetically diverse data. So we need to design new phylogenetic methods, new metagenomic methods, to take into account this environmental data.
I have been involved in this great collaboration with Jessica Green and Katie Pollard and Martin Wu to try and develop methods to take advantage of this. It just ended. We called it ISEEM (see http://iseem.org).
This is one of the products of iSEEM, which is a tree of 2,500 genomes, that Jenna Morgan and Aaron Darling in my lab generated. We have been building new protein family markers from all of these genomes, so we can improve that AMPHORA pipeline by having hundreds to thousands of new phylogenetic markers to use to scan through metagenomic data.
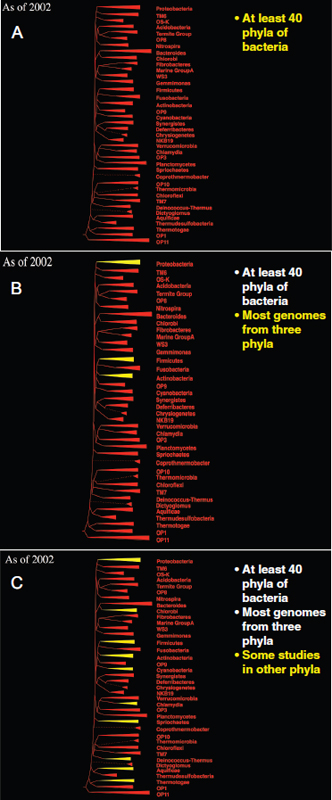
FIGURE A6-22 Phylogenetically biased genome sequencing. Phylogenetic tree is based on one from Hugenholtz 2002.
SOURCE: Adapted from Hugenholtz (2002).
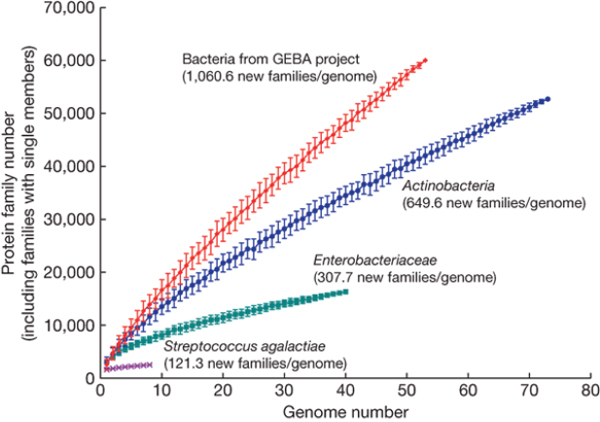
FIGURE A6-23 For each of four groupings (species, different strains of Streptococcus agalactiae; family, Enterobacteriaceae; phylum, Actinobacteria; domain, GEBA bacteria), all proteins from that group were compared to each other to identify protein families. Then the total number of protein families was calculated as genomes were progressively sampled from the group (starting with one genome until all were sampled). This was done multiple times for each of the four groups using random starting seeds; the average and standard deviation were then plotted.
SOURCE: Wu et al. (2009).
And the last thing I want to leave you with is the reason why I think this project did not really help analyze metagenomic data, which is we haven’t even begun to scratch the surface of microbial diversity in terms of reference genome data. So if you go through the tree of life, and you count the branch length in the tree, it is something called PD, or phylogenetic diversity (Figure A6-24). If you sum up the total length of the branches, for all the genomes sequenced before our project, it came to 25 units. Each genome that we added, added a lot of new units of phylogenetic diversity. It better have, because that is how we picked them. If you go through cultured organisms that are known and described—so the 8,000 or so described bacteria in archaea—we would need about 1,000 genomes to capture half of that diversity. This will be done in the next year or two. However, if you go through all the environmental data, we would need about 10,000 genomes to capture half of the diversity known 5 years ago in full-length ribosomal RNA sequences. So the vast majority of genomic diversity out there is uncaptured in most studies of cultured organisms.
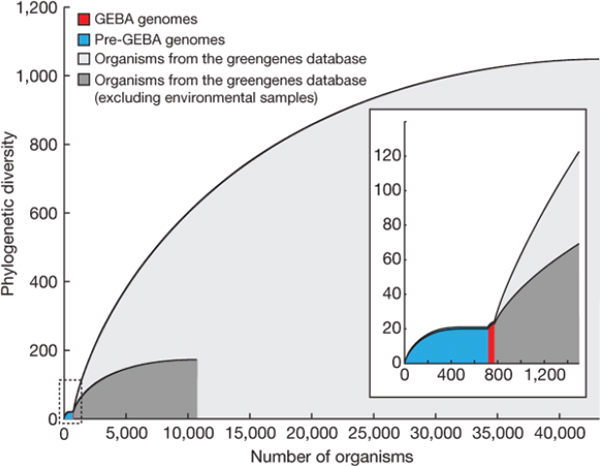
FIGURE A6-24 Using a phylogenetic tree of unique SSU rRNA gene sequences, phylogenetic diversity was measured for four subsets of this tree: organisms with sequenced genomes pre-GEBA (blue), the GEBA organisms (red), all cultured organisms (dark grey), and all available SSU rRNA genes (light grey). For each subtree, taxa were sorted by their contribution to the subtree phylogenetic diversity and the cumulative phylogenetic diversity was plotted from maximal (left) to the least (right). The inset magnifies the first 1,500 organisms. Comparison of the plots shows the phylogenetic “dark matter” left to be sampled.
SOURCE: Wu et al. (2009).
I think the solution to this is to do genomes of uncultured organisms, either via single cell capture or, as I think [meeting participants] will hear from Jill [Banfield] and other people, metagenomic sequencing and assembly of those metagenomes can generate genome data from uncultured organisms. [Note added after talk: see Narasingarao et al. (2012) for an example of this.] And by doing that, we will really fill in the tree. And that will enable all sorts of different uses of phylogeny in analysis of environmental data.
And I will leave it at that and say that of course we need experiments from across the tree, too. Sequencing is great. I love sequencing, but it doesn’t tell us everything. And what we need is an organized effort like this genomic encyclopedia to target functional diversity from across the tree of life, too. And I will leave it there.
[Update. I realize in retrospect that my “conclusion” for my talk was pretty minimal so I am adding a few sentences below to wrap up this paper.]
Conclusions
All biological entities have a history. Making sense out of biological data is best done in the context of that history. What I have tried to show in this paper are examples of how phylogenetic approaches can be useful in studies of microbial diversity. I gave three main kinds of examples—phylotyping, functional prediction, and identifying gaps in our genomic reference data. There are hundreds more, some developed by myself, most developed by others. To best understand the present, and even predict the future, we need to understand the past and how things changed over time.
References
Altschul, S. F., W. Gish, W. Miller, E. W. Myers, and D. J. Lipman. 1990. Basic local alignment search tool. Journal of Molecular Biology 215:403-410.
Caporaso, J. G., J. Kuczynski, J. Stombaugh, K. Bittinger, F. D. Bushman, E. K. Costello, N. Fierer, A. G. Peña, J. K. Goodrich, J. I. Gordon, G. A. Huttley, S. T. Kelley, D. Knights, J. E. Koenig, R. E. Ley, C. A. Lozupone, D. McDonald, B. D. Muegge, M. Pirrung, J. Reeder, J. R. Sevinsky, P. J. Turnbaugh, W. A. Walters, J. Widmann, T. Yatsunenko, J. Zaneveld, and R. Knight. 2010. QIIME allows analysis of high-throughput community sequencing data. Nature Methods 7(5):335-336.
DeLong E. F., C. M. Preston, T. Mincer, V. Rich, S. J. Hallam, N-U. Frigaard, A. Martinez, M. B. Sullivan, R. Edwards, B. Rodriguez Brito, S. W. Chisholm, and D. M. Karl. 2006. Community genomics among stratified microbial assemblages in the ocean’s interior. Science 311:496-503.
Eisen, J. A. 1998. Phylogenomics: Improving functional predictions for uncharacterized genes by evolutionary analysis. Genome Research 8(3):163-167.
Eisen, J. A. 2000. Assessing evolutionary relationships among microbes from whole genome analysis. Current Opinion in Microbiology 3:475-480.
Eisen, J. A., S. W. Smith, and C. M. Cavanaugh. 1992. Phylogenetic relationships of chemoautotrophic bacterial symbionts of Solemya velum say (Mollusca: Bivalvia) determined by 16S rRNA gene sequence analysis. Journal of Bacteriology 174(10):3416-3421.
Hugenholtz, P. 2002. Exploring prokaryotic diversity in the genomic era. Genome Biology 3(2): REVIEWS0003.
Hugenholtz, P., C. Pitulle, K. L. Hershberger, and N. R. Pace. 1998. Novel division level bacterial diversity in a Yellowstone hot spring. Journal of Bacteriology 180(2):366-376.
Jiang, X., M. G. I. Langille, R. Y. Neches, M. A. Elliot, S. A. Levin, J. A. Eisen, J. S. Weitz, and J. Dushoff. In press. Functional biogeography of ocean microbes: Dimension reduction of metagenomic data identifies biological patterns across scales. PLoS One.
Kembel, S. W., J. A. Eisen, K. S. Pollard, and J. L. Green. 2011. The phylogenetic diversity of metagenomes. PLoS ONE 6(8):e23214. doi:10.1371/journal.pone.0023214.
Matsen, F. A., R. B. Kodner, and E. V. Armbrust. 2010. pplacer: Linear time maximum-likelihood and Bayesian phylogenetic placement of sequences onto a fixed reference tree. BMC Bioinformatics 11:538.
Narasingarao, P., S. Podell, J. A. Ugalde, C. Brochier-Armanet, J. B. Emerson, J. J. Brocks, K. B. Heidelberg, J. F. Banfield, and E. E. Allen. 2012. De novo metagenomic assembly reveals abundant novel major lineage of Archaea in hypersaline microbial communities. ISME Journal 6(1):81-93. doi: 10.1038/ismej.2011.78.
Schloss, P. D., S. L. Westcott, T. Ryabin, J. R. Hall, M. Hartmann, E. B. Hollister, R. A. Lesniewski, B. B. Oakley, D. H. Parks, C. J. Robinson, J. W. Sahl, B. Stres, G. G. Thallinger, D. J. Van Horn, and C. F. Weber. 2009. Introducing mothur: Open-source, platform-independent, community-supported software for describing and comparing microbial communities. Applied Environmental Microbiology 75(23):7537-7541.
Sharpton, T. J., S. J. Riesenfeld, S. W. Kembel, J. Ladau, J. P. O’Dwyer, J. L. Green, J. A. Eisen, and K. S. Pollard. 2011. PhylOTU: A high-throughput procedure quantifies microbial community diversity and resolves novel taxa from metagenomic data. PLoS Computation Biology 7(1): e1001061.
Stamatakis, A. 2006. RAxML-VI-HPC: Maximum likelihood-based phylogenetic analyses with thousands of taxa and mixed models. Bioinformatics 22:2688-2690.
Venter, J. C., K. Remington, J. F. Heidelberg, A. L. Halpern, D. Rusch, J. A. Eisen, D. Wu, I. Paulsen, K. E. Nelson, W. Nelson, D. E. Fouts, S. Levy, A. H. Knap, M. W. Lomas, K. Nealson, O. White, J. Peterson, J. Hoffman, R. Parsons, H. Baden-Tillson, C. Pfannkoch, Y. H. Rogers, H. O. Smith HO. 2004. Environmental genome shotgun sequencing of the Sargasso Sea. Science 304(5667):66-74.
Wu, D., S. C. Daugherty, S. E. Van Aken, G. H. Pai, K. L. Watkins, H. Khouri, L. J. Tallon, J. M. Zaborsky, H. E. Dunbar, P. L. Tran, N. A. Moran, and J. A. Eisen. 2006. Metabolic complementarity and genomics of the dual bacterial symbiosis of sharpshooters. PLoS Biology 4(6):e188. doi:10.1371/journal.pbio.0040188.
Wu, M., and J. A. Eisen. 2008. A simple, fast, and accurate method of phylogenomic inference. Genome Biology 9:R151. doi:10.1186/gb-2008-9-10-r151.
Wu, D., A. Hartman, N. Ward, and J. A. Eisen. 2008. An automated phylogenetic tree-based small subunit rRNA taxonomy and alignment pipeline (STAP). PLoS ONE 3(7):e2566. doi:10.1371/journal.pone.0002566.
Wu, D., M. Wu, A. Halpern, D. B. Rusch, S. Yooseph, M. Frazier, J. C. Venter, and J. A. Eisen. 2011. Stalking the fourth domain in metagenomic data: Searching for, discovering, and interpreting novel, deep branches in marker gene phylogenetic trees. PLoS ONE 6(3):e18011. doi:10.1371/journal.pone.0018011.
Wu, D., P. Hugenholtz, K. Mavromatis, R. Pukall, E. Dalin, N. N. Ivanova, V. Kunin, L. Goodwin, M. Wu, B. J. Tindall, S. D. Hooper, A. Pati, A. Lykidis, S. Spring, I. J. Anderson, P. D’haeseleer, A. Zemla, M. Singer, A. Lapidus, M. Nolan, A. Copeland, C. Han, F. Chen, J. F. Cheng, S. Lucas, C. Kerfeld, E. Lang, S. Gronow, P. Chain, D. Bruce, E. M. Rubin, N. C. Kyrpides, H. P. Klenk, J. A. Eisen. 2009. A phylogeny-driven genomic encyclopaedia of Bacteria and Archaea. Nature 462(7276):1056-1060.
Wu, M., Q. Ren, A. S. Durkin, S. C. Daugherty, L. M. Brinkac, R. J. Dodson, R. Madupu, S. A. Sullivan, J. F. Kolonay, D. H. Haft, W. C. Nelson, L. J. Tallon, K. M. Jones, L. E. Ulrich, J. M. Gonzalez, I. B. Zhulin, F. T. Robb, and J. A. Eisen. 2005. Life in hot carbon monoxide: The complete genome sequence of Carboxydothermus hydrogenoformans Z-2901. PLoS Genetics 1(5):e65.
SOCIOMICROBIOLOGY AND QUORUM SENSING—MEDIATED COMMUNICATION
Josephine R. Chandler27and E. Peter Greenberg27
Cell-Cell Communication and Group Activities
Although bacteria were long thought to be individuals that act alone, it is now accepted that they are social creatures that can act together to exhibit a range of extraordinary group activities (Costerton et al., 1999; West et al., 2006). Many of these activities are involved in virulence and for this reason have been studied in the context of pathogenesis, but microbial social behaviors are important in a variety of other contexts (Diggle et al., 2007a). One type of social trait that has been studied extensively at the molecular level is the ability of bacteria to communicate with one another by using chemical signals. Bacterial communication can coordinate a wide range of activities in different bacterial species (Whitehead et al., 2001). Bacterial communication often, but not always, coordinates transcription as a function of population density. This type of communication is called quorum sensing (Fuqua et al., 1994). At least in some cases it is clear that quorum sensing controls cooperative activities (Diggle et al., 2007a). The following text is an adaptation of Greenberg (2011).
If one strives to really understand bacteria, social aspects of their biology cannot be ignored. Although the field is very young, we see two reasons that it is critical to study quorum sensing and control of social activities in bacteria: (1) Now that we understand that bacteria are social and we understand sociality at an unprecedented level of molecular detail in several model organisms, bacteria have become wonderful tools to study fundamental questions about the costs and benefits of cooperation, the selective pressures that lead to cooperative behaviors, and the advantages of controlling cooperative behaviors by cell-to-cell communication systems like quorum sensing. (2) There is an idea that we might be able to develop novel antivirulence therapeutics that target quorum sensing in bacterial species that control virulence gene expression by cell-to-cell signaling. Although many investigators are working to identify potent quorum sensing and biofilm inhibitors, including our own group (Banin et al., 2008; Muh et al., 2006a,b), we add a cautionary note—we currently understand very little about how, when, or where quorum sensing inhibition might be of therapeutic value.
___________
27 Department of Microbiology, University of Washington.
Quorum Sensing in Proteobacteria
In the late 1960s and early 1970s there was a very modest literature describing pheromone production and activity in bacteria (Eberhard, 1972; Tomasz, 1965). It was not until the 1980s that work on quorum sensing in marine luminescent bacteria led to the idea that these sorts of gene regulatory activities function as intercellular communication systems that coordinate group activities. Not until the 1990s did we begin to understand the prevalence of quorum sensing in bacteria. Now we know that there are many different types of bacterial cell-to-cell signaling systems considered as quorum-sensing systems. Our work focuses on acyl-homoserine lactone (acyl-HSL) quorum-sensing systems prevalent but not universal among the Proteobacteria. Acyl-HSLs are synthesized by LuxI-family enzymes and detected by LuxR-family signal receptors that are transcriptional regulators. There are related but different signals that are specific to each system (Figure A7-1). Our original model system was a marine bacterium, Vibrio fischeri, which controls a small set of about 25 or fewer genes, including genes for light production, by LuxR and 3-oxo-hexanoyl-homoserine lactone (3OC6-HSL), which is produced by the luxI gene product (Antunes et al., 2007; Engebrecht et al., 1983) (Figure A7-2A). V. fischeri exists in the light organs of specific marine animals where it produces light, which serves the mutualistic symbiosis. Of note, 3OC6-HSL moves in and out of cells by passive diffusion (Kaplan and Greenberg, 1985; Pearson et al., 1994). In this way the environmental signal concentration is a reflection of cell density. This quorum-sensing system allows V. fischeri to discriminate between its free-living low-population-density lifestyle and its high-density host-associated lifestyle. The luxI gene itself is controlled by quorum sensing—it is activated by 3OC6-HSL-bound LuxR. In terms of biology this provides hysteresis to the system. The population density required to activate quorum-controlled genes is much higher than the density required to shut down an activated system.
Later we turned our attention to the opportunistic pathogen P. aeruginosa. We learned that there were two acyl-HSL circuits, the C4-HSL-RhlI-RhlR circuit and the 3OC12-HSL-LasI-LasR circuits, and the 3OC12-HSL-responsive orphan receptor QscR, which together are required for activation of about 325 genes (Figure A7-2B) (Lee et al., 2006; Pearson et al., 1994, 1995; Schuster and Greenberg, 2006). Other investigators showed that at least under certain experimental conditions quorum-sensing mutants were impaired in virulence (Pearson et al., 2000; Tang et al., 1996), and thus the belief was that, as for V. fischeri quorum sensing, P. aeruginosa quorum sensing allowed discrimination between host and free-living states. However, it is not clear from the evidence that this is in fact the case. P. aeruginosa can use quorum sensing–controlled processes to compete with other bacteria (An et al., 2006), and this may provide an advantage in mixed microbial communities. In addition, some quorum-controlled genes are important for general metabolic processes (Schuster et al., 2003) suggesting quorum sensing may be important for regulating broad physiological changes
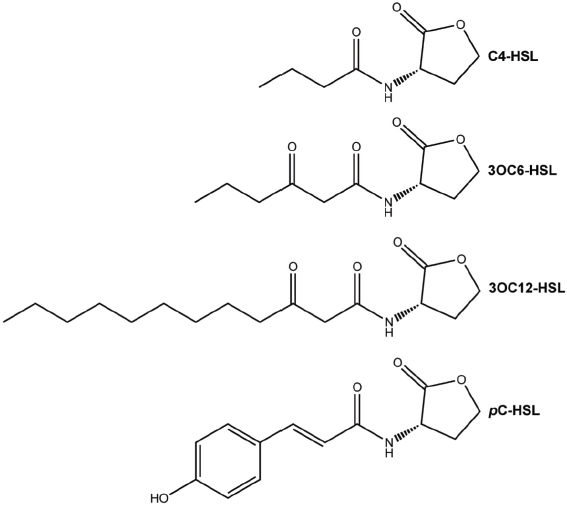
FIGURE A7-1 Some examples of acyl-HSL quorum-sensing signals. The structures and corresponding names are shown. The P. aeruginosa signal synthase RhlI produces C4-HSL and LasI produces 3OC12-HSL. The V. fischeri signal synthase LuxI produces 3OC6-HSL and the Rhodopseudomonas palustris signal synthase RpaI produces para-coumaroyl-HSL (pC-HSL).
that prepare the population for high-cell-density stress. Of note, among the 300-plus P. aeruginosa quorum-controlled genes, those coding for extracellular products like exoenzymes or production of extracellular products like phenazine pigments are grossly overrepresented in the quorum-controlled regulon (Schuster and Greenberg, 2006). In a social context these sorts of extracellular products can be considered public goods or resources produced by individuals and shared by all members of the group. Thus quorum sensing may be important to coordinate cooperative group behaviors.
Although quorum sensing promotes virulence in multiple acute infection models, many P. aeruginosa isolates from chronic human infections are lasR mutants (D’Argenio et al., 2007; Fothergill et al., 2007; Heurlier et al., 2006; Hoffman et al., 2009; Smith et al., 2006; Tingpej et al., 2007; Wilder et al., 2009). This suggests that lasR mutants have an advantage during the chronic disease
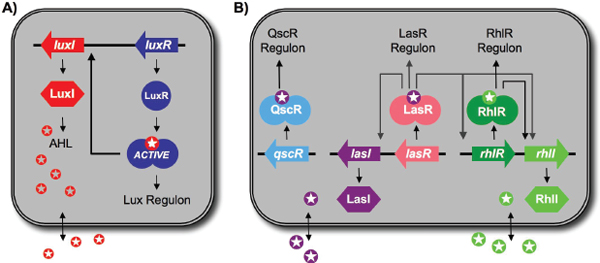
FIGURE A7-2 Acyl-HSL signaling in V. fischeri (A) and P. aeruginosa (B). Acyl-HSL signals (see Figure A7-1) are made by members of the LuxI family of signal synthases and specifically interact with LuxR family transcription factors. At high cell density, acyl-HSLs accumulate and interact with LuxR homologs. Acyl-HSL binding controls activity of LuxR family members. (A) In V. fischeri, LuxI and LuxR produce and respond to 3OC6-HSL, respectively. (B) In P. aeruginosa, the LasIR system produces and responds to 3OC12-HSL, and the RhlR system produces and responds to C4-HSL. QscR is an orphan LuxR receptor that is not linked to a luxI synthase gene. QscR responds to 3OC12-HSL produced by LasI. Each quorum-sensing regulon is shown as a distinct entity, but in reality there exist some overlapping regulation among the controlled genes.
SOURCE: Figure adapted from Majerczyk et al. (2012).
state, and in support of this, lasR mutants do exhibit specific conditional growth advantages (D’Argenio et al., 2007; Heurlier et al., 2005). Alternatively, lasR mutants may arise because they can exploit quorum sensing–intact individuals with which they coexist. This would allow them the advantage of utilizing shared quorum sensing–controlled products without the metabolic burden of producing them. For this reason, these naturally occurring quorum-sensing mutants might be social cheaters (Diggle et al., 2007b; Rumbaugh et al., 2009; Sandoz et al., 2007). It is unclear if social cheaters occur in the environment; however, a small survey of P. aeruginosa environmental isolates showed that many retained their quorum-sensing systems (Cabrol et al., 2003). P. aeruginosa is one example where the study of the social aspects of quorum sensing is particularly important to understand the possible utility of novel anti–quorum sensing therapeutics (Kohler et al., 2010; Mellbye and Schuster, 2011).
Common Themes in Quorum Sensing
Although acyl-HSL systems are found in diverse bacterial species that occupy disparate ecological niches, many of the controlled factors fall into several
general groups that are conserved. Some of the most common types are toxins (e.g., virulence factors and antimicrobials), exoenzymes (e.g., proteases), and biofilm components (e.g., extracellular polysaccharides [EPSs]) (for a review, see Majerczyk et al., 2012). The overlap of acyl-HSL-regulated targets across diverse species and environments suggests that these factors provide a general benefit to bacteria in a community structure.
Many quorum sensing–controlled processes may be most valuable when carried out in populations of a sufficient cell density. For example, biofilms consist of heterogeneous bacterial groups that organize on surfaces. Bacteria in biofilms secrete EPSs and other biofilm matrix components that surround and protect the group, but this may be a wasteful process for an isolated individual. Another idea that has been proposed is that, during interactions with a host or competitor, delayed production of immunogenic or toxic exoproducts may allow the population to avoid detection until the cell density is sufficient for the group to mount an effective attack. Thus quorum sensing is thought to either provide an efficient method to regulate metabolically expensive products, or allow the population to remain undetected in a hostile environment, or perhaps some combination of each of these. The cost savings of quorum-sensing regulation may also protect cooperating populations from invasion by noncooperating cheaters that do not produce the expensive products but can take advantage of their public availability. This idea was recently proposed as a mechanism for swarming populations to resist invasion by nonswarming cheaters (Xavier et al., 2011). It has also been proposed that acyl-HSLs could serve as a proxy for environmental diffusion potential and prevent production of secreted goods in conditions of high diffusion (Redfield, 2002). According to this hypothesis, quorum sensing also acts to efficiently regulate the production of expensive products but in this case it acts as an environmental sensor, and benefits individuals acting alone as well as individuals that are part of a group. This has been put forth as an alternative to quorum sensing, providing a nonsocial explanation of acyl-HSL signaling. In our view these two hypotheses are not exclusive of each other.
New Models to Study Quorum Sensing
Despite a large volume of research on the molecular mechanisms of quorum sensing we still do not have a clear understanding of the potential social benefits of quorum sensing. Acyl-HSL quorum-sensing systems are thought to have been established in an ancient species of Proteobacteria (Lerat and Moran, 2004) and are encoded in the genomes of many organisms with disparate lifestyles. This supports the view that quorum sensing has likely evolved to benefit bacteria in many different environments. Because many of the well-characterized quorum-sensing systems are in species that alternate between free-living and host-associated lifestyles, our current view is somewhat limited. To better understand how quorum sensing may be important in other contexts, we have recently turned our attention
to a group of three closely related Burkholderia species that have adopted distinctly different lifestyles: Burkholderia pseudomallei, an opportunistic pathogen, B. thailandensis, a nonvirulent close relative of B. pseudomallei, and B. mallei, a host-restricted pathogen that evolved from B. pseudomallei. All three species have almost identical quorum-sensing systems (Figure A7-3); QS-1, QS-3, and two orphan receptors (R4 and R5) (Ulrich et al., 2004a,b). By studying quorum sensing in this group we hope to gain new perspective on the benefits of quorum sensing in different pathogenic and nonpathogenic environments.
B. thailandensis and B. pseudomallei, but not B. mallei, contain another quorum-sensing system, QS-2, and flanking DNA encoding the biosynthetic genes for a potent, broad-spectrum antibiotic called bactobolin (Carr et al., 2011; Duerkop et al., 2009; Seyedsayamdost et al., 2010) (Figure A7-3). The absence of this genetic content in B. mallei supports the idea that QS-2 and bactobolin are important for saprophytic growth outside of the host. Many other saprophytic Proteobacteria also use quorum sensing to control the production of antimicrobials, including species of Pseudomonas (Bainton et al., 1992; McGowan et al., 1995; Park et al., 2001; Pierson et al., 1994), suggesting that quorum sensing–controlled antibiotic production may be commonly used to compete in mixed-species environments. Our group and others have become interested in understanding why quorum sensing is often used to control antibiotics in saprophytes (Hibbing et al., 2010). To address this we developed a dual-species experimental competition model and a related in silico model (Chandler et al., 2012). The results suggested that quorum sensing may be important for competition and
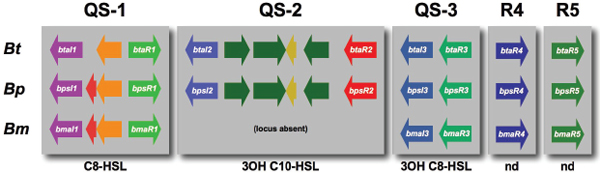
FIGURE A7-3 The quorum-sensing circuits of B. thailandensis, B. pseudomallei, and B. mallei. The figure shows the genetic context of the homologous quorum-sensing circuits (QS-1, QS-2, and QS-3) in B. thailandensis (Bt), B. pseudomallei (Bp), andB. mallei (Bm). The cognate signal of each system is shown below. The signals that bind the orphan LuxR homologs have not been determined (nd). The genes for the QS-1 LuxIR homologs are separated by a small region that contains one to two open reading frames (ORFs) of unknown function. The genes coding for the QS-2 LuxIR homologs are found within the bactobolin biosynthetic gene cluster and are separated by three ORFs predicted to contribute to bactobolin synthesis. The genes coding for the LuxIR homologs of the QS-3 system are separated by a small intergenic region that does not contain additional ORFs.
SOURCE: Figure adapted from Majerczyk et al. (2012).
that the ability to sense and respond to acyl-HSLs from another species, which we have called eavesdropping, may provide an advantage in some situations. The in silico modeling also suggested that quorum sensing may serve to delay the cost of producing antibiotics until the population can produce a sufficient concentration to kill a competitor (Chandler et al., 2012). This idea is difficult to probe experimentally, but we can now do this with the dual-species model we have developed. This model may fall under the category of “synthetic ecology” and is one example of the new types of systems being developed to probe unanswered questions about the social benefits of quorum sensing.
There has been a recent effort to probe the social benefits of quorum sensing in single-species culture. Investigators have devised experiments where growth of P. aeruginosa requires quorum sensing. This can be accomplished by providing protein as the sole source of carbon and energy. Growth requires quorum sensing–induced production of the exoproteases. In this setting LasR quorum-sensing mutants will emerge and become a stable, significant minority of the overall population. These cheaters or free-loaders do not bear the cost of contributing to the public good (elastase in this case) but they benefit from use of the public goods (Sandoz et al., 2007). This system has been used to study the ability of lasR, rhlR, and qscR mutants to invade a quorum sensing–intact population (Wilder et al., 2011) and to show that secretion of elastase is more beneficial to populations at high density than to populations at low density (Darch et al., 2012). These types of studies provide support for the long-held view that quorum sensing can be used to control and coordinate cooperative activities that benefit individuals within groups of bacteria.
Concluding Comments
This article seeks to highlight the importance of studying cell-to-cell communication in the context of the emerging field of sociomicrobiology. The article emphasizes quorum sensing in Proteobacteria and provides examples where quorum sensing serves to allow individuals of a species to communicate. This rudimentary form of chemical communication serves to coordinate certain group behaviors, such as the production of antibiotics, exoenzymes such as proteases, and biofilm matrix components. New models are being developed to understand the connection between quorum sensing and cooperation. Because this is an emerging field we currently know very little about how communication is important for cooperation, and how this may influence the evolution of quorum-sensing systems in different pathogenic and nonpathogenic environments. These types of studies are critical to understand fundamental principles of cooperation in bacteria as well as to acquire information needed to develop novel therapeutics to treat microbial diseases.
References
An, D., T. Danhorn, C. Fuqua, M. R. Parsek. 2006. Quorum sensing and motility mediate interactions between Pseudomonas aeruginosa and Agrobacterium tumefaciens in biofilm cocultures. Proceedings of the National Academy of Sciences of the United States of America 103:3828-3833.
Antunes, L. C., A. L. Schaefer, R. B. Ferreira, N. Qin, A. M. Stevens, E. G. Ruby, and E. P. Greenberg. 2007. Transcriptome analysis of the Vibrio fischeri LuxR-LuxI regulon. Journal of Bacteriology 189:8387-8391.
Bainton, N. J., P. Stead, S. R. Chhabra, B. W. Bycroft, G. P. Salmond, G. W. Stewart, and P. Williams. 1992. N-(3-oxohexanoyl)-L-homoserine lactone regulates carbapenem antibiotic production in Erwinia carotovora. Biochemical Journal 288(Pt 3):997-1004.
Banin, E., A. Lozinski, K. M. Brady, E. Berenshtein, P. W. Butterfield, M. Moshe, M. Chevion, E. P. Greenberg, and E. Banin. 2008. The potential of desferrioxamine-gallium as an anti-Pseudomonas therapeutic agent. Proceedings of the National Academy of Sciences of the United States of America 105:16761-16766.
Cabrol, S., A. Olliver, G. B. Pier, A. Andremont, and R. Ruimy. 2003. Transcription of quorumsensing system genes in clinical and environmental isolates of Pseudomonas aeruginosa. Journal of Bacteriology 185:7222-7230.
Carr, G., M. R. Seyedsayamdost, J. R. Chandler, E. P. Greenberg, and J. Clardy. 2011. Sources of diversity in bactobolin biosynthesis by Burkholderia thailandensis E264. Organic Letters 13:3048-3051.
Chandler, J. R., S. Heilmann, J. E. Mittler, and E. P. Greenberg. 2012. Acyl-homoserine lactone-dependent eavesdropping promotes competition in a laboratory co-culture model. ISME Journal [Epub ahead of print].
Costerton, J. W., P. S. Stewart, and E. P. Greenberg. 1999. Bacterial biofilms: A common cause of persistent infections. Science 284:1318-1322.
Darch, S. E., S. A. West, K. Winzer, and S. P. Diggle. 2012. Density-dependent fitness benefits in quorum-sensing bacterial populations. Proceedings of the National Academy of Sciences of the United States of America 109:8259-8263.
D’Argenio, D. A., M. Wu, L. R. Hoffman, H. D. Kulasekara, E. Deziel, E. E. Smith, H. Nguyen, R. K. Ernst, T. J. Freeman Larson, D. H. Spencer, M. Brittnacher, H. S. Hayden, S. Selgrade, M. Klausen, D. R. Goodlett, J. L. Burns, B. W. Ramsey, and S. I. Miller. 2007. Growth phenotypes of Pseudomonas aeruginosa lasR mutants adapted to the airways of cystic fibrosis patients. Molecular Microbiology 64:512-533.
Diggle, S. P., A. Gardner, S. A. West, and A. S. Griffin. 2007a. Evolutionary theory of bacterial quorum sensing: When is a signal not a signal? Philosophical Transactions of the Royal Society B: Biological Sciences 362:1241-1249.
Diggle, S. P., A. S. Griffin, G. S. Campbell, and S. A. West. 2007b. Cooperation and conflict in quorum-sensing bacterial populations. Nature 450:411-414.
Duerkop, B. A., J. Varga, J. R. Chandler, S. B. Peterson, J. P. Herman, M. E. Churchill, M. R. Parsek, W. C. Nierman, and E. P. Greenberg. 2009. Quorum-sensing control of antibiotic synthesis in Burkholderia thailandensis. Journal of Bacteriology 191:3909-3918.
Eberhard, A. 1972. Inhibition and activation of bacterial luciferase synthesis. Journal of Bacteriology 109:1101-1105.
Engebrecht, J., K. Nealson, and M. Silverman. 1983. Bacterial bioluminescence: Isolation and genetic analysis of functions from Vibrio fischeri. Cell 32:773-781.
Fothergill, J. L., S. Panagea, C. A. Hart, M. J. Walshaw, T. L. Pitt, and C. Winstanley. 2007. Widespread pyocyanin over-production among isolates of a cystic fibrosis epidemic strain. BMC Microbiology 7:45.
Fuqua, W. C., S. C. Winans, and E. P. Greenberg. 1994. Quorum sensing in bacteria: The LuxR-LuxI family of cell density-responsive transcriptional regulators. Journal of Bacteriology 176: 269-275.
Greenberg, E. P. 2011. The new science of sociomicrobiology and the realm of synthetic and systems ecology. In The science and applications of synthetic and systems biology: Workshop summary. Institute of Medicine. Washington DC: The National Academies Press. Pp. 213-221.
Heurlier, K., V. Denervaud, M. Haenni, L. Guy, V. Krishnapillai, and D. Haas. 2005. Quorum-sensing-negative (lasR) mutants of Pseudomonas aeruginosa avoid cell lysis and death. Journal of Bacteriology 187:4875-4883.
Heurlier, K., V. Denervaud, and D. Haas. 2006. Impact of quorum sensing on fitness of Pseudomonas aeruginosa. International Journal of Medical Microbiology 296:93-102.
Hibbing, M. E., C. Fuqua, M. R. Parsek, and S. B. Peterson. 2010. Bacterial competition: Surviving and thriving in the microbial jungle. Nature Reviews Microbiology 8:15-25.
Hoffman, L. R., H. D. Kulasekara, J. Emerson, L. S. Houston, J. L. Burns, B. W. Ramsey, and S. I. Miller. 2009. Pseudomonas aeruginosa lasR mutants are associated with cystic fibrosis lung disease progression. Journal of Cystic Fibrosis 8:66-70.
Kaplan, H. B., and E. P. Greenberg. 1985. Diffusion of autoinducer is involved in regulation of the Vibrio fischeri luminescence system. Journal of Bacteriology 163:1210-1214.
Kohler, T., G. G. Perron, A. Buckling, and C. van Delden. 2010. Quorum sensing inhibition selects for virulence and cooperation in Pseudomonas aeruginosa. PLoS Pathogens 6:e1000883.
Lee, J. H., Y. Lequette, and E. P. Greenberg. 2006. Activity of purified QscR, a Pseudomonas aeruginosa orphan quorum-sensing transcription factor. Molecular Microbiology 59:602-609.
Lerat, E., and N. A. Moran. 2004. The evolutionary history of quorum-sensing systems in bacteria. Molecular Biology and Evolution 21:903-913.
Majerczyk, C. D., E. P. Greenberg, and J. R. Chandler. 2012. Quorum sensing in Burkholderia. In Regulation of bacterial virulence, edited by M. L. Vasil and A. J. Darwin. Washington, DC: ASM Press.
McGowan, S., M. Sebaihia, S. Jones, B. Yu, N. Bainton, P. F. Chan, B. Bycroft, G. S. Stewart, P. Williams, and G. P. Salmond. 1995. Carbapenem antibiotic production in Erwinia carotovora is regulated by CarR, a homologue of the LuxR transcriptional activator. Microbiology 141(Pt 3):541-550.
Mellbye, B., and M. Schuster. 2011. The sociomicrobiology of antivirulence drug resistance: A proof of concept. mBio 2.
Muh, U., B. J. Hare, B. A. Duerkop, M. Schuster, B. L. Hanzelka, R. Heim, E. R. Olson, and E. P. Greenberg. 2006a. A structurally unrelated mimic of a Pseudomonas aeruginosa acyl-homoserine lactone quorum-sensing signal. Proceedings of the National Academy of Sciences of the United States of America 103(45):16948-16952.
Muh, U., M. Schuster, R. Heim, A. Singh, E. R. Olson, and E. P. Greenberg. 2006b. Novel Pseudomonas aeruginosa quorum-sensing inhibitors identified in an ultra-high-throughput screen. Antimicrobial Agents and Chemotherapy 50:3674-3679.
Park, J. H., J. Hwang, J. W. Kim, S. O. Lee, B. A. Conway, E. P. Greenberg, and K. Lee. 2001. Characterization of quorum-sensing signaling molecules produced by Burkholderia cepacia G4. Journal of Microbiology and Biotechnology 11:804-811.
Pearson, J. P., K. M. Gray, L. Passador, K. D. Tucker, A. Eberhard, B. H. Iglewski, and E. P. Greenberg. 1994. Structure of the autoinducer required for expression of Pseudomonas aeruginosa virulence genes. Proceedings of the National Academy of Sciences of the United States of America 91:197-201.
Pearson, J. P., L. Passador, B. H. Iglewski, and E. P. Greenberg. 1995. A second N-acylhomoserine lactone signal produced by Pseudomonas aeruginosa. Proceedings of the National Academy of Sciences of the United States of America 92:1490-1494.
Pearson, J. P., M. Feldman, B. H. Iglewski, and A. Prince. 2000. Pseudomonas aeruginosa cell-to-cell signaling is required for virulence in a model of acute pulmonary infection. Infection and Immunity 68:4331-4334.
Pierson, L. S., 3rd, V. D. Keppenne, and D. W. Wood. 1994. Phenazine antibiotic biosynthesis in Pseudomonas aureofaciens 30-84 is regulated by PhzR in response to cell density. Journal of Bacteriology 176:3966-3974.
Redfield, R. J. 2002. Is quorum sensing a side effect of diffusion sensing? Trends in Microbiology 10:365-370.
Rumbaugh, K. P., S. P. Diggle, C. M. Watters, A. Ross-Gillespie, A. S. Griffin, and S. A. West. 2009. Quorum sensing and the social evolution of bacterial virulence. Current Biology 19:341-345.
Sandoz, K. M., S. M. Mitzimberg, and M. Schuster. 2007. Social cheating in Pseudomonas aeruginosa quorum sensing. Proceedings of the National Academy of Sciences of the United States of America 104:15876-15881.
Schuster, M., and E. P. Greenberg. 2006. A network of networks: Quorum-sensing gene regulation in Pseudomonas aeruginosa. International Journal of Medical Microbiology 296:73-81.
Schuster, M., C. P. Lostroh, T. Ogi, and E. P. Greenberg. 2003. Identification, timing, and signal specificity of Pseudomonas aeruginosa quorum-controlled genes: A transcriptome analysis. Journal of Bacteriology 185:2066-2079.
Seyedsayamdost, M. R., J. R. Chandler, J. A. Blodgett, P. S. Lima, B. A. Duerkop, K. Oinuma, E. P. Greenberg, and J. Clardy. 2010. Quorum-sensing-regulated bactobolin production by Burkholderia thailandensis E264. Organic Letters 12:716-719.
Smith, E. E., D. G. Buckley, Z. Wu, C. Saenphimmachak, L. R. Hoffman, D. A. D’Argenio, S. I. Miller, B. W. Ramsey, D. P. Speert, S. M. Moskowitz, J. L. Burns, R. Kaul, and M. V. Olson. 2006. Genetic adaptation by Pseudomonas aeruginosa to the airways of cystic fibrosis patients. Proceedings of the National Academy of Sciences of the United States of America 103:8487-8492. Tang, H. B., E. DiMango, R. Bryan, M. Gambello, B. H. Iglewski, J. B. Goldberg, and A. Prince. 1996. Contribution of specific Pseudomonas aeruginosa virulence factors to pathogenesis of pneumonia in a neonatal mouse model of infection. Infection and Immunitiy 64:37-43.
Tingpej, P., L. Smith, B. Rose, H. Zhu, T. Conibear, K. Al Nassafi, J. Manos, M. Elkins, P. Bye, M. Wilcox, S. Bell, C. Wainwright, and C. Harbour. 2007. Phenotypic characterization of clonal and nonclonal Pseudomonas aeruginosa strains isolated from lungs of adults with cystic fibrosis. Journal of Clinical Microbiology 45:1697-1704.
Tomasz, A. 1965. Control of the competent state in Pneumococcus by a hormone-like cell product: An example for a new type of regulatory mechanism in bacteria. Nature 208:155-159.
Ulrich, R. L., D. Deshazer, E. E. Brueggemann, H. B. Hines, P. C. Oyston, and J. A. Jeddeloh. 2004a. Role of quorum sensing in the pathogenicity of Burkholderia pseudomallei. Journal of Medical Microbiology 53:1053-1064.
Ulrich, R. L., H. B. Hines, N. Parthasarathy, and J. A. Jeddeloh. 2004b. Mutational analysis and biochemical characterization of the Burkholderia thailandensis DW503 quorum-sensing network. Journal of Bacteriology 186:4350-4360.
West, S. A., A. S. Griffin, A. Gardner, and S. P. Diggle. 2006. Social evolution theory for microorganisms. Nature Reviews Microbiology 4:597-607.
Whitehead, N. A., A. M. Barnard, H. Slater, N. J. Simpson, and G. P. Salmond. 2001. Quorum-sensing in Gram-negative bacteria. FEMS Microbiology Reviews 25:365-404.
Wilder, C. N., G. Allada, and M. Schuster. 2009. Instantaneous within-patient diversity of Pseudomonas aeruginosa quorum-sensing populations from cystic fibrosis lung infections. Infection and Immunitiy 77:5631-5639.
Wilder, C. N., S. P. Diggle, and M. Schuster. 2011. Cooperation and cheating in Pseudomonas aeruginosa: The roles of the las, rhl and pqs quorum-sensing systems. ISME Journal 5:1332-1343.
Xavier, J. B., W. Kim, and K. R. Foster. 2011. A molecular mechanism that stabilizes cooperative secretions in Pseudomonas aeruginosa. Molecular Microbiology 79:166-179.
ACYL-HOMOSERINE LACTONE-DEPENDENT EAVESDROPPING PROMOTES COMPETITION IN A LABORATORY CO-CULTURE MODEL28
Josephine R. Chandler,29Silja Heilmann,30John E. Mittler,29and E. Peter Greenberg29
Many Proteobacteria use acyl-homoserine lactone (AHL)-mediated quorum sensing to activate the production of antibiotics at high cell density. Extracellular factors like antibiotics can be considered public goods shared by individuals within a group. Quorum-sensing control of antibiotic production may be important for protecting a niche or competing for limited resources in mixed bacterial communities. To begin to investigate the role of quorum sensing in interspecies competition, we developed a dual-species co-culture model using the soil saprophytes Burkholderia thailandensis (Bt) and Chromobacterium violaceum (Cv). These bacteria require quorum sensing to activate the production of antimicrobial factors that inhibit growth of the other species. We demonstrate that quorumsensing-dependent antimicrobials can provide a competitive advantage to either Bt or Cv by inhibiting growth of the other species in co-culture. Although the quorum-sensing signals differ for each species, we show that the promiscuous signal receptor encoded by Cv can sense signals produced by Bt, and that this ability to eavesdrop on Bt can provide Cv an advantage in certain situations. We use an in silico approach to investigate the effect of eavesdropping in competition, and show conditions where early activation of antibiotic production resulting from eavesdropping can promote competitiveness. Our work supports the idea that quorum sensing is important for interspecies competition and that promiscuous signal receptors allow eavesdropping on competitors in mixed microbial habitats.
___________
28 Reprinted with kind permission from Nature Publishing Group.
29 Department of Microbiology, University of Washington School of Medicine, Seattle, WA, USA.
30 Center for Models of Life, Niels Bohr Institute, University of Copenhagen, Copenhagen, Denmark. Correspondence: EP Greenberg, Department of Microbiology, University of Washington School of Medicine, 1705 North East Pacific Street, Campus Box 357242, Seattle, WA 98195-7242, USA.
E-mail: epgreen@u.washington.edu
Received 30 January 2012; revised 3 May 2012; accepted 10 May2012
The ISME Journal advance online publication, 5 July 2012; doi:10.1038/ismej.2012.69
Subject Category: microbe–microbe and microbe–host interactions Keywords: Burkholderia; Chromobacterium; cell–cell communication; microbial competition; quorum sensing; eavesdropping
Introduction
Quorum sensing affords bacteria the ability to control the expression of specific genes in a cell density-dependent manner (Fuqua et al., 1994, 2001; Bassler, 2002; Waters and Bassler, 2005). Many species of Proteobacteria use small molecules, acylated homoserine lactones (AHLs), as quorumsensing signals. AHLs are produced by LuxI family synthases, and specifically interact with cytoplasmic LuxR family transcription factors to influence gene expression. AHL specificity is defined by the nature of the acyl side group. AHLs can diffuse through lipid bilayers and thus can move out of and into cells by diffusion. Because of the signal diffusibility, AHLs must reach a critical environmental concentration before they cause changes in gene expression. It is common that the AHL synthase gene is among the genes activated, creating a positive feedback loop that results in increased production of signal (Engebrecht et al., 1983; Seed et al., 1995; Latifi et al., 1996; Duerkop et al., 2009; Stauff and Bassler, 2011). Thus, AHL signaling can coordinate population-wide changes in a cell density-dependent manner.
Quorum-sensing-regulated genes are predominated by those required for the production of shared “public goods,” such as secreted or excreted factors. One commonly occurring example is antimicrobials. Quorum-controlled antimicrobials have been described in many saprophytic Proteobacteria including Erwinia carotovora (Bainton et al., 1992), Pseudomonas aeruginosa (Kownatzki et al., 1987; Bainton et al., 1992; Gallagher and Manoil, 2001; Ran et al., 2003; Schuster and Greenberg, 2006), Burkholderia thailandensis (Bt) (Duerkop et al., 2009) and Chromobacterium violaceum (Cv) (Latifi et al., 1995; McClean et al., 1997). Although some groups have proposed that antimicrobial activity of secondary metabolites is a side effect and the primary function of these compounds is as signals (Davies et al., 2006; Yim et al., 2007), the classic view is that they are used for competition with other strains or species in multi-species environments. This classic view suggests that quorum sensing may be important for interspecies competition. Quorum sensing is best understood in the context of virulence, and few studies have addressed its importance in competition (Mazzola et al., 1992; Moons et al., 2005, 2006; An et al., 2006). The advantage of using quorum sensing to control the production of antimicrobials is unknown, but it may allow a population to coordinate delivery of a sudden killing dose that deprives competitors of the ability to adapt during exposure to subinhibitory antimicrobial concentrations (Hibbing et al., 2010, D An and M Parsek, unpublished). Quorum sensing may also defer production of an antimicrobial to minimize the metabolic cost of production.
We are interested in the connection between quorum sensing and production of antibiotics, and specifically whether quorum-sensing-controlled antibiotics are important for interspecies competition. Thus, we developed a dual-bacterial species model with two soil saprophytes, Bt and Cv. Although it is not unlikely that these species coexist in nature, we selected this pair of bacteria because we have a base of knowledge about their quorumsensing systems, about quorum-sensing control of antibiotic synthesis and because these species exhibit similar laboratory
growth characteristics. The Bt genome encodes three LuxR–LuxI pairs. The BtaI1–R1 pair produces and responds to octanoyl-HSL (C8-HSL). Little is known about the genes controlled by this system, but it facilitates clumping under some conditions (Chandler et al., 2009). BtaI3 is a 3-hydroxy-octanoyl-HSL synthase, but little is known about BtaI3–R3 (Chandler et al., 2009). Finally, BtaR2–I2 senses and produces 3-hydroxy-octanoyl-HSL and 3-hydroxy-decanoyl-HSL (Duerkop et al., 2009). The BtaR2–I2 system activates btaI2 and a set of genes responsible for the production of a family of hydrophilic antibiotics, the bactobolins, that have activity against a broad range of bacterial species (Duerkop et al., 2009; Seyedsayamdost et al., 2010; Carr et al., 2011) including Cv (see below). The most potent of these is bactobolin A (Carr et al., 2011).
Cv has a single AHL circuit, the CviR–CviI quorum-sensing system. This circuit activates genes required for the production of a purple pigment called violacein and related compounds that have broad-spectrum antimicrobial activity (McClean et al., 1997). We found that Bt is resistant to purified violacein, but shows sensitivity to other quorum-sensing-dependent factors produced by Cv. The CviI-produced AHL signal is hexanoyl-HSL (C6-HSL), and although CviR is a C6-HSLresponsive transcription factor, it is promiscuous and also responds to a number of different AHL signals (McClean et al., 1997; Swem et al., 2009). This promiscuity may allow Cv to eavesdrop on other AHL-producing species. There are now a number of examples of Proteobacteria with promiscuous LuxR homologs (Pierson et al., 1998; Riedel et al., 2001; Steidle et al., 2001; Venturi et al., 2004; Dulla and Lindow, 2009; Ahlgren et al., 2011; Hosni et al., 2011). It is not known if AHL receptor promiscuity provides any advantage over more signal-specific receptors.
We report here that quorum-sensing-dependent production of antimicrobials can provide a competitive advantage to either Bt or Cv by inhibiting growth of the other species in co-culture. We also present evidence that although Bt and Cv produce different AHLs, the promiscuous signal receptor of Cv can sense Bt signals, and that this ability to eavesdrop on Bt can provide a competitive advantage to Cv. We describe a mathematical model of our dual species system and use this model to show that eavesdropping can promote fitness during competition as long as the population can produce sufficient antibiotic to kill the competitor. Our results support the idea that quorum sensing is important for interspecies competition and that promiscuous signal receptors promote fitness in some situations by enabling eavesdropping on AHLs produced by competitors.
Materials and Methods
Bacterial Strains and Growth
Strains and plasmids are described in the Supplementary Text and Supplementary Table S1. All bacteria were grown in Luria–Bertani (LB) broth containing morpholinepropanesulfonic acid (50mM; pH 7). Bactobolin Awas generously
supplied by Jon Clardy (Seyedsayamdost et al., 2010) and dissolved in filter-sterilized water. Synthetic C6-HSL and purified violacein were purchased from Sigma-Aldrich (St Louis, MO, USA) and dissolved in acidified ethyl acetate (0.1 ml l–1 glacial acetic acid) or in dimethylformamide, respectively. AHLs were prepared from the Bt bactobolin – strain BD20 by extracting stationary-phase (OD600 8–10) culture fluid with two equal volumes of acidified ethyl acetate and drying to completion under a stream of nitrogen gas. The dried extracts were dissolved in volumes of media equivalent to the volumes from which they were extracted. The extracts did not affect growth of Bt or Cv. Extracts similarly prepared from cultures of an AHL–, bactobolin– double mutant had no effect on the outcome of co-culture experiments. Co-cultures and cultures for AHL preparation were grown at 30 °C. All other growth was at 30 °C for Cv and 37 °C for Bt. Pure cultures and co-cultures containing visibly aggregated cells of Cv were dispersed by homogenization or waterbath sonication before plating for viable counts. Gentamicin was used at 10 µgml–1 (Cv and Escherichia coli) or 100 µgml–1 (Bt) and trimethoprim was used at 100 µgml–1. For selection of Bt and Cv transconjugants, gentamicin was at 10 µgml–1 and trimethoprim was at 100 µgml–1.
Antimicrobial Susceptibility Testing
We determined the minimum inhibitory concentration of bactobolin or violacein using a protocol modified from the 2003 guidelines of the Clinical and Laboratory Standards Institute (CLSI, formerly NCCLS). Inocula were prepared from logarithmicphase cultures and suspended to 5×10⁶ cells in 1ml morpholinepropanesulfonic acid-buffered LB containing dilutions of antibiotic compounds. The minimum inhibitory concentration was defined as the lowest concentration (µgml–1) that prevented visible growth of bacteria after 24 h. To assess susceptibility to cell culture fluid, bacteria were similarly suspended in a broth with 10% (Bt) or 75% (Cv) (vol vol–1) filtered fluid from stationaryphase cultures grown for 24 or 16 h, respectively. Culture fluid was filtered through a 0.22-µm pore-size membrane and tested immediately. Fluid from cultures of Cv was diluted into 4 × concentrated LB to a 1× final LB concentration. Cv and Bt were treated for 24 and 10 h, respectively, before plating for viability. All antimicrobial susceptibility testing was at 30 °C with shaking.
Co-Culture Experiments
To inoculate co-cultures, pure cultures were grown to mid-logarithmic phase, subcultured to fresh medium at an optical density at 600nm (OD600) 0.05 and grown an additional 3 h before combining at the appropriate ratios in 10 ml (Figures A8-1 and A8-2) or 20 ml (Figures A8-3 and A8-4) of medium in 125-ml culture flasks. The initial OD600 of the co-culture was 0.05 (2–4×10⁷ cells per ml) for Bt and 0.005 (2–4×10⁶ cells per ml) for Cv. Co-cultures were incubated with shaking
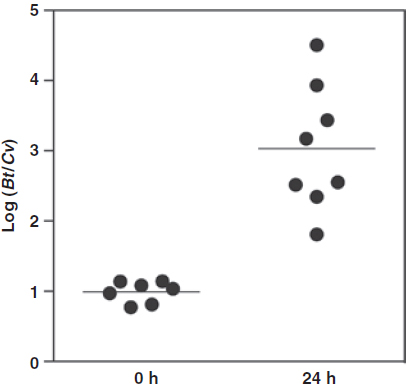
FIGURE A8-1 B. thailandensis–C. violaceum competition. Initial cell densities were 2–4×10⁷B. thailandensis (Bt) cells per ml and 2–4×10⁶C. violaceum (Cv) cells per ml. The initial and final cell densities of Bt and Cv were determined for each independent experiment by selective plating and colony counts. Each data point represents the log-transformed average of the ratios of the two species from duplicate measurements of an independent co-culture experiment. The lines represent the mean of all of the experiments in each set.
at 250 r.p.m. Colony-forming units (CFUs) of each species were determined by using differential antibiotic selection on LB agar plates. Bt was selected with gentamicin and Cv was selected with trimethoprim.
Results
Antibiotic Sensitivities
As a first step in developing our binary culture model, we needed to test the sensitivity of Cv to bactobolin and the sensitivity of Bt to violacein. Thus, we used purified antibiotics to determine the minimum inhibitory concentrations. The minimum inhibitory concentration of bactobolin A for Cv was 8 µgml–1, and at concentrations exceeding 8 µgml–1, Cv was killed during treatment (data not shown). This bactobolin was estimated to be at 5.3 µgml–1 in pure Bt culture fluid in growth conditions similar to those we use (Seyedsayamdost et al., 2010). Bt produces at least seven other bactobolin compounds (Seyedsayamdost et al., 2010; Carr et al., 2011). To test if Bt-produced bactobolins in cell culture fluid
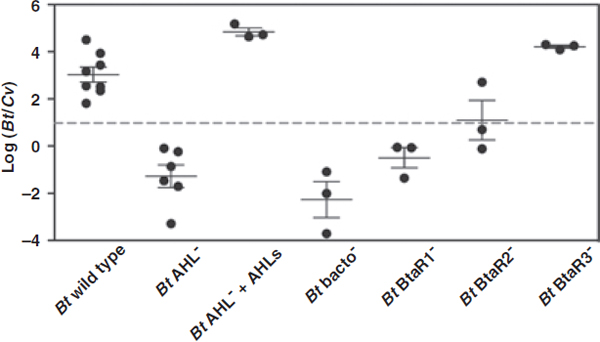
FIGURE A8-2 Competition in co-cultures of wild-type C. violaceum (Cv) and wild-type or mutant B. thailandensis (Bt) strains. The dashed line indicates the starting 10:1 ratio of Bt to Cv. The ratio of Bt to Cv after 24 h was determined by selective plating and colony counts. The co-culture results with wild-type Bt are also shown in Figure 1 and the final average CFU of each species is also partially represented in Table A6-3. Bt AHLs were extracted from culture fluid of a Bt bactobolin mutant (see Materials and methods) and added to culture medium. The solid lines represent means for each group. The vertical bars show the standard error of the mean for each group.
are sufficient to kill Cv, we assessed Cv viability after treatment with filtered fluid from a stationary-phase (OD600 8–10) Bt culture. After treatment with 10% (vol vol–1) culture fluid from a wild-type Bt culture diluted into fresh broth, we were unable to recover viable Cv. After similar treatment with 10% (vol vol–1) culture fluid from a Bt bactobolin-defective mutant (btaK–) or in broth alone, Cv grew to 2–3×10⁹CFU per ml (Table A8-1). Our results show that stationary-phase Bt cultures produce sufficient bactobolins to kill Cv.
Bt was resistant to violacein at the highest concentration tested, 125 µgml–1 (data not shown), which is in excess of amounts produced by Cv (Tobie, 1935; Strong, 1944). Cv codes for other putative antimicrobial factors, including phenazines and hydrogen cyanide (Brazilian National Genome Project Consortium, 2003). To test whether Cv produces quorum-sensing-dependent antimicrobials with activity against Bt, we incubated Bt with filtered fluid from Cv wild-type or mutant stationary-phase cultures (OD600 4–5). After 10 h, Bt grew modestly to 3×10⁸ in the presence of wild-type Cv culture fluid, but grew to 2×10⁹ in the presence of fluid from the AHL synthesis mutant (Table A8-2). This indicates that Cv quorum sensing regulates production of extracellular factors that inhibit growth of Bt, and that this inhibition is not due to violacein alone.
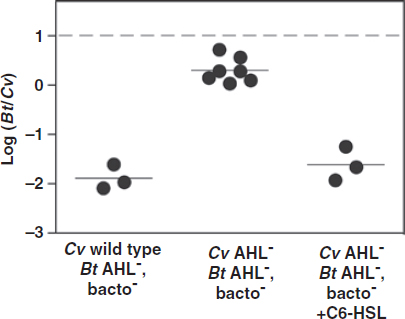
FIGURE A8-3 Co-cultures of the C. violaceum (Cv) wild-type Cv017 or the AHL mutant Cv026 and the B. thailandensis (Bt) competition-impaired AHL, bactobolin double mutant JBT125. The dashed line shows the initial ratio of Bt to Cv. After 24 h, the ratio of Bt to Cv was determined by colony counts on selective agar. Co-cultures were grown in 20 ml medium. C6-HSL was added before inoculation where indicated (250 nM final concentration). The solid lines represent the means of each group.
TABLE A8-1 Sensitivity of C. violaceum (Cv) Strains to B. thailandensis (Bt) culture fluid
| Cv (CFU per ml)b | ||
| Bt culture fluid testeda | Wild type | AHL– |
| Wild type | <100 | <100 |
| AHL– | 3×10⁹ | 2×10⁹ |
| Bactobolin– | 2×10⁹ | 2×10⁹ |
| No added culture fluid | 2×10⁹ | 1×019 |
aSensitivity was assessed by growing Cv in the presence of filtered culture fluid from stationary-phase (24 h) Bt cultures as described in the Materials and methods. The Bt AHL (btaI1, I2, I3) mutant JBT125 and the bactobolin (btaK) mutant BD20 were used. The Cv AHL (cviI) mutant Cv026 was used. Experiments were carried out in duplicate and in all cases the ranges did not exceed 10%.
bBt cell culture fluid was added to a final concentration of 10% (vol vol-1) in 90% (vol vol-1) in 1 ml Luria–Bertani-morpholinepropanesulfonic acid broth.
TABLE A8-2 Sensitivity of B. thailandensis (Bt) Strains to C. violaceum (Cv) Culture Fluid
| Cv culture fluid testeda | Bt (CFU per ml)b | |||
| Wild type | AHL- | Bactobolin- | ||
| Wild type | 3×10⁸ | 2×10⁸ | 3×10⁸ | |
| AHL- | 2×10⁹ | 2×10⁹ | 1×10⁹ | |
| No added culture fluid | 7×10⁹ | 8×10⁹ | 8×10⁹ | |
aSensitivity was assessed by growing Bt in the presence of filtered culture fluid from stationary-phase (16 h) Cv cultures as described in the Materials and methods. The Bt AHL (btaI1, I2, I3) mutant JBT125 and the bactobolin (btaK) mutant BD20 were used. The Cv AHL (cviI) mutant Cv026 was used. Experiments were carried out in duplicate and in all cases the ranges did not exceed 10%.
bCv cell culture fluid was added to a final concentration of 75% (vol vol-1) in 25% (vol vol-1) concentrated Luria–Bertani-morpholinepropanesulfonic acid broth in 1ml.
The Bt–Cv Co-Culture Model
In pure culture, the doubling times of all Bt strains were 60 min±5% and Cv strains were 48 min±5% (see Supplementary Table S2), and both species reached densities of about 3×10⁹ cells per ml in early stationary phase. Because of the modest growth-rate discrepancy, we used an inoculum of 2–4×10⁷Bt per ml and 2–4×10⁶Cv per ml in our co-culture experiments. Wild-type Bt outcompetes wild-type Cv, increasing in relative abundance by about 100-fold in 24 h (Figure A8-1). To study the competition further, we enumerated bacteria during logarithmic, early stationary and late stationary growth phases. In logarithmic and early stationary phase, both species reached densities in co-culture that were identical to the densities in pure culture (2–5×10⁹ cells per ml). However, the final densities of both species in late stationary phase (24 h) was lower in co-culture than in pure culture (Table A8-3). The final cell density of Cv decreased over three logs from 5×10⁹ cells per ml in early stationary phase to 1×10⁶ cells per ml at 24 h. There was no significant decrease in Cv density in pure culture (Table A8-3). The final density of Bt was 10-fold lower in co-culture than in pure culture (Table A8-2). Our results are consistent with the hypothesis that both species produce quorumsensing-controlled antimicrobials during stationary phase that inhibit growth of or kill the other species.
Quorum-Sensing-Controlled Bactobolin Synthesis Promotes Bt Competitiveness in Binary Culture
To test the hypothesis that quorum sensing promotes Bt competitiveness in co-culture, we assessed competition with a Bt AHL mutant and wild-type Cv. We also assessed the competitiveness of a Bt bactobolin mutant. In co-culture conditions where wild-type Bt had a robust competitive advantage, either the Bt AHL
| Final growth yield (CFU per ml)a,b | ||
| Strain(s) | Bt | Cv |
| Pure culture | ||
| Bt wild type | 1.4 (±0.7)×1010 | |
| Bt AHL | 1.0 (±0.9)×1010 | |
| Cv wild type | 9.9 (±8.4)×108 | |
| Co-culture (with wild-type Cv)c | ||
| Bt wild type | 1.3 (±0.8)×109 | 1.4 (±2.0)×106 |
| Bt AHL– | 2.3 (±2.6)×108 | 2.1 (±1.2)×109 |
| Bt bactobolin– | 1.0 (±1.5)×108 | 2.7 (±0.5)×109 |
aThe values are the means of at least three independent experiments with ranges indicated within parantheses. The Bt AHL (btaI1, I2, I3) mutant JBT125 and the bactobolin (btaK) mutant BD20 were used.
bThe growth yield in early stationary phase (9 h) of Bt and Cv in pure and co-culture was 1–3×10⁹.
cCo-culture data from individual experiments are also represented in Figure A6-1.
or bactobolin mutant were outcompeted by Cv (Figure A8-2). We could rescue competitiveness of the AHL mutant by supplementing our co-cultures with Bt AHLs that were obtained by ethyl acetate extraction of culture fluid from a stationary-phase (OD600 8–10) Bt bactobolin mutant (Materials and methods). These results demonstrate that quorum sensing and quorum sensing-dependent bactobolin production are critical for the competitive success of Bt in our co-culture model.
Bactobolin production is controlled by the BtaI2–R2 quorum-sensing system (Duerkop et al., 2009). Next, we assessed the importance of BtaI2–R2 and each of the other two Bt quorum-sensing systems, BtaI1–R1 and BtaI3–R3, to the competitiveness of Bt in our co-culture model. For this, we used Bt strains harboring individual deletions in each of the AHL receptor genes btaR1, btaR2 or btaR3 (Figure A8-2). Not surprisingly, the btaR2 mutant competed poorly with Cv. Results were similar to those with the bactobolin mutant and the AHL synthesis mutant. The outcome with the btaR3 mutant was identical to wild type, indicating that BtaR3 is not important for competition in our model. The btaR1 mutant showed an intermediate ability to compete with Cv, suggesting that this regulator may be important for the production of bactobolin or production of other factors that enhance competition or bactobolin activity. In support of the former, we found that expression of a bactobolin btaK-lacZ transcriptional fusion is delayed in a btaR1 mutant (data not shown), suggesting that BtaR1 may advance the production of bactobolin. We also tested the competitiveness of strains with individual mutations in each of the AHL synthase genes. All three individual AHL synthase mutants outcompeted Cv with results similar to competitions with wild-type Bt (data not shown). These findings suggest that the AHL synthases have overlapping abilities to induce expression of bactobolin. This is supported
by our previous finding that BtaR2 can respond to both 3-hydroxy-octanoyl-HSL and 3-hydroxy-decanoyl-HSL, which are produced by the BtaI3 and BtaI2 synthases, respectively (Duerkop et al., 2009).
Quorum Sensing Can Promote Competitiveness of Cv
Our results indicate that Cv also produces quorum-sensing-dependent antimicrobial factors that inhibit growth of Bt (Table A8-1). Thus, we hypothesized that quorum sensing promotes competitiveness of Cv as it does for Bt. To address this, we compared the competitiveness of the Cv wild-type and AHL mutant strains in co-culture with Bt. We modified our experiment to give wild-type Cv a competitive advantage by using a competition-defective Bt AHL, bactobolin double mutant, and we increased the co-culture volume to 20 ml because we observed that this further improves Cv competitiveness for reasons that are unknown (data not shown). In these conditions, wild-type Cv strongly outcompeted the Bt mutant, whereas the Cv AHL mutant barely outcompeted the Bt mutant (Figure A8-3). Competitiveness could be restored to the Cv AHL mutant by the addition of C6HSL (the AHL produced by Cv) (Figure A8-3). These results show that quorum sensing can promote the competitiveness of Cv. Because violacein does not have any antimicrobial activity against Bt, we note that this is not due to violacein, but must be caused by as-yet undefined quorum-sensing- dependent factors.
Cv Can Sense and Respond to Bt AHLs
The Cv AHL receptor CviR can be activated by a range of AHLs including at least one of the AHLs produced by Bt, C8-HSL (McClean et al., 1997; Swem et al., 2009). We hypothesized that Bt AHLs can activate the Cv quorum-sensing receptor CviR and that this promotes competitiveness of Cv in co-culture with Bt. We first tested whether a pure culture of Cv can sense and respond to Bt AHLs; these AHLs were ethyl acetate extracted and concentrated from stationary-phase (OD600 8–10) culture fluid and added to Cv cultures to match concentrations in the culture from which they were extracted. As a read-out for quorum-sensing activation, we followed the purple pigment violacein. The Cv AHL mutant is not pigmented, but pigmentation can be restored by supplementing the culture medium with Bt AHL extracts (Figure A8-4a). This result shows that Cv can sense and respond to physiological levels of Bt AHLs.
Next, we tested whether the Cv AHL mutant can respond to Bt AHLs during co-culture growth. Because Cv is killed by Bt-produced bactobolin in co-culture (Table A8-1), we used the Bt bactobolin mutant BD20 for these experiments (Figure A8-4b). When in co-culture with a Bt AHL, bactobolin double mutant, the Cv AHL mutant did not turn purple. However, in co-culture with the AHL-producing Bt bactobolin mutant BD20, or with exogenously supplied Bt AHLs, the co-culture turned purple. This finding indicates that the Cv CviR responds
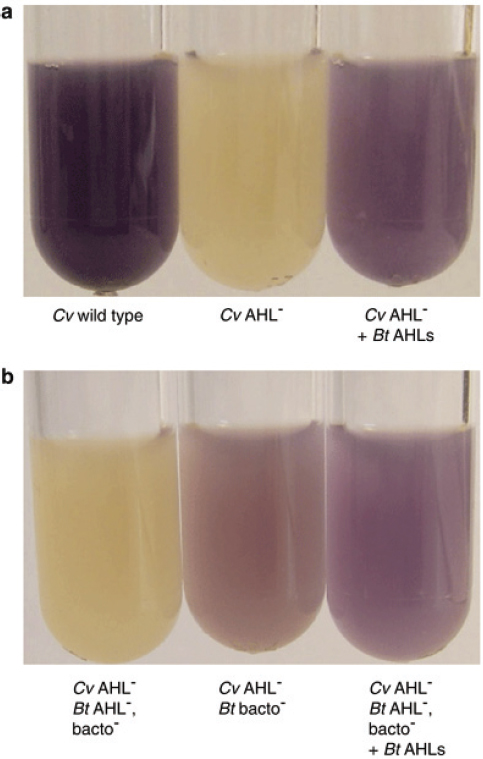
FIGURE A8-4 C. violaceum (Cv) quorum sensing is activated by B. thailandensis (Bt) AHLs. Quorum-sensing activation is indicated by the Cv quorum-sensing-dependent purple pigment, violacein, in stationary-phase cultures. (a) Cv wild-type (Cv017) and the AHL mutant (Cv026) with or without added Bt AHLs. (b) Co-cultures of the Cv AHL mutant and Bt strains as indicated (AHL mutant JBT112; AHL, bactobolin double mutant JBT125). AHLs were extracted from stationary-phase cultures of Bt BD20, a bactobolin mutant.
to Bt AHLs. We conclude that Bt AHLs are cues that alter the behavior of Cv, although they did not evolve for that purpose (Keller and Surette, 2006). In our experiment, the Cv AHL synthase mutant can eavesdrop on Bt.
Eavesdropping Promotes Competitiveness of Cv
To determine whether eavesdropping can influence competitiveness of Cv, we enumerated Bt and Cv in co-cultures (Figure A8-5). As in our previous experiments, we grew the Cv AHL mutant with the Bt bactobolin mutant or an AHL, bactobolin double mutant. The Cv AHL mutant was more competitive with the Bt bactobolin mutant than it was with the double mutant. As a control, we added Bt AHLs to the co-culture with the Bt double mutant and observed that this improved the competitiveness of Cv. These results suggest that eavesdropping on Bt AHLs promotes Cv competitiveness. As an additional control, we tested whether the Cv AHL receptor CviR is required for eavesdropping. To address this, we constructed a Cv AHL synthase, receptor double mutant. We found that CviR is required for the competitive advantage provided to Cv by eavesdropping on Bt AHLs (Figure A8-5).
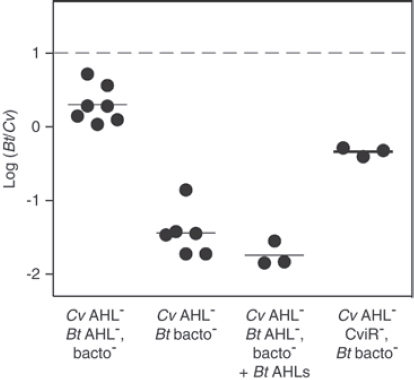
FIGURE A8-5 Eavesdropping promotes competitiveness of Cv in co-cultures with a B. Bt bactobolin mutant. After 24 h of co-culture, the ratio of Bt to Cv was determined. Co-cultures of the Cv AHL mutant (Cv026), or the Cv AHL synthase, receptor double mutant (Cv026R) and the Bt strains as indicated and described in Figure 4 legend. Co-cultures were grown in 20 ml volumes. The dashed line indicates the initial ratio of Bt to Cv. The solid lines represent the means for each group. AHLs were obtained as described for Figure A8-4.
An in silico Eavesdropping Model
Our experimental approach has limitations and with the conditions we used, we could not observe an effect of eavesdropping with wild-type strains (data not shown). However, we suspect there may be conditions where eavesdropping provides an advantage to wild-type Cv. This may be as the population nears the critical density required for quorum-sensing activation. At this density, AHLs produced by a nearby competitor may cause early activation of quorum-sensing-dependent antibiotics and would improve competitiveness of the eavesdropping microbe.
To explore this hypothesis further, we developed a mathematical model of our binary culture system (see Supplementary Text and Supplementary Table S3). The model accounts for two wild-type species that produce antibiotics in response to AHL signals in a well-mixed environment, similar to species Bt and Cv in our experimental system. In silico, the antibiotic produced by each species has equal killing efficiency towards the competing species, but no influence on the producing species. The two species in our in silico model also have identical growth rates, rates of antibiotic and AHL production, and antibiotic-production costs. However, as we observed experimentally, in some conditions one species (which we refer to here as species C) can eavesdrop on the other (species B). In the in silico model, we assume that antibiotic production accelerates once the inducer reaches a critical threshold concentration. However, antibiotic-production rates eventually level off as AHL concentrations exceed the quorum-sensing threshold. We use several different activation thresholds in our analysis.
Our in silico model has a bistable dynamic where one species completely dominates under most conditions. In the absence of eavesdropping, the outcome favors the species that is numerically dominant at the beginning (Figure A8-6). When we vary the activation thresholds for antibiotic production (by varying KB and KC of B and C, respectively, see Supplementary Text and Supplementary Table S3), there is an optimal value (Koptimal) where one species can dominate the other; if we fix KB at this value, B can dominate C at any value of KC (other than when KC was equal to Koptimal), and the same is true for C if KC is set at Koptimal (see Supplementary Figure S1). For every set of parameter values we explored, we find that Koptimal is greater than zero. Thus, waiting until a population reaches a quorum provides a fitness benefit for antibiotic-producing bacteria.
We then investigated eavesdropping in our in silico model when species B and C had identical thresholds above (high), equal to (optimal) and below (low) the optimal threshold. At a relatively high threshold, eavesdropping provided a distinct advantage to C by allowing it to invade B from lower starting frequencies (Figure A8-6a), supporting our initial hypothesis. However, with an optimal or low threshold, eavesdropping was disadvantageous (Figures A8-6b and A8-6c). We posit that in the latter two cases, the eavesdropping population activates production of antibiotic too early to accumulate a sufficient killing dose and antibiotic production is an ineffective metabolic burden. To test this hypothesis,
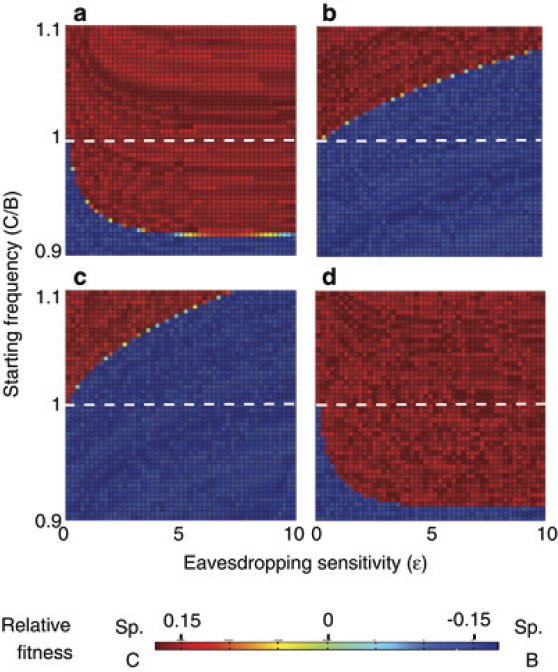
FIGURE A8-6 In silico modeling. Our model accounts for two species with quorumsensing-controlled antibiotics, similar to our experimental model of Bt and Cv. As in our experimental model, our in silico model accounts for two species (B and C) that produce antibiotics in a density-dependent manner. In our model, species C can eavesdrop on species B (see Supplementary Text). We show relative fitness of each species as a function of the initial ratio (C/B) and the eavesdropping sensitivity (e) of C. The fitness of C relative to B was measured using the log relative fitness measure given in Wu et al. (2006) and is indicated by the color spectrum on the far right. (a) The inducer concentration required for production of antibiotic (activation threshold, KB and KC) is relatively high for both species (0.01, see text). (b) The activation threshold is lower (0.003898) and corresponds to an optimal threshold for each species that gives it an advantage over the other species regardless of the other species’ threshold. (c) Both species have an activation threshold lower than the optimal threshold (0.003). (d) The same parameters were used as in (c); however, the antibiotic toxicity is raised 10-fold. This changes the optimal activation threshold to 0.001113, which is below the activation threshold value used (0.003) (see Supplementary Figure S1).
we kept the same conditions as in Figure A8-6c and increased the toxicity of the antibiotic of both species. In these conditions, eavesdropping provides an advantage (Figure A8-6d), supporting our hypothesis. Furthermore, eavesdropping is also advantageous if the antibiotic cost is decreased (Supplementary Figures S2 and S3). However, these changes in toxicity and cost alter the optimal threshold (Supplementary Figure S1B and data not shown), effectively resetting the system so that antibiotic production is induced after the optimal threshold is achieved. Thus, eavesdropping-dependent early production of antibiotics promotes competition in a population that has already reached a sufficient density to produce a killing dose.
Discussion
We have developed a dual-species competition model with two soil saprophytes, Bt and Cv, which both use quorum sensing to control production of antimicrobial factors. We show that both of these species can gain a competitive advantage over the other with success dependent on quorum sensing. The advantage of quorum-sensing control of antimicrobials has also been shown in other laboratory co-culture models (Moons et al., 2005, 2006; An et al., 2006). The previous reports, together with the results reported here, support the idea that quorum-sensing regulation is important in multi-species competition. Our results indicate that competitiveness of Bt relies on the btaI2-R2-controlled antibiotic bactobolin and Cv uses as-yet unidentified quorum-sensing-dependent factors for competition. The bactobolin biosynthetic genes and btaI2-R2 are encoded within a large (120-kb) DNA element that is absent from a close relative, the host-adapted pathogen Burkholderia mallei. That this element is retained in Bt supports the view that btaI2-R2 and bactobolin are important for competition during saprophytic growth.
Why do bacteria use quorum sensing to regulate antibiotic production? Our in silico model provides some possible clues. The results indicate that when antibiotic production is costly, early production slows population growth without effectively killing the competitor. Thus, quorum sensing defers the cost of antibiotic production until a sufficient killing dose can be delivered. We do not include in our model the additional possibility that sublethal concentrations of antibiotics may induce in the competitor an adaptation to higher concentrations of antibiotic. Both of these possibilities can be further explored with our experimental co-culture model. An alternative hypothesis is that deferred production may also protect the producing population against the emergence of non-producing cheaters. Cheaters can exploit public goods producers by utilizing the available goods without incurring the cost of their production. In a recent study by Xavier et al. (2011), delayed production of an exploitable public good, surfactant, protected the producing population against the emergence of cheaters. This strategy maximized growth of the producing population, thereby increasing its ability to
compete with cheaters. Quorum-sensing regulation may similarly promote competitiveness with non-producing cheaters.
Our experimental model also showed that cross species AHL activation of the Cv broad-specificity AHL receptor can promote the competitiveness of Cv (Figure A8-5). In addition to Cv, there are several other species with broad-specificity AHL receptors and these are also saprophytes: E. carotovora (ExpR2) (Sjoblom et al., 2006); P. aeruginosa (QscR) (Lee et al., 2006); and receptors encoded by two species of Bradyrhizobium (BraR and BjaR) (Ahlgren et al., 2011; Lindemann et al., 2011). ExpR2 and QscR are both orphan receptors without a cognate AHL synthase gene (Cui et al., 2006; Fuqua, 2006; Sjoblom et al., 2006). The potential role of each of these receptors in competition has not been determined. AHL receptor specificity can be easily altered by single amino-acid changes (Collins et al., 2005; Hawkins et al., 2007; Chen et al., 2011; Lintz et al., 2011), suggesting that AHL recognition may be very adaptable in nature. In contrast to these broad-specificity AHL receptors, the receptor of the squid symbiont Vibrio fischeri is quite specific for its cognate AHL (Visick and Ruby, 1999). V. fischeri activates quorum-sensing-dependent functions when it is at high cell densities in its squid host; in this environment it rarely encounters other bacterial species (Visick and McFall-Ngai, 2000). Thus, AHL receptors may evolve broad signal specificity in specific environments where eavesdropping might be of use, although the role of these receptors in inter-species competition and eavesdropping requires further study.
In the conditions of our experimental model, eavesdropping did not provide an observable fitness advantage to wild-type strains during competition. However in another study, AHLs produced by epiphytic bacteria on plant leaves altered the quorum-sensing-regulated virulence phenotype of a wild-type Pseudomonas syringae strain (Dulla and Lindow, 2009), suggesting that wild-type strains can be responsive to AHLs from other species in natural environments. Our co-culture model may provide a limited view of the possible interactions between species in nature, for example, Dulla and Lindow 2009) identified several epiphytic species that produce 10-fold more AHL than their laboratory P. syringae strain. High-level signal producers may play a significant role in cross-species induction.
Our mathematical model allowed a simple assessment of the costs and benefits of eavesdropping between competing wild-type strains. For the model, we made the basic assumption that detection of exogenous AHLs can cause early quorum-sensing dependent activation of antibiotic genes. We have observed this experimentally in Bt with a transcriptional fusion to the bactobolin biosynthetic gene btaK (data not shown), but it is more difficult to address with Cv because we do not yet know what quorum-controlled genes are involved in competition, and during early logarithmic phase the activity of the antimicrobials is too low for our methods of detection. The in silico model indicates that eavesdropping can promote competition in certain conditions where production of antibiotic occurs relatively late during growth. However, eavesdropping can also be detrimental
if the activation threshold is relatively low. We observed similar results in other variations of this model (data not shown). Our results suggest that receptors would evolve broad specificity only in particular circumstances where eavesdropping is beneficial. Our bias is that specificity is the more evolved trait and that highly specific receptors likely arose from receptors with less specificity.
Acknowledgements
This work was funded by a National Institute of Allergy and Infectious Disease (NIAID) award to the Northwest Regional Center of Excellence for Biodefense and Emerging Infectious Diseases (U54AI057141) to EPG. JRC was funded by the NIAID (NRSA 1 F32 AI073027- 01A2), SH was funded by the Danish National Research Foundation and JEM was funded by the UW Royalty Research Grant. We thank Drs Ajai Dandekar, Snow Brook Peterson, Ben Kerr and Matt Parsek for helpful discussions regarding this manuscript.
References
Ahlgren NA, Harwood CS, Schaefer AL, Giraud E, Greenberg EP. (2011). Aryl-homoserine lactone quorum sensing in stem-nodulating photosynthetic bradyrhizobia. Proc Natl Acad Sci USA 108: 7183–7188.
An D, Danhorn T, Fuqua C, Parsek MR. (2006). Quorum sensing and motility mediate interactions between Pseudomonas aeruginosa and Agrobacterium tumefaciens in biofilm cocultures. Proc Natl Acad Sci USA 103: 3828–3833.
Bainton NJ, Bycroft BW, Chhabra SR, Stead P, Gledhill L, Hill PJ et al. (1992). A general role for the lux autoinducer in bacterial cell signalling: control of antibiotic biosynthesis in Erwinia. Gene 116: 87–91.
Bassler BL. (2002). Small talk. Cell-to-cell communication in bacteria. Cell 109: 421–424.
Brazilian National Genome Project Consortium (2003). The complete genome sequence of Chromobacterium violaceum reveals remarkable and exploitable bacterial adaptability. Proc Natl Acad Sci USA 100: 11660–11665.
Carr G, Seyedsayamdost MR, Chandler JR, Greenberg EP, Clardy J. (2011). Sources of diversity in bactobolin biosynthesis by Burkholderia thailandensis E264. Org Lett 13: 3048–3051.
Chandler JR, Duerkop BA, Hinz A, West TE, Herman JP, Churchill ME et al. (2009). Mutational analysis of Burkholderia thailandensis quorum sensing and self-aggregation. J Bacteriol 191: 5901–5909.
Chen G, Swem LR, Swem DL, Stauff DL, O’Loughlin CT, Jeffrey PD et al. (2011). A strategy for antagonizing quorum sensing. Mol Cell 42: 199–209.
Collins CH, Arnold FH, Leadbetter JR. (2005). Directed evolution of Vibrio fischeri LuxR for increased sensitivity to a broad spectrum of acyl-homoserine lactones. Mol Microbiol 55: 712–723.
Cui Y, Chatterjee A, Hasegawa H, Chatterjee AK. (2006). Erwinia carotovora subspecies produce duplicate variants of ExpR, LuxR homologs that activate rsmA transcription but differ in their interactions with N-acylhomoserine lactone signals. J Bacteriol 188: 4715–4726.
Davies J, Spiegelman GB, Yim G. (2006). The world of subinhibitory antibiotic concentrations. Curr Opin Microbiol 9: 445–453.
Duerkop BA, Varga J, Chandler JR, Peterson SB, Herman JP, Churchill ME et al. (2009). Quorum-sensing control of antibiotic synthesis in Burkholderia thailandensis. J Bacteriol 191: 3909–3918.
Dulla GF, Lindow SE. (2009). Acyl-homoserine lactonemediated cross talk among epiphytic bacteria modulates behavior of Pseudomonas syringae on leaves. ISME J 3: 825–834.
Engebrecht J, Nealson K, Silverman M. (1983). Bacterial bioluminescence: isolation and genetic analysis of functions from Vibrio fischeri. Cell 32: 773–781.
Fuqua C. (2006). The QscR quorum-sensing regulon of Pseudomonas aeruginosa: an orphan claims its identity. J Bacteriol 188: 3169–3171.
Fuqua C, Parsek MR, Greenberg EP. (2001). Regulation of gene expression by cell-to-cell communication: acyl-homoserine lactone quorum sensing. Annu Rev Genet 35: 439–468.
Fuqua WC, Winans SC, Greenberg EP. (1994). Quorum sensing in bacteria: the LuxR–LuxI family of cell density-responsive transcriptional regulators. J Bacteriol 176: 269–275.
Gallagher LA, Manoil C. (2001). Pseudomonas aeruginosa PAO1 kills Caenorhabditis elegans by cyanide poisoning. J Bacteriol 183: 6207–6214.
Hawkins AC, Arnold FH, Stuermer R, Hauer B, Leadbetter JR. (2007). Directed evolution of Vibrio fischeri LuxR for improved response to butanoyl-homoserine lactone. Appl Environ Microbiol 73: 5775–5781.
Hibbing ME, Fuqua C, Parsek MR, Peterson SB. (2010). Bacterial competition: surviving and thriving in the microbial jungle. Nat Rev Microbiol 8: 15–25.
Hosni T, Moretti C, Devescovi G, Suarez-Moreno ZR, Fatmi MB, Guarnaccia C et al. (2011). Sharing of quorum-sensing signals and role of interspecies communities in a bacterial plant disease. ISME J 5:1857–1870.
Keller L, Surette MG. (2006). Communication in bacteria: an ecological and evolutionary perspective. Nat Rev Microbiol 4: 249–258.
Kownatzki R, Tummler B, Doring G. (1987). Rhamnolipid of Pseudomonas aeruginosa in sputum of cystic fibrosis patients. Lancet 1: 1026–1027.
Latifi A, Foglino M, Tanaka K, Williams P, Lazdunski A. (1996). A hierarchical quorum-sensing cascade in Pseudomonas aeruginosa links the transcriptional activators LasR and RhIR (VsmR) to expression of the stationary-phase sigma factor RpoS. Mol Microbiol 21: 1137–1146.
Latifi A, Winson MK, Foglino M, Bycroft BW, Stewart GS, Lazdunski A et al. (1995). Multiple homologues of LuxR and LuxI control expression of virulence determinants and secondary metabolites through quorum sensing in Pseudomonas aeruginosa PAO1. Mol Microbiol 17: 333–343.
Lee JH, Lequette Y, Greenberg EP. (2006). Activity of purified QscR, a Pseudomonas aeruginosa orphan quorum-sensing transcription factor. Mol Microbiol 59: 602–609.
Lindemann A, Pessi G, Schaefer AL, Mattmann ME, Christensen QH, Kessler A et al. (2011). Isovalerylhomoserine lactone, an unusual branched-chain quorum-sensing signal from the soybean symbiont Bradyrhizobium japonicum. Proc Natl Acad Sci USA 108: 16765–16770.
Lintz MJ, Oinuma K, Wysoczynski CL, Greenberg EP, Churchill ME. (2011). Crystal structure of QscR, a Pseudomonas aeruginosa quorum sensing signal receptor. Proc Natl Acad Sci USA 108: 15763–15768.
Mazzola M, Cook RJ, Thomashow LS, Weller DM, Pierson LS III. (1992). Contribution of phenazine antibiotic biosynthesis to the ecological competence of fluorescent pseudomonads in soil habitats. Appl Environ Microbiol 58: 2616–2624.
McClean KH, Winson MK, Fish L, Taylor A, Chhabra SR, Camara M et al. (1997). Quorum sensing and Chromobacterium violaceum: exploitation of violacein production and inhibition for the detection of N-acylhomoserine lactones. Microbiology 143 (Part 12) 3703–11.
Moons P, Van Houdt R, Aertsen A, Vanoirbeek K, Engelborghs Y, Michiels CW. (2006). Role of quorum sensing and antimicrobial component production by Serratia plymuthica in formation of biofilms, including mixed biofilms with Escherichia coli. Appl Environ Microbiol 72: 7294–7300.
Moons P, Van Houdt R, Aertsen A, Vanoirbeek K, Michiels CW. (2005). Quorum sensing dependent production of antimicrobial component influences establishment of E. coli in dual species biofilms with Serratia plymuthica. Commun Agric Appl Biol Sci 70: 195–198.
Pierson EA, Wood DW, Cannon JA, Blachere FM, Pierson LS 3rd. (1998). Interpopulation signaling via N-acyl-homoserine lactones among bacteria in the wheat rhizosphere. Mol Plant Microbe Interact 11: 1078–1084.
Ran H, Hassett DJ, Lau GW. (2003). Human targets of Pseudomonas aeruginosa pyocyanin. Proc Natl Acad Sci USA 100: 14315–14320.
Riedel K, Hentzer M, Geisenberger O, Huber B, Steidle A, Wu H et al. (2001). N-acylhomoserine-lactonemediated communication between Pseudomonas aeruginosa and Burkholderia cepacia in mixed biofilms. Microbiology 147: 3249–3262.
Schuster M, Greenberg EP. (2006). A network of networks: quorum-sensing gene regulation in Pseudomonas aeruginosa. Int J Med Microbiol 296: 273–81.
Seed PC, Passador L, Iglewski BH. (1995). Activation of the Pseudomonas aeruginosa lasI gene by LasR and the Pseudomonas autoinducer PAI: an autoinduction regulatory hierarchy. J Bacteriol 177: 654–659.
Seyedsayamdost MR, Chandler JR, Blodgett JA, Lima PS, Duerkop BA, Oinuma K et al. (2010). Quorum-sensingregulated bactobolin production by Burkholderia thailandensis E264. Org Lett 12: 716–719.
Sjoblom S, Brader G, Koch G, Palva ET. (2006). Cooperation of two distinct ExpR regulators controls quorum sensing specificity and virulence in the plant pathogen Erwinia carotovora. Mol Microbiol 60: 1474–1489.
Stauff DL, Bassler BL. (2011). Quorum sensing in Chromobacterium violaceum: DNA recognition and gene regulation by the CviR receptor. J Bacteriol 193: 3871–3878.
Steidle A, Sigl K, Schuhegger R, Ihring A, Schmid M, Gantner S et al. (2001). Visualization of N-acylhomoserine lactone-mediated cell–cell communication between bacteria colonizing the tomato rhizosphere. Appl Environ Microbiol 67: 5761–5770.
Strong FM. (1944). Isolation of violacein. Science 100: 287. Swem LR, Swem DL, O’Loughlin CT, Gatmaitan R, Zhao B, Ulrich SM et al. (2009). A quorum-sensing antagonist targets both membrane-bound and cytoplasmic receptors and controls bacterial pathogenicity. Mol Cell 35: 143–153.
Tobie WC. (1935). The pigment of Bacillus violaceus: I. The production, extraction, and purification of violacein. J Bacteriol 29: 223–227.
Venturi V, Friscina A, Bertani I, Devescovi G, Aguilar C. (2004). Quorum sensing in the Burkholderia cepacia complex. Res Microbiol 155: 238–244.
Visick KL, Ruby EG. (1999). The emergent properties of quorum sensing: consequences to bacteria of autoinducer signaling in their natural environment. In: Winans GMDaSC (ed.) Cell–Cell Signaling in Bacteria. ASM Press: Washington, DC, pp 333–352.
Visick KL, McFall-Ngai MJ. (2000). An exclusive contract: specificity in the Vibrio fischeri–Euprymna scolopes partnership. J Bacteriol 182: 1779–1787.
Waters CM, Bassler BL. (2005). Quorum sensing: cell-to-cell communication in bacteria. Annu Rev Cell Dev Biol 21: 319–346.
Wu H, Huang Y, Dykes C, Liu D, Ma J, Perelson AS et al. (2006). Modeling and estimation of replication fitness of human immunodeficiency virus type 1 in vitro experiments by using a growth competition assay. J Virol 80: 2380–2389.
Xavier JB, Kim W, Foster KR. (2011). A molecular mechanism that stabilizes cooperative secretions in Pseudomonas aeruginosa. Mol Microbiol 79: 166–179.
Yim G, Wang HH, Davies J. (2007). Antibiotics as signalling molecules. Philos Trans R Soc Lond Ser B 362: 1195–1200.
RULES OF ENGAGEMENT: INTERSPECIES INTERACTIONS THAT REGULATE MICROBIAL COMMUNITIES31
Ainslie E. F. Little,32Courtney J. Robinson,32S. Brook Peterson,32Kenneth F. Raffa,33and Jo Handelsman32,34
Abstract
Microbial communities comprise an interwoven matrix of biological diversity modified by physical and chemical variation over space and time. Although these communities are the major drivers of biosphere processes, relatively little is known about their structure and function, and predictive modeling is limited by a dearth of comprehensive ecological principles that describe microbial community processes. Here we discuss working definitions of central ecological terms that have been used in various fashions in microbial ecology, provide a framework by focusing on different types of interactions within communities, review the status of the interface between evolutionary and ecological study, and highlight important similarities and differences between macro- and microbial ecology. We describe current approaches to study microbial ecology and progress toward predictive modeling.
Introduction
Biology in the twentieth century was dominated by simplification and order. This was driven by the desire to improve experimental controls and resulted in a landscape of intellectual frameworks unified by reductionism. Study of systems was replaced by study of parts, organism with cells, cells with genes and proteins, and genes and proteins with their atoms. The scientific triumphs were many and
___________
31 Reprinted with permission, from the Annual Review of Microbiology, Volume 62 © 2008 by Annual Reviews www.annualreviews.org.
Annu. Rev. Microbiol. 2008. 62:375–401
First published online as a Review in Advance on June 10, 2008
The Annual Review of Microbiology is online at micro.annualreviews.org
This article’s doi: 10.1146/annurev.micro.030608.101423
Copyright 2008 by Annual Reviews.
All rights reserved
0066-4227/08/1013-0375$20.00
32 Department of Bacteriology, University of Wisconsin, Madison, Wisconsin, 53706.
33 Department of Entomology, University of Wisconsin, Madison, Wisconsin, 53706.
34 Department of Plant Pathology, University of Wisconsin, Madison, Wisconsin, 53706.
Email: alittle@wisc.edu, cjr@plantpath.wisc.edu, snowbp@u.washington.edu, joh@plantpath.wisc.edu
Key Words: microbial ecology, community ecology, community genetics, symbiosis, metagenomics
the practical outcomes—vaccines, antibiotics, and highyielding crops—transformed human health and food security. But the cost was a reduction of emphasis, training, and vision in systems-level biology, and with that a reduced ability to address some of the most important current environmental and health challenges.
As the twentieth century drew to a close, we were confronted by new challenges that rekindled widespread interest and identified the need to understand systems-level biology. Certain human diseases emerged whose origins were understood from landscape-level events that did not fit neatly into a reductionist scheme. Similarly, global climate change, and its underlying human causation, was recognized as a reality, and any realistic solutions required study of interconnecting spheres of society and the biosphere. These events and others like them arrived just as powerful new methods in microbiology emerged to open the way for a renaissance of ecology in general and microbial community ecology in particular. Although the need for systems biology has always been apparent to ecologists, who can offer many examples of ecosystems in which studying a binary interaction led to an erroneous conclusion that was corrected only by introducing more complexity into the model, the change in perspective was a surprise to much of the microbiology community (Raffa, 2004).
Over the past century of microbiology, the emphasis on the study of microbes in pure culture has isolated microorganisms from their communities and focused on their behavior in the biologically simple environments of the petri dish and test tube. Although simple model systems have driven an explosion of knowledge in cellular processes and host-microbe interactions over the past two decades, the reality of natural communities demands that we direct attention to complex assemblages as well. Global microbial diversity is enormous, likely representing 107 species, of which only 0.01% to 0.1% are known (Curtis and Sloan, 2002, 2004; Dykhuizen, 1998; Gans et al., 2005; Pace, 1997). Microbial communities can be complex, with high species richness and unevenness, and their structures are continually influenced by changing biological, chemical, and physical factors. Most microorganisms do not submit readily to growth in the laboratory, leaving microbiologists to either concentrate on the subsets that do perform well under artificial conditions or grope for other methods to describe the species that compose natural communities. Therefore, the structure of most microbial communities has been difficult to illuminate.
Describing community structure is often a prelude to understanding community function, which has been similarly difficult to elucidate (Handelsman, 2004; Pace, 1995; Pace et al., 1985). One of the barriers confronting microbial ecologists is the lack of ecological principles that provide the foundation for predictive models. Broadly based, validated principles derived from systems that can be manipulated experimentally would allow for predictions regarding behavior of communities that are less tractable for study. Many of these principles can be borrowed from macroecology, although some need to be reformatted to fit the microbial lifestyle. In this review, we explore the internal
processes of microbial communities in an effort to begin to define the principles that underpin ecological and evolutionary patterns of microbial communities. Defining these principles is necessary to enable predictive modeling of ecological dynamics of microbial communities. In addition to their importance to fundamental understanding of the biosphere, predictive models have numerous practical applications. For example, they can provide guidance to strategies for manipulating communities on plant or animal surfaces to suppress pathogens, maintaining community integrity when applying chemicals such as antibiotics or pesticides that could destabilize communities, or successfully introducing a beneficial microorganism such as a biocontrol agent in agriculture or a probiotic in veterinary and human medicine.
Ecological Properties of Microbial Communities
The properties of microbial communities can be divided into two categories: structural and functional. Structural properties describe how the community varies and what it looks like—the types and numbers of members across a range of environments. Functional properties define the community’s behavior—how the community processes substrates, interacts with forces in its environment, and responds to perturbations such as invasion.
Structural Properties
One of the simplest ways to characterize a community is to list its members (composition) and to tabulate the total number of members (richness). To answer such questions as How many different species are there in a given community? and What are they? seems easy and straightforward, but answering them is challenging when they are applied to microbial communities (Schloss and Handelsman, 2005). The challenges derive from both biological and statistical issues. Enumeration by culturing limits the description to those members that can be cultured, which constitute the minority (often less than 1%) in most communities. Molecular methods present culture-independent alternatives, which capture far more richness than does culturing (Curtis et al., 2006). Sequence analysis of the 16S rRNA gene is the dominant method of determining identity and phylogenetic relatedness of microorganisms (Curtis et al., 2006), although other genes, such as rpoB, may provide greater resolution in phylogenetic associations at the species and subspecies levels (Case et al., 2007). To avoid the inherent difficulty in sampling every species in every community, macroand microbial ecologists often use estimates of richness based on samples of the communities; however, these estimates can vary depending on the estimator chosen and the type of data analyzed (Begon et al., 1990; Scholoss and Handelsman, 2007; see Curtis et al., 2006 for a review of the difficulties of quantifying properties in microbial communities, the statistics used in the analyses, as well as recent accomplishments
in the area). Estimates of richness based on gene sequence relatedness are often calculated using software such as EstimateS and DOTUR (Colwell, 2005; Schloss and Handelsman, 2005). DOTUR, for example, has been used for a variety of genes and environments to assign sequences to operational taxonomic units based on phylogenetic distances and to calculate richness estimates at different degrees of phylogenetic resolution (Brodie et al., 2007; Cox and Gilmore, 2007; Diaz et al., 2006; Francis et al., 2005; Katayama et al., 2007; Schloss and Handelsman, 2006a, Vasanthakumar et al., 2006).
Diversity indices take into account both species richness and evenness of distribution of species (i.e., abundance of individuals) (Begon et al., 1990). The diversity of a community is difficult to interpret on its own but can be valuable when used to compare communities. Community structure, like diversity, is an attribute that is most useful when analyzed for comparative purposes. Community structure incorporates both the composition of the community and the abundance of individual members. Diversity and structure measure different aspects of community characteristics, so they can vary independently of each other (Hartmann and Widmer, 2006). In soil communities, the presence of a plant community, the introduction of various transgenes into a tree community, and rhizomediation influence composition and structure, but not diversity (deCarcer et al., 2007; LeBlanc et al., 2007; Zul et al., 2007). However, in other situations structural changes influence diversity as well.
In addition to the structure of the entire community, understanding the structure of assemblages within a community can also be important. For example, Perez & Sommaruga (Perez and Sommuaruga, 2007) monitored the response of the Betaproteobacteria and Actinobacteria populations within a lake water community to solar radiation and dissolved organic matter from lake, algal, or soil sources. Functionally defined assemblages, such as guilds, are also of interest because of the activities of community members. In another recent study, the structure of a methanotroph assemblage within a rice field community was monitored using terminal restriction-length polymorphism (TRFLP) analysis, pmoA gene analysis, and stable isotope probing (Shrestha et al., 2008). The results indicated that the activity and structure of the methanotroph assemblage (composed of type I and II methanotrophs) fluctuated over time and with CH4 availability and that type I and type II methanotrophs occupied two different niches within the rice field ecosystem. Other guilds such as ammonium-oxidizers, methanogens, and iron-reducers have been analyzed for structural properties (Chu et al., 2007; Hansel et al., 2007; Smith et al., 2007). Similarity of community structure can be calculated using a number of computer programs such as SLIBSHUFF, SONS, TreeClimber, and Unifrac and techniques such as analysis of molecular variance (AMOVA) and homogeneity of molecular variance (HOMOVA) (Lozupone and Knight, 2005; Lozupone et al., 2007; Martin, 2002; Schloss, 2008; Schloss et al., 2006a, 2006b; Schloss et al., 2004). The differences between the hypotheses tested by each of these tools are discussed elsewhere (Schloss, 2008).
Robustness
Community robustness is the ability of the community to maintain its functional and structural integrity in the face of potential perturbations (Begon et al., 1990). This is consistent with other uses of robustness in engineering and statistics that pertain to the heartiness of a system and its ability to function under various, often adverse, conditions (Geraci, 1991). Just like complex engineered systems, biological systems, such as cells, tissues, organs, and ecological webs, are composed of diverse and often multifunctional components (Kitano, 2002). Systems that maintain their function, characteristic behavior, or some other property despite internal and external perturbations and adapt to their environments are robust (Kitano, 2002, 2003; Stelling et al., 2004). Although robustness is a characteristic of all biological systems, it is a relative property that depends on the perturbation and the behavior monitored (Stelling et al., 2004). For example, cancer cells that establish in the human body are particularly robust against the host’s defenses, but perturbations against which they are weakly robust offer promising therapies (Kitano et al., 2003).
We use structural robustness, similar to ecosystem stability (although ecosystem stability does not always refer to structure), to describe the constancy in community structure over time (temporal stability), the ability to resist change following a perturbation (resistance), and the return to its native structure following a change to structure (resilience). Components of robustness are often studied individually. Temporal stability, though not always referred to as such, is studied far more often than the other components of robustness. For example, Kikuchi & Graf (Kikuchi and Graf, 2007) recently reported that populations in the microbial community of leech crops, comprising Aeromonas veronii bv. sobria and a Rikenella-like organism, fluctuated within 6 h to 14 days after blood feeding. The population size of both members initially increased following feeding, but the abundance of A. veronii decreased 4 days after feeding while the abundance of the Rikenella-like species remained constant over the timescale studied (Kikuchi and Graf, 2007). Temporal stability has also been examined in rice field soil, cabbage white butterfly midguts, and a number of aquatic communities (Alonso-Saez et al., 2007; Carrino-Kyker and Swanson, 2008; Chenier et al., 2006; Kan et al., 2007; Kent et al., 2006; Lepere et al., 2006; Moss et al., 2006; Murase et al., 2006; C. Robinson, P. Schloss, K. Raffa & J. Handelsman, manuscript submitted).
Functional robustness refers to the ability of a community to maintain a particular activity despite perturbation, which, unlike structural robustness, is not necessarily linked to composition, although links between structure and function have been established many times (Adamczyk et al., 2003; Chandler et al., 2006; Chu et al., 2007; Cottrell and Kirchman, 2000; Gentile et al., 2007; Shrestha et al., 2008; Smith et al., 2007). Saison et al. (2006) showed that soil communities exhibited functional and structural resilience to low, but not high, levels of winery compost. In another study, Yannarell et al. (2007) found that nitrogen fixation returned to normal levels in a Bahamian microbial mat following a Category Four
hurricane, despite a shift in community structure. At the intersection of functional and structural robustness is the years-old diversitystability debate. Briefly, the debate questions whether increased community diversity increases or decreases community stability (see Ives and Carpenter, 2007, and McCann, 2000, for reviews of the diversity-stability debate). Macro- and, to a lesser extent, microbial ecology have long sought a common rule that governs the relationship between diversity of a given community and its ecosystem stability, with stability often measured by a specific activity or function. Several years ago, McGrady-Steed et al. (1997) found that as diversity increased, decomposition increased, but carbon dioxide uptake decreased in an aquatic microcosm that contained bacteria, protists, and metazoans. They also noted that resistance to invasion increased as the abundance of certain members increased.
More recently, Girvan et al. (2005) examined the temporal structural stability and the functional resilience of two soil communities of different diversities that had been perturbed with benzene or copper using denaturing gradient gel electrophoresis and monitoring of broadscale (mineralization of 14C-labeled wheat shoot) and narrow-scale (mineralization of 14C-labeled 2,4-dichlorophenol) functions for 9 weeks. Temporal shifts in structure were observed in all soils, although copper-treated and control soils were consistently more similar to each other than either was to the benzenetreated soil (Girvan et al., 2005). This indicates that in some systems the source of the perturbation may be more important than community diversity in structural temporal stability. Benzene perturbation reduced the ability of both communities to perform the narrow niche function; however, the more diverse community reacquired the function by week 9 of the experiment, thereby exhibiting functional resilience (Girvan et al., 2005). Copper treatment increased broadscale function but initially reduced narrow niche function for both communities before they both recovered (Girvan et al., 2005). These findings indicate that diversity and source of perturbation may be important for functional robustness. The results also suggest that soil exhibits functional resilience owing in part to functional redundancy, but that greater diversity in soil communities may also lead to greater resistance and functional stability. The positive association between community diversity and stability is consistent with what has been observed in some macroecological systems such as grassplots (Tilman et al., 1996). More study of microbial community robustness is needed to establish the rules of engagement, i.e., governing principles and predictive models.
Interactions Within Microbial Communities
A first step toward understanding the nature of ecological interactions in natural microbial communities is cataloging mechanisms by which microorganisms interact. Symbiotic interactions can be divided into three overlapping categories, which exist in a continuum from parasitic to mutualistic (Figure A9-1). Parasites (Greek, para, “near,” and sitos, “food”) are organisms that live on or in another
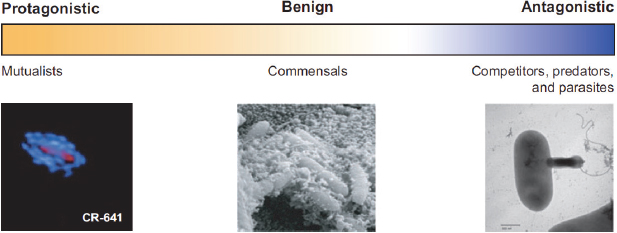
FIGURE A9-1 Continuum of interspecific interactions that occur in microbial communities. (Left) The beneficial relationships that occur between mutualists such as the phototrophic consortia (shown below) comprising central rod-shaped bacteria in the family Comamonadaceae (red) and green epibiotic sulfur bacteria (blue) (reprinted from Reference 95). Commensal, or benign, relationships are depicted in the middle of the continuum by an electron micrograph of the microbial community of the cabbage white butterfly. (Right) Antagonistic relationships are illustrated by an electron micrograph of Bdellovibrio attacking Shewanella oneidsis (photo credit: Robert Chamberlain, Wayne Rickoll, and Mark Martin).
organism and obtain all or part of their necessary nutrients at the expense of their host. Commensalism (Latin, com, “together,” and mensa, “table”) includes relationships in which one partner derives benefit from the other and the other partner neither is harmed nor benefits from the association. Mutualism (Latin, mutualis, “reciprocal”) is an association in which both organisms derive benefit from one another. In addition to specific symbiotic interactions, microorganisms can interact antagonistically with other microorganisms via competition for a common resource or via predation of one organism upon another. The mechanisms that dictate interactions among microorganisms are largely responsible for the properties of the community as a whole. Dissecting the binary and tertiary interactions among community members is one essential component to understanding the properties of the community.
Exploitative Competition
As in interactions between macroorganisms, exploitative competition, or competition for nutrients and space, plays an important role in shaping microbial interactions. In eukaryote-associated microbial communities, such as in the human gut, competition for nutrients and space from resident microflora is thought to present one barrier to infection by pathogens, a phenomenon called the barrier effect (Guarner and Malagelada, 2003). In cabbage white butterfly larvae,
changes in the resident microflora community structure resulting from treatment with antibiotics facilitates invasion by a nonresident, in support of the role of competition from residents in normally preventing invasion (C. Robinson, Y. Ramos, K. Raffa & J. Handelsman, unpublished observations). Probiotic bacteria, such as some Bifidobacterium and Lactobacillus species, are thought to exert positive effects on host health in part via competitive interactions with pathogenic bacteria for space and nutrients, and also through interference competition by production of toxic compounds (Rastall et al., 2005). In vitro, binding of some probiotic bacteria to cultured epithelial cells can prevent binding of pathogens, in support of the hypothesis that bacteria successfully compete for space (Gopal et al.; 2001, Lee and Puong, 2002). Competition for nutrients among bacterial species from functional groups having different nutritional requirements can be important in structuring microbial communities in nutritionally heterogeneous environments. For example, in microcosms containing picoplanktonic cyanobacteria and heterotrophic bacteria along crossed gradients of glucose and phosphate, the cyanobacteria positively responded to increased phosphate only when glucose was low, presumably because of increased competition from the heterotrophs when organic carbon was supplied (Drakare, 2002).
Exploitative and interference competition. The aspect of microbial interactions that has arguably received the most attention is the ability of some microorganisms to produce compounds that, at least in laboratory studies, directly antagonize other microorganisms. It has been assumed that organisms produce these compounds as a means of chemical warfare, providing a competitive edge to the producers by directly inhibiting growth or killing off potential competitors, a form of interference competition. One example in which evidence supports this proposition is in the rhizosphere, where antibiotic production by a number of bacteria contributes to their ability to protect plants from particular pathogens (Compant et al., 2005; Raaijmakers et al., 2002). The antibiotics these bacteria produce in vitro have been detected in the rhizosphere (Bonsall et al., 1997), and mutants deficient in antibiotic production often exhibit a reduced ability to protect the plant from the pathogen (Keel et al., 1992; Silo-Suh et al., 1994; Thomashow and Weller 1998) or a reduced fitness in the rhizosphere (Mazzola et al., 1992; Pierson and Pierson, 1996). Additionally, production of the peptide antibiotic trifolitoxin by some strains of Rhizobium etli strains contributes to their competitive ability in the rhizosphere, leading to increased occupation of root nodules by producing strains (Robleto et al., 1997; Robleto et al., 1998). In addition to the rhizosphere systems, evidence from a number of invertebrate-microbe interactions supports the role of antibiotics in antagonistic relationships within communities. For example, antibiotics produced by Actinomycetes associated with leafcutter ants protect the ants’ fungal gardens from parasitism by another fungus (Currie et al., 2006; Little et al., 2006). Similarly, larvae of some crustaceans, beewolves, and bark beetles rely on production of antifungal compounds by
bacterial symbionts to avoid infection by fungal pathogens (Cardoza et al., 2006; Gil-Turnes and Fenical, 1992; Gil-Turnes et al., 1989; Kaltenpoth et al., 2005).
In many cases, however, antibiotic production in vitro has not been demonstrated to result in antagonism in situ, leading to speculation that antibiotics play roles other than as growth inhibitors (Davies et al., 2006). At subinhibitory concentrations, structurally diverse antibiotics affect transcription of many bacterial genes not necessarily associated with stress responses, suggesting that antibiotics may function as signaling molecules in the environment when produced at low concentrations (Davies et al., 2006).
Interference competition via signal disruption. Some mechanisms of interference competition between microorganisms are independent of antibiotic production, such as disruption of signaling cascades. Diverse bacteria degrade acyl-homoserine lactone signal molecules (Leadbetter and Greenberg, 2000; Lin et al., 2003; Uroz et al., 2003; Uroz et al., 2005; Uroz et al., 2007; Yang et al., 2005), and the rapid turnover rate of acyl-homoserines in nonsterile soil suggests this is a common bacterial trait at least in that environment (Wang and Leadbetter, 2005). Signaling by small peptides can also be disrupted; for example, siamycin, a secondary metabolite produced by a soil Streptomyces strain, inhibits signaling by the gelatinase biosynthesis-activating pheromone of Enterococcus faecalis (Nakayama et al., 2007). The ability to interfere with signaling would provide a competitive advantage if competitive determinants, such as antimicrobial toxin production, were regulated by signaling, as has been suggested (An et al., 2006). However, a clear link between the disruption of signaling and competitive advantage has yet to be established.
Predation
In macroecological systems, predation, or the consumption of one organism by another, is frequently a key stabilizer of community structure (Estes, 1996; Estes et al., 2001; Henke and Bryant, 1999). The top predator often regulates abundance of other species that in turn regulate other species, providing a cascade of effects that have a sweeping influence. Often, this effect on the community far exceeds the numerical representation of the predator and can transform entire landscapes, which defines the predator as a keystone species (Paine, 1969; Ripple and Beschtab, 2003).
Predation of bacteria by microbial eukaryotes and bacteriophages provides a key link between microbial and macroorganismal food webs (Clarholm, 2002; Pernthaler, 2005) and has global effects on bacterial community structure and composition in many environments. In both freshwater and marine habitats, predation is a leading cause of bacterial mortality (Pernthaler, 2005; Thingstad, 2000). In some aquatic environments, top-down control by predation also appears
to regulate bacterial population sizes (Pernthaler, 2005). Additionally, predation has been suggested as an influence on bacterial species richness and evenness (Pernthaler, 2005; Zhang et al., 2007), selectively limiting population sizes of some readily culturable aquatic bacteria that rapidly proliferate when grazing pressure is experimentally reduced (Beardsley et al., 2003). In soil, predation by protozoa similarly limits bacterial population sizes and can influence bacterial community composition and structure (Clarholm, 2002; Murase et al., 2006). Difficulties associated with quantification of bacteriophage in soil have hampered efforts to ascertain the role of predation by phage in these ecosystems (Ashelford et al., 2003; Williamson et al., 2005). In engineered microbial communities, predation pressure can influence bacterial population structure by selecting for strains adapted to defend against predator attack (Kunin et al., 2008). Manipulation of microbial communities via phage that prey specifically on lineages of bacteria could be used as a tool to study community dynamics, given the strength of phage selective pressures in some communities (Breitbart et al., 2004).
Bacteria or archaea that prey on other bacteria or archaea appear to be relatively rare compared with their eukaryotic counterparts, but examples of each have been described. Bdellovibrio-like organisms are obligate bacterial predators, which now appear to be more diverse and widespread than previously recognized (Davidov et al., 2006a; Pinero et al., 2007). Most of these organisms penetrate the outer membrane and wall of their prey and replicate in the cytoplasm, thereby killing the host. However, some, including the Micavibrio sp. (Alphaproteobacteria), attach to the outside of prey cells and replicate epibiotically (Davidov et al., 2006b). The range of prey organisms targeted by different Bdellovibrio-like predators varies but typically includes only a limited number of species (Jurkevitch et al., 2000; Pineiro et al., 2004; Rogosky et al., 2006). A different predatory strategy is employed by a second group of bacterial predators, the myxobacteria (Deltaproteobacteria). Populations of myxobacteria exhibit cooperative, surface-associated motility and collectively subsume prey organisms they encounter by producing secreted and cell-associated degradative enzymes (Reichenbach, 1999). However, unlike Bdellovibrio-like organisms, myxobacteria can also obtain nutrients by degrading macromolecules instead of live prey; genome sequencing of Myxococcus xanthus suggests that prey bacteria serve as a source of branched-chain amino acids, which the predator does not have the capacity to synthesize (Goldman et al., 2006). In addition to many proteases and cell wall–degrading enzymes, myxobacteria also produce diverse secondary metabolites, which may also play a role in predation or may mediate competition with other species or other myxobacterial strains (Feigna and Velicer, 2005; Goldman et al., 2006). Finally, a number of gram-negative bacteria release membrane vesicles containing hydrolytic enzymes that can fuse with and lyse other bacteria (91, 117). Membrane-vesicle-mediated lysis may help to extract nutrients from target cells, although this has not been established empirically.
Parasitism
The only prokaryote thought to parasitize another prokaryote is Nanoarchaeum equitans, isolated from hydrothermal vents. N. equitans is small in physical stature and has a tiny, compact genome, less than 0.5 Mb, predicted to contain a 95% coding sequence (Huber et al., 2002; McCliment et al., 2006). This species is completely dependent on its host, the larger archaeon, Ignicoccus hospitalis (Huber er al., 2002; Paper et al., 2007). The genome of N. equitans lacks many key metabolic functions, including genes encoding glycolysis and trichloroacetic acid cycle enzymes, as well as most amino acid and lipid biosynthesis pathways, indicating that it must obtain many nutrients and metabolites from its host (Waters et al., 2003). The host species, however, can be found in a freeliving state, and association with N. equitans appears to take a toll on its fitness, thus suggesting that the smaller associate is a parasite (Huber er al., 2002; Paper et al., 2007).
Mutualistic and Commensal Interactions
At least as prevalent among microorganisms as the antagonistic interactions described above are interactions in which both partners benefit (mutualism) or in which one partner benefits with no apparent effect on the other (commensalism). Purely commensal relationships may not exist; perhaps we simply have not discovered the benefit to the second partner. More likely, those organisms are either beneficial or harmful to their hosts, depending on the community dynamics in the niche, but researchers have yet to delimit and quantify the costs and benefits exchanged between the host and symbiont. For example, many microbes in the humangut historically termed commensal are now recognized as critical factors in gut and immunity development, nutrient uptake, and homeostasis of the system (Hooper, 2004; Hooper et al., 2002 Rakoff-Nahoum et al., 2004). Furthermore, relationships may be context dependent, that is, an organism could be beneficial under certain conditions and commensal under others.
Obligate associations. In obligate mutualisms each partner depends on the other for survival and reproduction. One particularly elegant obligate microbial association is the phototrophic consortium detected in many freshwater habitats (Glaeser and Overmann, 2003a). In these assemblages, a central motile, nonphotosynthetic Betaproteobacterium from the family Comamonadaceae is surrounded by green sulfur bacteria in an organized structure (Frostl and Overmann, 1998; Kanzler et al., 2005). The epibiotic sulfur bacteria are thought to benefit from the motility provided by the central bacterium, enabling the consortia to chemotax toward sulfide (Glaeser and Overmann, 2003a). The central Comamonadaceae may benefit from carbon secreted by the sulfur bacterium during photoautotrophic growth (Glaeser and Overmann, 2003a, 2003b). Additionally, the partners appear to coordinate behaviors via as yet unidentified signal exchange. For example, the consortia chemotax toward sulfide and the organic compound 2-oxoglutarate
only in light, which the motile central organism itself cannot detect (Glaeser and Overmann, 2003b). The consortia also move preferentially to the optimal light wavelength absorbed by the nonmobile photosynthetic bacteria (Frostl and Overmann, 1998, 2000).
Several obligate associations between microbial species occur within the context of a eukaryotic host. For example, in the glassywinged sharpshooter, Homalodisca coagulata, metagenomic analysis of its microbial symbionts revealed the presence of complementary amino acid, vitamin, and cofactor biosynthetic pathways in two microbial symbionts, Baumannia cicadellinicola and Sulcia muelleri. Both symbionts are required to sustain the sharpshooter, which feeds on the amino acid–poor diet of plant xylem (Wu et al., 2006). Several species from another group of plant sap-feeding insects, the mealybugs, harbor not only multiple symbionts, but one symbiont, a Gammaproteobacterium, is housed inside the second symbiont, a Betaproteobacterium (von Dohlen et al., 2001). The functions provided to the host by each symbiont have not yet been identified, but the associations appear to be stably maintained and vertically transmitted, as reflected by cospeciation in symbiont phylogenies (Thao et al., 2002).
Facultative associations. Conditions under which one or both species of a mutualism or commensalism survive and maintain populations in the absence of the other partner are called facultative. Many instances of facultative mutualism in microbe-microbe relationships involve the exchange or sharing of nutritional resources. For example, metabolic cooperation can result from complementary degradative capabilities or from the ability of one organism to make use of byproducts generated by another. In the human oral cavity, metabolic cooperation plays a key role in structuring the complex, multispecies biofilm formed on tooth surfaces. The late successional stage colonizer Porphymonas gingivalis benefits the earlier colonizer Fusobacterium nucleatum by activating a host protease, plasmin, which F. nucleatum subsequently captures and uses to obtain nutrients (Darenfed et al., 1999). Another facultative commensalism is in plant root exudate, where peptidoglycan from the cell wall of Bacillus cereus rhizosphere isolates provides carbon to sustain the growth of Flavobacterium and Chryseobacterium species, which is otherwise carbon limited (Peterson, 2008; Peterson et al., 2006) without impacting the growth of B. cereus. In some cases, metabolic cooperation results from the ability of one organism to alleviate the effects of a toxin on another organism. For example, in a model system to evaluate effects of mixed organic waste on organisms important for detoxification, the p-cresoldegrading organism Pseudomonas putida DMP1 protected the p-cresol-sensitive strain Pseudomonas sp. strain GJ1, which could then degrade a second common waste compound, 2-chloroethanol (Cowan et al., 2000).
Syntrophy. The hallmark of syntrophic interactions, which can be obligate or facultative, is the coupling of metabolic processes in two organisms, typically
by transfer of electrons between the organisms by hydrogen or other carriers, which facilitates metabolisms that would otherwise be thermodynamically unfavorable. Under methanogenic conditions, syntrophy appears to facilitate a number of the intermediate transformations between primary fermentation of complex organic matter and eventual production of methane (Schink, 2002). In methane-rich marine sediments, syntrophy between archaea thought to perform reverse methanogenesis and sulfate-reducing bacteria plays a role in mediating methane oxidation, an important control of the flux of this potent greenhouse gas (Boetius et al., 2000, Hallam et al., 2004). Degradation of some xenobiotic compounds also relies on syntrophy. For example, interspecies hydrogen transfer from a sulfate-reducing organism facilitates tetrachloroethene dehalorespiration by another organism (Drzyzga and Gottschal, 2002). Similarly, vinyl chloride dechlorination by Methanosarcina spp. also requires interspecies hydrogen transfer by a syntrophic partner organism (Heimann et al., 2006).
Coaggregation and multispecies biofilm formation. Many beneficial interactions between microorganisms require the partners to be maintained in close proximity, which is often achieved by the formation of multispecies biofilms or aggregates. In some cases, most notably in the oral cavity of vertebrates, development of complex communities results from specific, receptor-mediated interactions between pairs of organisms, known as coaggregation (Lamont et al., 2002). Early colonizers to tooth surfaces, such as Streptococcus gordonii and other viridans streptococci, can bind a variety of host molecules and subsequently facilitate colonization by the second-stage species through coaggregation with specific partners (Kolenbrander et al., 1990). F. nucleatum, the most abundant gram-negative bacterium in mouths of healthy people, is thought to serve as a bridge between these early and subsequent late colonizers because of its ability to coaggregate with many species from both classes (Kolenbrander et al., 2002).
Evolution in Microbial Communities
The intersection of ecology and evolution is important to our understanding of communities but has not been sufficiently studied to produce a cohesive framework. Antagonistic and mutualistic behaviors have evolved as adaptations to life in a community. Organisms exploit or compete with each other for resources, leading to the grand diversity of ecological mechanisms in the biological world. Individual species evolve in the context of a community, resulting in coevolution, and the community evolves as a composite of many species. Identifying the selection pressures that favor certain interactions is the key to deriving an evolutionary understanding of microbial communities. And perhaps there is a larger conceptual framework to be developed that will describe microbial community evolution, with the entire community as the unit upon which selection acts.
In many ways, the evolution of prokaryotes and eukaryotes is similar. Natural selection and genetic drift operate on populationlevel genetic variation caused by mutation and gene flow. Together these processes alter the genetic composition of populations and directly and indirectly affect the species interactions that dictate community ecology. However, some evolutionary processes play different roles in prokaryotic and eukaryotic populations, and these contrasts are particularly important to consider in the context of microbial community dynamics.
Genetic variation is the target on which selection acts, whereas ecological forces, including biotic factors such as species interactions (competition, parasitism, mutualism), are the agents of selection. Thus, the two fields of study, population genetics and community ecology, seem inevitably coupled through evolution.
Most ecological and evolutionary theory has been developed on the basis of observations made in eukaryotic organisms. Natural selection, developed with plants and animals, and Mendelian genetics, originating from studies of plants, were integrated to form the modern synthesis, which is the basis of current evolutionary theory, but none of the major leaders in the development of the modern synthesis (Fisher, Dobzhansky, Haldane, Wright, Huxley, Mayr, Rensch, Simpson, and Stebbins) focused on prokaryotes. Consequently, models for understanding adaptation, evolution, and speciation in prokaryotic biology were not developed until the early 1980s (Levin, 1981). Advances in molecular biology have propelled the expansion of prokaryotic models for evolution over the past 20 years, from which two major differences between prokaryotic and eukaryotic evolution have emerged: the frequency of recombination and the phylogenetic breadth among which genetic materials can be exchanged. Intragenomic processes such as recombination are likely to have the greatest influence in short-term changes in a community, leading to population adaptation to changing conditions or new metabolic opportunities. Intergenomic processes such as horizontal gene transfer have profound effects on the long-term evolution of communities, possibly leading to the formation of new species (de la Cruz and Davies, 2000; Hoffmeister and Martin, 2003).
Although a superficial examination of evolutionary processes in prokaryotes and eukaryotes reveals stark differences, deeper examination might unite them. Clonal eukaryotes, for example, may be governed by similar principles as prokaryotes. More significantly, the same forces may regulate hybridization between plant species and interspecies gene transfer in prokaryotes and the resultant afront to the integrity of the species (de la Cruz and Davies, 2000; Hoffmeister and Martin, 2003).
Intragenomic alterations. Sequential point mutations and gene rearrangements can lead to adjustments in the genotypic and, consequently, phenotypic content of population members. Mutations or alterations that are selected typically improve the fitness of an organism in its current ecological niche, which is necessary to maintain interspecific interactions such as competition, predation, and mutualism.
Several hypotheses regarding microbial fitness are readily testable. For example, improvements in fitness over thousands of generations under glucoselimited conditions have been measured (Papadopoulos et al., 1999). An interesting and intensely studied pattern resulting from closely evolving interactions is the coevolutionary process, in which genetically based adaptations in one species invoke reciprocal genetic changes in populations of its partner species (e.g., competitor, parasite) or guilds of species (Thompson, 1994, 2005).
Horizontal gene transfer. The transfer of genetic information between species is a central mechanism of generating genetic variation in microbial communities. For example, multilocus sequence typing data and proteomic and comparative genomics data indicate that bacterial species in acid mine biofilm communities exchange large (up to hundreds of kilobases) regions of DNA as well as smaller sections that may play a role in resistance to phage (Lo et al., 2007; Tyson et al., 2004). Events of horizontal gene transfer can be detected through phylogenetics, by seeking atypical distributions of genes across organisms, or through phylogeny-independent methods that examine genes that appear aberrant in their current genomic context. Complete genome sequencing has arguably been the most important factor in unveiling instances of horizontal gene transfer, illustrating the impact of horizontal gene transfer on bacterial evolution (Bassler, 1999; Boetius et al., 2000; Borneman et al., 1996). Perhaps one of the most dramatic impacts of horizontal transfer of genetic information by accessory genetic elements and vectors of genes (e.g., viruses) is ecological. Horizontal gene transfer can enable a microbe to rapidly expand and/or alter its ecological niche, making this genetic process important when considering evolution in microbial communities through deep time (i.e. an evolutionary timescale rather than an ecological timescale). Horizontal gene transfer has also been proposed to contribute to speciation, which is a critical aspect of community function and evolution (de la Cruz and Davies, 2000; Hoffmeister and Martin, 2003).
Ecological processes, in turn, affect evolution by providing opportunities for interspecies gene transfer and providing selection pressure. The architecture of communities, which dictates proximity of cells of different species, affects the probability of gene exchange across wide phylogenetic distances. The physical and biological features of the community will affect the susceptibility of cells to transformation or transduction, thereby affecting the frequency of gene transfer. The ecological processes and characteristics of the community create the selection pressures that determine the direction of change in frequencies of certain genotypes.
When entire genes or groups of genes are transferred between individuals, especially distantly related individuals, a trait can rapidly sweep through a population under appropriate selection pressure. A contemporary example of this is the rapid spread of antibiotic resistance in bacterial populations. In other instances, the changes can lead to rapid lineage diversification (Riley et al., 2001). In some
cases these changes, especially those that involve the metabolic repertoire, enable the recipient of horizontal gene transfer to invade and adapt in a new ecological niche. Classic examples of niche-altering gene acquisitions include the lac operon by Escherichia coli and pathogenicity islands by Salmonella sp. Changes that enable an organism to invade a new niche(s) have strong implications at the community level: They have the potential to alter interactions between species and the structure, diversity, and robustness of communities. Ultimately, the ecological selection pressures that drive microbial evolution are major contributors to the emergent structure and function of the community.
Approaches to the Study of Microbial Communities
Community ecology, as it pertains to microbes, remains in its infancy. Most studies of microbemicrobe and host-microbe interactions have extracted the organisms from their native community and studied them as binary interactions; indeed, this is simpler to understand and a necessary step toward understanding interspecific interactions in a community context (Figure A9-2). However, the information gained from such studies can be inadequate or misleading, as has been shown repeatedly in macroecological research (Bronstein and Barbosa, 2002; Little and Currie, 2008; Silo-Suh et al., 1994; Stanton, 2003), and as such, results obtained from those studies must be interpreted with caution. To this end, we have parsed microbial ecology studies of communities into four groups on the basis of the questions being asked and presented them chronologically in terms of the order in which questions must be addressed and answered to generate further
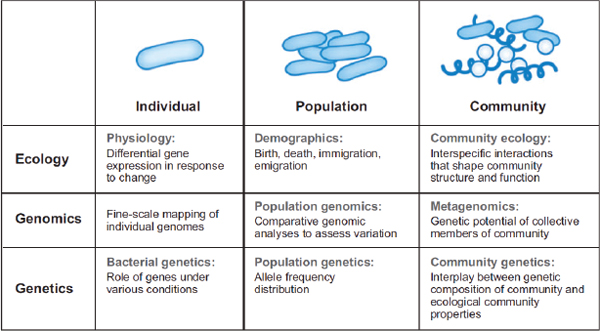
FIGURE A9-2 Progression from studies on the individual scale to studies on the community scale.
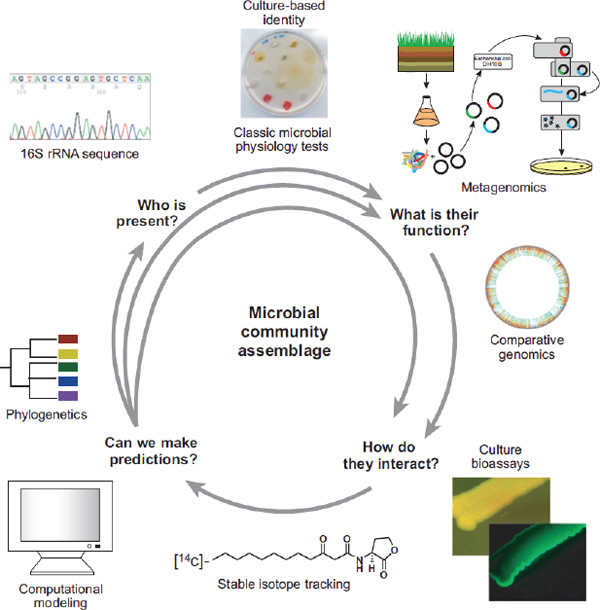
FIGURE A9-3 Four groups of questions in microbial ecology and some techniques to address them.
information on microbial community characteristics and processes. Each question is illustrated with classic experiments and recent technological advances that have enabled their investigation (Figure A9-3).
Who Is Present in the Community?
The first question a community ecologist asks is, Who makes up this community?, and this is indeed a good starting point. But with microorganisms, this is not a trivial question, nor has it been easy to identify the diversity of species found in various communities. Two central techniques are used to identify
microbial phylotypes within community samples: One technique relies on culturing, and the other is culture independent.
Culture-based methods. Koch’s discovery that bacteria could be isolated and grown in pure culture on solid artificial medium enabled the discipline bacteriology to develop. Growing bacteria in pure culture provided morphological and physiological data, which together provided the basis to identify bacterial species. More advanced culture techniques incorporated various nutrients and abiotic conditions that closely mimicked the environments from which the samples were isolated. However, recent estimates indicate that less than 1% of the membership of many communities is culturable, making it necessary to assess the identity of the as yet uncultured organisms to generate a complete list of community members.
Culture-independent methods. One molecular approach that provides a powerful complement to culture-dependent techniques is the amplification of 16S rRNA gene sequences directly from environmental samples, such as soil, using PCR and universal or domain-specific primers, which is usually followed by clone library construction. Clones are then screened to analyze sequence differences (Bond et al., 1995), or restriction fragment length polymorphisms (Moyer et al., 1994), which are then used to identify species. To date, 16S rRNA gene amplification and identification remain the most reliable tool to describe prokaryotic species. Because the gene is universal and can therefore be used as an identifier for any bacterial or archaeal species, it accounts for both culturable and nonculturable prokaryotic organisms, and it has phylogenetic meaning. There are, however, limitations to the 16S rRNA gene approach to phylogeny. Interspecies gene transfer muddies phylogenetic assessments derived from 16S rRNA. If organisms are hybrids with fragments of DNA of different organismal origins, then what is a species? Should they be defined by the 16S rRNA gene affiliation or by a census of functional genes? Prokaryote phylogeny is an emergent field and the species concept will be one to grapple with in the future.
The universal primers used to assess entire communities may not detect all species. Recent work suggests significant differences in the groups whose 16S rRNA genes are amplified when the universal primers are replaced by miniprimers with very broad specificity (Isenbarger et al., 2008). All methods impose bias and it is likely that further development of phylogenetic tools will reveal greater diversity and perhaps groups of organisms that are not suspected from current surveys.
What Are the Functions of Individual Organisms?
After identifying which organism(s) is present within a community, the next challenge for microbial ecologists is to identify which organism demonstrates each of the various metabolic processes in its native community.
Classic in vitro microbial physiology. Up until the last 15 years of the twentieth century, pure-culture experimental setup, as described above, was the central method of associating organisms with metabolic processes. In an effort to understand metabolic processes within the context of a microbe’s native community, it was typical to inoculate enrichment cultures with samples from the natural environment of interest, determine which bacteria grow, and then make inferences on the basis of substrate use about the microbe’s activity in its native community.
Metagenomics. The diversity of the as yet unculturable members of microbial communities is vast compared with that of the culturable members (Bintrim et al., 1997; Borneman et al., 1996, 1997; Kuske et al., 2002; Liles et al., 2003; McCaig et al., 2001; Quaiser et al., 2002). To capture and study the functional diversity of these organisms, a new field designated metagenomics has sprung to life. Metagenomics is the culture-independent analysis of genomes from an assemblage of microorganisms. A metagenomic analysis entails extracting DNAdirectly from soil, cloning it into a culturable host bacterium, and analyzing it (Rondon et al., 2000; Stein et al., 1996). This method has recently been used for massive capture and sequencing of DNA from the Sargasso Sea (Venter, 2004), acid mine drainage (Tyson et al., 2004), a Minnesota soil sample (Tringe et al., 2005), and a global ocean survey (Rusch et al., 2007). DeLong et al. (2006) applied metagenomics to planktonic microbial communities in the North Pacific Subtropical Gyre, in which they identified stratified microbial communities through comparative genomics delineated by taxonomic zonation and functional and metabolic potential. Through detailed analysis of the genes in each stratum, they inferred the photosynthetic activity at various depths in the ocean. They also found a surprisingly high frequency of cyanophage-infected cells (up to 12%), which likely structure the planktonic community via predation.
Functional metagenomics. Entire phyla in soil are known only by their 16Sr-RNAgene signatures, with nothing known about their physiology, genetics, or role in the soil community. Most work in metagenomics is driven by sequence analysis, but this work is limited by the ability to recognize gene function on the basis of sequence alone. Because many of the genes isolated from the environment have no significant similarity to genes of known function, an alternative approach is to search for genes of a particular function by functional metagenomics. In functional metagenomics, genes are sought that confer a function of interest on a host bacterium. This method requires that the genes be expressed, but it does not require that their functions be recognizable by sequence (Healy et al., 1995; Henne et al., 1999; Knietsch et al., 2003a, 2003b; Majernik et al., 2001; Streit et al., 2004; Winogradsky, 1895). Metagenomics: culture-independent analysis of DNA extracted directly from communities in environmental samples
Stable isotope probing. Stable isotope probing (SIP) involves introducing a stable isotopelabeled substrate into the community and tracking the movement of the substrate by extracting diagnostic molecules (e.g., lipids and nucleic acids) to determine which molecules have incorporated the substrate. Stable isotope ratios have been used by ecologists to follow resource use through trophic levels for decades (Deniro and Epstein, 1978, 1981; Schoeninger et al., 1983). More recently, stable isotopes have become a tool used by microbial ecologists to track the movement of substrates through microbial communities and identify which community members utilize which substrates. The main advantages of SIP are that it does not rely on culturability, and it allows direct observation of substrate movement with minimal disruption of the natural environment and community. SIP in microbial communities has been recently reviewed elsewhere (Kreuzer-Martin, 2007).
Single-cell analyses. Fully comprehending community function necessitates understanding the function and activities at all levels, including that of individual members. Individuals within a population vary in levels of expression of certain genes and growth rates (Kaern et al., 2005). For example, using flow cells and laser scanning, Strovas et al. (Srovas et al., 2007) revealed that individuals within Methylobacterium extorquens grown continuously vary in cell size at division, division time, and growth rate, and they respond differently to a substrate shift. In addition to explaining more about individual members of a community, single-cell analyses should also prove useful for studying rare and uncultured organisms. Although used to amplify low-quantity DNA for metagenomic studies, multiple displacement amplification, a technique that involves random primers and φ29 DNA polymerase), can also be used to amplify whole genomes of single cells (Gonzalex et al., 2005; Hellani et al., 2004; Neufeld et al., 2008). Multiple displacement amplification combined with technologies for capturing individual cells, such as microfluids, may lead to situations in which the genomes of rare members could be analyzed to determine the potential function of themember within its community.
How Do Organisms Interact?
Interactions are the fulcrum of communities. Studying them is essential to understanding community function, but that study is challenging. Lessons from study of cultured organisms can guide methodological choices. Culturing has been, by far, the most impactful method introduced into microbiology since the microscope. The study of organisms in pure culture has produced the staggering depth and breadth of current knowledge about cellular microbiology. Likewise, coculture can be used to study interactions in a controlled environment in which variables can be manipulated. Bacterial genetics has been similarly influential, providing experimental precision and rigor that elevate associations to causal
relationships. The adaptation of cellular genetics to study interactions among organisms is likely to yield surprises and provide a foundation for community ecology principles.
Coculture experiments. Although the trend in the twentieth century was toward reduction, which meant studying microbes in isolation or sometimes pairs, studying organismal interactions in their native communities, or in assemblages that more closely resemble native communities, is not a recent idea. In 1895, Winogradsky isolated Clostridium pasteurianum, an organism that fixes free nitrogen from the air (Rhee et al., 2004; Tyson et al., 2004). But through a series of pure-culture and coculture experiments, it became clear to Winogradsky that C. pasteurianum, a strict anaerobe, could only fix nitrogen under aerobic conditions. If C. pasteurianum was grown in close association with an extreme aerobe that essentially creates an anaerobic environment for C. pasteurianum, nitrogen fixation was restored. Studying microbial assemblages in culture remains an important method to investigate organismal interactions. In 1993 Gilbert and colleagues (Gilbert et al., 1993) reported that the application of Bacillus cereus UW85, an antibiotic-producing strain used for biological control, to the soybean rhizosphere increased the abundance of bacteria from the Cytophaga-Flavobacterium (CF) group. More recently, Peterson et al. (Peterson et al., 2006) used coculturing to determine that the commensal relationship between B. cereus UW85 and the bacteria from the CF group is mediated by a B. cereus peptidoglycan. Although coculture experiments are invaluable to our understanding of interspecies interactions, a main restriction is that they are limited to a small number of species interacting together in liquid or on a plate.
Bacterial genetics. Just as bacterial genetics has provided profound insight into the function of organisms in pure culture, it can lead to an understanding of species interactions in communities. The foundation of genetics is construction of random mutations followed by mutant hunts. The randomness coupled with assessment of phenotype produces a minimally biased approach in which the genes required for a certain function or process are identified. In this age of gene arrays and genomics, mutant hunts have been replaced by more-directed methods, but broad searches remain critical to expanding our knowledge beyond the human imagination. Targeted approaches typically require the researcher to make educated predictions about the nature or type of genes involved in a process. Broad mutant hunts enable the bacteria to answer that question. Historically, the answers have been surprising, and many of the genes identified would not have been predicted to be involved in the process on the basis of sequence alone.
The community context presents new challenges for bacterial genetics. Identifying genes involved in community function requires complex screens that will be difficult to apply to large collections of mutants, but the search will be worthwhile. In addition, studies of targeted mutants in communities can be revealing.
For example, the study of genes involved in quorum sensing in pure culture and in a community provides very different insights. The ubiquitous presence of genes involved in quorumsensing indicates that density-dependent cellcell communication is a common mode of bacterial communication (6, Manefieled and Turner, 2002; Miller and Bassler, 2001). Demonstration of signal exchange between strains in a community in a caterpillar gut provided surprising evidence of stability of quorum-sensing signal in a high pH environment (B. Borlee, G. Geske, C. Robinson, H. Blackwell & J. Handelsman, manuscript in revision). Genes that code for antibacterial compounds are found in several environmental isolates (Brinkhoff et al., 2004; Derzelle et al., 2002; Emmert et al., 2004; Li et al., 2007). The role of antimicrobials in nature is controversial (Brinkhoff et al., 2004; Davies, 2006; Derzelle et al., 2002; Emmert et al., 2004; Li et al., 2007; Yim et al., 2007). Some studies, however, have shown that producing these compounds yields a competitive advantage for bacteria (Franks et al., 2006; Giddens et al., 2003). An antibacterial protein produced by a marine bacterium is important for its competition with other marine bacteria for the formation of biofilms as well as dispersal of cells from biofilms (Mai-Prochnow et al., 2004; Rao et al., 2005).
Can We Make Predictions at the Community Scale?
Perhaps the most important implication of information on ecological community principles and dynamics from both an application and a theoretical standpoint is the potential to build predictive models. By defining fundamental principles of microbial community ecology derived from phylogenetically and ecologically disparate systems amenable to experimental manipulation, we can generate models to predict information about other communities that are less tractable for study. Much of the baseline research needed to generate such models falls into the categories described above, namely, who is present in a community, what is their function, and how do they interact with one another. Advances in molecular biology, and computational biology in particular, have allowed development in predictive ecological modeling that is poised for application to microbial communities.
Integrative modeling. In parallel with the recurring theme of moving from reductionist science to systems-based biology, many current approaches toward understanding properties of microbial communities include integrating biochemistry, thermodynamics, metabolite transport and utilization, metagenomic sequencing, regulatory and metabolic network analysis, and comparative and evolutionary genomics. On the mechanistic scale, several groups aim to predict microbially mediated metabolic activities in specific environments using microarrays and to predict a microbe’s behavior and lifestyle directly from its genomic sequence (Antonovics, 1992). On the ecological scale, ecological niche modeling packages can output predictions of geographic ranges for species on the basis of
current species records and layers of environmental data (e.g., GARP, Genetic Algorithm for Rule-set Production).
Community genetics. An integrative field of study becoming increasingly important in generating predictions about how microbial community members interact is community genetics, which involves coupling changes in genetic distributions with species interactions and community structure (Dungey et al., 2000; Whitham et al., 2003). A few studies of macroecological systems have generated predictions. For example, Whitham and colleagues found that genetic variation in plants affects diverse communities of insect herbivores, birds, and fungi (Whitham et al., 2003). Other studies have shown that population dynamics and trophic interactions affect the rate at which pests evolve resistance to genetically engineered crops. Experimental results from a predator-prey system (rotifers that consume algae) provided the basis for building models for ecological and evolutionary hypotheses about the predator-prey cycles. These studies in situations involving rapid evolution model successfully predicted ecological consequences (Shertzer et al., 2002).
There has been little application of community genetics to make predictions of ecological phenomena in predominantly microbial communities, but it will be a fruitful avenue of research. Community genetics in microbial communities has the special power of using constructed, defined mutants that can be introduced into a community. The behavior of the community in the presence of the mutant and wild type can be compared, providing insight into the role of a single gene in a population of a species and in the community context. Just as bacterial genetics brought power and precision to the dissection of bacterial cell processes in the twentieth century, the same approaches will transform our understanding of community processes in the twentyfirst century.
Summary Points
- An important feature of microbial communities is robustness, which has structural and functional components.
- Understanding microbial community ecology necessitates study of evolutionary mechanisms that underlie community structure.
- Recent advances in molecular biology provide a means to address questions about microbial communities, including both culturable and as yet uncultured members.
- Microbial communities offer a unique opportunity to apply community genetics in a manner that is difficult in most macroorganism communities: Introduction of defined mutants into communities will advance our understanding of the interplay between community genetic composition and community structure and function under various selection pressures.
- The approaches described here will contribute to the inputs needed to build and test predictive models that will elucidate principles that govern community interactions, providing a set of rules of engagement among community members that dictate community structure and function.
Disclosure Statement
The authors are not aware of any biases that might be perceived as affecting the objectivity of this review.
Acknowledgements
We are grateful for support from an Interdisciplinary Hatch Project from the University of Wisconsin College of Agricultural and Life Sciences and the Howard Hughes Medical Institute.
We thank Karen Cloud-Hansen for helpful discussions of an earlier draft of the manuscript.
References
Adamczyk J, Hesselsoe M, Iversen N, Horn M, Lehner A, et al. 2003. The isotope array, a new tool that employs substrate-mediated labeling of rRNA for determination of microbial community structure and function. Appl. Environ. Microbiol. 69:6875–87
Alonso-Saez L, Balague V, Sa EL, Sanchez O, Gonzalez JM, et al. 2007. Seasonality in bacterial diversity in north-west Mediterranean coastal waters: assessment through clone libraries, fingerprinting and FISH. FEMS Microbiol. Ecol. 60:98–112
An D, Danhorn T, Fuqua C, Parsek MR. 2006. Quorum sensing and motility mediate interactions between Pseudomonas aeruginosa and Agrobacterium tumefaciens in biofilm cocultures. Proc. Natl. Acad. Sci. USA 103:3828–33
Antonovics J. 1992. Towards community genetics. In Plant Resistance to Herbivores and Pathogens: Ecology, Evolution, and Genetics, ed. RS Fritz, EL Simms, pp. 426–49. Chicago: Univ. Chicago Press.
Ashelford KE, Day MJ, Fry JC. 2003. Elevated abundance of bacteriophage infecting bacteria in soil. Appl. Environ. Microbiol. 69:285–89
Bassler BL. 1999. How bacteria talk to each other: regulation of gene expression by quorum sensing. Curr. Opin. Microbiol. 2:582–87
Beardsley C, Pernthaler J, Wosniok W, Amann R. 2003. Are readily culturable bacteria in coastal North Sea waters suppressed by selective grazing mortality? Appl. Environ. Microbiol. 69:2624–30
Begon M, Harper J, Townsend C. 1990. Ecology: Individuals, Populations, and Communities. Cambridge, MA: Blackwell. 945 pp.
Bintrim SB, Donohue TJ, Handelsman J, Roberts GP, Goodman RM. 1997. Molecular phylogeny of Archaea from soil. Proc. Natl. Acad. Sci. USA 94:277–82
Boetius A, Ravenschlag K, Schubert CJ, Rickert D, Widdel F, et al. 2000. A marine microbial consortium apparently mediating anaerobic oxidation of methane. Nature 407:623–26
Bond PL, Hugenholtz P, Keller J, Blackall LL. 1995. Bacterial community structures of phosphateremoving and nonphosphate-removing activated sludges from sequencing batch reactors. Appl. Environ. Microbiol. 61:1910–16
Bonsall RF, Weller DM, Thomashow LS. 1997. Quantification of 2,4-diacetylphloroglucinol produced by fluorescent Pseudomonas spp. in vitro and in the rhizosphere of wheat. Appl. Environ. Microbiol. 63:951–55
Borneman J, Skroch PW, O’Sullivan KM, Palus JA, Rumjanek NG, et al. 1996. Molecular microbial diversity of an agricultural soil inWisconsin. Appl. Environ. Microbiol. 62:1935–43
Borneman J, Triplett EW. 1997. Molecular microbial diversity in soils from eastern Amazonia: evidence for unusual microorganisms and microbial population shifts associated with deforestation. Appl. Environ. Microbiol. 63:2647–53
Breitbart M, Wegley L, Leeds S, Schoenfeld T, Rohwer F. 2004. Phage community dynamics in hot springs. Appl. Environ. Microbiol. 70:1633–40
Brinkhoff T, Bach G, Heidorn T, Liang L, Schlingloff A, Simon M. 2004. Antibiotic production by a Roseobacter clade-affiliated species from the German Wadden Sea and its antagonistic effects on indigenous isolates. Appl. Environ. Microbiol. 70:2560–65
Brodie EL, DeSantis TZ, Parker JPM, Zubietta IX, Piceno YM, Andersen GL. 2007. Urban aerosols harbor diverse and dynamic bacterial populations. Proc. Natl. Acad. Sci. USA 104:299–304
Bronstein J, Barbosa P. 2002. Multi-trophic/multi-species interactions: the role of nonmutualists in shaping and mediating mutualisms. In Multitrophic Interactions, ed. T Tscharntke, BA Hawkins, pp. 44–66. Cambridge, UK: Cambridge Univ. Press
Cardoza YJ, Klepzig KD, Raffa KF. 2006. Bacteria in oral secretions of an endophytic insect inhibit antagonistic fungi. Ecol. Entomol. 31:636–45
Carrino-Kyker SR, Swanson AK. 2008. Temporal and spatial patterns of eukaryotic and bacterial communities found in vernal pools. Appl. Environ. Microbiol. 74:2554–57
Case RJ, Boucher Y, Dahllof I, Holmstrom C, Doolittle WF, Kjelleberg S. 2007. Use of 16S rRNA and rpoB genes as molecular markers for microbial ecology studies. Appl. Environ. Microbiol. 73:278–88
Chandler DP, Jarrell AE, Roden ER, Golova J, Chernov B, et al. 2006. Suspension array analysis of 16S rRNA from Fe- and SO42-reducing bacteria in uranium-contaminated sediments undergoing bioremediation. Appl. Environ. Microbiol. 72:4672–87
Chenier MR, Beaumier D, Fortin N, Roy R, Driscoll BT, et al. 2006. Influence of nutrient inputs, hexadecane, and temporal variations on denitrification and community composition of river biofilms. Appl. Environ. Microbiol. 72:575–84
Chu H, Fujii T, Morimoto S, Lin X, Yagi K, et al. 2007. Community structure of ammonia-oxidizing bacteria under long-term application of mineral fertilizer and organic manure in a sandy loam soil. Appl. Environ. Microbiol. 73:485–91
Clarholm M. 2002. Bacteria and protozoa as integral components of the forest ecosystem—their role in creating a naturally varied soil fertility. Antonie van Leeuwenhoek 81:309–18
Colwell RK. 2005. EstimateS Ver. 7.5: statistical estimation of species richness and shared species from samples. (Software and User’s Guide) http://viceroy.eeb.uconn.edu/EstimateSPages/EstimateSSupport.htm
Compant S, Duffy B, Nowak J, Clement C, Barka EA. 2005. Use of plant growth-promoting bacteria for biocontrol of plant diseases: principles, mechanisms of action, and future prospects. Appl. Environ. Microbiol. 71:4951–59
Cottrell MT, Kirchman DL. 2000. Natural assemblages of marine Proteobacteria and members of the Cytophaga-Flavobacter cluster consuming low- and high-molecular-weight dissolved organic matter. Appl. Environ. Microbiol. 66:1692–97
Cowan SE, Gilbert E, Liepmann D, Keasling JD. 2000. Commensal interactions in a dual-species biofilm exposed to mixed organic compounds. Appl. Environ. Microbiol. 66:4481–85
Cox CR, Gilmore MS. 2007. Native microbial colonization of Drosophila melanogaster and its use as a model of Enterococcus faecalis pathogenesis. Infect. Immun. 75:1565–76
Currie CR, Poulsen M, Mendenhall J, Boomsma JJ, Billen J. 2006. Coevolved crypts and exocrine glands support mutualistic bacteria in fungus-growing ants. Science 311:81–83
Curtis TP, Head IM, Lunn M, Woodcock S, Schloss PD, Sloan WT. 2006. What is the extent of prokaryotic diversity? Philos. Trans. R. Soc. London Ser. B 361:2023–37
Curtis TP, Sloan WT. 2004. Prokaryotic diversity and its limits: microbial community structure in nature and implications for microbial ecology. Curr. Opin. Microbiol. 7:221–26
Curtis TP, Sloan WT, Scannell JW. 2002. Estimating prokaryotic diversity and its limits. Proc. Natl. Acad. Sci. USA 99:10494–99
Darenfed H, Grenier D, Mayrand D. 1999. Acquisition of plasmin activity by Fusobacterium nucleatum subsp. nucleatum and potential contribution to tissue destruction during periodontitis. Infect. Immun. 67:6439–44
Davidov Y, Friedjung A, Jurkevitch E. 2006a. Structure analysis of a soil community of predatory bacteria using culture-dependent and culture-independent methods reveals a hitherto undetected diversity of Bdellovibrio-and-like organisms. Environ. Microbiol. 8:1667–73
Davidov Y, Huchon D, Koval SF, Jurkevitch E. 2006b. A new alpha-proteobacterial clade of Bdellovibriolike predators: implications for the mitochondrial endosymbiotic theory. Environ. Microbiol. 8:2179–88
Davies J. 2006. Are antibiotics naturally antibiotics? J. Ind. Microbiol. Biotechnol. 33:496–99
Davies J, Spiegelman GB, Yim G. 2006. The world of subinhibitory antibiotic concentrations. Antimicrobials/Genomics 9:445–53
de Carcer DA, Martin M, Karlson U, Rivilla R. 2007. Changes in bacterial populations and in biphenyl dioxygenase gene diversity in a polychlorinated biphenyl-polluted soil after introduction of willow trees for rhizoremediation. Appl. Environ. Microbiol. 73:6224–32
de la Cruz F, Davies J. 2000. Horizontal gene transfer and the origin of species: lessons from bacteria. Trends Microbiol. 8:128–33
DeLong EF, Preston CM, Mincer T, Rich V, Hallam SJ, et al. 2006. Community genomics among stratified microbial assemblages in the ocean’s interior. Science 311:496–503
Deniro MJ, Epstein S. 1978. Influence of diet on distribution of carbon isotopes in animals. Geochim. Cosmochim. Acta 42:495–506
Deniro MJ, Epstein S. 1981. Influence of diet on the distribution of nitrogen isotopes in animals. Geochim. Cosmochim. Acta 45:341–51
Derzelle S, Duchaud E, Kunst F, Danchin A, Bertin P. 2002. Identification, characterization, and regulation of a cluster of genes involved in carbapenem biosynthesis in Photorhabdus luminescens. Appl. Environ. Microbiol. 68:3780–89
Diaz PI, Chalmers NI, Rickard AH, Kong C, Milburn CL, et al. 2006. Molecular characterization of subject-specific oral microflora during initial colonization of enamel. Appl. Environ. Microbiol. 72:2837–48
Drakare S. 2002. Competition between picoplanktonic cyanobacteria and heterotrophic bacteria along crossed gradients of glucose and phosphate. Microb. Ecol. 44:327–35
Drzyzga O, Gottschal JC. 2002. Tetrachloroethene dehalorespiration and growth of Desulfitobacterium frappieri TCE1 in strict dependence on the activity of Desulfovibrio fructosivorans. Appl. Environ. Microbiol. 68:642–49
Dungey HS, Potts BM, Whitham TG, Li HF. 2000. Plant genetics affects arthropod community richness and composition: evidence from a synthetic eucalypt hybrid population. Evol. Int. J. Org. Evol. 54:1938–46
Dykhuizen DE. 1998. Santa Rosalia revisited: Why are there so many species of bacteria? Antonie van Leeuwenhoek 73:25–33
Emmert EAB, Klimowicz AK, Thomas MG, Handelsman J. 2004. Genetics of zwittermicin A production by Bacillus cereus. Appl. Environ. Microbiol. 70:104–13
Estes JA. 1996. Predators and ecosystem management. Wildl. Soc. Bull. 24:390–96
Estes JA, Crooks K, Holt R. 2001. Predators, ecological role of. In Encyclopedia of Biodiversity, ed. SA Levin, 4:857–78. San Diego, CA: Academic Press
Feil EJ, Holmes EC, Bessen DE, Chan MS, Day NP, et al. 2001. Recombination within natural populations of pathogenic bacteria: short-term empirical estimates and long-term phylogenetic consequences. Proc. Natl. Acad. Sci. USA 98:182–87
Fiegna F, Velicer GJ. 2005. Exploitative and hierarchical antagonism in a cooperative bacterium. PLoS Biol. 3:e370
Francis CA, Roberts KJ, Beman JM, Santoro AE, Oakley BB. 2005. Ubiquity and diversity of ammoniaoxidizing archaea in water columns and sediments of the ocean. Proc. Natl. Acad. Sci. USA 102:14683–88
Franks A, Egan S, Holmstrom C, James S, Lappin-Scott H, Kjelleberg S. 2006. Inhibition of fungal colonization by Pseudoalteromonas tunicata provides a competitive advantage during surface colonization. Appl. Environ. Microbiol. 72:6079–87
Frostl JM, Overmann J. 1998. Physiology and tactic response of the phototrophic consortium“Chlorochromatium aggregatum.” Arch. Microbiol. 169:129–35
Frostl JM, Overmann J. 2000. Phylogenetic affiliation of the bacteria that constitute phototrophic consortia. Arch. Microbiol. 174:50–58
Gans J, Wolinsky M, Dunbar J. 2005. Computational improvements reveal great bacterial diversity and high metal toxicity in soil. Science 309:1387–90
Gentile ME, Lynn Nyman J, Criddle CS. 2007. Correlation of patterns of denitrification instability in replicated bioreactor communities with shifts in the relative abundance and the denitrification patterns of specific populations. ISME J. 1:714–28
Geraci A. 1991. IEEE Standard Computer Dictionary: Compilation of IEEE Standard Computer Glossaries. New York: Inst. Elect. Electron. Eng. Inc.
Giddens SR, Houliston GJ, Mahanty HK. 2003. The influence of antibiotic production and preemptive colonization on the population dynamics of Pantoea agglomerans (Erwinia herbicola) Eh1087 and Erwinia amylovora in planta. Environ. Microbiol. 5:1016–21
Gilbert G, Parke JL, Clayton MK, Handelsman J. 1993. Effects of an introduced bacterium on bacterial communities on roots. Ecology 74:840–54
Gil-Turnes MS, Fenical W. 1992. Embryos of Homarus americanus are protected by epibiotic bacteria. Biol. Bull. 182:105–8
Gil-Turnes MS, Hay ME, Fenical W. 1989. Symbiotic marine bacteria chemically defend crustacean embryos from a pathogenic fungus. Science 246:116–18
Girvan MS, Campbell CD, Killham K, Prosser JI, Glover LA. 2005. Bacterial diversity promotes community stability and functional resilience after perturbation. Environ. Microbiol. 7:301–13
Glaeser J, Overmann J. 2003a. Characterization and in situ carbon metabolism of phototrophic consortia. Appl. Environ. Microbiol. 69:3739–50
Glaeser J, Overmann J. 2003b. The significance of organic carbon compounds for in situ metabolism and chemotaxis of phototrophic consortia. Environ. Microbiol. 5:1053–63
Gogarten JP, Doolittle WF, Lawrence JG. 2002. Prokaryotic evolution in light of gene transfer. Mol. Biol. Evol. 19:2226–38
Goldman BS, Nierman WC, Kaiser D, Slater SC, Durkin AS, et al. 2006. Evolution of sensory complexity recorded in a myxobacterial genome. Proc. Natl. Acad. Sci. USA 103:15200–5
Gonzalez JM, Portillo MC, Saiz-Jimenez C. 2005. Multiple displacement amplification as a prepolymerase chain reaction (pre-PCR) to process difficult to amplify samples and low copy number sequences from natural environments. Environ. Microbiol. 7:1024–28
Gopal PK, Prasad J, Smart J, Gill HS. 2001. In vitro adherence properties of Lactobacillus rhamnosus DR20 and Bifidobacterium lactis DR10 strains and their antagonistic activity against an enterotoxigenic Escherichia coli. Int. J. Food Microbiol. 67:207–16
Guarner F, Malagelada JR. 2003. Gut flora in health and disease. Lancet 361:512–19
Hallam SJ, Putnam N, Preston CM, Detter JC, Rokhsar D, et al. 2004. Reverse methanogenesis: testing the hypothesis with environmental genomics. Science 305:1457–62
Handelsman J. 2004. Metagenomics: application of genomics to uncultured microorganisms. Microbiol. Mol. Biol. Rev. 68:669–85
Hansel CM, Fendorf S, Jardine PM, Francis CA. 2008. Changes in bacterial and archaeal community structure and functional diversity along a geochemically variable soil profile. Appl. Environ. Microbiol. 74:1620–33
Hartmann M, Widmer F. 2006. Community structure analyses are more sensitive to differences in soil bacterial communities than anonymous diversity indices. Appl. Environ. Microbiol. 72:7804–12
Healy FG, Ray RM, Aldrich HC, Wilkie AC, Ingram LO, Shanmugam KT. 1995. Direct isolation of functional genes encoding cellulases from the microbial consortia in a thermophilic, anaerobic digester maintained on lignocellulose. Appl. Microbiol. Biotechnol. 43:667–74
Heimann AC, Batstone DJ, Jakobsen R. 2006. Methanosarcina spp. drive vinyl chloride dechlorination via interspecies hydrogen transfer. Appl. Environ. Microbiol. 72:2942–49
Hellani A, Coskun S, Sakati N, Benkhalifa M, Al-Odaib A, Ozand P. 2004. Multiple displacement amplification on single cell and possible preimplantation genetic diagnosis applications. Fertil. Steril. 82:S28
Henke SE, Bryant FC. 1999. Effects of coyote removal on the faunal community in western Texas. J. Wildl. Manag. 63:1066–81
Henne ADR, Schmitz RA, Gottschalk G. 1999. Construction of environmental DNA libraries in Escherichia coli and screening for the presence of genes conferring utilization of 4-hydroxybutyrate. Appl. Environ. Microbiol. 65:3901–7
Hoffmeister M, Martin W. 2003. Interspecific evolution: microbial symbiosis, endosymbiosis and gene transfer. Environ. Microbiol. 5:641–49
Hooper LV. 2004. Bacterial contributions to mammalian gut development. Trends Microbiol. 12:129–34
Hooper LV, Midtvedt T, Gordon JI. 2002. How host-microbial interactions shape the nutrient environment of the mammalian intestine. Annu. Rev. Nutr. 22:283–307
Huber H, Hohn MJ, Rachel R, Fuchs T, Wimmer VC, Stetter KO. 2002. A new phylum of Archaea represented by a nanosized hyperthermophilic symbiont. Nature 417:63–67
Isenbarger TA, Finney M, Ríos-Velázquez C, Handelsman J, Ruvkun G. 2008. Miniprimer PCR, a new lens for viewing the microbial world. Appl. Environ. Microbiol. 74:840–49
Ives AR, Carpenter SR. 2007. Stability and diversity of ecosystems. Science 317:58–62
Jurkevitch E, Minz D, Ramati B, Barel G. 2000. Prey range characterization, ribotyping, and diversity of soil and rhizosphere Bdellovibrio spp. isolated on phytopathogenic bacteria. Appl. Environ. Microbiol. 66:2365–71
Kadurugamuwa JL, Beveridge TJ. 1996. Bacteriolytic effect of membrane vesicles from Pseudomonas aeruginosa on other bacteria including pathogens: conceptually new antibiotics. J. Bacteriol. 178:2767–74
Kaern M, Elston TC, Blake WJ, Collins JJ. 2005. Stochasticity in gene expression: from theories to phenotypes. Nat. Rev. Genet. 6:451–64
Kaltenpoth M, Gottler W, Herzner G, Strohm E. 2005. Symbiotic bacteria protect wasp larvae from fungal infestation. Curr. Biol. 15:475–79
Kan J, Suzuki MT, Wang K, Evans SE, Chen F. 2007. High temporal but low spatial heterogeneity of bacterioplankton in the Chesapeake Bay. Appl. Environ. Microbiol. 73:6776–89
Kanzler BEM, Pfannes KR, Vogl K, Overmann J. 2005. Molecular characterization of the nonphotosynthetic partner bacterium in the consortium “Chlorochromatium aggregatum.” Appl. Environ. Microbiol. 71:7434–41
Katayama T, Tanaka M, Moriizumi J, Nakamura T, Brouchkov A, et al. 2007. Phylogenetic analysis of bacteria preserved in a permafrost ice wedge for 25,000 years. Appl. Environ. Microbiol. 73:2360–63
Keel C, Schnider U, Maurhofer M, Voisard C, Laville J, et al. 1992. Suppression of root diseases by Pseudomonas fluorescens CHA 0: importance of the bacterial secondary metabolite 2,4-di-acetylphloroglucinol. Mol. Plant-Microbe Interact. 5:4–13
Kent AD, Jones SE, Lauster GH, Graham JM, Newton RJ, McMahon KD. 2006. Experimental manipulations of microbial food web interactions in a humic lake: shifting biological drivers of bacterial community structure. Environ. Microbiol. 8:1448–59
Kikuchi Y, Graf J. 2007. Spatial and temporal population dynamics of a naturally occurring two-species microbial community inside the digestive tract of the medicinal leech. Appl. Environ. Microbiol. 73:1984–91
Kitano H. 2002. Computational systems biology. Nature 420:206–10
Kitano H. 2003. Cancer robustness: tumour tactics. Nature 426:125
Knietsch A, Bowien S, Whited G, Gottschalk G, Daniel R. 2003a. Identification and characterization of coenzyme B-12-dependent glycerol dehydratase- and diol dehydratase-encoding genes from metagenomic DNA libraries derived from enrichment cultures. Appl. Environ. Microbiol. 69:3048–60
Knietsch A, Waschkowitz T, Bowien S, Henne A, Daniel R. 2003b. Metagenomes of complex microbial consortia derived from different soils as sources for novel genes conferring formation of carbonyls from short-chain polyols on Escherichia coli. J. Mol. Microbiol. Biotechnol. 5:46–56
Kolenbrander PE, Andersen RN, Blehert DS, Egland PG, Foster JS, Palmer RJ Jr. 2002. Communication among oral bacteria. Microbiol. Mol. Biol. Rev. 66:486–505
Kolenbrander PE, Andersen RN, Moore LV. 1990. Intrageneric coaggregation among strains of human oral bacteria: potential role in primary colonization of the tooth surface. Appl. Environ. Microbiol. 56:3890–94
Kreuzer-Martin HW. 2007. Stable isotope probing: linking functional activity to specific members of microbial communities. Soil Sci. Soc. Am. J. 71:611–19
Kunin V, He S, Warnecke F, Peterson SB, Garcia Martin H, et al. 2008. A bacterial metapopulation adapts locally to phage predation despite global dispersal. Genome Res. 18:293–97
Kuske CR, Ticknor LO, Miller ME, Dunbar JM, Davis JA, et al. 2002. Comparison of soil bacterial communities in rhizospheres of three plant species and the interspaces in an arid grassland. Appl. Environ. Microbiol. 68:1854–63
Lamont RJ, El-Sabaeny A, Park Y, Cook GS, Costerton JW, Demuth DR. 2002. Role of the Streptococcus gordonii SspB protein in the development of Porphyromonas gingivalis biofilms on streptococcal substrates. Microbiology 148:1627–36
Leadbetter JR, Greenberg EP. 2000. Metabolism of acyl-homoserine lactone quorum-sensing signals by Variovorax paradoxus. J. Bacteriol. 182:6921–26
LeBlanc PM, Hamelin RC, Filion M. 2007. Alteration of soil rhizosphere communities following genetic transformation of white spruce. Appl. Environ. Microbiol. 73:4128–34
Lee YK, Puong KY. 2002. Competition for adhesion between probiotics and human gastrointestinal pathogens in the presence of carbohydrate. Br. J. Nutr. 88(Suppl. 1):S101–8
Lepere C, Boucher D, Jardillier L, Domaizon I, Debroas D. 2006. Succession and regulation factors of small eukaryote community composition in a lacustrine ecosystem (Lake Pavin). Appl. Environ. Microbiol. 72:2971–81
Levin BR. 1981. Periodic selection, infectious gene exchange, and the genetic structure of E. coli populations. Genetics 99:1–23
Levin BR, Bergstrom CT. 2000. Bacteria are different: observations, interpretations, speculations, and opinions about the mechanisms of adaptive evolution in prokaryotes. Proc. Natl. Acad. Sci. USA 97:6981–85
Li J, Beatty PK, Shah S, Jensen SE. 2007. Use of PCR-targeted mutagenesis to disrupt production of fusaricidin-type antifungal antibiotics in Paenibacillus polymyxa. Appl. Environ. Microbiol. 73:3480–89
Li Z, Clarke AJ, Beveridge TJ. 1998. Gram-negative bacteria produce membrane vesicles which are capable of killing other bacteria. J. Bacteriol. 180:5478–83
Liles MR, Manske BF, Bintrim SB, Handelsman J, Goodman RM. 2003. A census of rRNA genes and linked genomic sequences within a soil metagenomic library. Appl. Environ. Microbiol. 69:2684–91
Lin Y-H, Xu J-L, Hu J, Wang L-H, Ong SL, et al. 2003. Acyl-homoserine lactone acylase from Ralstonia strain XJ12B represents a novel and potent class of quorum-quenching enzymes. Mol. Microbiol. 47:849–60
Little AEF, Currie CR. 2008. Black yeast symbionts compromise the efficiency of antibiotic defenses in fungus-growing ants. Ecology 89:1216–22
Little AEF, Murakami T, Mueller UG, Currie CR. 2006. Defending against parasites: Fungus-growing ants combine specialized behaviours and microbial symbionts to protect their fungus gardens. Biol. Lett. 2:12–16
Lo I, Denef VJ, Verberkmoes NC, Shah MB, Goltsman D, et al. 2007. Strain-resolved community proteomics reveals recombining genomes of acidophilic bacteria. Nature 446:537–41
Lozupone C, Knight R. 2005. UniFrac: a new phylogenetic method for comparing microbial communities. Appl. Environ. Microbiol. 71:8228–35
Lozupone CA, Hamady M, Kelley ST, Knight R. 2007. Quantitative and qualitative beta diversity measures lead to different insights into factors that structure microbial communities. Appl. Environ. Microbiol. 73:1576–85
Mai-Prochnow A, Evans F, Dalisay-Saludes D, Stelzer S, Egan S, et al. 2004. Biofilm development and cell death in the marine bacterium Pseudoalteromonas tunicata. Appl. Environ. Microbiol. 70:3232–38
Majernik A, Gottschalk G, Daniel R. 2001. Screening of environmental DNA libraries for the presence of genes conferring Na(+)(Li(+))/H(+) antiporter activity on Escherichia coli: characterization of the recovered genes and the corresponding gene products. J. Bacteriol. 183:6645–53
Manefield M, Turner SL. 2002. Quorum sensing in context: out of molecular biology and into microbial ecology. Microbiol. 148:3762–64
Martin AP. 2002. Phylogenetic approaches for describing and comparing the diversity of microbial communities. Appl. Environ. Microbiol. 68:3673–82
Mazzola M, Cook RJ, Thomashow LS, Weller DM, Pierson LS 3rd. 1992. Contribution of phenazine antibiotic biosynthesis to the ecological competence of fluorescent pseudomonads in soil habitats. Appl. Environ. Microbiol. 58:2616–24
McCaig AE, Grayston SJ, Prosser JI, Glover LA. 2001. Impact of cultivation on characterisation of species composition of soil bacterial communities. FEMS Microbiol. Ecol. 35:37–48
McCann KS. 2000. The diversity-stability debate. Nature 405:228–33
McCliment EA, Voglesonger KM, O’Day PA, Dunn EE, Holloway JR, Cary SC. 2006. Colonization of nascent, deep-sea hydrothermal vents by a novel archaeal and nanoarchaeal assemblage. Environ. Microbiol. 8:114–25
McGrady-Steed J, Harris PM, Morin PJ. 1997. Biodiversity regulates ecosystem predictability. Nature 390:162–65
Miller MB, Bassler BL. 2001. Quorum sensing in bacteria. Annu. Rev. Microbiol. 55:165–99
Moss JA, Nocker A, Lepo JE, Snyder RA. 2006. Stability and change in estuarine biofilm bacterial community diversity. Appl. Environ. Microbiol. 72:5679–88
Moyer CL, Dobbs FC, Karl DM. 1994. Estimation of diversity and community structure through restriction fragment length polymorphism distribution analysis of bacterial 16S rRNA genes from a microbial mat at an active, hydrothermal vent system, Loihi Seamount, Hawaii. Appl. Environ. Microbiol. 60:871–79
Murase J, Noll M, Frenzel P. 2006. Impact of protists on the activity and structure of the bacterial community in a rice field soil. Appl. Environ. Microbiol. 72:5436–44
Nakayama J, Tanaka E, Kariyama R, Nagata K, Nishiguchi K, et al. 2007. Siamycin attenuates fsr quorum sensing mediated by a gelatinase biosynthesis-activating pheromone in Enterococcus faecalis. J. Bacteriol. 189:1358–65
Neufeld JD, Chen Y, Dumont MG, Murrell JC. 2008. Marine methylotrophs revealed by stable-isotope probing, multiple displacement amplification and metagenomics. Environ. Microbiol. 10:1526–35
Neuhauser C, Andow DA, Heimpel GE, May G, Shaw RG, Wagenius S. 2003. Community genetics: expanding the synthesis of ecology and genetics. Ecology 84:545–58
Ochman H, Lawrence JG, Groisman EA. 2000. Lateral gene transfer and the nature of bacterial innovation. Nature 405:299–304
Pace NR. 1995. Opening the door onto the natural microbial world: molecular microbial ecology. Harvey Lect. 91:59–78
Pace NR. 1997. A molecular view of microbial diversity and the biosphere. Science 276:734–40
Pace NR, Stahl DA, Lane DJ, Olsen GJ. 1985. Analyzing natural microbial populations by rRNA sequences. ASM News 51:4–12
Paine RT. 1969. A note on trophic complexity and community stability. Am. Nat. 103:91–93
Papadopoulos D, Schneider D, Meier-Eiss J, Arber W, Lenski RE, Blot M. 1999. Genomic evolution during a 10,000-generation experiment with bacteria. Proc. Natl. Acad. Sci. USA 96:3807–12
Paper W, Jahn U, Hohn MJ, Kronner M, Nather DJ, et al. 2007. Ignicoccus hospitalis sp. nov., the host of ‘Nanoarchaeum equitans.’ Int. J. Syst. Evol. Microbiol. 57:803–8
Perez MT, Sommaruga R. 2007. Interactive effects of solar radiation and dissolved organic matter on bacterial activity and community structure. Environ. Microbiol. 9:2200–10
Perna NT, Plunkett G 3rd, Burland V, Mau B, Glasner JD, et al. 2001. Genome sequence of enterohaemorrhagic Escherichia coli O157:H7. Nature 409:529–33
Pernthaler J. 2005. Predation on prokaryotes in the water column and its ecological implications. Nat. Rev. Microbiol. 3:537–46
Peterson SB. 2008. Interactions between rhizosphere bacteria. PhD thesis. Univ.Wis.-Madison
Peterson SB, Dunn AK, Klimowicz AK, Handelsman J. 2006. Peptidoglycan from Bacillus cereus mediates commensalism with rhizosphere bacteria from the Cytophaga-Flavobacterium group. Appl. Environ. Microbiol. 72:5421–27
Pierson LS, Pierson EA. 1996. Phenazine antibiotic production in Pseudomonas aureofaciens: role in rhizosphere ecology and pathogen suppression. FEMS Microbiol. Lett. 136:101–8
Pineiro SA, Sahaniuk GE, Romberg E, Williams HN. 2004. Predation pattern and phylogenetic analysis of Bdellovibrionaceae from the Great Salt Lake, Utah. Curr. Microbiol. 48:113–17
Pineiro SA, Stine OC, Chauhan A, Steyert SR, Smith R, Williams HN. 2007. Global survey of diversity among environmental saltwater Bacteriovoracaceae. Environ. Microbiol. 9:2441–50
Quaiser A, Ochsenreiter T, Klenk HP, Kletzin A, Treusch AH, et al. 2002. First insight into the genome of an uncultivated crenarchaeote from soil. Environ. Microbiol. 4:603–11
Raaijmakers JM, Vlami M, de Souza JT. 2002. Antibiotic production by bacterial biocontrol agents. Antonie van Leeuwenhoek 81:537–47
Raffa KF. 2004. Transgenic resistance in short-rotation plantation trees. In The Bioengineered Forest: Challenges for Science and Society, ed. SH Strauss, HD Bradshaw, pp. 208–27. Washington, DC: RFF Press
Rakoff-Nahoum S, Paglino J, Eslami-Varzaneh F, Edberg S, Medzhitov R. 2004. Recognition of commensal microflora by Toll-like receptors is required for intestinal homeostasis. Cell 118:229–41
Rao D, Webb JS, Kjelleberg S. 2005. Competitive interactions in mixed-species biofilms containing the marine bacterium Pseudoalteromonas tunicata. Appl. Environ. Microbiol. 71:1729–36
Rastall RA, Gibson GR, Gill HS, Guarner F, Klaenhammer TR, et al. 2005. Modulation of the microbial ecology of the human colon by probiotics, prebiotics and synbiotics to enhance human health: an overview of enabling science and potential applications. FEMS Microbiol. Ecol. 52:145–52
Reichenbach H. 1999. The ecology of the myxobacteria. Environ. Microbiol. 1:15–21
Rhee SK, Liu XD, Wu LY, Chong SC, Wan XF, Zhou JZ. 2004. Detection of genes involved in biodegradation and biotransformation in microbial communities by using 50-mer oligonucleotide microarrays. Appl. Environ. Microbiol. 70:4303–17
Riley MS, Cooper VS, Lenski RE, Forney LJ, Marsh TL. 2001. Rapid phenotypic change and diversification of a soil bacterium during 1000 generations of experimental evolution. Microbiology 147:995–1006
Ripple WJ, Beschtab RL. 2003. Wolf reintroduction, predation risk, and cottonwood recovery in Yellowstone National Park. For. Ecol. Man. 184:299–313
Robleto EA, Borneman J, Triplett EW. 1998. Effects of bacterial antibiotic production on rhizosphere microbial communities from a culture-independent perspective. Appl. Environ. Microbiol. 64:5020–22
Robleto EA, Scupham AJ, Triplett EW. 1997. Trifolitoxin production in Rhizobium etli strain CE3 increases competitiveness for rhizosphere. Mol. Plant-Microbe Interact. 10:228–33
Rogosky AM, Moak PL, Emmert EA. 2006. Differential predation by Bdellovibrio bacteriovorus 109J. Curr. Microbiol. 52:81–85
Rondon MR, August PR, Bettermann AD, Brady SF, Grossman TH, et al. 2000. Cloning the soil metagenome: a strategy for accessing the genetic and functional diversity of uncultured microorganisms. Appl. Environ. Microbiol. 66:2541–47
Rusch DB, Halpern AL, Sutton G, Heidelberg KB, Williamson S, et al. 2007. The Sorcerer II global ocean sampling expedition: northwest Atlantic through eastern tropical Pacific. PLoS Biol. 5:e77
Saison C, Degrange V, Oliver R, Millard P, Commeaux C, et al. 2006. Alteration and resilience of the soil microbial community following compost amendment: effects of compost level and compost-borne microbial community. Environ. Microbiol. 8:247–57
Schink B. 2002. Synergistic interactions in the microbial world. Antonie van Leeuwenhoek 81:257–61
Schloss PD. 2008. Evaluating different approaches that test whether microbial communities have the same structure. ISME J. 2:265–75
Schloss PD, Handelsman J. 2005. Introducing DOTUR, a computer program for defining operational taxonomic units and estimating species richness. Appl. Environ. Microbiol. 71:1501–6
Schloss PD, Handelsman J. 2006a. Introducing SONS, a tool for operational taxonomic unit-based comparisons of microbial community memberships and structures. Appl. Environ. Microbiol. 72:6773–79
Schloss PD, Handelsman J. 2006b. Introducing TreeClimber, a test to compare microbial community structures. Appl. Environ. Microbiol. 72:2379–84
Schloss PD, Handelsman J. 2007. The last word: books as a statistical metaphor for microbial communities. Annu. Rev. Microbiol. 61:23–34
Schloss PD, Larget BR, Handelsman J. 2004. Integration of microbial ecology and statistics: a test to compare gene libraries. Appl. Environ. Microbiol. 70:5485–92
Schoeninger MJ, Deniro MJ, Tauber H. 1983. Stable nitrogen isotope ratios of bone collagen reflect marine and terrestrial components of prehistoric human diet. Science 220:1381–83
Shertzer KW, Ellner SP, Fussmann GF, Hairston NG. 2002. Predator-prey cycles in an aquatic microcosm: testing hypotheses of mechanism. J. Anim. Ecol. 71:802–15
Shrestha M, AbrahamW-R, Shrestha PM, Noll M, Conrad R. 2008. Activity and composition of methanotrophic bacterial communities in planted rice soil studied by flux measurements, analyses of pmoA gene and stable isotope probing of phospholipid fatty acids. Environ. Microbiol. 10:400–12
Sih A, Crowley P, McPeek M, Petranka J, Strohmeier K. 1985. Predation, competition, and prey communities—a review of field experiments. Annu. Rev. Ecol. Syst. 16:269–311
Silo-Suh LA, Lethbridge BJ, Raffel SJ, He H, Clardy J, Handelsman J. 1994. Biological activities of two fungistatic antibiotics produced by Bacillus cereus UW85. Appl. Environ. Microbiol. 60:2023–30
Smith JM, Castro H, Ogram A. 2007. Structure and function of methanogens along a short-term restoration chronosequence in the Florida Everglades. Appl. Environ. Microbiol. 73:4135–41
Stanton ML. 2003. Interacting guilds: moving beyond the pairwise perspective on mutualisms. Am. Nat. 162:S10–23
Stein JL, Marsh TL, Wu KY, Shizuya H, DeLong EF. 1996. Characterization of uncultivated prokaryotes: isolation and analysis of a 40-kilobase-pair genome fragment from a planktonic marine archaeon. J. Bacteriol. 178:591–99
Stelling J, Sauer U, Szallasi Z, Doyle FJ III, Doyle J. 2004. Robustness of cellular functions. Cell 118:675–85
Streit WR, Daniel R, Jaeger K-E. 2004. Prospecting for biocatalysts and drugs in the genomes of noncultured microorganisms. Curr. Opin. Biotechnol. 15:285–90
Strovas TJ, Sauter LM, Guo X, Lidstrom ME. 2007. Cell-to-cell heterogeneity in growth rate and gene expression in Methylobacterium extorquens AM1. J. Bacteriol. 189:7127–33
Thao ML, Gullan PJ, Baumann P. 2002. Secondary (gamma-Proteobacteria) endosymbionts infect the primary (beta-Proteobacteria) endosymbionts of mealybugs multiple times and coevolve with their hosts. Appl. Environ. Microbiol. 68:3190–97
Thingstad TF. 2000. Elements of a theory for the mechanisms controlling abundance, diversity, and biogeochemical role of lytic bacterial viruses in aquatic systems. Limnol. Oceanogr. 45:1320–28
Thomashow LS, Weller DM. 1988. Role of a phenazine antibiotic from Pseudomonas fluorescens in biological control of Gaeumannomyces graminis var. tritici. J. Bacteriol. 170:3499–508
Thompson JN. 1994. The Coevolutionary Process. Chicago: Univ. Chicago Press. 376 pp.
Thompson JN. 2005. Coevolution: the geographic mosaic of coevolutionary arms races. Curr. Biol. 15:R992–94
Tilman D, Wedin D, Knops J. 1996. Productivity and sustainability influenced by biodiversity in grassland ecosystems. Nature 379:718–20
Tringe SG, von Mering C, Kobayashi A, Salamov AA, Chen K, et al. 2005. Comparative metagenomics of microbial communities. Science 308:554–57
Tyson GW, Chapman J, Hugenholtz P, Allen EE, Ram RJ, et al. 2004. Community structure and metabolism through reconstruction of microbial genomes from the environment. Nature 428:37–43
Uroz S, Chhabra SR, Camara M, Williams P, Oger P, Dessaux Y. 2005. N-acylhomoserine lactone quorum-sensing molecules are modified and degraded by Rhodococcus erythropolis W2 by both amidolytic and novel oxidoreductase activities. Microbiology 151:3313–22
Uroz S, D’Angelo-Picard C, Carlier A, Elasri M, Sicot C, et al. 2003. Novel bacteria degrading Nacylhomoserine lactones and their use as quenchers of quorum-sensing-regulated functions of plantpathogenic bacteria. Microbiology 149:1981–99
Uroz S, Oger P, Chhabra SR, Camara M, Williams P, Dessaux Y. 2007. N-acylhomoserine lactones are degraded via an amidolytic activity in Comamonas sp. strain D1. Arch. Microbiol. 187:249–56
Vasanthakumar A, Delalibera I, Handelsman J, Klepzig KD, Schloss PD, Raffa KF. 2006. Characterization of gut-associated bacteria in larvae and adults of the southern pine beetle, Dendroctonus frontalis Zimmermann. Environ. Entomol. 35:1710–17
Venter JC, Remington K, Heidelberg JF, Halpern AL, Rusch D, et al. 2004. Environmental genome shotgun sequencing of the Sargasso Sea. Science 304:66–74
von Dohlen CD, Kohler S, Alsop ST, McManus WR. 2001. Mealybug [beta]-proteobacterial endosymbionts contain [gamma]-proteobacterial symbionts. Nature 412:433–36
Wang Y-J, Leadbetter JR. 2005. Rapid acyl-homoserine lactone quorum signal biodegradation in diverse soils. Appl. Environ. Microbiol. 71:1291–99
Waters E, Hohn MJ, Ahel I, Graham DE, Adams MD, et al. 2003. The genome of Nanoarchaeum equitans: insights into early archaeal evolution and derived parasitism. Proc. Natl. Acad. Sci. USA 100:12984–88
Whitham TG, Young WP, Martinsen GD, Gehring CA, Schweitzer JA, et al. 2003. Community and ecosystem genetics: a consequence of the extended phenotype. Ecology 84:559–73
Williamson KE, Radosevich M, Wommack KE. 2005. Abundance and diversity of viruses in six Delaware soils. Appl. Environ. Microbiol. 71:3119–25
Winogradsky S. 1895. Researches sur l’assimilation de l’azote libre de l’atmosphere par les microbes. Arch. Sci. Biol. 3:297–352
Wu D, Daugherty SC, Van Aken SE, Pai GH, Watkins KL, et al. 2006. Metabolic complementarity and genomics of the dual bacterial symbiosis of sharpshooters. PLoS Biol. 4:e188
Yang F, Wang L-H, Wang J, Dong Y-H, Hu JY, Zhang L-H. 2005. Quorum quenching enzyme activity is widely conserved in the sera of mammalian species. FEBS Lett. 579:3713–17
Yannarell AC, Steppe TF, Paerl HW. 2007. Disturbance and recovery of microbial community structure and function following Hurricane Frances. Environ. Microbiol. 9:576–83
Yim G, Wang HH, Davies J. 2007. Antibiotics as signalling molecules. Philos. Trans. R. Soc. London Ser. B 362:1195–200
Zhang R, Weinbauer MG, Qian P-Y. 2007. Viruses and flagellates sustain apparent richness and reduce biomass accumulation of bacterioplankton in coastal marine waters. Environ. Microbiol. 9:3008–18
Zul D, Denzel S, Kotz A, Overmann J. 2007. Effects of plant biomass, plant diversity, and water content on bacterial communities in soil lysimeters: implications for the determinants of bacterial diversity. Appl. Environ. Microbiol. 73:6916–29
STATISTICAL DATA ANALYSIS CHALLENGES FROM THE MICROBIOME
Susan Holmes35,36and Paul J. McMurdie35
Where Are We Today?
As an introduction, we describe some of the challenges that microbiologists face today in their data analyses. We then make constructive recommendations involving currently available methods and implementations.
Complexity
In the 1980s the problems in statistical analyses of biological data centered around the difficulty of having insufficient data from which to draw scientific conclusions effectively. A dripping tap comes to mind. Most measurements were still being collected by hand. We then started using techniques such as the bootstrap to provide confidence statements about small samples (to about the low hundreds) measured on a small number of variables (around 10 to 20 was quite standard).
In the late 1990s many machines became available for generating biologically relevant data, not only sequences, but also microarrays, providing expression measurements on 20,000 or 30,000 genes for 100 samples, which started pouring into our data centers. It was the fire hydrant era. Today, petabytes of input give us a data tsunami in terms of pure bulk. However, we also have to cater to all
___________
35 Stanford University.
the different flavors of modern data: images, texts, streaming video, sequences, high-throughput reads, and mass spectrometry features, all coming into the same labs and measured on the same individuals or in the same locations, as well as originating from different labs across the world. Today’s data show levels of heterogeneity and complexity we have not encountered to date (Figure A10-1).
All Homogeneous Data Are the Same, But Heterogeneous Data Are All Heterogeneous in Their Own Way
Here is a sample of the many levels of heterogeneity encountered in today’s microbial ecology and community data.
Date types There are images, sequences, matrices, continuous variables, networks, graphs, maps, rankings, trees, or simple binary outcomes such as healthy/diseased.
Status Heterogeneity also occurs in terms of status of the variables; some are responses we want to predict (perturbed/normal or survival times), and other variables can serve as useful explanatory variables (such as blood pressure in patients or pH in soil samples).
Explicit or latent factors Some variables are measured and present in the data; others are latent and have to be estimated. For instance, one may actually be measuring a mixture of three separate populations without knowing it, or a hidden gradient may be present in the data. One of the goals of a good exploratory analysis can be to detect the presence of these hidden or latent factors.
Dependence We have differing levels of dependence between observations; spatial or temporal data can be very dependent, as are data collected on a network or along

FIGURE A10-1 1985: A dripping tap. 1998: A fire hydrant. 2012: A perfect storm.
the branches of a river. Spatial location can be important in understanding underlying gradients. Time series allow us to follow the dynamics of biological processes.
Complexity We also want to produce summary outputs that are not just simple numerical summaries; we would like to provide interaction graphs, decision trees, and confidence regions.
Losing Touch
Contemporary biologists feel drowned in their data, often even abandoning the idea of visualizing it at all. There is a feeling that because the data come directly through a pipeline into the computers from the proprietary software developed by the measurement machine manufacturers,37 there is no need for humans to be involved. This is sometimes argued as being more efficient or objective. However, the best neural network available is still the human brain, and many breakthroughs are due to insights gleaned by biologists painstakingly recording and perusing their numbers.
Data still need to be monitored on a regular basis in the same way film directors watch their “dailies.” Data should be visualized early and often. First, we can detect flaws in the experimental design or systematic biases that were not predicted. Overall patterns and a complex picture of the data will appear as the data are tamed in an interactive way. Batch analyses at the end of a long collection process, for instance a few months or weeks before a thesis is due, are always a mistake and result in suboptimal use of resources.
Several transformations are made to the raw data before the user is even involved in the process; this can introduce undocumented biases. A majority of statisticians would recommend obtaining and archiving the raw data and using an open script to make the relevant transformations, thus documenting intermediary steps that may lead to problems later in the analyses. This means that the complete pipeline from the raw data to the final figures will be reproducible. This entails using one of the systems for performing reproducible research (Gentleman and Temple Lang, 2007).
Too Many Choices
At each stage of the analysis of a complex data set, choices have to be made. Extreme value detection and thresholding are done at the start to identify outlier or saturation effects. Variables often differ in scale, even within the same measurement protocol. For instance, gene expression transformations have proved essential in microarray analyses (Allison et al., 2006). Variance stabilizing normalization (vsn) is use to combat heteroscedasticity and LOESS and LOWESS
___________
37 Sequencers, laser readers, mass spectrometers, flow cytometers, and microscopes.
(locally weighted scatterplot smoothing [Cleveland, 1981]) are used to smooth out biases. Such transformations in the case of operational taxonomic unit (OTU) reads can include the replacement of the original data by robustified values, such as ranks or median polish replacements (Holmes et al., 2011).
Filtering out species that are very rare is crucial because these species may appear with inflated influence under some re-weighting schemes and it can be beneficial to delineate true presence from simple noise effects; thus, a relevant presence threshold has to be chosen. Sometimes data are divided into core and variable groups using a threshold for the standard deviations. After transformations and groupings, projection methods such as principal coordinate analysis (PCoA) or multidimensional scaling are popular. Again, an important choice has to be made: which is the appropriate distance to use? There are dozens of available choices. The Bray-Curtis is an distance that is a favorite among some ecologists. A recent study used Jensen-Shannon distances, resulting enterotypes in polarizing the data into clusters (Arumugam et al., 2011). Chi-square distance is a weighted Euclidean distance often preferred by statisticians, whereas others have proposed the Hellinger distance. In the case of simple presence/absence coding of the OTUs, it is better to use a distance based on the Jaccard index because it prioritizes co-occurrence of species as opposed to distances based on a correlation coefficient that put presence and absence on a similar standing. UniFrac distances, both weighted (Lozupone and Knight, 2005) and unweighted (Lozupone et al., 2007), have become popular because they integrate the known phylogenetic tree information into the distance computations. Double Principal Coordinate Analysis (DPCoA) (Eckburg et al., 2005) has the advantage of both integrating the patristic distances using the tree and providing biplot representations of species and samples.
However, each study has its own particularities owing to the specific data at hand. Users need to explore various choices; as we can see from the partial list above, a combinatorial explosion of potential analyses can occur. This is one of the motivations of keeping a complete reproducible record of the scripts involved in the analyses. This facilitates a quick revision of thresholds or distances, and resubmission of the script allows a complete reanalysis of the data in minutes. One can see from recent publications that current studies in microbiology (Human Microbiome Consortium et al., 2012a,b) are very far from being reproducible and are composed of a jigsaw of different steps performed by different players, each choosing their tuning parameters separately. Fortunately, statistical software technology has evolved at a similar pace as the measurement prowess and we have machines powerful enough to summarize and visualize masses of heterogeneous data. In statistics these software advances have come from an interesting self-organizing ecology of open-source projects that bridge many communities of data scientists.
We show in the next few sections how new robust statistical techniques are available as open-source software to address problems such as combining phylogenetic trees and abundance tables or networks. We also show how to combine
different data tables, whether they were collected across locations or time. We can now represent evolving microbial communities or detect high-dimensional batch effects. As suggested above, the complexity of the data that now combine sequences, measurements, and phylogenetic trees requires a new approach to data management; we can no longer restrict ourselves to simple matricial formats and analyses.
Presentation of R
Specificity of R as a Community-Based Project
The ecology of statistical research has been changed by the interaction of several collaborative communities of data scientists. The R platform was developed by R. Gentleman and R. Ihaka (Ihaka and Gentleman, 1996) as an open-source program based on J. M. Chambers’s S language (Chambers, 1999, 2008). The project has developed organically to incorporate tools from different scientific communities incorporating several desirable features, of which we present only a few here. Each particular set of methods developed by an individual or small team is combined into a documented package containing examples, data, and functions, thus providing a high level of modularity and robustness. Stable versions are provided biannually and standard versioning control enables good reproducibility of studies done with R, even many years after publication of the methods. The object-oriented philosophy of the language allows for the easy management of complex data structures (such as those specifically defined for microbial studies shown in Figure A10-4).
High-Quality Visualization Tools
Exploratory data analyses of complex data sets presuppose the availability of large numbers of graphical representations of the data.
The package ggplot2 (Wickham, 2009) allows the aesthetic construction of layered plots with multiple levels of information following the principles laid out in Wilkinson’s Grammar of Graphics (Wilkinson and Willis, 2005).38 Features such as a transparency allow the user to evaluate data distributions. Heat maps such as that in Figure A10-2 are useful alternatives to tables of numbers and can be complemented with tree information easily.
Plotting trees together with supplementary information is possible in several different R packages; here we present some examples.
We created the tree graphic represented in Figure A10-3 using phyloseq, whose graphics are based on ggplot2. Enrichment of the tree was provided by
___________
38 For a friendly introduction, we recommend Hadley Wickham’s YouTube video (found at http://youtu.be/TaxJwC_MP9Q).
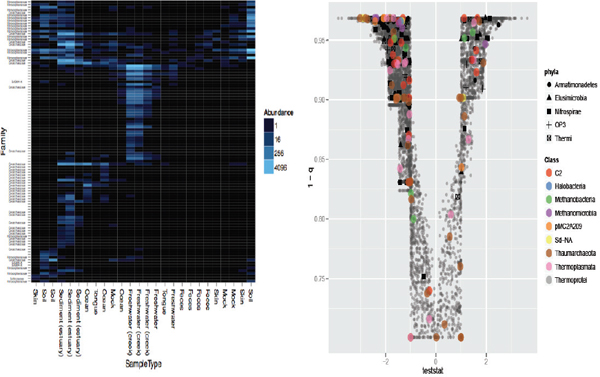
FIGURE A10-2 (A) Heat map of abundance reads. (B) Volcano plot for expressions with transparency.
SOURCE: Adapted from Caporaso et al. (2011).
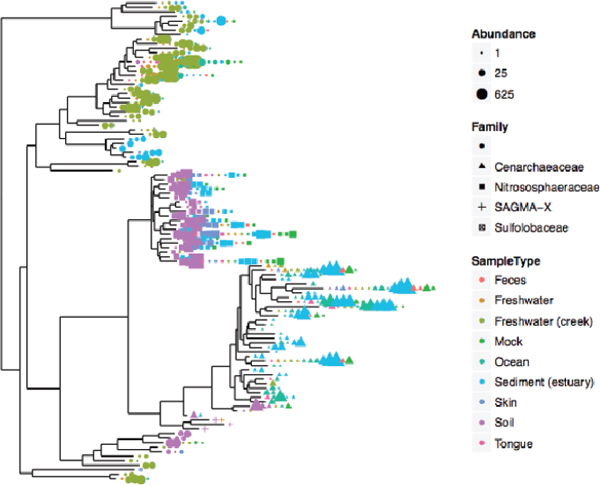
FIGURE A10-3 Global patterns global data mapped onto the OTU reference tree.
SOURCE: Adapted from Caporaso et al. (2011).
using coloring for the sample-type variable, and also labeling using a shape for the different Families. The symbols are enlarged as the number of individuals increases.
Figure A10-4 is drawn from the paper by Purdom (2010) and shows generalized principal component scores together with the phylogenetic tree information for material phylotypes drawn from Sanger sequences (Eckburg et al., 2005).
Computational Features
As well as providing flexible high-quality graphics, R provides a computational platform that solves many of the challenges we listed in the introduction.
Reproducible research Today there is a movement to ensure statistical analyses follow the same standards of reproducibility as the laboratory sciences. Biologists publish the primers they used to enable other teams to reproduce their results, and statisticians are building platforms to publish all the code used to analyze and visualize the data, so that another researcher could take the same raw data through all the preprocessing steps and produce the same final figures and tables as the original analysts. This is useful for sharing work both within and between laboratories. From within the R environment, there are several
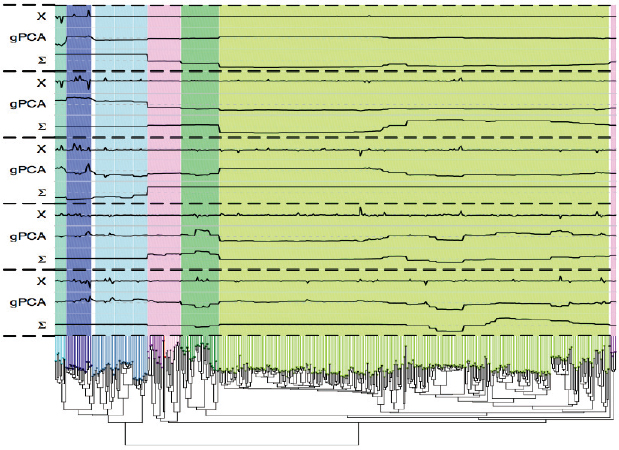
FIGURE A10-4 Plotting the values of gPCA variables with a tree using R.
SOURCE: Purdom (2010).
ways to track and reproduce analyses. The standard built-in program history keeps an analytic diary of commands. More sophisticated are the Sweave and knitr functions, which allow the analyst to reproduce a whole technical report of the statistical analyses with the graphics and tables without having to handle individual files. A new platform, Rpubs,39 now enables easy web diffusion of all data analytic scripts. Such approaches are essential as we move forward to extremely large data sets so complex that multiple teams have to collaborate together to reach results in a timely manner. Data are often accumulated using different protocols, normalization procedures, outlier filtering functions, or threshold choices. Currently there are more than 40 distances to choose between when summarizing similarities between samples or OTUs. A perfect example of such a patchwork appears in the results of the Human Microbiome Project’s recent publications (Human Microbiome Consortium et al., 2012a,b) where the multiplication of platforms and protocols shows many levels of heterogeneity. The problem with these sequential pipelines is that if the first preprocessing team chooses a noise model and threshold that look optimal in its dimensions of interest and a next team then chooses optimal thresholds for its purpose, then the overall choice may not be a global optimum, in the same way that when trying to find two tuning parameters as an optimum on a two-dimensional surface it is not necessarily sufficient to optimize in one dimension and then in the second dimension. At least one should be able to iterate in such a procedure, preferably using both dimensions at the same time.
High-power computing As the data have become increasingly memory intensive, new parallelization tools for computer-intensive steps are necessary. For instance, foreach is used in the implementation of the Fast UniFrac distance in phyloseq in a way that is transparent from the user’s point of view.
Both standard and cutting-edge solutions All standard statistical methods are available in R, and most recent statistical or machine learning methods are published using R. For instance, packages such as RandomForests allow users to try out ensemble supervised learning methods based on learning trees, and the package caret helps with interpretation of the output. There are a large number of robust and sparse methods that make interpretation much easier than standard projection methods as they decrease the number of variables incorporated in the final models, resulting in parsimonious models. The availability and documentation of the packages make it possible to compare 20 methods on a new type of data in less than a week.
Data input and cleaning R has a high-quality subset of packages known as Bioconductor tailored to the multiple formats of modern bioinformatics (Sequences,
___________
39 See http://rpubs.com.
Short Reads, RNA-seq, QIIME, HTS, MG-RAST, microarrays, mass spectrometry data, whole genomes, methylation, flow cytometry, microRNAi). A large number of alternative methods for denoising, normalizing, and standardization are available.
Simulation Many different random number generators are available for nonuniform distributions, bootstrapping, and Gibbs sample generation of posterior distributions. These simulations prove to be essential when validating models and doing nonparametric tests.
To illustrate these features, we explore a standard pipeline and mention some of the more useful tools. Teams working in biotechnology have realized that using R can circumvent long waits to access the data due to machine-specific output formats handled easily by Bioconductor. Researchers are encouraged to provide an example data set as soon as one is available so that the appropriate format readers can be found.
The package phyloseq directly takes the output from clustering and annotating programs such as qiime, mothur, RDP, PANGEA, or MG-RAST and combines it with the reference phylogenetic tree and OTU read abundances. The information about the samples is then combined into an object of special heterogeneous class (Figure A10-5).
Usually the first step will be to normalize or transform the data using robust methods such as winterization, rank transformation, and elimination of very sparse
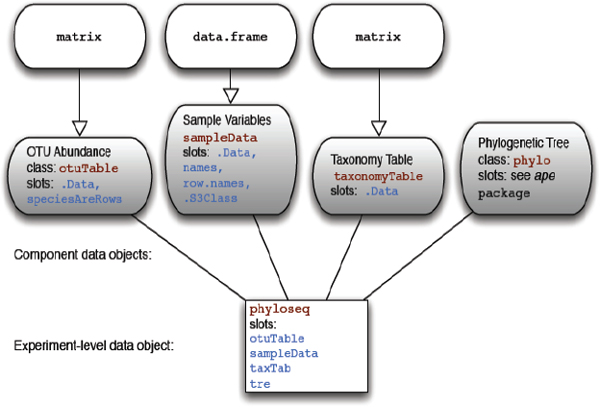
data through filtering. An effective data checking mechanism is to do a simple principal component analysis (PCA) and project batch information as a supplementary variable, as can be seen in Figure A10-6. These are data from an experiment to detect differences between irritable bowel syndrome (IBS) and normal rat microbiota using the phylochip technology.40 Some exploratory verifications of homoscedasticity can reveal problems with the data. In this study, the first two components of a PCA done on the first two batches of data suggested a problem.
Each color corresponds to a different batch of arrays. The ellipses are computed using the means, variances, and covariance of each group of points on both axes and are drawn with the center of the ellipse defined by the mean point. Its width and height are given by the within-group variance-covariance matrix, where the covariance sets the slope of the main axis of the ellipse. The first two batches (in black and red), although balanced with regard to IBS and healthy rats, show very different levels of variability and overall multivariate location. Batches were done on different days with different sets of arrays. This intermediary study of the data prompted us to make a third batch generated with the same arrays as batch 2 but the same experimental protocol as batch 1. The third group faithfully overlaps with batch 1, thus showing that the batch effect was due not to a difference in arrays but to the experimental protocol. This shows the utility of PCA in quality control.
After outlier detection has been performed, the data need to be normalized to make the columns comparable. Whereas in standard multivariate methods such as
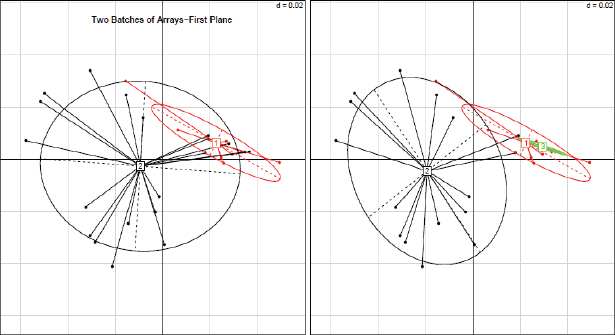
___________
40 See Holmes et al. (2011) and Wilson et al. (2002) for detailed analyses.
PCA, on diverse measurements the columns are all normalized to have the same variance. We recognize that there are often strong disparities in the quality of the various samples. It is common to see 10-fold, or even 100-fold, differences in total numbers of reads across samples.
On the Problems of Standardization and Rarefaction
Species occur in varying numbers in a community. Probabilists call this the multinomial distribution, and the question as to how many individuals one needs to obtain a full set of exemplars (i.e., one instance of every species) is known as the “coupon collectors” problem (Feller, 1957). It is well known that when some of the species are rare, the number of samples needs to be very large to detect all of them. So the exhaustive question is then relaxed somewhat to answer, for instance: “How many samples do we need to collect to obtain 75 percent of the species with probability 0.90?” Although there are formulas for computing the probability distribution of the number of species given the underlying multinomial, usual practice involves simulating the number of species as a function of the number of samples by subsampling without replacement from the data and drawing the rarefaction curve. In fact, the expected number of species in a sample of size is the mean of the probability distribution:
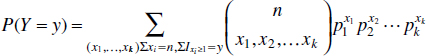
where the ρ′s are the probabilities of the multinomial classes (species relative frequencies).
However justified in the context of drawing rarefaction curves, subsampling for the purpose of “normalizing” sample size is never practiced in statistics, where unjustified elimination of some of the data is considered a sin. The standard practice when comparing counts is to use the chi-square distance, and for testing one can use the parametric chi-square test if the cell counts are mostly larger than 5, or, in the case of smaller counts as for large tables of OTUs, most of which are absent, one can use a nonparametric test using a Monte Carlo approximation (Diaconis and Sturmfels, 1998). It is to be recalled here that the practice of dividing each of the cell counts by the total of each sample, thus making each column sum to 1, will also result in data omission because the total number of reads in the column provides a measure of accuracy that is then lost in later computations. Thus, when using ratios, it is important to retain the denominator information in an extra row in the table. Depending on the context, other transformations, such as replacing the values by their ranks or taking logs, can be more appropriate. For further discussion and comparisons of normalization methods, see McMurdie and Holmes (2012).
Projection Methods
The standard technique after preparation of the normalized multivariate table of OTU abundances in each of the samples is to project the data in the two spaces, one defined by the linear combination of the samples and the other in the linear combination of the OTUs. This involves the eigenanalysis of a specific inner product matrix. Sometimes this can be done just by looking at distances between samples as in PCoA, for instance, on UniFrac distances (Costello et al., 2009).
On the other hand, if one does either a PCA or a simple correspondence analysis, corresponding to a generalized PCA (Holmes, 2006), choices have to be made and justified. One chooses whether and how to normalize the data and how many components to retain. The cutoff for the number of eigenvalues to retain separates the dimensions explained by true signal in the data as opposed to those due to random noise. These methods are all based on the search for new coordinate axes such that the projection of the weighted points onto those axes produces the largest possible inertia in the sense of physics (i.e., the largest weighted sum of squares Σpid i2). In ordinary PCA this is simply the variance that we maximize along the principal directions, which are chosen orthogonal. In correspondence analysis the inertia is proportional to the amount of the chi-square distance from independence explained by each axis (Figure A10-7).
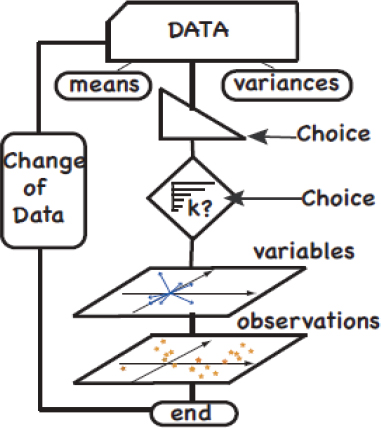
FIGURE A10-7 A PCA flowchart, with choice levels highlighted.
Recycling Methods Between Fields
One of the big advantages of using the R platform is the broad array of methods available from the R and Bioconductor libraries, which avoids having to reinvent the wheel for every new type of data that becomes available.
Hypergeometric test We take a concrete example of methodology transfer. There is a consensus among statisticians and data scientists involved in the analysis of microarrays that differential expression tests should be followed by gene set analysis (Allison et al., 2006) done using data such as the Gene Ontology or Gene Expression Network Analysis (Nacu et al., 2007). These analyses provide ways to make biological sense out of the laundry lists of differentially expressed genes that are provided by the multiple tests done between sample groups.
We can capitalize on this insight in the case of microbial studies. Instead of Gene Ontology, we have the taxonomic organization of the OTUs present in the study. After performing multiple tests we obtain a list of OTUs that come up as differentially represented in the two different samples as shown in Table A10-1.
We can thus proceed to use a hypergeometric test to evaluate whether some phyla or families are overrepresented among the “significantly different” list of OTUs. A complete example of such a procedure is provided in a study of IBS and normal rats (Holmes et al., 2011), where we showed using this hypergeometric testing method that (1) taxa with a higher presence in the IBS group had significantly more Bacteriodetes; (2) there was an overrepresentation of Firmicutes in the healthy controls; (3) at the family level, the results showed that the families Oxalobacteraceae, Prevotellaceae, Burkholderiaceae, and Sphingobacteriaceae were significantly overrepresented in IBS; and, (4) conversely, the most significantly enriched family in control rats were Lachnospiraceae, including Ruminococcus sp., followed by Erysipelotrichaeceae and Clostridiaceae.
Once a list of significant families is available though this type of testing, it is useful to illustrate the ways the relevant components of a community assemble. Networks are a wonderful conceptual and visualization tool of which we show a few illustrations. Many other examples of transfer of statistical methods are now available, including uses of clustering, normalization, and supervised learning techniques. Another example of particular interest to researchers aiming for interpretable results is the use of networks to represent and model communities of co-occurring species or to show clumping of samples.
TABLE A10-1 Differentially Represented OTUs
| Set | Over-represented | Universe |
| Microbiome | Families/Phyla | Species Present |
| Gene Expression | Ontological Groups | Filtered Genes |
Ease in Network Manipulation and Plotting
We define an ecological community as a set of OTUs that occur often in common across our available samples. The data set in this example came from Arumugam et al. (2011) and contains samples measured with three different technologies on a number of human microbiomes for participants scattered across the world. We can identify samples with common microbial components as in Figure A10-8. Here each sample is a node and an edge appears between two samples if they have more than 70 percent shared OTUs. This is what we call a co-occurrence graph network. Other scientists have preferred to make such networks using the correlation between the vectors of presence/absence of the OTUs (Arumugam et al., 2011); however, that choice is often suboptimal for large numbers of OTUs because co-occurrence is a strong indicator of similarity in communities whereas co-absence is not. Thus, in this context the Jaccard index is preferable to a correlation coefficient. As an example of the ease with which R can handle creating and plotting such a graph, we have appended the code that was used to create Figure A10-8. We used the enterotype data to show the results of the makenetwork() function of the igraph package to create a graphical display of the“connectedness” of samples according to the profile of taxa that they share.
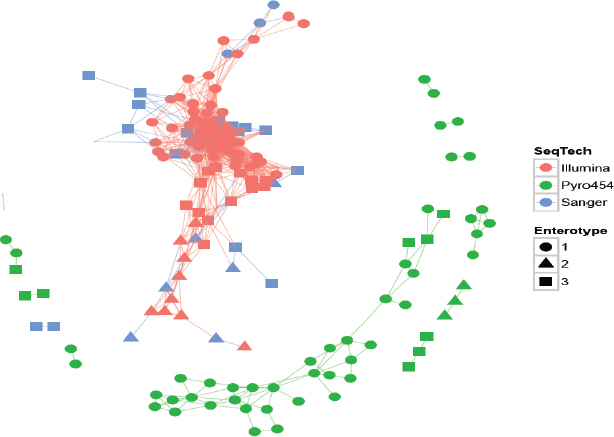
ig<-make_network(enterotype, max.dist=0.3)
plot_network(ig, enterotype, color=“SeqTech”,
shape=“Enterotype”)
Figures A10-8 and A10-9 show features both of the sample network, putting edges connecting samples that have similar OTU compositions, and of the dual network, showing the OTUs that seem to occur together. Often it is useful to represent data with a graph of relationships between metabolites or genes that we would like to use along with our simple numerical measurements.
All the Data
A systems approach leads to structured high-dimensional data We need a system that provides good data integration. We start by understanding what happens when we have multiple variables on the same samples. We call this the multivariate context. It has become standard to use multivariate analyses of many variables to ensure that the associations between the variables are accounted for. In some sense this is the statistician’s version of a “systems-based” approach. The simplest measurement of such associations between the variables taken two by two is called the covariance of the two variables. If we standardize this, we obtain the correlation. Multivariate analyses consider simultaneously all the variables measured in a set of samples. Multitable analyses involve the generalization of this idea to the simultaneous analyses of many tables of data that share either row dimensions or column dimensions. Again, it allows the data scientist to pursue a systems-based approach rather than slicing the data into simple arrays of homogeneous variables; we use all the data together. Let us illustrate these principles with a real example. In an ongoing study with David Relman, Les Dethfelsen, Angela Marcobal, and Justin Sonnenburg, we have accumulated measurements made on 4 patients and a total of 40 samples taken over time.
A first set of OTU abundance columns was collected using 454 technology passed through the qiime pipeline (Dethlefsen and Relman, 2011). Using the mass spectroscopy metabolic feature for the positive- and negative-ion states (Marcobal et al., 2012) has provided us two sets of metabolite tables for the same samples. Finally, we also have short-read data, giving us DNA measurements for 20,000 genes, which were then grouped into KEGG categories.
Thus, we have three different tables of variables measured on one set of samples. The tables share their row dimensions and differ in their column dimensions. In that context, we can compute the co-inertia of the tables (i.e., the amount of variability associated between the tables). This is done by computing the RV
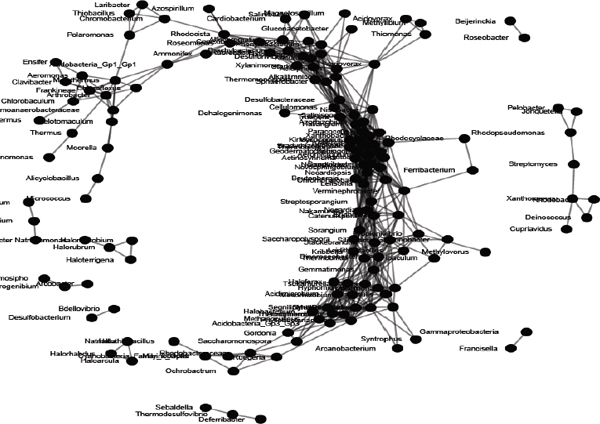
ig<-make_network(enterotype, type=“species” ,max.dist=0.3)
plot_network(ig, enterotype)
coefficient between tables A and B, given in the case of two tables with the same row dimensions by the following formula (Robert and Escoufier, 1976):
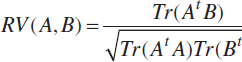
where Tr denotes the sum of the diagonal elements.
Taxa Read counts (4 patients taking cipro: two time courses) : .
Mass-Spec Positive and Negative ion Mass Spec features and their intensities:.
RNA-seq Metagenomic data on genes:.
Here is the resulting RV table of the four array types:
| fourtable$RV | ||||
| Taxa | Kegg | MassSpec+ | MassSpec– | |
| Taxa | 1 | 0.565 | 0.561 | 0.670 |
| Kegg | 0.565 | 1 | 0.686 | 0.644 |
| MassSpec+ | 0.561 | 0.686 | 1 | 0.568 |
| MassSpec– | 0.670 | 0.644 | 0.568 | 1 |
We can ask the same questions about the significance of these “table correlations” as one does with two variable correlations. It can be tested using simple permutation tests where the sample rows are dissociated between tables to create a null distribution to which we compare the values observed. Such a test is implemented in the ade4 package in R. Here, we have a perfect example of the modern approach to testing which forgoes distributional assumptions in favor of computer-intensive randomization procedures. To test the correlation between two variables, we could compute the original value r0 on the observed data and then proceed to shuffle the order of one of the vectors, recomputing the correlations between these new shuffled vectors. This would provide us with a complete null distribution of the correlation statistic. Just such an approach is also valid for table correlations. We can think of this as just making each of the tables (each with n rows and p columns) into a vector by taking the first column and adding the second column underneath it until we obtain a vector of length np. We then compute the correlation of the two vectorized tables, call this RV0, and start a
shuffling iteration that we repeat 1,000 times. For each shuffle, we compute the correlation between the shuffled vectors. These 1,000 values provide us with a null distribution showing what the sampling distribution would look like if the tables were unrelated. Comparing our original RV0 value to these new shuffled values provides the p value. All this is implemented in several R packages; below we show the output from ade4. This is a procedure similar to the well-known test invented by H. Daniels, commonly known as the Mantel test.
For instance, comparing the taxa table and negative mass spectrometry features between the samples and using the permutation test of RV correlation with 999 Monte Carlo simulations gives a significant p value.
rv12 = RV.rtestpcat$tab, pcamsn$tab, nrepet = 999)
rv12$pvalue
[1] 0.001
Symmetric Two-Table Analysis
When simply trying to visually compare two tables of the same sites we can study the transformation necessary to make one table similar to another; this is often called a Procrustes rotation. In matrix notation, it means we need to find the rotation of the Xn×p points that makes it the most similar to the configuration of the Yn×q points. This occurs when we maximize
RV(Y, XA).
This is often called the Procrustes rotation, and it is found by finding the singular value decomposition of X′Y = U∧V and the A = UV′. For a detailed review of Procustean co-inertia analysis see Dray et al. (2003) (Figure A10-10).
Assymetric Two-Table Analysis
Redundancy analysis and instrumental variables We saw how we can use the RV coefficient to find the level of correlation between two sets of data; however, it is often the case as in regression that the status of one of the tables is considered a response, whereas the other table may be considered explanatory. Explaining one variable by others is well known as multivariate linear regression. We try to find the linear combination of variables that maximizes the following:
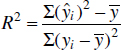
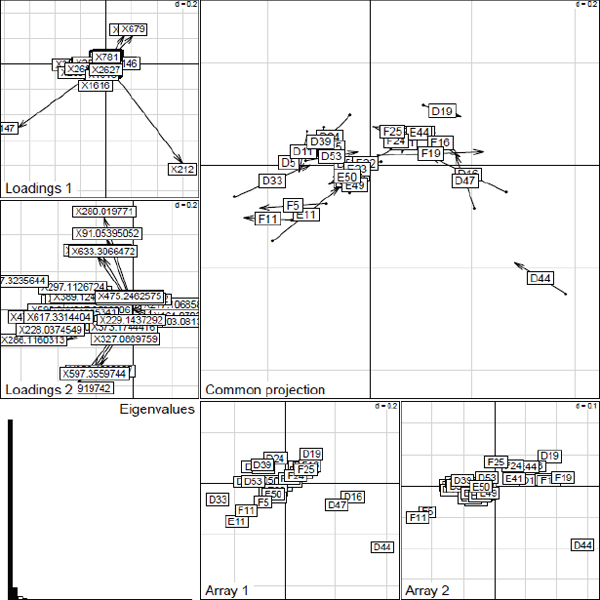
In that framework, we find the projection of Y onto the space spanned by X by computing
Px(y) = X(XtX)–1Xty.
Principal Component Analysis (PCA) with respect to instrumental variables (PCAIV) was a technique developed by Rao (1964) to find the best set of coefficients in the multivariate regression setting where the response is multivariate, given by a matrix Y.
Taking the example above, the metabolic features may be taken as a multivariate response and the gene expression measurements the explanatory table. In
this context the RV coefficient generalizes ordinary multivariate regression. We can look for the few principal components, known as instrumental variables (Rao, 1964), that explain the response table the best. These can be calculated by first taking the projection of Y onto the X matrix:
Px(Y) = X(XtX)–1XY.
Then, we do the PCA of PX(Y) to find a low-dimensional combination of them. This method is often used in ecology and psychology, where it is known as redundant data analysis (Van Den Wollenberg, 1977).
Things can get a little more complicated when, instead of wanting to predict or explain a table of continuous variables by an X composed also of continuous variables, we want to explain a contingency table of read counts of OTUs, present in a set of samples, by an explanatory matrix of continuous measurements X made on the same set of samples. To extend the method, the notion of variance is generalized to that of inertia of a set of weighted points:
![]()
In the case of contingency tables where the row sums and column sums are different, the overall inertia becomes proportional to the chi-square statistic.
Replacing the variance-covariance in the PCAIV computations above by the weighted chi-square gives a favorite method in ecology known as canonical correspondence analysis (CCA) (ter Braak, 1985).
Testing Factors in Canonical Correspondence Analysis
We can extend analysis of variance (ANOVA)-type methods to the decomposition of variability into parts explained by a factor, again using inertia or the chi-square. This is the strength of methods such as CCA and the analysis of distances (Anderson, 2001) provided by functions such as adonis in the vegan (Oksanen et al., 2012) package in R. The standard test statistic for ANOVA is
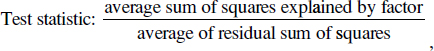
which is extended to the proportion of weighted sums of squared distances explained by a factor of interest. We can even separate out batch effects in exactly the same way they are removed in standard ANOVA.
Here is a small example on a series of measurements made on a set of mice for which we wanted to remove a cage effect. The actual factor of interest in the study was a shedding effect that we wanted to test after having adjusted for the cage effect.
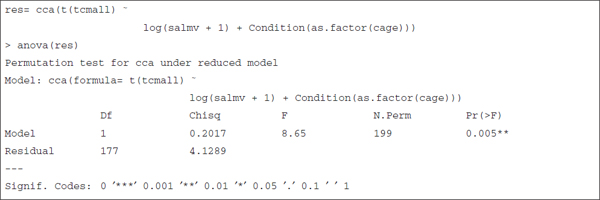
Best Practices in Data Analyses in Microbiology
To summarize some of the points made in this chapter, we give a short list of best practices to guide the practitioner through the statistical maze of available choices.
Careful Records
Always keep the raw data as well as a complete transcript or diary of the transformations and analyses performed. This is possible through packages such as knitr (Xie, 2012) and Sweave (Leisch, 2002) in R. This ensures that the analysis will be reproducible later if further data become available, but it will also enable a consistent record for future collaborators. Most importantly, reviewers may be interested in knowing how robust the obtained results are to certain choices (thresholds for filters, functions chosen to rescale the data such as log or square roots, down-weighting of outliers, etc). If a script is available, the user can easily check the results for robustness. Exemplary demonstration of the usefulness of such an approach can be found in the illustration of two articles on multitable analyses (see Dray et al., 2004; Thioulouse, 2011).
Keep All the Data Together
The metadata describing the covariates on the samples collected—dates, batches, and procedures—should be made available in a repository for later perusal. This can be essential because at the start of a study some biases or differences may not seem important but show up later as more data give more sensitive results.
Raw data and the transformation scripts are preferable for publication to transformed data as they also provide a way for the reader to reproduce the results in the paper as described. For instance, researchers sometimes take ratios of OTU reads to the total for each sample, thus providing a table of percentages. However, this results in a loss of information that easily jeopardizes the results because the precision with which each ratio is known is dependent on that ratio’s original denominator.
Noise and Outlier Elimination, Data Imputation
In the presence of noise and outliers it can be important to eliminate certain samples or OTUs. This can be done as long as it is documented as above in a diary or script. On the contrary, it may be necessary to impute a few missing points by taking local averages of the k nearest neighbors, for instance, or through other standard data imputation methods (Little and Rubin, 1987), of which there are many choices. If the script used is documented, the reader may replicate the analysis with a slightly different method and see the consequences on the final
result. If the data seem overly noisy, it can be beneficial to use robust methods such as nonmetric multidimensional scaling (NMDS) or to replace the data by their ranks.
When Using Ordination Methods, Always Plot the Eigenvalues
It is essential in multivariate projection methods such as PCA, PCoA, discriminant analysis (LDA), CCA, canonical correlation analysis (CCorA), or redundancy analysis (PCAIV or RDA) to show a plot of the successive eigenvalues. Reporting the percentage of inertia or variance explained by the first two components is not sufficient, because instabilities occur when two similar eigenvalues are split. This can easily occur, for instance, if the researcher has decided to retain enough of the eigenvalues to cover 80 percent of the variation of the data and the first five eigenvalues are proportional to 69, 12, 11, 5, and 3. Having a hard threshold of 80 percent will result in the separation of the two eigenvalues 12 and 11, which are probably not statistically different. In that case, the components are not stable but the whole plane defined by the second and third components is. Packages such as ade4 (Chessel et al., 2004) systematically provide the scree plot in all output display functions for projection methods based on eigendecompositions.
Enhance Interpretation Using Redundant and Contingent Information as Well as Regularization
Sanity checks include the plotting of extra information available about factors such as batches, plots, or laboratories. This should be plotted using techniques such as the projections made in Figure A-10-10. Known gradients or groupings should be checked on the plots to verify consistency.
Many researchers find the output from simple least-squares projection methods arduous to interpret; with linear combinations of large numbers of genes or OTUs, model selection can be difficult. Recent progress in regularization techniques that incorporate penalties for more complex models can be useful in trying to select more parsimonious models. Such methods include sparse PCA as implemented in the elasticnet package (Zou and Hastie, 2008) or regularized canonical correlation analysis available in the package cca (González et al., 2008) and a sparse version of PCA and CCorA (pma; see Witten et al., 2009).
Always Look at Your Data, All the Data
A complete analysis always separates data into pieces eventually. However, the process has to be completely documented and the effects of outliers and specific groups documented before the data are decomposed. It is only safe to separate out parts of the data by slicing into homogeneous tables after having
documented the dependency data using quantitative coefficients. Contiguous information, such as graphs linking related or interacting species or genes, and spatial maps of sampling locations, should always be incorporated into the data. This is important because samples with a high degree of dependency provide less information and standard statistical coefficients should be reweighed to account for this.
Separate Out a Subset of the Data for Confirmatory Purposes
As detailed above, the number of choices made throughout an analysis rapidly multiply. Thus, researchers have the opportunity to thoroughly explore their data to generate a meaningful narrative. However, this often results in overfitting and multiple testing problems. One solution to this problem is to use a separate data set for confirmation of the analysis. The ideal situation is that when a large data set is available, a random subsample is set aside for separate diagnostic purposes. An alternative is to design a separate confirmatory experiment of the hypothesis generated by the analyses. Controlling for false discovery rates after many data transformations and choices of endpoints is a difficult task. Some procedures have been developed and are available in R (Pollard et al., 2010) and mutoss for instance. However, there is usually a high level of dependency in the variables and tables, making standard procedures based on independence assumptions inadequate. For hierarchical dependencies, as in the case of taxonomic ranks, strucSSI provides an implementation of procedures recommended by Benjamini and Yekutieli (2001).
State of the Art in Modern Statistics
Computational power has enabled statisticians to develop many new robust, nonparametric, and sparse methods. Robustness (Huber, 1981) is a statistical quality that ensures that the results of an analysis are not changed if a few of the observations are removed. This is the case for methods with a high breakdown point like the median, whereas the mean of n observations has a low breakdown point at 1n. 41 Robustness to outliers is important for several reasons: analyses based on least squares can be easily perturbed by one or two outliers and multivariate data rarely follow multivariate normal distributions. Many implementations of robust methods are available (robustbase or FRB in R). Rank-based transformations generally ensure results that are robust in the statistical sense. A simple example of a robust transformation is a Winsorization, which changes the top 1 percent of values and the lower 1 percent and makes them equal to the 99th and 1st percentile of the distribution. This is a one-line transformation in R:
___________
41 By changing one data point in a sample of size n, we can change the mean by as much as we like.
library(psych)
wm=winsor(tab1,trim=0.05)
A consensus has been reached in the study of microarrays (Allison et al., 2006) that rank-based transformations such as rma can help stabilize the variances of the variables. The same is true in ecology where robust PCoA such as NMDS has become popular.
Smoothers for multivariate data such as LOWESS have increased in popularity since their success in reducing bias in the analysis of microarrays; in fact, nonparametric methods in regression and supervised learning have become ubiquitous. Statisticians group together all methods that enable fitting data without prior specification of a small finite number of parameters under the general “nonparametric” umbrella. Methods that prioritize sparseness were developed both to improve interpretability of the results and to counter the difficulties of having a much larger number of potential variables than the number of samples (the large-p, smaller-n paradigm). Sparse PCA (Zou et al., 2006) and elasticnet or glmnet (Zou and Hastie, 2008) provide useful solutions to today’s challenging data containing as many measurements as 30,000 genes or 15,000 OTU frequencies measured on many fewer samples (generally in the hundreds). These sparse methods provide principal components constrained to have very few nonzero coefficients, thus ensuring a high degree of interpretability.
Conclusions
We have made the case that, for science to move forward in step with current levels of data and software availability, communities of users should be able to transfer technologies easily through open-source platforms and reproducible research. A collaborative platform such as R has the advantage of an object-oriented structure that allows good levels of data integration, such as those shown in packages such as edgeR or phyloseq. High-quality graphics make it easy for the user to keep in touch with the data and make publication-level plots through layering functions such as those available in ggplot2. The level of complexity in threshold and tuning parameter choices requires simulation and Monte Carlo tools for creating realistic noise models and sensitivity tests, all of which are currently available.
New standards of publication in statistical work are percolating across the disciplines and many articles are published with all the source code and data in such a way that any user could redo the analyses in the article from beginning to end. A wonderful example of such a case study showing how to do multiple table analyses on paired ecological tables can be found in the web supplement to Thioulouse (2011).42 The goal of these collaborative approaches is to em-
___________
power a new generation of biologists/data analysts to keep in touch with their data, whether there be megabytes or terabytes of it. Although the new statistical environments such as R can be intimidating, the Complete R Archive Network site43 contains more than 100 books and documentation sources. There are also many tutorials available online so the interested user could get started with the help of the large user community. We hope this review will encourage users to adventure further into the exploration of their data. We have added a short list of R packages in the appendix as a guide to some interesting methods.
Acknowledgments
We would like to thank our collaborators David Relman, Alfred Spormann, and Les Dethfelsen, as well as our students and postdoctoral fellows Alden Timme, Katie Shelef, Yana Hoy, Miling Yan, Diana Proctor, Audrie Lin, Julia Fukuyama, Kris Sankaran, Sam Pimentel, and Angela Marcobal.
None of this would have been possible without the R community, in particular the participants in the Bioconductor project, the developers of the ade4 and vegan packages, and Emmanuel Paradis for all his work on the ape package.
Funding from NIH/NIGMS R01, NSF-VIGRE, and NSF-DMS.
Appendix
We give here some of the most useful packages for the analysis of microbial communities from different areas of statistics. Statistical analysis of the microbiome data uses methods from ecology, clinical biostatistics, spatial statistics, bioinformatics, and phylogenetics. Here is an incomplete list of some packages we have found invaluable for this enterprise:
High throughput sequencing, RNA-Seq DEseq, shortread, phyloseq, genefilter, edgeR.
Microarray analyses Biobase, genefilter, vsn, marray, limma, multtest, made4.
Annotation biomaRt, AnnotationDbi, GOstats, KEGG, PFAM, xcms.
Decompositions aov, anova, lm, medianpolish, permanova.
Ecology and phylogenetic analyses vegan, ade4, ape, phangorn, distory, picante.
Plotting ggplot2, lattice, phyloseq, heatmap2, neatmap, rgl.
___________
Multivariate analyses ade4, cluster, knn, som, kohonen, sparcl, flexclust.
Supervised learning tree, e1071, randomForest, ipred, lasso2,lars, elasticnet, kernlab.
Spatial data spatstat, spdep, spBayes.
Sparse and robust methods elasticnet.
Nonparametric testing bootstrap, coin, Hmisc, asypow, npmc.
Bayesian methods arm, bayesclust, lda, DPpackage, topicmodels, coda, rjags, MasterBayes, lmm.
References
Allison, D., X. Cui, G. Page, and M. Sabripour. 2006. Microarray data analysis: From disarray to consolidation and consensus. Nature Reviews Genetics 7(1):55-65.
Anderson, M. 2001. A new method for non-parametric multivariate analysis of variance. Austral Ecology 26(1):32-46.
Arumugam, M., J. Raes, E. Pelletier, D. Le Paslier, T. Yamada, D. Mende, G. Fernandes, J. Tap, T. Bruls, J. Batto, M. Bertalan, N. Borruel, F. Casellas, L. Fernandez, L. Gautier, T. Hansen, M. Hattori, T. Hayashi, M. Kleerebezem, K. Kurokawa, M. Leclerc, F. Levenez, C. Manichanh, H. B. Nielsen, T. Nielsen, N. Pons, J. Poulain, J. Qin, T. Sicheritz-Ponten, S. Tims, D. Torrents, E. Ugarte, E. G. Zoetendal, J. Wang, F. Guarner, O. Pedersen, W. M. deVos, S. Brunak, J. Doré, MetaHIT Consortium, M. Antolin, F. Artiquenave, H. M. Blottiere, M. Almeida, C. Brechot, C. Cara, C. Chervaux, A. Cultrone, C. Delorme, G. Denariaz, R. Dervyn, K. U. Foestner, C. Friss, M. van de Guchte, E. Guedon, F. Haimet, W. Huber, J. van Hylckama-Vlieg, A. Jamet, C. Juste, G. Kaci, J. Knol, O. Lakhdari, S. Lavec, K. LeRoux, E. Maquin, A. Mérieux, R. Melo Minardi, C. M’rini, J. Muller, R. Oozeer, J. Parkhill, P. Renault, M. Rescigno, N. Sanchez, S. Sunagawa, A. Torrjon, K. Turner, G. Vandemuelebrouck, E. Varela, Y. Winogradsky, G. Zeller, J. Weissenbach, S. D. Ehrlich, and P. Bork. 2011. Enterotypes of the human gut microbiome. Nature 473(7346):174-180.
Benjamini, Y., and D. Yekutieli. 2001. The control of the false discovery rate in multiple testing under dependency. Annals of Statistics 29(4):1165-1188.
Caporaso, J., C. Lauber, W. Walters, D. Berg-Lyons, C. Lozupone, P. Turnbaugh, N. Fierer, and R. Knight. 2011. Global patterns of 16s rRNA diversity at a depth of millions of sequences per sample. Proceedings of the National Academy of Sciences of the United States of America 108(Suppl 1):4516.
Chambers, J. 1999. Computing with data: Concepts and challenges. American Statistician 53(1):73-84. Chessel, D., A. Dufour, and J. Thioulouse. 2004. The ade4 package—I: One-table methods. R News 4(1):5-10.
Cleveland, W. 1981. LOWESS: A program for smoothing scatterplots by robust locally weighted regression. The American Statistician 35(1):54.
Costello, E., C. Lauber, M. Hamady, N. Fierer, J. Gordon, and R. Knight. 2009. Bacterial community variation in human body habitats across space and time. Science 326(5960):1694-1697.
Dethlefsen, L., and D. Relman. 2011. Incomplete recovery and individualized responses of the human distal gut microbiota to repeated antibiotic perturbation. Proceedings of the National Academy of Sciences of the United States of America 108(Suppl 1):4554.
Diaconis, P., and B. Sturmfels. 1998. Algebraic algorithms for sampling from conditional distributions. Annals of Statistics 26(1):363-397.
Dray, S., D. Chessel, and J. Thioulouse. 2003. Co-inertia analysis and the linking of ecological data tables. Ecology 84(11):3078-3089.
Dray, S., A. Dufour, and D. Chessel. 2004. The ade4 package—II: Two-table and k-table methods. Supplementary website. http://pbil.univ-lyon1.fr/JTHome/ref/ade4-Rnews.pdf (accessed September 27, 2012).
Eckburg, P. B., E. M. Bik, C. N. Bernstein, E. Purdom, L. Dethlefsen, M. Sargent, S. R. Gill, K. E. Nelson, and D. A. Relman. 2005. Diversity of the human intestinal microbial flora. Science 308(5728):1635-1638.
Feller, W. 1957. Introduction to probability theory and its applications, Vol. I. New York: Wiley.
Gentleman, R., and D. Temple Lang. 2007. Statistical analyses and reproducible research. Journal of Computational and Graphical Statistics 16(1):1-23.
González, I., S. Déjean, P. Martin, and A. Baccini. 2008. CCA: An R package to extend canonical correlation analysis. Journal of Statistical Software 23:1-14.
Holmes, S. 2006. Multivariate analysis: The French way. In Probability and statistics: Essays in honor of David A. Freedman, edited by D. Nolan and T. P. Speed. IMS Lecture Notes–Monograph Series, Vol. 56. Beachwood, OH: IMS. Pacific Symposium on Biocomputing, 142 pp.
Holmes, S., A. Alekseyenko, A. Timme, T. Nelson, P. Pasricha, and A. Spormann. 2011. Visualization and statistical comparisons of microbial communities using R packages on Phylochip data. Pacific Symposium on Biocomputing 2011:142-153.
Huber, P. J. 1981. Robust statistic. New York: Wiley.
Human Microbiome Consortium et al. 2012a. A framework for human microbiome research. Nature 486:215-221.
Human Microbiome Consortium et al. 2012b. Structure, function and diversity of human microbiome in an adult reference population. Nature 486:207-214.
Ihaka, R., and R. Gentleman. 1996. R: A language for data analysis and graphics. Journal of Computational and Graphical Statistics 5(3):299-314.
Leisch, F. 2002. Sweave. Dynamic generation of statistical reports using literate data analysis. In Comstat 2002—proceedings in computational statistics. Heidelberg: Springer Verlag. Pp. 575-580.
Little, R., and D. Rubin. 1987. Statistical analysis with missing data, Vol. 4. New York: Wiley.
Lozupone, C., and R. Knight. 2005. UniFrac: A new phylogenetic method for comparing microbial communities. Applied and Environmental Microbiology 71(12):8228.
Lozupone, C., M. Hamady, S. Kelley, and R. Knight. 2007. Quantitative and qualitative {beta} diversity measures lead to different insights into factors that structure microbial communities. Applied and Environmental Microbiology 73(5):1576.
Marcobal, A., S. Holmes, L. Dethlefsen, J. Sonnenburg, and D. Relman. 2012. Combined analyses of metabolic profiles, metagenomic analyses for patients perturbed by antibiotic. Unpublished.
McMurdie, P., and S. Holmes. 2012. Discussion of relative merits of normalization methods for OUT tables (in preparation).
Nacu, S., R. Critchley-Thorne, P. Lee, and S. Holmes. 2007. Gene expression network analysis and applications to immunology. Bioinformatics 23(7):850-858.
Oksanen, J., F. G. Blanchet, R. Kindt, P. Legendre, P. R. Minchin, R. B. O’Hara, G. L. Simpson, P. Solymos, M. H. H. Stevens, and H. Wagner. 2012. vegan: Community ecology package. R package version 2.0-3.
Pollard, K. S., H. N. Gilbert, Y. Ge, S. Taylor, and S. Dudoit. 2010. multtest: Resampling-based multiple hypothesis testing. R package version 2.4.0.
Purdom, E. 2010. Analysis of a data matrix and a graph: Metagenomic data and the phylogenetic tree. Annals of Applied Statistics 5(4):2326-2358.
Rao, C. R. 1964. The use and interpretation of principal component analysis in applied research. Sankhya A 26:329-359.
ter Braak, C. 1985. Correspondence analysis of incidence and abundance data. Biometrics 41:859-873.
Thioulouse, J. 2011. Simultaneous analysis of a sequence of paired ecological tables: A comparison of several methods. Annals of Applied Statistics 5(4):2300-2325.
Van Den Wollenberg, A. 1977. Redundancy analysis an alternative for canonical correlation analysis. Psychometrika 42(2):207-219.
Wickham, H. 2009. ggplot2: Elegant graphics for data analysis. New York: Springer.
Wilkinson, L., and G. Wills. 2005. The grammar of graphics. New York: Springer-Verlag.
Wilson, K. H., W. J. Wilson, J. L. Radosevich, T. Z. DeSantis, V. S. Viswanathan, T. A. Kuczmarski, and G. L. Andersen. 2002. High-density microarray of small-subunit ribosomal DNA probes. Applied and Environmental Microbiology 68(5):2535-2541.
Witten, D., R. Tibshirani, and T. Hastie. 2009. A penalized matrix decomposition, with applications to sparse principal components and canonical correlation analysis. Biostatistics 10(3):515-534.
Xie, Y. 2012. knitr: A general-purpose package for dynamic report generation in R. R package version 0.4.1.
Zou, H., and T. Hastie. 2008. elasticnet: Elastic-net for sparse estimation and sparse PCA. R package version, 1–0.
Zou, H., T. Hastie, and R. Tibshirani. 2006. Sparse principal component analysis. Journal of Computational and Graphical Statistics 15(2):265-286.
DISPERSAL OF CARGO MICROORGANISMS BY SWARMING BACTERIA
Colin J. Ingham44
Introduction to Swarming Bacteria
Microorganisms have many ways to move around. Dispersal may be by passive means or by using other organisms as vectors. Additionally, many species of bacteria can migrate; this implies both an active means of propulsion and sufficient sensitivity to external conditions to trigger and/or guide motility. A major form of microbial existence is on surfaces, and under favorable conditions it is perfectly feasible for microbes to travel many centimeters over a hydrated surface. This movement can occur by a number of means, including twitching and gliding motility and other methods, such as spreading, i.e., the elongation of chains of nonmotile cells. Flagellar rotation can also drive collectives of bacteria to migrate over a surface; this is referred to as swarming, by analogy with multicellular organisms such as insects (Harshey, 2003; Henrichsen, 1972; Kearns, 2010). Swarming may be aided by differentiation into specialized swarmer cells;
___________
44 Microdish BV, Utrecht, the Netherlands.
these are often both elongated (compared to vegetative cells of the same species) and hyperflagellated. Some species (e.g., Vibrio spp.) may produce flagella specifically adapted to travel within a thin film of liquid on a surface rather than planktonic motility (swimming in larger volumes of fluid). Swarming bacteria can sense both the presence of a suitable surface and whether they have achieved a suitable cell density for collective action to be effective (often involving “quorum sensing”). Swarming may be viewed as an alternative lifestyle choice compared to sessile colonization of a surface, i.e., a biofilm. Swarming can be associated with the secretion of molecules that facilitate progress. Such extracellular agents include surfactants, lubricants, polymers, antimicrobials, and/or agents of communication (including the molecules involved in quorum sensing). Some secreted compounds (but certainly not all) may be regarded as “public” or “common” goods, resources shared by a microbial community, facilitating the development of powerful models for the study of cooperation and competition within microbial communities. Pseudomonas aeruginosa is one such system: rhamnolipids are critical common goods required for swarming. In the case of P. aeruginosa the metabolic control of rhamnolipid secretion is important in limiting the emergence of noncontributory “cheater” mutants (Xavier et al., 2011). Swarming by the hyperflagellated, elongated cells of Proteus spp. has long been recognized by medical microbiologists as both a fascinating object of study and a confounding factor in clinical assays, the latter by contaminating agar plates during diagnostics assays (Dienes, 1946, 1947). Under permissive conditions, Proteus mirabilis and Proteus vulgaris swarm outward from the inoculation point on an agar plate, alternating zones of swarming with zones of consolidation (the latter as vegetative cells). This produces a characteristic pattern of concentric rings resembling the cross section of a tree. When two identical strains of P. mirabilis meet, the swarming masses of cells interpenetrate without conflict. When non-identical strains meet, there is an incompatibility reaction—a border region containing apparently damaged cells—and the strains fail to mix (Figure A11-1). This effect implies a mechanism of distinguishing self from non-self. The border region between different strains has been known for more than 70 years as a Dienes line (Dienes, 1946, 1947) and is used clinically in strain typing. However, it is only recently that the genetic basis of this form of territoriality and individuality has started to emerge (Gibbs et al., 2008, 2011).
The examples provided by Proteus and Pseudomonas and other swarming bacteria have shown that powerful model systems illuminating fundamental issues in biology may be derived from their study (and indeed by other collective systems of surface motility such as those used in predation and cooperation/defection in the Gram-positive bacterium Myxococcus xanthus) (Velicer et al., 1998). Swarming bacteria have also attracted attention from disciplines outside biology. In particular, mathematicians and related investigators have been attracted by the complex patterns and the self-organizing nature of bacterial swarms (Ben Jacob et al., 1994, 2000; Komoto et al., 2003; Matsuyama and Matsushita,
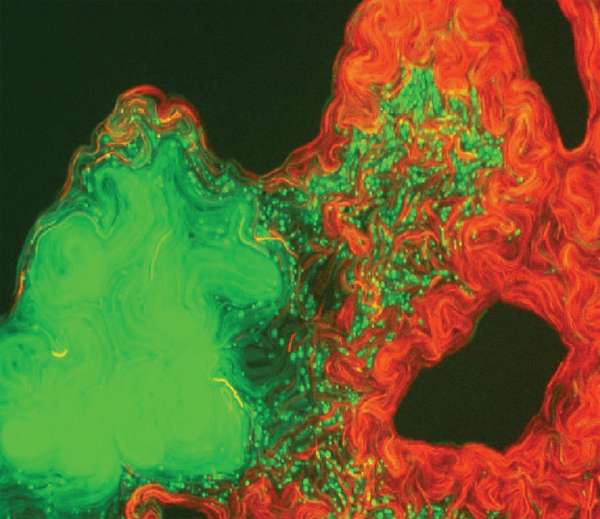
FIGURE A11-1 Swarming by Proteus mirabilis. Swarming on an agar plate, showing a border region between two different strains, one labeled with green fluorescent protein (GFP) and one with dsRED fluorescent protein. The strain expressing the GFP is forming rounded, damaged cells when in close proximity to the red strain.
SOURCE: Budding et al. (2009).
1992; Ohgiwari et al., 1992; Thar and Kühl, 2005). Issues such as collective decision making, including “swarm intelligence,” where a mass of independent but interacting entities without a fixed hierarchy may make superior decisions to individuals, can be studied (Halloy et al., 2007). In addition, the plastic nature of pattern-forming organisms is a form of temporary multicellularity (Shapiro, 1998), one that appears to be adaptive both to internal constraints (including cell-to-cell contacts and communication) and to external factors, i.e., responding to the environment. This, in turn, raises the question as to what swarming bacteria reveal about the origins and development of more permanent forms of multicellularity. Further questions triggered by swarming bacteria relate to the ecological value and costs of their behavior. For example, what happens when a swarming mass of bacteria meets other microorganisms? Are there issues that relate to the
interactions of rapidly moving masses of microorganisms within a short time frame that differ from more static, more slowly developing interactions? How are new niches colonized when it is likely they already contain indigenous microflora? What is the contribution of swarming to dispersal of microorganisms in the soil or infections? This article focuses on the swarming bacterium Paenibacillus vortex and attempts to indicate what this swarming bacterium may contribute to the field.
Paenibacillus vortex: A Pattern-Forming Swarmer
P. vortex is a Gram-positive, sporulating bacterium; its cells are distinctly curved rods, generally 3 microns or longer. P. vortex is a highly effective swarmer and can migrate across an agar plate under a wide range of conditions (Figures A11-2 and A11-3). The genome has been sequenced and contains a set of genes commonly found in bacteria from the rhizosphere, i.e., a very high proportion of two-component systems,45 attack- and defense-related genes (including putative antibiotic synthesis pathways and antibiotic-resistance mechanisms), and many membrane-associated transporters and other (primarily nutrient uptake) related functions (Galperin, 2005; Sirota-Madi et al., 2010). The closest relative (based on 16S rRNA sequence) is Paenibacillus glucanolyticus. The only mechanism of motility apparent from the genome, with this conclusion supported by scanning electron microscopy of swarming cells, uses peritrichous flagella (Ingham and Ben-Jacob, 2008). When swarming, P. vortex has very strong tendencies to chase its own tail, or at least swarm in curved trajectories, and is able to form elegantly rotating colonies on higher percentage agars (> 1.5% w/v). Imaging of swarming colonies reveals lubricant trails (e.g., Figure A11-2A), whereas electron microscopy of elongated, stressed swarmer cells also shows that quite extreme curvature can be compatible with these rotating microcolonies (Figure A10-2B). P. vortex is a very versatile swarmer; for example, it can swarm on very high-percentage agars (up to 2.2% w/v) and quite low-percentage agars (0.4% w/v), which is a wider range than many other bacteria including Gram-negative rods. P. vortex swarms but it does not always colonize the entire plate, instead forming patterns (Figure A10-3) with regions of agar lacking any bacteria. The mechanisms by which this occurs are largely unknown but there appear to be repulsive forces, possibly mediated by signalling molecules or lubricants (Ben-Jacob et al., 2000;
___________
45 Two component systems are common mechanisms in bacteria to sense the environment (directly or indirectly) and transduce that information to other cellular components (genes, proteins) so an appropriate response is made. They usually consist of a protein (an autophosphorylating kinase) that acts as a sensor and a partner protein (a response regulator) that receives the phosphate moiety and which then controls the expression of a gene network or the behaviour of a protein complex (the flagellar motor). A cell can have 200 such systems, which raises interesting questions as to the specificity of each two component system and how such a complicated information network facilitates overall decision making and enhances survival.
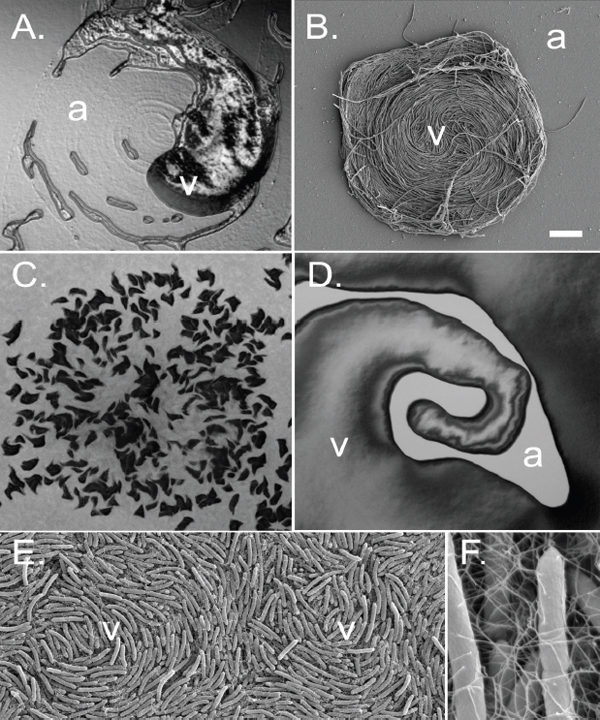
FIGURE A11-2 Microscopy of P. vortex cells and microcolonies. (A) Light microscopy of a swarming colony moving clockwise in circles (v) on agar (a). (B) Scanning electron microscopy of a colony responding to the antibiotic mitomycin C and showing coiling of the elongated cells. (C) Pattern of sporulation (dark areas). (D) Light microscopy of an elongating snake of P. vortex (v) on 0.7% (w/v) agar (a) showing self-avoidance forcing extension in a decreasing spiral pattern. (E) Scanning electron microscopy of individual cells showing two foci (v, vortices). (F) Magnified view of individual cells showing flagella.
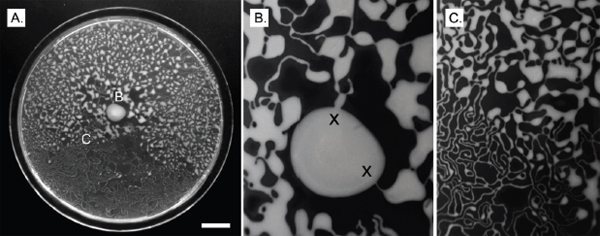
FIGURE A11-3 Pattern formation by swarming P. vortex. Three examples showing regions of P. vortex colonies (7.4 × 5.5 cm area, scale bar indicates 1 cm, growing from a central inoculation point), the bacteria which leave considerable areas of the agar plate uncolonized and thereby create patterning. Panels B and C show detail from the central region and a peripheral region of the plate in panel A.
Ingham and Ben-Jacob, 2008). These complicated colonies are highly dependent on the environmental conditions (e.g., humidity, nutrients, stress).
Transport of Aspergillus fumigatus Conidia by Paenibacillus vortex
Many Paenibacillus spp. interact with fungi. Examples of cooperation of Paeinibacilli spp. with fungi and also competition or antagonism are known (Budi et al., 2000; Dijksterhuis et al., 1999; Hildebrandt et al., 2006). Given this, and the relative ease of distinguishing fungal spores (conidia) from bacterial cells in terms of imaging and growth, we have explored the involvement of P. vortex with fungi, particularly using Aspergillus fumigatus. A. fumigatus is a well-known and widespread filamentous fungus with both sexual and asexual sporulation cycles, the latter producing conidia 3 to 4 µm across. A. fumigatus is an opportunistic pathogen, and an allergen, with a complex genome of 29.4 Mb (Nierman et al., 2005). However, this fungus is not motile (not by mycelia or by spores) and dispersal is largely passive. If the conidia are inoculated in the center of a large agar plate the vegetative mycelia can grow outward over a period of days. Eventually, under permissive conditions, such a colony sporulates (Campbell, 1971). The fungus can reach the edge of the Petri dish either by outgrowth or, in some situations, the spores can become airborne and can inoculate the agar closer to the edge than the parental mycelia. On many growth media, including reduced-strength Mueller–Hinton medium, the fungus takes from 9 to 12 days to reach the edge of a 14 cm–diameter agar plate from an inoculation point in the center. The question posed was whether swarming bacteria can accelerate this process. A very simple experiment was done to test this proposition (Figure A11-4 and
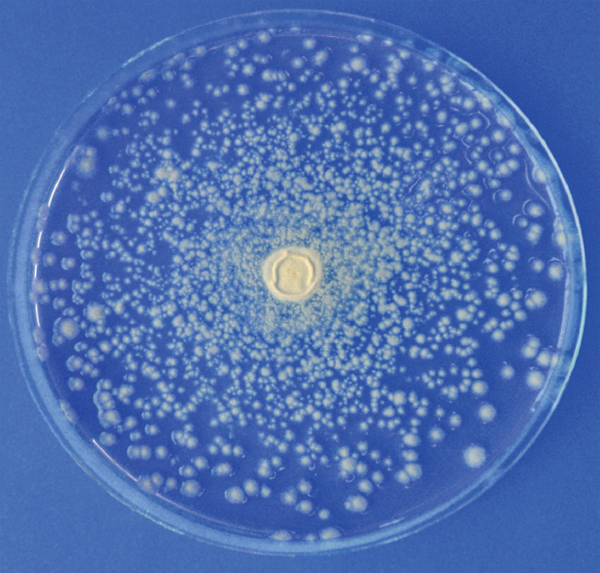
FIGURE A11-4 Transport of A. fumigatus conidia by P. vortex. Swarming P. vortex was co-inoculated with conidia of A. fumigatus in the center of a 14 cm nutrient agar plate. The picture was taken after 72 h; only the fungal colonies are visible, although the plate is also covered with the bacteria. In all locations except the center the colonization of the plate by the fungus is due to relocation (transport) of conidia from the center by the swarming bacteria. If inoculated without P. vortex or with P. vortex under nonswarming conditions the fungus cannot spread across the agar plate (not shown).
SOURCE: Adapted from Ingham et al. (2011).
Ingham et al., 2011). Actively swarming P. vortex were coinoculated with purified conidia of A. fumigatus at the center of a 14 cm plate containing reduced-strength Mueller–Hinton medium. The bacteria became distributed across the plate by swarming. After a few days, fungal colonies spread out from the central point across the plate, scattered and with fewer colonies toward the edge of the plate. If such plates were examined at an earlier stage, when the fungus had hardly grown and the microcolonies were only visible by microscopy, the fungus could be seen
growing inside the mass of the P. vortex. Growth from the P. vortex swarm out into the unoccupied agar was sometimes observed, but the fungus was never seen germinating free of the bacterium. It was concluded that the swarming bacteria were transporting the spores (conidia).
Analysis of movies of the motion of the conidia and of the bacteria surrounding the conidia has proved revealing. Imaging is typically performed using a total magnification of from ×40 to ×100 over a period of a few minutes. Time-lapse movies (Movies 1 to 3) show conidial transport. 46 These movies can be found online at the National Academy of Sciences.47 This analysis has been digitized and compared to a series of models that superimpose “virtual conidia” and predicts their motion using different scenarios based upon assumptions about how the conidia and the bacteria are associating with each other. The model that fits is that the conidia are moving at the same rate as the surrounding microorganisms, and the structure of the microorganisms around the conidia is relatively stable, at least over a period of a few minutes. There appears to be a physical connection, or at least stable linkage, between the two microorganisms. Electron microscopy confirms this; the conidia appear to be trapped or entangled within the flagella of the bacteria.
___________
46MOVIE 1: Overview of conidial transport by a bifurcating mass of P. vortex. Swarming mass of the bacterium Paenibacillus vortex (hundreds of microns across) moving as an extending, growing, and splitting body (from the top left to the right for one branch and down for the other). This migrating collective is composed of millions of bacteria (not individually visible) all linked and driven to move across the agar surface by up to 10 flagella per cell. The P. vortex in this video are effectively coordinating to transport hundreds of ungerminated conidia (dark masses of spores from the non-motile fungus Aspergillus fumigatus) as cargo. This time-lapse movie, imaged using microscopy, was made a few hours after inoculation and several centimeters away from the inoculation point on nutrient agar. The fungus alone cannot move this far this fast, so the bacterium is effectively aiding the fungus in reaching new environments. SOURCE: Ingham et al., 2011; Proceedings of the National Academy of Sciences of the United States of America 108:19731-19736 Supplementary Information. (2011). Still images from this movie are found as Figure A11-5.
MOVIE 2: A rotating colony of P. vortex accumulating conidia by spooling them from the inoculation point. Ultimately (20 min after this movie) the connection will break and the colony migrates outward independently. The colony is hundreds of microns across, is rotating once every 3 min, and conidial masses are rotating at approx. 3 µm s-1. SOURCE: Ingham et al., 2011; Proceedings of the National Academy of Sciences of the United States of America 108:19731-19736 Supplementary Information. (2011).
MOVIE 3: High magnification (×500 total magnification) imaging of conidial transport. You are now seeing individual spores. These are multilayer masses of the Paenibacilli. You can see here, as it sweeps over, it is picking up some of the spores that were not moving before. Basically, it seems that the Paenibacilli can only move the conidia when they are involved in these sort of multicellular slugs, and not as a monolayer. Individual conidia. SOURCE: Adapted from Ingham et al., 2011; Proceedings of the National Academy of Sciences of the United States of America 108:19731-19736 Supplementary Information. (2011).
47 See http://www.pnas.org/content/108/49/19731/suppl/DCSupplemental.
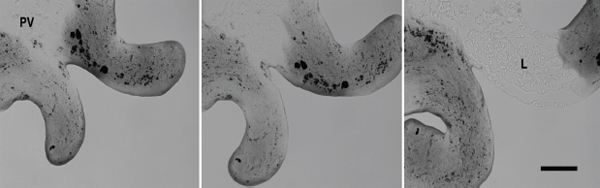
FIGURE A11-5 Transport of conidia by P. vortex. Conidia transport can be seen to be rapid when viewed by microscopy. Left to right: images taken over a period of 2 min showing a bifurcating swarming mass of P. vortex (PV) transporting aggregates of A fumigatus conidia. Lubricant trails (L) are apparent in the right-hand panel.
SOURCE: Adapted from Ingham et al. (2011).
What Is the Significance of Microbial Cargo Transport Outside the Laboratory?
We know that microorganisms can generate mechanical force to drive their own motion and move objects (Figure A11-6 and Darnton et al., 2004). Microengineers tells us that there are a number of ingenious devices that use microorganisms to move wheels (e.g., Hiratsuka et al., 2006). It is possible to conjugate cargo beads to motile algae, then get them to swim and deliver the beads somewhere else within a microfluidic system (Weibel et al., 2005). In this case the movement of the algae was directed by light. Clearly, eukaryotic microorganisms can move prokaryotes (Brock et al., 2011; Rowbotham, 1980). But motile bacteria cooperatively carrying larger eukaryotic microorganisms appear to be a novel observation. A 30 cm translocation of A. fumigatus spores has been achieved using P. vortex (Ingham et al., 2011). This suggests that microbial cargo transport could happen in a way that does not require highly controlled (e.g., microengineered) environment but possibly could work in nature.
When the bacteria move fungal spores, the spores are largely viable. During the germination process of A. fumigatus without bacteria the conidia swell over a period of a few hours then mycelial outgrowth occurs after 6-7 h on reduced-strength Mueller–Hinton agar. This all happens also within the P. vortex swarm and at the same rate. Therefore, the conidia are active and able to sense their environment inside the swarm, as they are if they are just inoculated in the same medium on an agar plate without bacteria, inasmuch as certain environmental conditions (moisture, nutrients, temperature) triggered outgrowth. Conidia can move about 1 cm per hour in P. vortex swarms. It is known that fungal spores are adapted for some forms of dispersal, including via the wind, water, or insects (Nagarajan and Singh, 1990; Raguso and Roy, 1998; Van Leeuwen et al., 2010).
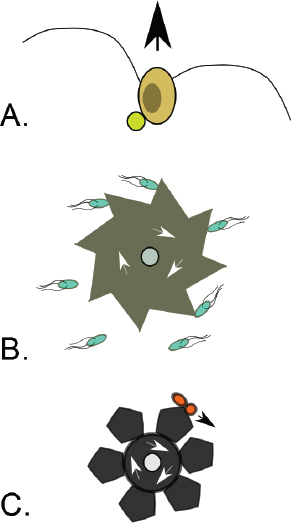
FIGURE A11-6 Examples of motile microorganisms moving other objects within microengineered environments. (A) A cell of the flagellated alga Chlamydomonas reinhardtii with a covalently bound bead (smaller sphere) is shown. Light-directed transport is possible within microfluidic channels at velocities of 100 to 200 µm/s with cargo beads ranging from 1 to 6 µm diameter over distances of up to 20 cm. (B) 48 µm–diameter, 10 µm–thick microengineered microrotor capable of being rotated at around 1 rpm by a dense bath of motile cells of the bacterium Escherichia coli (Di Leonardo et al., 2010). (C) Microengineered rotor (20 µm diameter) driven by a single cell of a covalently attached gliding bacterium, Mycoplasma mobile (orange).
Not all conidia of equal size are transported with equal efficiency (Ingham et al., 2011), but we currently do not understand the relevance of this in nature.
One possible use for conidial transport, from the fungal perspective, could be to escape adverse environments. In an experiment designed to test this proposition, P. vortex and A. fumigatus conidia were co-inoculated in the center of an agar plate in the presence of an antifungal drug, voriconazole (Chryssanthou et al., 2008; Verweij et al., 2007). Some conidia were “rescued” by the bacterium and deposited in a region of the plate lacking the antifungal agent. P. vortex can also move across conidia from another location, pick them up, and deposit them
farther away, although not with the same efficiency as if the two organisms are co-inoculated (Ingham et al., 2011).
Many swarming bacteria are refractory to antibiotics, a phenomenon that appears linked to both high cell density and motility (Butler et al., 2010). P. vortex can swarm across regions containing high concentrations of antibiotics (for example using a row of antibiotic-containing tabs) that are sufficient to inhibit the growth of static bacteria. The bacteria that can do this are a subpopulation of the P. vortex population, referred to as explorers or pioneers. It is possible to track the paths of individual swarms as they cross this relatively hostile region. When they get to the other side, the bacteria can start to grow normally. The antibiotic refractory motile colonies are not mutants. They respond in the same way if given the same challenge again. This phenomenon is some form of phenotypic resistance to antibiotics; the relationship between these and antibiotic-refractory subpopulations (potentially including persisters) is unclear. If the P. vortex is transporting cargo conidia some of the swarms will approach the antibiotic tab more effectively than others but the region will be colonized less well than if the antibiotic is absent. A few days later, the fungal spores, which have been hiding out inside the Paenibacillus mass, germinate, and, in this niche, they can compete very effectively with the bacterium, so they take over.
Cargo transport may take place in soil. A simple way to think about the soil is as a series of microniches, many separated by gaps (Figure A11-7). The gaps, microniches in their own right, may have water or air in them. Filamentous fungi can cross air gaps quite effectively by extending growing mycelia. Many bacteria swim well or are otherwise capable of passively crossing a water gap but have problems crossing air gaps (Nazir et al., 2010). The air gap can be simulated on an agar plate (Figure A11-8). One experimental approach is to inoculate the conidia and the bacterium very close to this gap. At least in some cases, if you wait long enough, the growth of the mycelia will cross the gap and inoculate the agar on the other side with the bacteria. The mechanism is not fully understood. Swarming in P. vortex is inhibited by p-nitrophenyl glycerol (Ingham et al., 2008), which is also an antiswarming agent for Proteus spp. (Liaw et al., 2000), and this agent reduces (but does not eliminate) the mycelial-mediated transfer of P. vortex to the far side. This suggests a role for swarming and/or flagella in the process. In a second approach, if the two organisms are co-inoculated farther away from the air gap, then the only way of getting to the target zone is for the P. vortex and A. fumigatus to cooperate. P. vortex move the fungal spores to the gap. Then the mycelia extend across the air gap and this allows the bacteria to reach the far side (Figure A11-8). So in this specific case, the two organisms mutually facilitate their dispersal. There is precedent for fungi assisting bacteria to spread: coswarming bacteria (different motile species that nevertheless aid each other’s spread) are known to be aided in spreading in a model system by fungal mycelia. This idea has been termed “fungal highways” by one group (Warmink and van Elsas, 2009). Fungal highways may have practical applications as well
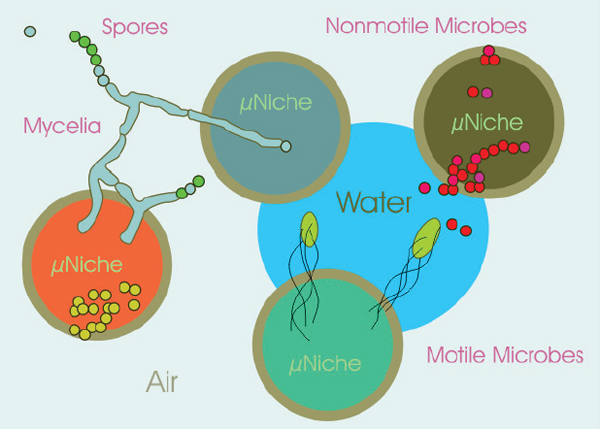
FIGURE A11-7 Simple diagram of soil composed of manifold microniches separated by barriers that include air gaps and aqueous environments. In many cases mycelial microorganisms, such as fungi, or airborne spores can traverse air gaps that are likely to be difficult to cross for other microbes.
as ecological importance, for example in giving bacteria involved in bioremediation greater access to contaminated soils (Furuno et al., 2009). In the latter case, a hydrocarbon-degrading strain, Pseudomonas putida NAH7, has been shown to travel along pseudomycelia of the filamentous fungus Pythium ultimum (Figure A11-9). Chemotaxis is implicated in this process (Furuno et al., 2009); a non-chemotactic derivative of P. putida was dispersed less effectively, suggesting that directed migration in response to chemical cues is a significant factor. Some of these data, including the current work, can be explained in several ways, including flagella-mediated attachment of cells to growing mycelia (Sen et al., 1996) and/or the mycelia allowing motility over terrain that is otherwise hard to cross. There is another interesting hint from the literature that connects swarming with fungi: the fungal toxin citrinin induces motility in Paenibacillus polymyxa (Park et al., 2008), but the significance of this observation is not clear.
Transporting cargo can be detrimental to the swarming bacteria. Figure A11-10 shows an experiment in which P. vortex is transporting spores of the actinomycete bacterium Streptomyces coelicolor, an antibiotic transporter. The antibiotics produced by the S. coelicolor inhibit the growth of the P. vortex. So it’s not always a good thing to let other microorganisms into your swarm.
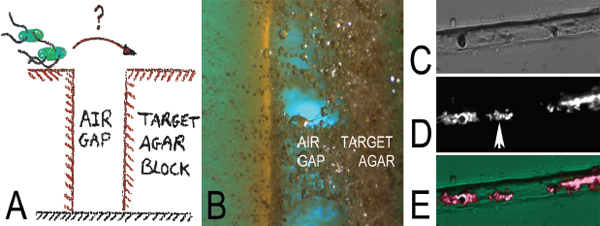
FIGURE A11-8 Dispersal of motile bacteria facilitated by fungal mycelia. (A) Simulating a 0.5-mm air gap using blocks of agar, posing a significant barrier for P. vortex to cross. (B) One possible solution. Air gap (0.5 mm across) created in a nutrient agar plate and successfully bridged by mycelia of A. fumigatus. The fungus was transported to the gap as conidia by P. vortex. In turn the mycelia permit the bacterium to traverse the gap. (C) to (E) Imaging a single mycelium traversing the air gap showing the presence of P. vortex: (C) light microscopy; (D) staining with hexidium iodide revealing bacteria (e.g., arrow) associated with the mycelia; (E) merged images (C) and (D).
SOURCE: Panel A: C. Ingham; Panels B-E: Adapted from Ingham et al. (2011).
Is there any specificity in the transporting process? To a limited extent, the answer is yes. Different conidia of about the same size can be moved to different degrees. If the surface of the conidia is stripped off, with either a strong protease or SDS, then the transport properties of the treated conidia differ from those of intact ones, suggesting that proteins displayed on the conidial surface matter. However, it is also clear that non-living objects such as microspheres can be transported. There is only limited information on the converse question: do all swarming bacteria transport objects? To date, Proteus mirabilis appears to be a poor transporter of micron-scale objects: attempts to show transport even over a few millimeters have failed. Cautiously, we may speculate that the territorial Proteus swarms tend toward monoculture in other ways than the Dienes line exclusion phenomenon, and they tend not to be very welcoming of other species.
P. vortex itself is a sporulating organism (Sirota-Madi et al., 2010), although spores are not formed during the course of the experiments described in this chapter. However, if exogenous spores purified from a starvation medium are loaded into a swarm these particles are also transported. Given the propensity of P. vortex to swarm into dangerous situations and get itself into trouble, it might make some sense, rather than producing the spores when things get tough, to have them already present in the swarming group.
To summarize the work so far, P. vortex is surprisingly good at moving micron-scale objects around. We have shown that it can move A. fumigatus conidia. It may be able to move conidia either to niches where airborne dispersal
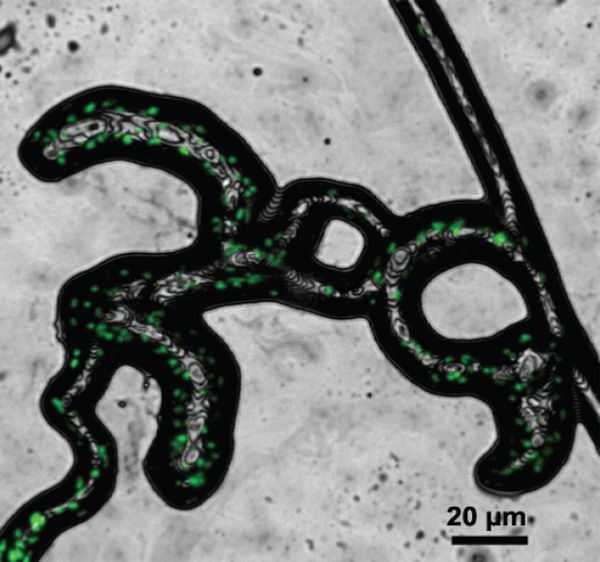
FIGURE A11-9 Example of dispersal of motile bacteria facilitated by fungal pseudomycelia mycelia. Confocal laser scanning microscopy of Pythium ultimum hyphae with associated Pseudomonas putida PpG7 bacteria on glass. The image series is shown as maximum intensity projection. Bacteria were first incubated 24 h with Syto 24 nucleic acid stain and then incubated for 4 h with the fungal hyphae. Take notice of the exclusive localisation of the bacteria next to the fungal hyphae. Colour allocation: green, Syto 24; white, reflection.
SOURCE: Courtesy of K. Pötzsch, T.R. Neu, and L.Y. Wick (UFZ, Germany) Provided by C. Ingham.
of this organism cannot reach, or possibly there are some biases where the Paenibacillus tends to end up in a particular environment, and if it brings along other organisms, then perhaps they benefit. There is also the possibility for rescue from an unfavorable environment, with spores taken to a more favorable location (the converse may also be true although may not be as important). Within the soil a moving colony (swarming) of P. vortex may well be a mixed ecosystem, with the potential to drop things off and have things jump on and thereby redistribute organisms over a centimeter scale in the soil. As noted, P. vortex can produce
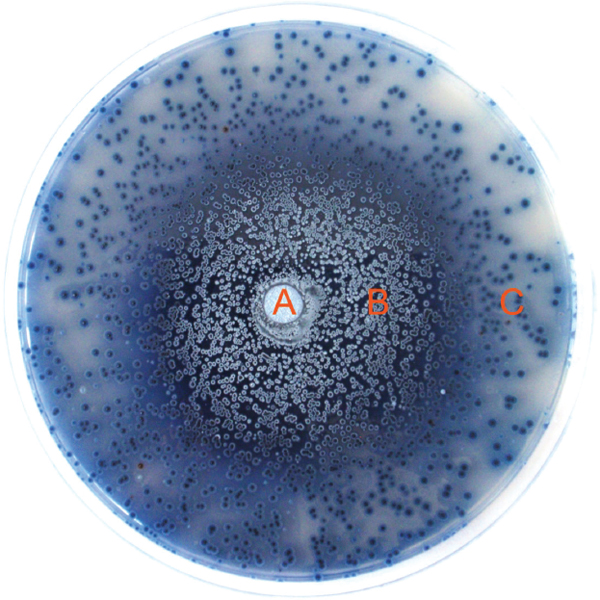
FIGURE A11-10 Dispersal of Streptomyces coelicolor spores facilitated by swarming P. vortex. Image of a 14 cm–diameter plate containing reduced-strength Mueller–Hinton agar co-inoculated with swarming P. vortex and spores of S. coelicolor at position A. The spores are transported; those within zone B have founded colonies that are producing aerial mycelia (white) whereas those at lower density toward the periphery of the plate (zone C) are not. The blue pigment is actinorhodin (and related molecules) produced by the S. coelicolor. Antimicrobial activity by S. coelicolor inhibits the growth of the P. vortex that are present across the plate at a low level but not visible. This process benefits the S. coelicolor, which is able to use P. vortex to disperse but can then outcompete the latter. Spores of S. coelicolor alone cannot disperse.
extended and intricately patterned colonies on agar. In some cases these colonies can be kept motile for several days with a continual traffic system of motile and continuously redistributing bacteria. If a rifampicin-resistant mutant of P. vortex is fed into one part of such a colony of a rifampicin-sensitive strain, rifampicin-resistant progeny can be recovered in other parts of the colony. The degree of connectivity, implied by a P. vortex colony acting as an extended transport network, suggests the possibility that a bacterial logistics system can be created on a 10 cm scale. It will be interesting to explore this and ask what happens when a nitrogen source is in a different location to the carbon source—i.e., is there any logistical benefit to this form of colonial life? Microbial logistics systems, the capability of extended colonies to optimise nutrients over a significant area, are known to be advantageous in fungi and slime moulds (Physarum polycephalum). Quite complicated problems in resource utilization can be solved by slime moulds forming dendritic networks (Nakagaki et al., 2000). There is also interest in using microbial networks in the design of miniaturized devices (Kaehr and Shear, 2009), and adaptive pattern-forming bacteria with the ability to transport micron-scale components may make a contribution.
Future Prospects
One line of future research is to create positive selection systems so that the cargo organism pretty much has no choice but to be carried and to associate with the P. vortex. There is also a strong need for more realistic soil models and some understanding of how swarming and transport works in the soil. Given the amazing recent developments in low-cost and robust sensors and tracking systems, this should be achievable, and maybe we can then understand more about the spread of microorganisms in natural situations. Screening for cargo organisms from the soil—pulling organisms out of the soil and seeing how they partner with P. vortex—may also be fruitful. A spore display library with a wide range of polypeptides expressed on the surfaces of spores could be used to define preferred cargoes. Because P. vortex is currently not amenable to genetic analysis, it may be necessary to exploit the genetics of a partner organism to try to understand transport at a deeper level.
Conclusions
Motile microorganisms can exert physical force and move objects on the micron scale. Specifically, the swarming bacterium Paenibacillus vortex can collectively transport conidia of the non-motile fungus Aspergillus fumigatus. The significance and ecological impact of microbial transport is unknown although there are scenarios in which the benefit appears reciprocal. However, this suggests a new dispersal mechanism for non-motile microorganisms with possible benefits for both transporting and cargo organisms. More broadly, the role and
importance of swarming and other mass migrations undertaken by bacteria within the environment are poorly understood. One lesson from recent years is that while swarming bacteria have usually been studied in monoculture, such organisms reveal their most interesting characteristics when in conflict or cooperation with other microorganisms. Swarmers, at least in some cases, may be best thought of as a traveling ecosystem.
Acknowledgments
Thanks to Eshel Ben Jacob and his group for collaborating over many years. Thanks to Joëlle Dupont, Rolf Geisen, Peter Schneeberger, and Amir Sharon for strains of fungi and advice on fungal culture. Dennis Claessen and Lubbert Dijkhuizen contributed Streptomyces coelicolor strains and Adriaan van Aelst assisted with electron microscopy. The financial support of HEALTHF3-2011-282004 (EVOTAR) from the European Union is acknowledged.
References
Ben-Jacob, E., O. Schochet, A. Tenenbaum, I. Cohen, A. Czirók, and T. Vicsek. 1994. Generic modelling of cooperative growth patterns in bacterial colonies. Nature 368:46-49.
Ben-Jacob, E., I. Cohen, I. Golding, D. L. Gutnick, M. Tcherpakov, D. Helbing, and I. G. Ron. 2000. Bacterial cooperative organization under antibiotic stress. Physica A 282:247-282.
Brock, D. A., T. E. Douglas, D. C. Queller, and J. E. Strassmann. 2011. Primitive agriculture in a social amoeba. Nature 469:393-398.
Budding, A. E., C. J. Ingham, W. Bitter, C. M. Vandenbroucke-Grauls, and P. M. Schneeberger. 2009. The Dienes phenomenon: Competition and territoriality in swarming Proteus mirabilis. Journal of Bacteriology 191:3892-3900.
Budi, S. W., D. van Tuinen, G. Martinotti, and S. Gianinazzi. 2000. Isolation from the Sorghum bicolor mycorrhizosphere of a bacterium compatible with arbuscular mycorrhiza development and antagonistic towards soil-borne fungal pathogens. Applied and Environmental Microbiology 65:5148-5150.
Butler, M. T., Q. Wang, and R. M. Harshey. 2010. Cell density and mobility protect swarming bacteria against antibiotics. Proceedings of the National Academy of Sciences of the United States of America 107:3776-3781.
Campbell, C. K. 1971. Fine structure and physiology of conidial germination in Aspergillus fumigatus. Transactions of the British Mycological Society 57:393-402.
Chryssanthou, E., A. Loebig, and J. Sjölin. 2008. Post-antifungal effect of amphotericin B and voriconazole against germinated Aspergillus fumigatus conidia. Journal of Antimicrobial Chemotherapy 61:1309-1311.
Darnton, N., L. Turner, K. Breuer, and H. C. Berg. 2004. Moving fluid with bacterial carpet. Biophysical Journal 86:1863-1870.
Di Leonardo, R., L. Angelani, D. Dell’arciprete, G. Ruocco, V. Lebba, S. Schippa, M. P. Conte, F. Mecarini, F. De Angelis, E. Di Fabrizio. 2010. Proceedings of the National Academy of Sciences of the United States of America 107:9541-9545.
Dienes, L. 1946. Reproductive processes in Proteus cultures. Proceedings of the Society for Experimental Biology and Medicine 63:265-270.
Dienes, L. 1947. Further observations on the reproduction of bacilli from large bodies in Proteus cultures. Proceedings of the Society for Experimental Biology and Medicine 66:97-98.
Dijksterhuis, J., M. Sanders, L. G. Gorris, and E. J. Smid. 1999. Antibiosis plays a role in the context of direct interaction during antagonism of Paenibacillus polymyxa towards Fusarium oxysporum. Journal of Applied Microbiology 86:13-21.
Furuno, S., K. Pazolt, C. Rabe, T. R. Neu, H. Harms, and L. Y. Wick. 2009. Fungal mycelia allow chemotactic dispersal of polycyclic aromatic hydrocarbon-degrading bacteria in water-unsaturated systems. Environmental Microbiology 12:1391-1398.
Galperin, M. Y. 2005. A census of membrane-bound and intracellular signal transduction proteins in bacteria: Bacterial IQ, extroverts and introverts. BMC Microbiology 5:35-54.
Gibbs, K. A., M. L. Urbanowski, and E. P. Greenberg. 2008. Genetic determinants of self-identity and social recognition in bacteria. Science 321:256-259.
Gibbs, K. A., L. M. Wenren, and E. P. Greenberg. 2011. Identity gene expression in Proteus mirabilis. Journal of Bacteriology 193(13):3286-3292.
Halloy, J., G. Sempo, G. Caprari, C. Rivault, M. Asadpour, F. Tâche, I. Saïd, V. Durie, S. Canonge, J. M. Amé, C. Detrain, N. Correll, A. Martinoli, F. Mondada, R. Siegwart, and J. L. Deneubourg. 2007. Social integration of robots into groups of cockroaches to control self-organized choices. Science 318:1155-1158.
Harshey, R. M. 2003. Bacterial motility on surfaces: Many ways to a common goal. Annual Review of Microbiology 57:249-273.
Henrichsen, J. 1972. Bacterial surface translocation: A survey and classification. Bacteriological Reviews 36:478-505.
Hildebrandt, U., F. Ouziad, F. J. Marner, and H. Bothe. 2006. The bacterium Paenibacillus validus stimulates growth of the arbuscular mycorrhizal fungus Glomus intraradices up to the formation of fertile spores. FEMS Microbiol Letters 254:258-267.
Hiratsuka, Y., M. Miyata, T. Tada, and T. Q. P. Uyeda. 2006. A microrotary motor powered by bacteria. Proceedings of the National Academy of Sciences of the United States of America 103:13618-13623.
Ingham, C. J., and E. Ben-Jacob. 2008. Swarming and complex pattern formation in Paenibacillus vortex studied by imaging and tracking cells. BMC Microbiology 8:36.
Ingham, C. J., O. Kalisman, A. Finkelstein, and E. Ben Jacob. 2011. Mutually facilitated dispersal between the nonmotile fungus Aspergillus fumigatus and the swarming bacterium Paenibacillus vortex. Proceedings of the National Academy of Sciences of the United States of America 108:19731-19736.
Kaehr, B., and J. B. Shear. 2009. High-throughput design of microfluidics based on directed bacterial motility. Lab on a Chip 9:2632-2637.
Kearns, D. B. 2010. A field guide to bacterial swarming motility. Nature Reviews Microbiology 8(9):634-644.
Komoto, A., K. Hanaki, S. Maenosono, J. Y. Wakano, Y. Yamaguchi, and K. Yamamoto. 2003. Growth dynamics of Bacillus circulans colony. Journal of Theoretical Biology 225:91-97.
Liaw, S. J., H. C. Lai, S. W. Ho, K. T. Luh, and W. B. Wang. 2000. Inhibition of virulence factor expression and swarming differentiation in Proteus mirabilis by p-nitrophenylglycerol. Journal of Medical Microbiology 49:725-731.
Matsuyama, T., and M. Matsushita. 1992. Self-similar colony morphogenesis by Gram-negative rods as the experimental model of fractal growth by a cell population. Applied and Environmental Microbiology 58:1227-1232.
Nagarajan, S., and D. V. Singh. 1990. Long-distance dispersion of rust pathogens. Annual Review of Phytopathology 28:139-153.
Nakagaki, T., H. Yamada, and A. Toth. 2000. Maze-solving by an amoeboid organism. Nature 407:470.
Nazir, R., J. A. Warmink, H. Boersma, and J. D. van Elsas. 2010. Mechanisms that promote bacterial fitness in fungal-affected soil microhabitats. FEMS Microbiology Ecology 71:169-185.
Nierman, W. C., A. Pain, M. J. Anderson, J. R. Wortman, H. S. Kim, J. Arroyo, M. Berriman, K. Abe, D. B. Archer, C. Bermejo, et al. 2005. Genomic sequence of the pathogenic and allergenic filamentous fungus Aspergillus fumigatus. Nature 438:1151-1156.
Ohgiwari, M., M. Mitsuge, and M. Tohey. 1992. Morphological changes in growth of bacterial colony patterns. Journal of the Physical Society of Japan 61:816-822.
Park, S.-Y., R. Kim, C. M. Ryu, S. K. Choi, C. H. Lee, J. G. Kim, and S. H. Park. 2008. Citrinin, a mycotoxin from Penicillium citrinum, plays a role in inducing motility of Paenibacillus polymyxa. FEMS Microbiology Ecology 65:229-237.
Raguso, R. A., and B. A. Roy. 1998. ‘Floral’ scent production by Puccinia rust fungi that mimic flowers. Molecular Ecology 7:1127-1136.
Rowbotham, T. J. 1980. Preliminary report on the pathogenicity of Legionella pneumophila for freshwater and soil amoeba. Journal of Clinical Pathology 33:1179-1183.
Sen, R., E. L. Nurmiaho-Lassila, K. Haahtela, and T. Korhonen. 1996. Specificity and mode of primary attachment of Pseudomonas fluorescens strains to the cell walls of ectomycorrhizal fungi. In 4th European Symposium on Mycorrhizae. Mycorrhizas in Integrated Systems from Genes to Plant Development, edited by C. Azcon-Aguilar and J. M. Barea, pp. 661-664. Granada, Spain: European Commission.
Shapiro, J. 1998. Thinking about bacterial populations as multicellular organisms. Annual Review of Microbiology 52:81-104.
Sirota-Madi, A., T. Olender, Y. Helman, C. Ingham, I. Brainis, D. Roth, E. Hagi, L. Brodsky, D. Leshkowitz, V. Galatenko, V. Nikolaev, R. C. Mugasimangalam, S. Bransburg-Zabary, D. L. Gutnick, D. Lancet, and E. Ben-Jacob. 2010. Complete genome of the pattern forming Paenibacillus vortex reveals potential for thriving in complex environments. BMC Genomics 11:710.
Thar, R., and M. Kühl. 2005. Complex pattern formation of marine gradient bacteria explained by a simple computer model. FEMS Microbiology Letters 246:75-79.
Van Leeuwen, M. R., T. M. Van Doorn, E. A. Golovina, J. Stark, and J. Dijksterhuis. 2010. Water- and air-distributed conidia differ in sterol content and cytoplasmic microviscosity. Applied and Environmental Microbiology 76:366-369.
Velicer, G. J., L. Kroos, and R. E. Lenski. 1998. Loss of social behaviors by Myxococcus xanthus during evolution in an unstructured habitat. Proceedings of the National Academy of Sciences of the United States of America 95:12376-12380.
Verweij, P. E., E. Mellado, and W. J. Melchers. 2007. Multiple-triazole-resistant aspergillosis. New England Journal of Medicine 356:1481-1483.
Warmink, J. A., and J. D. van Elsas. 2009. Migratory response of soil bacteria to Lyophyllum sp. strain Karsten in soil microcosms. Applied and Environmental Microbiology 75:2820-2830.
Weibel, D. B., P. Garstecki, D. Ryan, W. R. DiLuzio, M. Mayer, J. E. Seto, and G. M. Whitesides. 2005. Microorganisms to move microscale loads. Proceedings of the National Academy of Sciences of the United States of America 102:11963-11967.
Xavier, J. B., W. Kim, and K. R. Foster. 2011. A molecular mechanism that stabilizes cooperative secretions in Pseudomonas aeruginosa. Molecular Microbiology 79:166-179.
Xinning Zhang48,49and Jared R. Leadbetter48,50
Abstract
Termites and their gut microbes engage in fascinating dietary mutualisms. Less is known about how these complex symbioses have evolved after first emerging in an insect ancestor over 120 Mya. Here, we examined a key bacterial gene of the mutualism, formate dehydrogenase (fdhF), in 8 species of “higher” termite (Termitidae; the youngest, most biomass-abundant, and species-rich termite family). Patterns of fdhF diversity in the gut communities of higher termites contrasted strongly with patterns in less-derived insect relatives (wood-feeding “lower” termites and roaches). We observed phylogenetic evidence for (1) the sweeping loss of several clades of fdhF that may reflect extinctions of symbiotic protozoa and, importantly, bacteria dependent on them, in the last common ancestor of all higher termites and (2) a radiation of genes from the (possibly) single allele that survived. Sweeping gene loss also resulted in (3) the elimination of an entire clade of genes encoding selenium-independent enzymes from higher termite gut communities, perhaps reflecting behavioral or morphological innovations in higher termites that relaxed pre-existing environmental limitations of selenium (Se), a dietary trace element. Curiously, several higher termite gut communities may have subsequently re-encountered Se-limitation, (4) reinventing genes for Se-independent proteins via convergent evolution. Lastly, (5) the presence of a novel fdhF lineage within litter-feeding and subterranean higher (but not other) termites may indicate recent gene “invasion” events. These results imply that cascades of perturbation and adaptation by distinct evolutionary
___________
48 Environmental Science & Engineering, Mail code 100-23, California Institute of Technology, Pasadena, CA 91125.
49 Present address: Department of Geosciences, Guyot Hall, Princeton University, Princeton, NJ 08544.
50Corresponding author: J. R. Leadbetter, Phone: (626) 395-4182, Fax: (626) 395-2940, Email: jleadbetter@caltech.edu.
Originally printed as Zhang X, Leadbetter JR. 2012. Evidence for cascades of perturbation and adaptation in the metabolic genes of higher termite gut symbionts. mBio 3(4):e00223-12. doi:10.1128/mBio.00223-12.
mechanisms have impacted the evolution of complex microbial communities in a highly successful lineage of insects.
Author Summary
Since patterns of relatedness between termite hosts are broadly mirrored by the relatedness of their symbiotic gut microbiota, co-evolution between hosts and gut symbionts is rightly considered as an important force shaping dietary mutualism since its inception over 120 Mya. Apart from lateral gene or symbiont transfer between termite gut communities (for which no evidence yet exists), there has been little discussion of alternative mechanisms impacting the evolution of mutualism. Here, we provide strong gene-based evidence for past environmental perturbations creating significant upheavals that continue to reverberate throughout the gut communities of species comprising a single termite lineage. We suggest that symbiont extinction events, sweeping gene losses, evolutionary radiations, relaxation and re-emergence of key nutritional pressures, convergent evolution of similar traits, and recent gene invasions have all shaped gene composition in the symbiotic gut microbial communities of higher termites, currently the most dominant and successful termite family on Earth.
Introduction
Identifying factors associated with changing genetic diversity in natural microbial populations is crucial for understanding past and present ecology. Host-associated microbial populations have garnered much interest, as principles of evolution uncovered in the context of host-microbe interactions have wide-ranging applications (e.g. human health, animal development, agriculture) (Dethlefsen et al., 2007; McFall-Ngai, 2002; Van Wees et al., 2008). In particular, studies of animal-microbe mutualism have revealed that microbial symbionts exert an important selective force for evolution in their eukaryotic hosts (Van Wees et al., 2008). Equally intriguing are the pressures that symbiosis imparts on the evolution of the hosts’ microbial counterparts.
Many evolutionary studies on microbial symbiosis have explored the highly intimate mutualisms existing between insects and the microbial endosymbionts that live inside host insect cells (e.g., aphid–Buchnera, tsetse fly–Wigglesworthia) (Chen et al., 1999; Moran and Baumann, 2000; Moran and Telang, 1998). These nutritional symbioses are obligate and characterized by low species complexity (typically 1 symbiont species is present) (Bauman et al., 2006; Buchner, 1965; Wu et al., 2006). As such they have been useful model systems for identifying the major evolutionary consequences of symbiosis in the microbial partners of mutualism: cospeciation with the host, genome reduction, low genomic GC content, and accelerated sequence evolution (Mira et al., 2001; Moran, 2002; Moran et al., 2009; Shigenobu et al., 200; Wernegreen, 2002). However, such studies have
limited potential for revealing the consequences of symbiosis between animal hosts and their extracellular symbionts, a category including gut tract microbes. As these symbioses can involve multiple microbial partners functioning as a “community bioreactor” to effect health or disease in their host, determining how interactions between different symbiont species have evolved is necessary to understanding host-symbiont synergisms.
The obligate nutritional mutualism occurring between wood-feeding termites and their specific and complex hindgut microbiota offers an enticing subject for studies of evolutionary themes in polymicrobial, extracellular symbiont communities. Remarkably, mutualism, which underpins the insect’s ability to access lignocellulose as a food source, predates the evolution of termites from their wood-feeding roach ancestors over 120 mya (Grimaldi and Engel, 2005). Similar to endosymbioses, this long-term association has been facilitated by symbiont transfer between host generations (Nalepa and Bandi, 2000), allowing co-evolution between hosts and the symbiont community. Co-speciation as an evolutionary theme has indeed emerged over the past decade (e.g. Berlanga et al., 2007; Brune and Stingl, 2006; Desai et al., 2010; Hongoh et al., 2005; Lo and Eggleton, 2011; Noda et al., 2007; Ohkuma et al., 2009) however factors like diet, gut anatomy, and geography are also potential determinants of gene diversity in gut communities. Compared to endosymbionts, gut symbionts are exposed to considerably more environmental influence as food and environmental microbes continually pass through the gut tract. Under certain conditions, these microbes may establish as new symbionts or may horizontally transfer their genes to pre-existing symbionts. Thus termites and their rich diversity of gut microbial partners, which can number over 300 bacterial phylotypes (Hongo et al., 2003; Yang et al., 2005), provide exceptional opportunities for studying factors affecting evolution in symbiont communities.
Comparing symbiont genes in a wide range of termite host species is one way to learn about factors influencing symbiont evolution. Previously, we applied this comparative approach to symbiont metabolic genes encoding hydrogenase-linked formate dehydrogenase (fdhF), important for CO2 reductive acetogenesis, a key mutualistic process in lignocellulose degradation (Breznak and Switzer, 1986; Odelson and Breznak, 1983). In all wood-feeding termites and roaches, CO2 reductive acetogenesis is the major means of recycling the energy rich H2 derived from wood-polysaccharide fermentations into acetate, the insect’s primary fuel source (Brauman et al., 1992; Pester and Brune, 2007). Study of fdhF in evolutionary less derived wood-feeding insects (the so-called “lower” termites and their wood-feeding roach relatives) implied that the trace element selenium shaped the gene content of gut symbionts since termites diversified from roaches~150 Mya (Grimaldi and Engel, 2005). More broadly, results suggested that within related insects hosts that feature the same type of gut tract architecture, similar gut communities and diets, acetogenic symbionts as a metabolic subgroup of the greater gut community have maintained remarkably similar strategies to deal with changes in a
key nutrient. But how have these symbionts (more precisely, how have their genes) responded to drastic changes in the termite gut, for example to major alterations in gut tract architecture and to restructuring of the gut community itself?
To address this question, a comparison of fdhF genes present in extant insects possessing gut communities representing the “before” and “after” snapshots of drastic change is needed. The gut communities of lower termites represent the “before” condition. Gut communities in higher termites, which form the most recently evolved termite lineage (Termitidae), represent the “after” snapshot (Eggleton, 2006). Higher termites are known for highly segmented gut tracts and their lack of symbiotic gut protozoa (Brugerolle and Radek, 2006), the primary sources of H2 within the guts of earlier evolved wood-feeding insects. Gut segmentation and the extinction of lignocellulose-fermenting protozoa are events that are thought to have occurred early during the emergence of this lineage, possibly in the late cretaceous (80 Mya) to early cenozoic (50 Mya) (Grimaldi and Engel, 2005). Since then, higher termites with their gut symbionts have found ways to access polysaccharides bound in forms other than wood (e.g., dry grass, leaf litter, organic compounds in soil) and have become the most abundant and diverse termite group on Earth.
Here we investigate whether the dramatic shifts in termite biology and microbiology marking the diversification of higher termites into their extant forms left impacts on the H2-consuming symbiont community. To accomplish this we analyzed the phylogeny of fdhF from the symbiotic gut communities of 8 higher termite species. The specimens belonged to Nasutiterminae and Termitinae subfamilies, the two most numerically abundant and species-rich subfamilies within Termitidae (generally recognized as comprising four subfamilies (Grimaldi and Engel, 2005; Eggleton et al., 1996; Engel et al., 2009; Kambhampati and Eggleton, 2000) and were sampled from rainforest, beach, and desert environments in Central America and the Southwestern United States. We compared higher termite fdhF sequences to each other and to previous data from less-derived wood-feeding insects. Our results indicate the H2-consuming bacterial community in higher termites experienced early evolutionary extinctions, possibly due to extinction of H2-producing protozoa, followed by evolutionary radiation, convergent evolution, and even invasion. The latter three outcomes may have been influenced by trace element bioavailability. Together, the data provide a clear example of an extinction propagating through a chain of microbial mutualism, emphasizing the connectivity of symbiosis involving complex extracellular microbial communities such as those in the termite gut.
Results and Discussion
To profile fdhF in the whole gut microbial communities of higher termites with different species affiliations (Figure A12-1), habitats and lifestyles, we constructed fdhF gene inventories (30-107 clones per species, total 684) from the whole gut tracts of six higher termite species from Costa Rica and two higher termite species from California (Table A12-1). The broader taxonomic affiliations
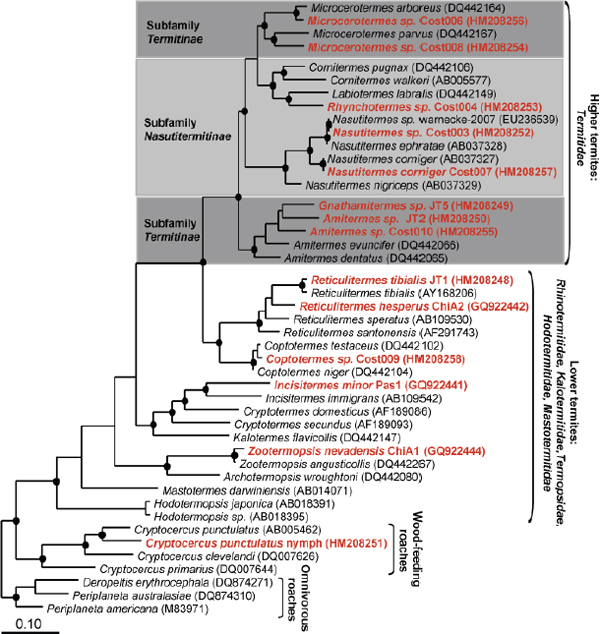
FIGURE A12-1 Mitochondrial cytochrome oxidase II (COII) phylogeny of termites and related roaches. Family names and other descriptions are located on the right side of the tree. Only two of four subfamilies (Macrotermitinae, Apicotermitinae, Nasutitermitinae, and Termitinae) in the higher termite family Termitidae are shown. Subfamily Termitinae is paraphyletic (Kambhamti and Eggleton, 2000). The gut communities of insect species highlighted in red have been examined for fdhF using inventory and/or PCR screening techniques. Tree was constructed with 393 aligned nucleotides using the maximum likelihood phylogenetic algorithm AxML (Stamatakis et al., 2004). Filled circles at nodes indicate support from PHYML, parsimony (Phylip DNAPARS), and Fitch distance methods. Scale bar corresponds to 0.1 nucleotide changes per alignment position.
TABLE A12-1 Characteristics of Higher Termites Examined in this Study
| Insect | Family (Subfam.)1 | Nest, Collec.2 | Ecosystem3 | Food4 | Soil5 |
| Nasutitermes sp. Cost003 | Termitidae (Nasutitermitinae) | Arboreal, Forest (CR) | Premontane-wet rainforest transition | wood | low |
| Nasutitermes corniger Cost007 | Termitidae (Nasutitermitinae) | Arboreal, Forest-beach transition (CR) | Lowland moist forest | palm | low |
| Rhynchotermes sp. Cost004 | Termitidae (Nasutitermitinae) | Arboreal, Forest (CR) | Premontane-wet rainforest transition | leaf-litter | med |
| Microcerotermes sp. Cost006 | Termitidae (Termitinae) | Arboreal, Forest-beach transition (CR) | Lowland moist forest | palm | low |
| Microcerotermes sp. Cost008 | Termitidae (Termitinae) | Arboreal, Forest-beach transition (CR) | Lowland moist forest | palm | low |
| Amitermes sp. Cost010 | Termitidae (Termitinae6) | Subterranean, root zone (CR) | Premontane wet forest | roots/soil | high |
| Amitermes sp. JT2 | Termitidae (Termitinae6) | Subterranean galleries, desert (JT) | Warm temperate desert | dry grass/soil | high |
| Gnathamitermes sp. JT5 | Termitidae (Termitinae6) | Subterranean galleries, desert (JT) | Warm temperate desert | dry grass/ Yucca/soil | high |
1 Termite family classifications were based on refs (Grimaldi and Engel, 2005; Miyata et al., 2007).
2 Nest type, Collection site. CR = Costa Rica, JT= Joshua Tree, CA.
3 Ecosystem. Terminology is based on the Holdridge life zone classification of land areas (Holdridge et al., 1971). Life zone categories for collection sites are based on maps in Holdridge et al. (Holdridge et al., 1971) and Enquist (2002).
4 Possible food source based on vegetation near collection location, insect trails, and/or laboratory feeding studies.
5 Predicted level of soil exposure based on nest location (subterranean or above ground), food substrate, and foraging style.
6 It is unclear whether Amitermes sp. affiliate within the subfamily Termitinae or rather constitute their own subfamily.
for higher termite specimens are indicated in a schematic termite cladogram (Figure A12-2). Multiple genotypes (8 to 59) and phylotypes (4 to 12 operational taxonomic units, or OTUs, at 97% protein sequence similarity cutoff) were recovered from the guts of each termite sample (Table A12-2). This represents significantly more diversity than that discovered by metagenomic analysis of a wood-feeding higher termite’s gut microbiota (Warnecke et al., 2007). In total, 62 novel FDHH OTUs were documented in higher termites. To stringently estimate sampling completeness we compared the number of observed OTUs to that predicted by the 95% higher confidence interval for mean Chao1 (Table A12-2), calculated using EstimateS (Colwell, 2009). On average, 4.9 + 4.5 (1 stdev) more OTUs were missing per inventory. However, by comparing the observed number of OTUs with mean Chao1 values, on average less than 1 OTU remained undiscovered per inventory.
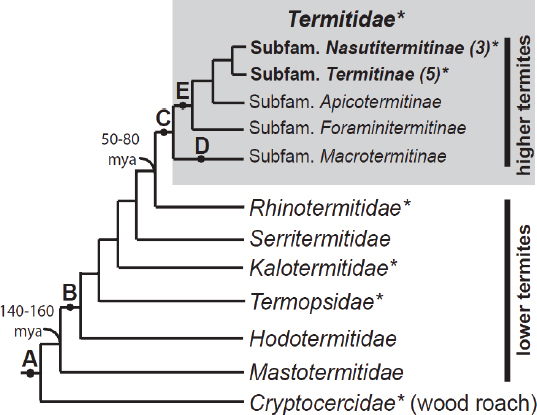
FIGURE A12-2 Schematic cladogram of major termite families and higher termite subfamilies showing major events in gut habitat evolution. Key events are A: hindgut fermentation of lignocellulose; B: loss of Blattabacterium fat body endosymbionts; C: loss of mutualistic gut protists; D: mutualism with Termitomyces fungus; E: diverse feeding habits (e.g., soil feeding) developed. Estimated timing for the divergence of termites from wood-roaches and higher from lower termites are indicated. Family and subfamily associations of higher termites examined in this study are in bold. Number of species examined in parentheses. This study analyzes gut community fdhF in insect groups marked by asterisks. Adapted from (Grimaldi and Engel, 2005; Eggleton et al., 1996).
TABLE A12-2 fdhF Inventories Constructed in this Study
| Source insect | Inventory1 | No. clones | No. genotypes | No. OTU2 | Mean Chao1 (SD)3 | 95% LCI, HCI Chao14 | Total No. Genotypes5 | Total No. OTUs 5 |
| Nasutitermes sp. Cost003 | 3L1 | 87 | 20 | 4 | 3.4 (0.1) | 3.4, 3.4 | 376 | 66 |
| Nasutitermes sp. Cost003 | 3L2 | 17 | 177 | 4 | 3.9 (1.3) | 3.3, 10.5 | ||
| Nasutitermes corniger Cost007 | 7L1 | 30 | 19 | 8 | 7.3 (1.1) | 6.8, 12.7 | 19 | 8 |
| Rhynchotermes sp. Cost004 | 4L1 | 85 | 37 | 10 | 9.4 (0.6) | 9.2, 12.0 | 596 | 126 |
| Rhynchotermes sp. Cost004 | 4L2 | 22 | 227 | 8 | 8.3 (3.4) | 6.5, 25.8 | ||
| Microcerotermes sp. Cost006 | 6L1 | 74 | 8 | 6 | 5.3 (0.9) | 5.0, 9.8 | 8 | 6 |
| Microcerotermes sp. Cost008 | 8L1 | 84 | 10 | 4 | 4.0 (0.01) | 4.0, 4.0 | 10 | 4 |
| Amitermes sp. Cost010 | 10L1 | 78 | 28 | 7 | 6.4 (0.9) | 6.1, 10.9 | 506 | 106 |
| Amitermes sp. Cost010 | 10L2 | 22 | 227 | 7 | 8.1 (2.9) | 6.3, 21.4 | ||
| Amitermes sp. JT2 | Jt2L1 | 101 | 18 | 8 | 7.4 (0.9) | 7.1, 11.4 | 18 | 8 |
| Gnathamitermes sp. JT5 | Jt5L1 | 84 | 30 | 9 | 8.8 (0.5) | 8.7, 10.6 | 30 | 9 |
1 Inventory abbreviation. Two libraries were constructed for each of the following templates: Cost003, Cost004, and Cost010. These differ most significantly in PCR annealing temperature (details in Table A11-4).
2 Number of operational taxonomic units (OTUs) defined at 97% amino acid similarity; calculated using Phylip Distance Matrix (Jones-Taylor-Thorton correction) and DOTUR (Matson et al., 2007).
3 Mean of the diversity estimator Chao1 (SD, standard deviation) calculated using EstimateS (Eggleton et al., 1996).
4 Lower (LCI) and higher (HCI) 95% confidence intervals for mean Chao1.
5 Number of unique genotypes/OTUs recovered from each insect species. OTU distributions are found in Table A11-5.
6 Based on combined L1 and L2 libraries.
7 All clones were sequenced, rather than being presorted by RFLP typing prior to sequencing. Each sequence was unique at the DNA level.
Broad Scale Diversity of Higher Termite fdhF
Our previous studies of fdhF (Matson et al., 2010; Zhang et al., 2011) have shown that hydrogenase-linked formate dehydrogenase enzymes (FDHH, EC1.2.1.2, encoded by enteric γ-Proteobacteria, Spirochaetes, Firmicutes) are widespread in the guts of lower termites and wood-roaches. Almost all fdhF recovered from these insects grouped most closely with genes from the termite gut acetogenic spirochete isolate, Treponema primitia, earning that phylogenetic clade the name “Gut Spirochete Group.” To determine the relationship between higher termite fdhF and previously published sequences (and to guide detailed phylogenetic analyses), we constructed a phylogenetic “guide” tree (Figure A12-3) based on 542 aligned amino acids in FDHH, the catalytic subunit responsible for CO2 reduction/formate oxidation in formate hydrogen lyase complexes (Zinoni et al., 1986).
Based on 3 tree construction methods (maximum likelihood, parsimony, and distance), higher termite sequences consistently clustered into 4 major clades (labeled A–D in Figure A12-3). Sequences from higher termites with diets likely consisting of lignocellulosic substrates such as wood, palm, and dried-grass predominantly (74-100%, Table A12-3) grouped into the Gut Spirochete Group (clade A, Figure A12-3). Similar to other environmental sequences in the Gut Spirochete Group, higher termite sequences (37 phylotypes) most probably belong to uncultured acetogenic spirochetes. The presence of a diagnostic amino acid character uniquely shared amongst Gut spirochete group sequences supported this phylogenetic inference (Zhang et al., 2011). Interestingly, sequences from litter-feeding and subterranean higher termites (8-51%, Table A12-3) formed a novel cluster, designated as the “AGR group” for Amitermes-Gnathamitermes Rhynchotermes (clade B, 17 phylotypes, Figure A12-3). Relatively few sequences (0-18%, Table A12-3) affiliated with clade C in Figure A12-3 (5 phylotypes), a group defined by proteobacterial sequences, and accordingly named the “Proteobacteria Group.” Clade D in Figure A12-3 (3 phylotypes) was the least represented in inventories (0-7%, Table A12-3) and (like the AGR group) lacked pure culture representatives. This clade was named the“UnHT Group” for unclassified higher termite.
Genetic Extinction and Evolutionary Radiation Within Higher Termite Gut Communities
As higher termite sequences predominantly clustered into the Gut Spirochete Group, we performed a phylogenetic analysis using 3 different treeing methods that focused on Gut Spirochete Group sequences (Figure A12-4). Unexpectedly, every higher termite sequence in this major clade group fell into a single sub-clade, the “Higher Termite Spirochete” clade. This stood in striking contrast to our prior observations that fdhF from lower termites and wood-roaches tend to form multiple, deeply branching but interspersed clades throughout the Gut
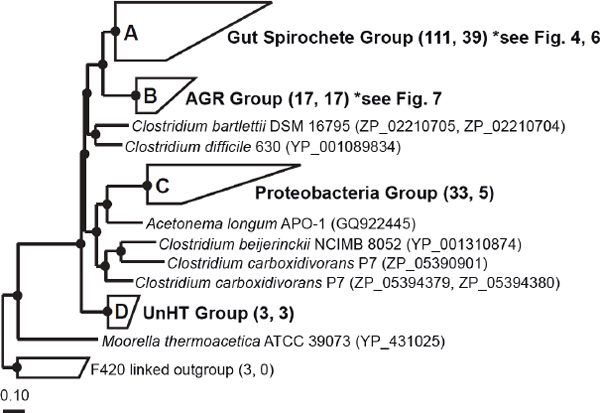
FIGURE A12-3 Protein phylogeny of hydrogenase-linked formate dehydrogenases (FDHH). Sequences from the gut microbial communities of higher termites, lower termites, wood-feeding roaches, and pure microbial cultures form four major clades (A, B, C, D). Numbers in parentheses next to grouped clades denote the total number of sequences within a clade and the number of sequences recovered from higher termites. Tree was constructed with 542 ClustalW-aligned amino acids (Matson et al., 2007) and Phylip PROML (Ludwig et al., 2004) within the ARB software environment (Miura et al., 1998). A metagenomic sequence (IMG gene object identity no. 2004163507) from a Nasutitermes higher termite (Brugerolle and Radek, 2006) was added in by parsimony (253 amino acids); this fragment affiliates with the “Gut spirochete group” (clade A). Filled circles indicate nodes supported by maximum likelihood, parsimony (PROTPARS, >60 of 100 bootstrap resamplings), and distance (Fitch) tree construction methods. The tree was outgrouped with F420-linked FDH from methanogenic Archaea (Genbank accession no. P6119, CAF29694, ABR54514). Scale bar indicates 0.1 amino acid changes per alignment position. Accession numbers for sequences comprising grouped clades are in Table A12-6.
Spirochete Group. These results indicate that a large swath of fdhF diversity previously present in the guts of lower termite-like ancestors was lost from gut communities during higher termite evolution, consistent with a genetic bottleneck in the fdhF gene pool.
To substantiate phylogenetic observations of genetic bottlenecking and the accompanying hypothesis of gene extinction during higher termite gut community evolution, we assayed higher termite guts for the presence of “Cys clade” fdhF, a major phylogenetic group which comprised roughly half of all fdhF
TABLE A12-3 Distribution of Higher Termite Inventory Sequences amongst Four Major FDHH Clades (Figure A12-3)
| Source insect (number of clones) | Gut spirochete | AGR | Proteobacteria | UnHT |
| Nasutitermes sp. Cost0031 (104) | 99 | 0 | 0 | 1 |
| Nasutitermes corniger Cost007 (30) | 86 | 0 | 7 | 7 |
| Rhynchotermes sp. Cost0041 (107) | 47 | 51 | 2 | 0 |
| Microcerotermes sp. Cost006 (74) | 96 | 0 | 4 | 0 |
| Microcerotermes sp. Cost008 (84) | 100 | 0 | 0 | 0 |
| Amitermes sp. Cost0101 (100) | 85 | 13 | 0 | 2 |
| Amitermes sp. JT2 (101) | 92 | 8 | 0 | 0 |
| Gnathamitermes sp. JT5 (84) | 74 | 8 | 18 | 0 |
1 Distribution based on sequences from combined L1, L2 inventories (see Table A12-5).
variants in the guts of lower termites and wood-roaches (Zhang et al., 2011). Using Cys clade specific primers (Cys499F1b, 1045R), we screened the gut DNA of all higher termite samples, 3 lower termite species from Southern California representing 3 termite families, and a wood-feeding roach for Cys clade genes by PCR. No product (or correct sized product) was detected from any higher termite templates after 30 cycles of PCR amplification (Figure A12-5). In contrast, all amplifications from lower termite and roach gut templates yielded robust products. Bearing in mind the inherent limitations of primer-based assays, the results independently corroborate inventory data, which pointed to unique sweeping losses of fdhF diversity having occurred in higher termite gut communities.
To gain insight on when such drastic culling of fdhF gene diversity might have occurred, we analyzed the phylogeny of Higher Termite Spirochete clade sequences (Figure A12-6). Sequences from the most closely related higher termites clustered into shallow clades, suggesting recent coevolution between host and fdhF encoded by gut symbionts. However, sequences from higher termite species representing different subfamilies formed deeply branching clades whose branching order could not be resolved. This type of “spoke” topology in phylogenetic trees, wherein clades radiate with no resolvable order like spokes from a wheel, is typical of adaptive (or ‘ecological’) radiations (Sudhaus, 2004). Based on uncertainties in branching order at the sub-family level, the radiation may have occurred sometime during the emergence of higher termite sub-families. Since adaptive radiations commonly occur after massive extinctions, the major loss in fdhF diversity observed in both inventory and PCR data may have taken place earlier than sub-family diversification, possibly during the evolution of the last common ancestor (LCA) of all higher termites over 50 Mya (Grimaldi and Engel, 2005). The earliest evolved higher termites belong to the fungus feeding subfamily Macrotermitinae (Engel et al., 2009; Grimaldi and Engel, 2005). Examining fdhF in a fungus-feeding termite should help clarify the timing of fdhF extinction.
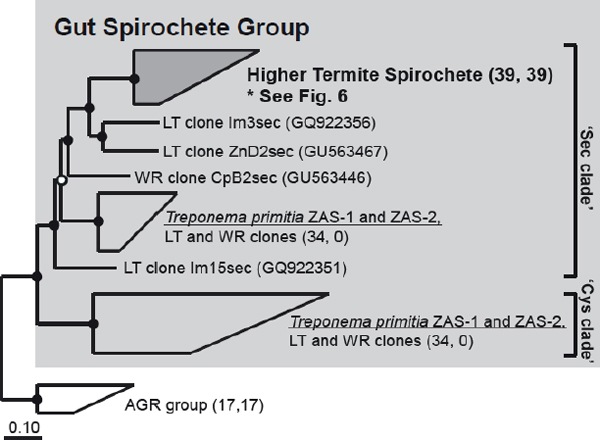
FIGURE A12-4 Protein phylogeny of Sec and Cys clade sequences within the “Gut spirochete group” of FDHH (light grey, previously Clade A, Figure A12-3). Higher termite sequences group with a metagenomic sequence from Nasutitermes (IMG gene object identity no. 2004163507) to form the “Higher termite spirochete group,” highlighted in dark grey. “LT” and “WR” in sequence names denote clone sequences from lower termites and wood-roaches, respectively. Insect sources are denoted in the sequence name by “Zn,” “Im,” and“Cp” (Zootermopsis nevadensis, Incisitermes minor, Cryptocercus punctulatus). Numbers of sequences within grouped clades are indicated in parentheses as in Figure A12-3. Tree was constructed with 604 ClustalW-aligned amino acids and Phylip PROML. The metagenomic sequence was added in by parsimony methods. Filled circles indicate nodes supported by maximum likelihood, parsimony (PROTPARS, >60 of 100 bootstrap resamplings), and distance (Fitch) tree construction methods. Unfilled circles indicate nodes supported by only 2 tree construction methods. Scale bar indicates 0.1 amino acid changes per alignment position. Accession numbers for sequences in grouped clades are in Table A12-6.
“Chain of Extinction” Hypothesis: Disappearance of H2 Producing Protists and H2 Consuming Dependents
Given that the fdhF gene extinction event (or events) occurred during time periods relevant to the LCA of higher termites, the most plausible cause of fdhF extinction would seem to relate to another extinction that transpired in the same time period: the extinction of H2-producing gut protozoa. While these links are circumstantial, the link between fdhF and protozoa also makes functional sense. A dramatic extinction of primary H2-producers (leading to a shift in niche
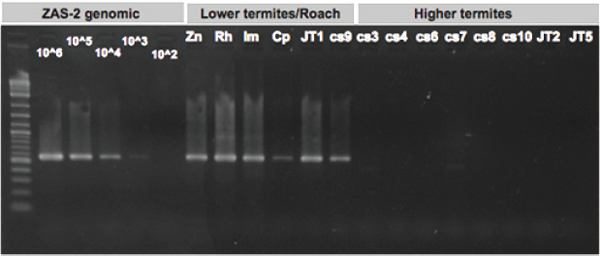
FIGURE A12-5 Targeted PCR assays on termite and roach gut DNA using Cys clade specific fdhF primers (Cys499F1b, 1045R), which yield a ca. 600 bp product (ladder left lane: NEB 2-log). Templates are: ZAS-2, T. primitia str. ZAS-2 genomic DNA; Zn, Z. nevadensis; Rh, R. hesperus; Im, I. minor; Cp, C. punctulatus; JT1, R. tibialis; cs9, Coptotermes sp. Cost009; cs3, Nasutitermes sp. Cost003; cs4, Rhynchotermes sp. Cost004; cs6, Microcerotermes sp. Cost006; cs7, Nasutitermes corniger Cost007; cs8, Microcerotermes sp. Cost008; cs10, Amitermes sp. Cost010; JT2, Amitermes sp. JT2; JT5, Gnathamitermes sp. JT5. Numbers in ZAS-2 genomic lanes refer to the number of genome copies per reaction. Copy numbers (106 copies/gut) in the lower termite Z. nevadensis were estimated from band strength in dilution-to-extinction PCR of T. primitia ZAS-2 DNA (assuming a yield of 1 mg total DNA/gut typically observed in QIAGEN DNA extractions, 10% derived from prokaryotes, and 104 copies/ng gut DNA in Z. nevadensis). As correct sized Cys bands were not present in higher termites, the detection limit (100 copies/ng gut DNA) was used to estimate a maximum abundance of 103 copies/gut for lower termite Cys clade FDH genes in higher termites (assuming a yield of 0.25 mg total DNA/gut, 100% derived from prokaryotes).
occupancy) in the lower termite-like LCA would undoubtedly propagate down the microbial “food chain” to H2-consuming symbionts, such as H2-consuming acetogens that possess fdhF. The result of this propagation could manifest itself in extant higher termites in one of two ways: (1) a dramatic shift in the abundance of H2-consuming symbionts (and their fdhF genes) relative to that found in less derived termites or (2) a dramatic loss of diversity. Our results support the latter scenario, implying that the consequences of protozoa extinction on symbionts (and their genes) lying “downstream” in H2 metabolism were more wave-like than ripple-like.
Not all genes, however, went extinct. Those that survived waves of extinction underwent an explosive radiation to fill out previously occupied niches. We posit that their genetic descendants form the Higher Termite Spirochete group.
The data also provide circumstantial support for a previous hypothesis on the nature of association between certain protozoa and ectosymbiotic spirochetes. Leadbetter et al. (1999) proposed an H2-based symbiosis to explain the presence
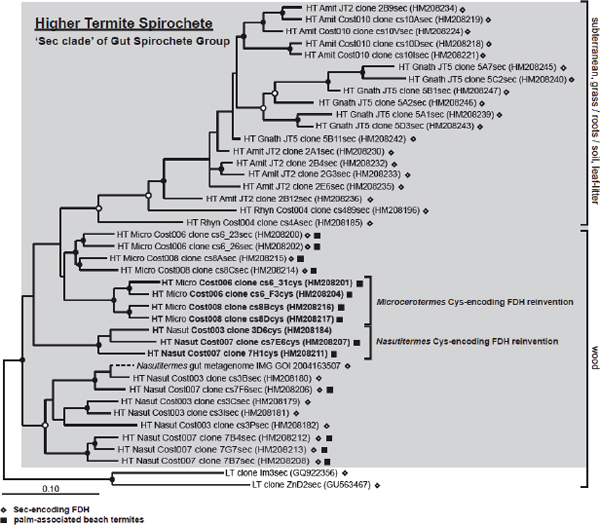
FIGURE A12-6 Protein phylogeny of Higher Termite Spirochete group sequences (grey box, previously dark grey clade in Figure A12-4) within the Sec clade of the Gut spirochete group (light grey clade, Figure A12-4). “HT,” “LT” and “WR” in sequence names indicate the insect source (higher termite, lower termite, wood-roach); “Cost” and “JT” refer to higher termite species from Costa Rica and California, respectively. Diamonds next to sequences and “sec” in the sequence name denote selenocysteine FDHH; ‘cys’ in the sequence name denotes a cysteine-encoding variant. Squares indicate sequences derived from higher termites collected at Costa Rican beaches. Sequences predicted to result from evolutionary reinventions and the likely food substrates for insects are also indicated. Tree was constructed with 604 ClustalW-aligned amino acids and Phylip PROML. The branching position of Nasutitermes metagenomic FDHH fragment (added in by parsimony using 250 amino acids) was indicated with a dashed line thus phylogenetic distance represented by this dashed line is not comparable to any other sequence. Filled circles indicate nodes supported by PROML, parsimony (Phylip PROTPARS), and distance (Fitch) methods of tree construction. Unfilled circles indicate nodes supported by 2 of 3 tree construction methods. Scale bar corresponds 0.1 amino acid changes per alignment position. Genbank accession numbers are in parentheses.
of spirochetes attached to protozoa surfaces. The results described here strengthen their implication that some ectosymbiotic spirochetes may be acetogenic and also draw attention to unexplored metabolic dependencies between protists and freeliving spirochetes that may not require physical proximity.
Selenium Dynamics: Sweeping Gene Extinction Followed Later by Occasional Convergent Evolution
Our previous study of Gut Spirochete Group FDHH from the guts of less derived wood-feeding insects revealed two functional enzyme variants differing in a key catalytic residue (Figure A12-4) (Zhang et al., 2011). “Sec clade” sequences have been predicted to encode enzymes that contain the trace element selenium in the form selenocysteine at the active site. In contrast, Cys clade sequences generally encode selenium-independent variants containing cysteine, instead of selenocysteine, at the active site. Study of T. primitia (Matson et al., 2010) and other organisms (Jones et al., 1981; Valente et al., 2006; Vorholt et al., 1997) that possess dual enzyme variants indicate that organisms will switch to using their selenium-independent enzymes under selenium limitation.
In higher termites, the striking absence of Cys clade gene variants implied that some selective pressure related to selenium limitation was relaxed in higher termite gut communities, such that genes for selenium-independent enzymes were lost by genome reduction from symbiont genomes. An alternative explanation was that the characteristic absence of Cys clade genes in higher termites related to sampling differences between studies. To address this concern, we collected 2 lower termite species from the same habitats as a subset of higher termites (Costa Rican lower termite Coptotermes sp. Cost009 collected near Microcerotermes sp. Cost006 and Cost008; desert-adapted lower termite R. tibialis JT1 collected near higher termite species Amitermes sp. JT1 and Gnathamitermes sp. JT5) and performed PCR screening on whole gut community DNA with Cys clade specific primers. Correct-sized PCR amplicons were observed for all lower termites, regardless of where they were collected (Figure A12-5) to independently support inventory data. Thus, the absence of Cys clade genes is a characteristic feature of higher termite gut microbial communities, rather than a result of sampling differences.
To further explore the dependence of higher termite FDHH on selenium (a trace nutrient whose bioavailability varies with redox state [Fishbein, 1983; Masscheleyn et al., 1990]), we inspected every higher termite Sec clade FDHH sequence for the selenocysteine amino acid. We discovered that several sequences from Costa Rican higher termites actually encode selenium-independent FDHH (clones cs6_31cys, cs6_F3cys, cs8Bcys, cs8Dcys, 3D6cys, cs7E6cys, 7H1cys). Since these cysteine-containing FDHH variants were nested within the Sec clade, they must originate from the duplication of a selenium-dependent FDHH gene followed by mutational modification of the active site selenocysteine into cysteine. Also of note is the
clustering of Microcerotermes cysteine-containing FDHH with each other, to the exclusion of cysteine FDHH from Nasutitermes. This result points to two independent gene duplication events, each of which has resulted in the “reinvention” (or convergent evolution) of a selenium-independent FDHH gene from Sec clade FDHH gene stock in termites. To our knowledge these data provide the first examples of convergent evolution by symbiotic gut microbes in the termite gut.
The forces that have selected for convergent evolution are intriguing. One possibility is that the selenium content of the termite’s diet may vary enough to affect selenium bioavailability in the gut tract and thus select for one or the other gene variant. This hypothesis stems from the observation that the majority of reinvented cysteine variants (Figure A11-6) were identified in termites collected from palm trees in beach areas where plants are regularly submerged in seawater. Estimates of total selenium concentrations in the surface mixed layers of the ocean are 4-orders of magnitude lower than in surface soils (Nriagu, 1989). Thus seawater may flush selenium out from beach soil, reducing selenium levels in plants, and consequently the diet of termites. But even if dietary selenium levels drove convergent evolution, the larger question of why selenium-dependent FDHH genes are favored over selenium-independent variants in higher termites remains unanswered. Perhaps a structural aspect of the gut tract in higher termites makes the same amount of selenium more easily bioavailable in higher termite than in lower termite guts. Perhaps behavioral innovations, e.g. relating to increased and more effective grazing for nutrients, are at play. The continued study of selenium biology and chemistry in termite guts, and the termites in which they reside, should provide further insight into such possibilities.
Recent Gene Invasion into Subterranean and Litter-Feeding Higher Termite Gut Communities
Gut preparations from subterranean (Amitermes sp. Cost010, Amitermes sp. JT2, and Gnathamitermes sp. JT5) and litter-feeding higher termites (Rhynchotermes sp. Cost004) featured a novel clade of FDHH absent in other termites (clade B in Figure A12-3). Figure A12-7 shows the detailed phylogeny of AGR group sequences. Since we could not infer the identity of uncultured organisms encoding these sequences from phylogeny, we inspected the sequences for possible indel signatures. Indeed, AGR sequences contained an amino acid indel (Figure A12-7, right panel) similar to that previously observed in Gut Spirochete Group sequences, weakly suggesting a spirochetal origin for AGR group genes, or for that indel.
We hypothesized that AGR group genes might be diagnostic markers for subterranean and litter-feeding higher termite diets and behaviors. To test this hypothesis, we designed AGR clade-specific primers (AGR193F, 1045R). We screened lower and higher termite gut DNA templates using nested PCR methods (Figure A12-8). Robust amplicons were consistently detected in every subterranean and
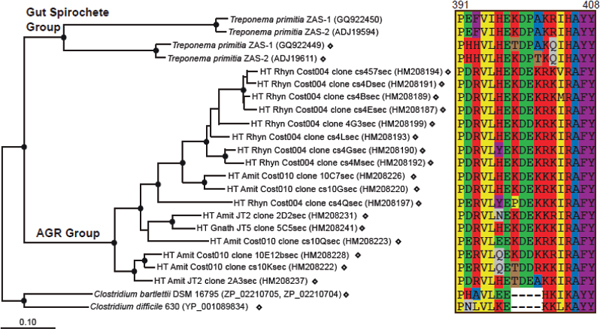
FIGURE A12-7 Protein phylogeny (left panel) and amino acid character analysis (right panel) of AGR group sequences (Clade B, Figure A12-3). In the left panel, sequences from T. primitia represent the Gut Spirochete Group (Clade A, Figure A12-3). Diamonds located next to sequences and clone names containing “sec” denote selenocysteine FDHH; unmarked sequences denote cysteine-encoding FDHH. Tree was constructed with 595 ClustalW-aligned amino acids using Phylip PROML. Filled circles indicate nodes supported by PROML, parsimony (Phylip PROTPARS), and distance (Fitch) methods of analyses. Scale bar indicates 0.1 amino acid changes per alignment position. In the right panel, numbers above the alignment refer to amino acid positions in the selenocysteine FDHH of T. primitia str. ZAS-2 (ADJ19611). Canonical amino acid one-letter coding applies. Amino acids are colored based on shared physical-chemical characteristics: yellow/hydrophobic, blue/small, brown/nucleophilic, purple/aromatic, green/acidic, red/basic, grey/amide.
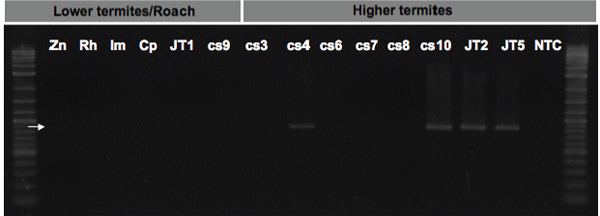
FIGURE A12-8 Products from nested PCR reactions using universal fdhF primers followed by Amitermes-Gnathamitermes-Rhychotermes clade specific primers on gut templates. NEB 2 log ladder was used. See Figure A12-5 legend for template designations. Slight band in lane Zn was observed inconsistently and infrequently and is attributed to contamination during nested PCR.
litter-feeding higher termite, but not in arboreal higher termites, lower termites, or C. punctulatus to support the conjecture that AGR group alleles are characteristic of subterranean and litter-feeding higher termite gut communities.
To understand why AGR group sequences would be present in only a subset of higher termites, we compared the relative abundance of AGR sequences (Table A12-3) with the host’s predicted diet (Table A12-1). AGR sequences were the most abundant phylotype in leaf litter-feeding termites (51%, Rhynchotermes sp. Cost004), but appeared at lower frequencies (8-13%) in subterranean termites with diets containing monocots (such as sugarcane roots, grass, and Yucca), and were not recovered from termites feeding on wood. Based on tannin levels reported for bark, leaves, and wood (Hernes and Hedges, 2004), the presence of AGR group sequences may positively relate to dietary tannin levels and represent a novel marker for an as-of-yet unappreciated group of uncultured acetogens, perhaps ones that exhibit greater tolerance to phenolic compounds like tannin. Alternatively, they may represent a group of non-acetogenic, tannin-tolerant, heterotrophic bacteria that ferment residual sugars in decaying leaves, and employ the enzyme in direction of formate oxidation, perhaps in concert with non-acetogenic formyl-tetrahydrofolate synthetase genes inventoried from the guts of litter and subterranean higher termites (Ottesen et al., 2011). In any case, the phylogenetic remoteness of the AGR group from other major FDH clades suggests that a niche that was previously small (or absent) in wood-feeding termites gained importance in higher termites that feed on decaying plant materials that have substantial contact with soil.
The basal location of subterranean termite sequences (Figure A12-7) hints that the influx of AGR type gene stock into gut communities occurred in a termite belonging to the Termitinae subfamily and that such genes may have been laterally transferred into the Nasutitermitinae. It remains to be determined whether
the initial influx manifested itself as the lateral transfer of AGR genes from an organism passing through the gut to an established gut symbiont, or the invasive establishment of a novel group of gut symbionts. Indeed complex phylogenetic relationships between spirochete rRNA genes and host termites (Lilburn et all, 1999; Ohkuma et all, 1999) which are not strictly co-cladogenic imply that acquisition of gut symbionts has been ongoing during termite evolution, a concept outlined previously (Breznak et all, 2006; Ohkunma et all, 2006). However, these events are most likely in the very distant past, as there is also strong evidence in support of broad levels of spirochete coevolution with lower termites (Berlanga et al., 2007). The select presence of AGR type genes in litter and subterranean higher termite guts suggests a more recent acquisition in the evolutionary history of this successful lineage of termite hosts.
PCA Analysis: The Past Shapes Most of the Present
To quantify the importance of different factors associated with FDHH phylogeny, we performed a principal component analysis (PCA, Figure A12-9) using the phylogeny statistics software UniFrac (Lozupone and Knight, 2005). The first principal component (P1, 27.64% of total variance, Figure A12-9a, A12-9b) clearly separates lower termite and wood-roach inventories from higher termite inventories, a result consistent with P1 tracking the presence (lower termite, wood-roach) or absence (higher termite) of flagellate protozoa in gut communities. This result supports our hypothesis that fdhF gene extinction results from protozoal extinctions. The second (Figure A12-9a, 9c) and third principal components (Figure A12-9b, A12-9c) accounted for similar levels of variance (15.46%, 14.25%). P2 clustered inventories containing Protobacteria clade sequences together whereas P3 grouped those containing AGR clade sequences. The latter grouping is supports the idea that dietary variables (amount of soil and form of lignocellulose in diet) also play roles in shaping gut communities (Brauman et al., 2001; Miyata et al., 2007; Yamada et all, 2007). PCA analysis does not appear to cluster data based on geography, nest-type, or habitat—the diversity of which were considerable in the sampled species. Based on these data, the transition between lower termite body and gut community plans to the higher termite forms seems to far outweigh in importance other variables for shaping fdhF diversity in higher termites. This is consistent with the notion that the long ago signal imprinted in fdhF sequence diversity in higher termites is the mass extinction of protozoa during their transition.
Model for fdhF Evolution in Wood-feeding Dictyopteran Insects
Based on our findings, we constructed a schematic modeling the evolutionary trajectory of fdhF in the guts of wood-feeding insects, beginning with fdhF in the LCA of termites and wood-feeding cockroaches to the present day (Figure A12-10).
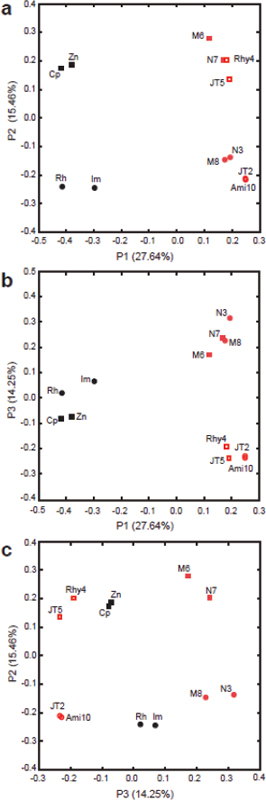
FIGURE A12-9 UniFrac principal component analysis of FDHH phylogeny associated with the gut microbial communities of termites and related insects. Wood-roach and lower termites: Cp, C. punctulatus; Zn, Z. nevadensis; Rh, R. hesperus; Im, I. minor. Higher termites: N3, Nasutitermes sp. Cost003; N7, Nasutitermes corniger Cost007; M6, Microcerotermes sp. Cost006; M8, Microcerotermes sp. Cost008; Rhy4, Rhynchotermes sp. Cost004; A10, Amitermes sp. Cost010; Jt2; Amitermes sp. JT2; Jt5, Gnathamitermes sp. JT5. Black shapes, lower termite and wood-roach inventories; red shapes, higher termite inventories; squares, inventories containing Proteobacteria group sequences; filled-in shapes, inventories containing AGR group sequences. The tree in Figure A12-3 was analyzed with UniFrac (termite species as the environment variable, 100 permutations).
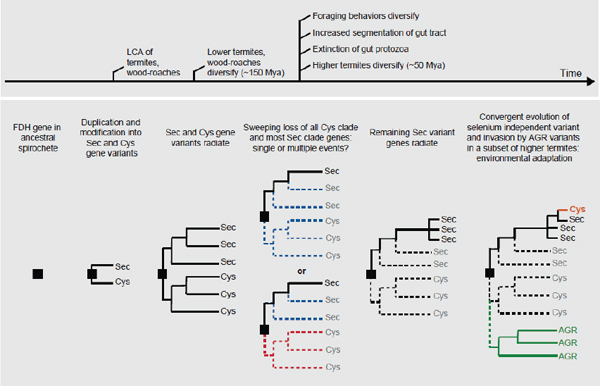
The evolutionary sequence highlights the importance of past extinction events as key determinants of present diversity. Previous data (Zhang et al., 2011) imply that a spirochete member of the gut community within the LCA of termites and roaches possessed an ancestral fdhF gene, which underwent duplication and mutational modification into selenocysteine and cysteine encoding forms. These two functional variants of fdhF then co-radiated with gut communities and the host insects as wood-feeding insects were diversifying into termite and roach forms to create “Sec” and “Cys clades.” Here we have documented a severe trimming of Sec clade diversity and complete loss of all Cys clade genes. We estimate that this occurred during the emergence of the higher termite line when guts became segmented, foraging behaviors diversified, and cellulolytic protozoa went extinct from the gut community. It is unclear whether losses of Sec and Cys clade genes represent single or multiple extinction events. In any case, genes surviving extinction radiated to fill the newly emptied (or created) niches within higher termite guts. In particular, the convergent evolution of selenium independent fdhF suggests an adaptive radiation into selenium-limited niches that have recently become available in a subset of higher termites. It also appears that some aspect of litter-feeding and subterranean lifestyles has allowed the more recent establishment of a novel clade of fdhF, possibly reflecting an invasion by non–gut adapted species.
Conclusions
The overarching goal of this study was to understand how symbiont communities and their genes have been impacted by drastic change and other perturbations over evolutionary timescales. We accomplished this goal using the obligate nutritional mutualism between termites and their hindgut microbial communities as a “backdrop” for an evolutionary case study of symbiosis. Comparative analysis of a symbiont metabolic gene unveiled a striking implication for evolutionary biology in complex microbial communities wherein the metabolisms of community members form a network of dependent interactions: collapse of a functional population (or network node) within a symbiont community can have dramatic and long lasting effects on the genes encoded by symbionts occupying niches downstream in the chain of community metabolism.
Connectivity and adaptation are themes that have emerged from this study of symbiont communities. The challenge now is to understand the specific interactions on which connectivity was based in the distant past. Studying the genes and organisms involved in present day interactions between specific microbes within termite gut communities should give us clues on how the past has shaped and continues to shape the present.
Materials and Methods
Insect Collection and Classification
Details on insect collection can be found in Ottesen et al. (Masscheleyn et al., 1990). Briefly, termite obtained by permit in Costa Rica were Nasutitermes sp. Cost003, collected from the National Biodiversity Institute of Costa Rica (INBio) forest; Rhynchotermes sp. Cost004, from leaf litter within INBio; Amitermes sp. Cost010, from soil-encrusted decayed sugar cane at a sugar cane plantation in Grecia; Nasutitermes corniger Cost007, Microcerotermes spp. Cost006 and Cost008, from unidentified species of palm growing at a beach in Cahuita National Park (CNP); Coptotermes sp. Cost009 (lower termite, family Rhinotermitidae), from wood near CNP’s Kelly Creek Ranger Station. Termites obtained under US Park Service Research Permit from Joshua Tree National Park, CA were Amitermes sp. JT2 and Gnathamitermes sp. JT5, collected from subterranean nests; Reticulitermes tibialis JT1 (lower termite, family Rhinotermitidae), collected from a decayed log in a dry stream bed.
Termites were identified based on mitochondrial cytochrome oxidase 2 gene sequence (COII, Fig. S1) and morphology. In general, inadequate COII sequence data prevented taxonomic assignments past genus level. Genus names for Rhynchotermes sp. Cost004 and Gnathamitermes sp. JT5 specimens were assigned based on head and mandible morphology, and collection location. COII analyses confirmed that the 8 termite species examined in this study represent distinct lineages in the subfamilies Nasutitermitinae and Termitinae. Classification of termite habitats was based on the Holdridge life zone classification of land areas (Holdridge et al., 1971) and life zone maps in references (Enquist, 2002; Lugo et al., 1999).
DNA Extraction
For each termite species, the entire hindguts of 20 worker termites were extracted within 48 hours of collection, pooled into 500 µl 1X Tris-EDTA buffer (10 mM Tris-HCl, 1 mM EDTA, pH 8), and stored at -20°C until DNA extraction. Whole gut community DNA was obtained using the method described in (Matson et al., 2007).
fdhF Amplification and Cloning
PCR reactions containing universal fdhF primers (1 µM of each degenerate form) (Zhang et al., 2011) were assembled with 1X FAILSAFE Premix D (EPICENTRE Biotechnologies, Madison, WI). Polymerase (0.07 – 0.14 U × µl–1, EXPAND High Fidelity polymerase, Roche Applied Science, Indianapolis, IN) and gut DNA template concentrations (0.05–1 ng × µl–1) were adjusted so that reactions would yield similar amounts of PCR product. Thermocycling
conditions for PCR on a Mastercycler Model 5331 thermocycler (Eppendorf, Westbury, NY) were: 2 min at 94°C, 25 cycles of (94°C for 30 sec; 51°C, 53.6°C or 55°C for 1 min; 68°C for 2 min 30 sec), and 10 min at 68°C. Details on PCR are presented in Table A12-4. Amplifications at 51°C annealing temperature yielded multiple sized products upon gel electrophoresis with 1.5% w/v agarose (Invitrogen, Carlsbad, CA). The correct-sized bands were excised and gel purified with a QIAquick Gel Extraction Kit (QIAGEN, Valencia, CA). To ensure product specificity, PCR was performed at higher annealing temperatures (53.6°C for Microcerotermes sp. Cost008, Amitermes sp. Cost010; 55°C for Nasutitermes sp. Cost003, Rhynchotermes sp. Cost004). These reactions yielded single product bands upon electrophoresis. All PCR products were cloned using a TOPO-TA cloning kit (Invitrogen). Clones (30-107 per termite species) were screened for the presence of the correct sized insert by PCR and gel electrophoresis. PCR reactions contained T3 (1 µM) and T7 (1 µM) primers, 1X FAILSAFE Premix D (EPICENTRE), 0.05 U ⊕ µl–1 Taq polymerase (New England Biolabs, Beverly, MA) and 1 µL of cells in 1X TE as template. Thermocycling conditions were 2 min at 95°C, 30 cycles of (95°C for 30 sec, 55°C for 1 min, 72°C for 2 min 30 sec), and 10 min at 72°C.
RFLP Analysis, Sequencing, Diversity Assessment
Most inventories were subject to RLFP typing, wherein correct-sized products generated by screening PCRs were digested with the restriction enzyme RsaI (New England Biolabs) and electrophoresed on a 2.5% (w/v) agarose gel (Invitrogen). Plasmids from clones with unique RFLP patterns were purified
TABLE A12-4 PCR Conditions for Clone Library Construction. Shaded Grey Rows Highlight Templates For Which Multiple Libraries Were Created. Thermocycling Conditions for Each PCR Reaction Were 94ºC for 2 Min, 25 Cycles of (94ºC for 30 s, Annealing for 1 Min, 68ºC for 2 Min 30 s), then 68ºC for 10 Min
| Source of gut DNA | Library | Polymerase (U/ml) | Template (ng/ml) | Annealing Temp °C |
| Nasutitermes sp. Cost003 | 3L1 | 0.035 | 0.25 | 55 |
| Nasutitermes sp. Cost003 | 3L2 | 0.14 | 0.25 | 51 |
| Nasutitermes corniger Cost007 | 7L1 | 0.14 | 0.25 | 51 |
| Rhynchotermes sp. Cost004 | 4L1 | 0.035 | 0.25 | 55 |
| Rhynchotermes sp. Cost004 | 4L2 | 0.14 | 0.25 | 51 |
| Microcerotermes sp. Cost006 | 6L1 | 0.14 | 0.25 | 51 |
| Microcerotermes sp. Cost008 | 8L1 | 0.035 | 1 | 53.6 |
| Amitermes sp. Cost010 | 10L1 | 0.035 | 0.5 | 53.6 |
| Amitermes sp. Cost010 | 10L2 | 0.14 | 0.25 | 51 |
| Amitermes sp. JT2 | Jt2L1 | 0.07 | 0.05 | 51 |
| Gnathamitermes sp. JT5 | Jt5L1 | 0.07 | 0.05 | 51 |
using a QIAprep Spin Miniprep Kit (QIAGEN). For Nasutitermes sp. Cost003, Rhynchotermes sp. Cost004, and Amitermes sp. Cost010 inventories, generated at an annealing temperature of 51°C, plasmids from clones having the correct-sized products were purified for sequencing without RLFP typing. Plasmids were sequenced with T3 and T7 primers at Laragen, Inc. (Los Angeles, CA) using an Applied Biosystems Incorporated ABI3730 automated sequencer. Lasergene software (DNASTAR, Inc., Madison, WI) was used to assemble and edit sequences. Sequences were aligned with ClustalW (Larkin et al., 2007), manually adjusted, and grouped into operational taxonomic units at a 97% protein similarity level based on distance calculations (Phylip Distance Matrix, JonesThorton-Taylor correction) and DOTUR (Schloss and Handelsman, 2005). The program EstimateS v8.2.0 (Colwell, 2009) was used to assess inventory diversity and completeness.
COII Amplification for Termite Identification
Mitochondrial cytochrome oxidase subunit II (COII) gene fragments from Costa Rican termites were amplified from DNA containing both insect and gut community material using primers A-tLEU and B-tLYS and the protocol described by Miura et al. (1998, 2000). COII gene fragments from Californian termites were amplified using the supernatant of a mixture containing an individual termite head crushed in 1X TE as template. Primers and PCR conditions were identical to those employed for Costa Rican termite COII. PCR products were purified using a QIAquick PCR purification kit (QIAGEN), sequenced, and analyzed to verify the identity of termite specimens.
Primer Design and PCR for Cys Clade fdhF Alleles
Degenerate primers (Cys499F1b, 1045R) for a major clade of selenium independent (Cys) fdhF alleles present in lower termites and the wood roach C. punctulatus were designed manually using all sequences recovered from these insects in Zhang et al., 2011 Forward primer Cys499F1b (5′– ATG TCS CTK TCS ATI CCG GAA A –3′) specificity is as follows: 38.9% of the sequences are perfectly matched, 22.2% have 1 mismatch, 27.8% have 2 mismatches, and 8.3% have 3 mismatches. No mismatches are in located in the terminal 3′ position. The reverse primer 1045R (5′– CIC CCA TRT CGC AGG YIC CCT G – 3′) was designed based on 154 sequences from higher termites, lower termites and C. punctulatus. The 1045R primer targets both Sec and Cys fdhF variants; 60.3% of the sequences have 0 primer mismatches, 32.4% have 1, 5.8% have 2, and 1.3% have 3 mismatches. All sequences are perfectly matched at the terminal 3′ position. PCR reactions contained 0.4 ng ⊕ ![]() λ-1 of DNA template, 200 nM Cys4991F1b, 200 nM 1045R, 1X FAILSAFE Premix D (EPICENTRE), and 0.05 U ⊕
λ-1 of DNA template, 200 nM Cys4991F1b, 200 nM 1045R, 1X FAILSAFE Premix D (EPICENTRE), and 0.05 U ⊕ ![]() λ–1 Taq polymerase (New England Biolabs). Thermocycling
λ–1 Taq polymerase (New England Biolabs). Thermocycling
TABLE A12-5 Detailed Composition of Higher Termite fdhF Inventories. Clade Affiliations Indicated by GS = Gut Spirochete Group, PRT = Proteobacteria Group, AGR = AGR Group, UNHT = Unclassified Higher Termite Group
| Source of gut template | Phylotype (clade affiliation) | Abundance (%) in library | ||
| Nasutitermes sp. Cost003 | 3L1 (87clones) | 3L2 (17 clones) | ||
| cs3Csec (GS) | 73.6 | 70.6 | ||
| cs3Bsec (GS) | 20.7 | 17.6 | ||
| cs3Isec (GS) | 4.6 | 0.0 | ||
| cs3Psec (GS) | 1.1 | 0.0 | ||
| 3C4cys (UNHT) | 0.0 | 5.9 | ||
| 3D6cys (GS) | 0.0 | 5.9 | ||
| Rhynchotermes sp. Cost004 | ||||
| 4L1 (85 clones) | 4L2 (22 clones) | |||
| cs4Asec (GS) | 48.2 | 31.8 | ||
| cs4Esec (AGR) | 14.1 | 9.1 | ||
| cs4Bsec (AGR) | 8.2 | 0.0 | ||
| cs4Gsec (AGR) | 7.1 | 31.8 | ||
| cs4Dsec (AGR) | 7.1 | 4.5 | ||
| cs4Msec (AGR) | 4.7 | 4.5 | ||
| cs4Lsec (AGR) | 4.7 | 0.0 | ||
| cs457sec (AGR) | 3.5 | 0.0 | ||
| cs489sec (GS) | 1.2 | 4.5 | ||
| cs4Qsec (AGR) | 1.2 | 0.0 | ||
| 4D7cys (PRT) | 0.0 | 9.1 | ||
| 4G3sec (AGR) | 0.0 | 4.5 | ||
| Microcerotermes sp. Cost006 | ||||
| 6L1 (74 clones) | ||||
| cs6_23sec (GS) | 47.3 | |||
| cs6_31cys (GS) | 32.4 | |||
| cs6_26sec (GS) | 14.9 | |||
| cs6_B1cys (PRT) | 2.7 | |||
| cs6_F3cys (GS) | 1.4 | |||
| cs6_45cys (PRT) | 1.4 | |||
| Nasutitermes corniger Cost007 | ||||
| 7L1 (30 clones) | ||||
| cs7F6sec (GS) | 43.3 | |||
| cs7E6cys (GS) | 16.7 | |||
| 7B7sec (GS) | 13.3 | |||
| 7D2sec (UNHT) | 6.7 | |||
| 7E2cys (PRT) | 6.7 | |||
| 7H1cys (GS) | 6.7 | |||
| 7B4sec (GS) | 3.3 | |||
| 7G7sec (GS) | 3.3 | |||
| Source of gut template | Phylotype (clade affiliation) | Abundance (%) in library | ||
| Microcerotermes sp. Cost008 | ||||
| 8L1 (84 clones) | ||||
| cs8Csec (GS) | 42.9 | |||
| cs8Asec (GS) | 39.3 | |||
| cs8Bcys (GS) | 10.7 | |||
| cs8Dcys (GS) | 7.1 | |||
| Amitermes sp. Cost010 | ||||
| 10L1 (78 clones) | 10L2 (22 clones) | |||
| cs10Dsec (GS) | 62.8 | 45.5 | ||
| cs10Asec (GS) | 21.8 | 22.7 | ||
| cs10Gsec (AGR) | 7.7 | 9.1 | ||
| cs10Isec (GS) | 2.6 | 4.5 | ||
| cs10Ksec (AGR) | 2.6 | 0.0 | ||
| cs10Qsec (AGR) | 1.3 | 0.0 | ||
| cs10Vsec (GS) | 1.3 | 0.0 | ||
| 10C7sec (AGR) | 0 | 4.5 | ||
| 10G6sec (UNHT) | 0 | 9.1 | ||
| 10E12bsec (AGR) | 0 | 4.5 | ||
| Amitermes sp. JT2 | ||||
| Jt2L1 (101 clones) | ||||
| 2A1sec (GS) | 68.3 | |||
| 2D2sec (AGR) | 6.9 | |||
| 2B4sec (GS) | 5.9 | |||
| 2G3sec (GS) | 8.9 | |||
| 2B9sec (GS) | 6.9 | |||
| 2E6sec (GS) | 1.0 | |||
| 2B12sec (GS) | 1.0 | |||
| 2A3sec (AGR) | 1.0 | |||
| Gnathamitermes sp. JT5 | ||||
| Jt5L1 (84 clones) | ||||
| 5A1sec (GS) | 28.6 | |||
| 5C2sec (GS) | 20.2 | |||
| 5F1cys (PRT) | 17.9 | |||
| 5B11sec (GS) | 11.9 | |||
| 5C5sec (AGR) | 8.3 | |||
| 5D3sec (GS) | 4.8 | |||
| 5A7sec (GS) | 3.6 | |||
| 5A2sec (GS) | 2.4 | |||
| 5B1sec (GS) | 2.4 | |||
conditions were 2 min at 95°C, 30 cycles of (95°C for 30 sec, 60°C for 30 sec, 72°C for 45 sec), followed by 10 min at 72°C.
Primer Design and PCR for AGR Group fdhF Alleles.
AGR clade fdhF sequences were amplified using a nested PCR approach in which the amplicon from the first PCR reaction, generated with universal fdhF primers (Zhang et al., 2011), was used as the template for the second PCR reaction, containing the clade-specific primer set AGR193F and 1045R. Clade specificity was imparted by the forward primer, AGR193F (5′– AGG CTT ACC AAG CCG CCT ATC AGA – 3′), which targets 55.6% of the sequences in the AGR clade with 4 or fewer mismatches, none of them at the terminal 3′ end. PCR amplification of all fdhF types was achieved using the PCR reaction compositions and thermocycling conditions (51°C annealing temperature) previously specified for inventories. Clade specific PCR reactions contained 1 µl of diluted product from the first reaction (1:1000 in water), 250 nM AGR193F, 250 nM 1045R, 1X FAILSAFE Premix D (EPICENTRE), and 0.07 U · µl–1 of EXPAND High Fidelity polymerase (Roche). Thermocycling conditions were 2 min at 95°C, 25 cycles of (95°C for 15 sec, 60°C for 30 sec, 72°C for 1 min), followed by 10 min at 72°C.
Phylogenetic and Principle Component Analysis
Phylogenetic analyses of protein and nucleotide sequences were performed with ARB version 09.08.29 (Ludwig et al., 2004). Genbank accession numbers are listed in Table A12-6. Details of tree construction can be found in figure legends. In general, trees show results from Phylip PROML analysis, node robustness was analyzed with PROTPARS and Fitch distance methods as well (Felsenstein, 1998). The same filter and alignments were employed when additional tree algorithms were used to infer node robustness. All phylogenetic inference models were run assuming a uniform rate of change for each nucleotide or amino acid position. Principal component analysis of FDHH phylogeny and environment data was performed using the software Unifrac (Lozupone and Knight, 2005).
Acknowledgements
This work was supported by National Science Foundation grant EF-0523267 and Department of Energy grant DE-FG02-07ER64484 to JRL and a National Science Foundation graduate research fellowship to XZ. We thank members of the Leadbetter laboratory for their helpful discussions and comments. We are grateful for the aid of Myriam Hernández, Luis G. Acosta, Giselle Tamayo, and Catalina Murillo of the Instituto Nacional de Biodiversidad (Santo Domingo de Heredia, Costa Rica) and Brian Green, Cathy Chang, and Eric J. Mathur, formerly
TABLE A12-6 Sequences Used in Phylogenetic Analyses. FDH-H, Hydrogenase-Linked Formate Dehydrogenase. FDH-NAD, NAD-Linked Formate Dehydrogenase. FDH-F420, F420-Linked Formate Dehydrogenase. Sup., Supplementary. Multiple Accession Numbers For a FDH Sequence that Appears as Artificially Truncated Sequence Fragments in NCBI Database; Sequence Fragments Were Manually Assembled into Longer Open Reading Frames for Phylogenetic Analyses
| Source | Gene | Included in Analyses | Accession |
| Aeromonas salmonicida subsp. salmonicida A449 | FDH-H | Fig. 3, 9 | YP_001141645 |
| Aggregatibacter aphrophilus NJ8700 | FDH-H | Fig. 3 | YP_003007599, YP_003007598 |
| Acetonema longum APO-1 | FDH-H | Fig. 3 | GQ922445 |
| Buttiauxiella SN1 | FDH-H | Fig. 3 | GQ922446 |
| Citrobacter koseri ATCC BAA-895 (copy 2) | FDH-H | Fig. 3 | YP_001453385 |
| Citrobacter koseri ATCC BAA-895 (copy 1) | FDH-H | Fig. 3 | YP_001455313, YP_001455315 |
| Citrobacter TSA-1 | FDH-H | Fig. 3 | GQ922447 |
| Clostridium bartlettii DSM 16795 | FDH-H | Fig. 3, 7, 9 | ZP_02210704, ZP_02210705 |
| Clostridium beijerinckii NCIMB 8052 | FDH-H | Fig. 3, 9 | YP_001310874 |
| Clostridium carboxidivorans P7 (copy 1) | FDH-H | Fig. 3, 9 | ZP_05394379, ZP_05394380 |
| Clostridium carboxidivorans P7 (copy 2) | FDH-H | Fig. 3, 9 | ZP_05390901 |
| Clostridium difficile 630 | FDH-H | Fig. 3, 7, 9 | YP_001089834 |
| C. punctulatus nymph gut clone Cp10sec | FDH-H | Fig. 3, 4, 9 | GU563433 |
| C. punctulatus nymph gut clone Cp14sec | FDH-H | Fig. 3, 4, 9 | GU563436 |
| C. punctulatus nymph gut clone Cp16sec | FDH-H | Fig. 3, 4, 9 | GU563432 |
| C. punctulatus nymph gut clone Cp24sec | FDH-H | Fig. 3, 4, 9 | GU563451 |
| C. punctulatus nymph gut clone Cp28sec | FDH-H | Fig. 3, 4, 9 | GU563450 |
| C. punctulatus nymph gut clone Cp34sec | FDH-H | Fig. 3, 4, 9 | GU563452 |
| C. punctulatus nymph gut clone Cp3sec | FDH-H | Fig. 3, 4, 9 | GU563434 |
| C. punctulatus nymph gut clone Cp72cys | FDH-H | Fig. 3, 4, 9 | GU563437 |
| C. punctulatus nymph gut clone Cp78sec | FDH-H | Fig. 3, 4, 9 | GU563453 |
| C. punctulatus nymph gut clone Cp82sec | FDH-H | Fig. 3, 4, 9 | GU563454 |
| C. punctulatus nymph gut clone Cp94sec | FDH-H | Fig. 3, 4, 9 | GU563455 |
| C. punctulatus nymph gut clone Cp9cys | FDH-H | Fig. 3, 4, 9 | GU563441 |
| C. punctulatus nymph gut clone CpB10sec | FDH-H | Fig. 3, 4, 9 | GU563442 |
| C. punctulatus nymph gut clone CpB2sec | FDH-H | Fig. 3, 4, 9 | GU563446 |
| C. punctulatus nymph gut clone CpB3sec | FDH-H | Fig. 3, 4, 9 | GU563440 |
| C. punctulatus nymph gut clone CpC1cys | FDH-H | Fig. 3, 4, 9 | GU563444 |
| C. punctulatus nymph gut clone CpC3sec | FDH-H | Fig. 3, 4, 9 | GU563443 |
| C. punctulatus nymph gut clone CpD1cys | FDH-H | Fig. 3, 4, 9 | GU563445 |
| C. punctulatus nymph gut clone CpD8sec | FDH-H | Fig. 3, 4, 9 | GU563439 |
| C. punctulatus nymph gut clone CpE8cys | FDH-H | Fig. 3, 4, 9 | GU563447 |
| C. punctulatus nymph gut clone CpF1cys | FDH-H | Fig. 3, 4, 9 | GU563435 |
| C. punctulatus nymph gut clone CpF8cys | FDH-H | Fig. 3, 4, 9 | GU563449 |
| C. punctulatus nymph gut clone CpF9cys | FDH-H | Fig. 3, 4, 9 | GU563448 |
| C. punctulatus nymph gut clone CpH1cys | FDH-H | Fig. 3, 4, 9 | GU563438 |
| Cronobacter turicensis (copy 2) | FDH-H | Fig. 3, 9 | YP_003210268 |
| Cronobacter turicensis (copy 1) | FDH-H | Fig. 3, 9 | YP_003210272, YP_003210273 |
| Dickeya dadantii Ech703 | FDH-H | Fig. 3, 9 | YP_002986892 |
| Edwardsiella ictaluri 93-146 | FDH-H | Fig. 3, 9 | YP_002934652, YP_002934653 |
| Enterobacter sp. 638 (copy 1) | FDH-H | Fig. 3, 9 | YP_001175022, YP_001175021 |
| Escherichia coli str. K-12 substr MG1655 | FDH-H | Fig. 3, 9 | NP_418503 |
| I. minor Pas1 gut clone Im10sec | FDH-H | Fig. 3, 4, 9 | GQ922349 |
| I. minor Pas1 gut clone Im11cys | FDH-H | Fig. 3, 4, 9 | GQ922364 |
| I. minor Pas1 gut clone Im15sec | FDH-H | Fig. 3, 4, 9 | GQ922351 |
| I. minor Pas1 gut clone Im22sec | FDH-H | Fig. 3, 4, 9 | GQ922353 |
| I. minor Pas1 gut clone Im24cys | FDH-H | Fig. 3, 4, 9 | GQ922369 |
| I. minor Pas1 gut clone Im26sec | FDH-H | Fig. 3, 4, 9 | GQ922354 |
| I. minor Pas1 gut clone Im27sec | FDH-H | Fig. 3, 4, 9 | GQ922355 |
| I. minor Pas1 gut clone Im3sec | FDH-H | Fig. 3, 4, 6, 9 | GQ922356 |
| I. minor Pas1 gut clone Im42cys | FDH-H | Fig. 3, 4, 9 | GQ922371 |
| I. minor Pas1 gut clone Im5cys | FDH-H | Fig. 3, 4, 9 | GQ922373 |
| I. minor Pas1 gut clone Im63sec | FDH-H | Fig. 3, 4, 9 | GQ922361 |
| Klebsiella pneumoniae NTUH-K2044 (copy 1) | FDH-H | Fig. 3, 9 | YP_002917305 |
| Klebsiella pneumoniae NTUH-K2044 (copy 2) | FDH-H | Fig. 3, 9 | YP_002919873 |
| Methanocaldococcus jannaschii DSM 2661 | FDH-F420 | Fig. 3, 9 | P61159 |
| Moorella thermoacetica ATCC 39073 | FDH-H | Fig. 3, 9 | YP_431025 |
| Methanococcus maripaludis S2 | FDH-F420 | Fig. 3, 9 | CAF29694 |
| Methanococcus vannielii SB | FDH-F420 | Fig. 3, 9 | ABR54514 |
| Pantoea sp. At-9b | FDH-H | Fig. 3, 9 | YP_004118506 |
| Pectobacterium atrosepticum SCRI1043 | FDH-H | Fig. 3, 9 | CAG74160 |
| Proteus mirabilis HI4320 (copy 2) | FDH-H | Fig. 3, 9 | YP_002152680 |
| Proteus mirabilis HI4320 (copy 1) | FDH-H | Fig. 3, 9 | YP_002153253 |
| R. hesperus ChiA2 gut clone Rh15cys | FDH-H | Fig. 3, 4, 9 | GQ922398 |
| R. hesperus ChiA2 gut clone Rh24sec | FDH-H | Fig. 3, 4, 9 | GQ922383 |
| R. hesperus ChiA2 gut clone Rh2sec | FDH-H | Fig. 3, 4, 9 | GQ922381 |
| R. hesperus ChiA2 gut clone Rh35sec | FDH-H | Fig. 3, 4, 9 | GQ922385 |
| R. hesperus ChiA2 gut clone Rh36cys | FDH-H | Fig. 3, 4, 9 | GQ922410 |
| R. hesperus ChiA2 gut clone Rh41sec | FDH-H | Fig. 3, 4, 9 | GQ922386 |
| R. hesperus ChiA2 gut clone Rh47cys | FDH-H | Fig. 3, 4, 9 | GQ922402 |
| R. hesperus ChiA2 gut clone Rh53sec | FDH-H | Fig. 3, 4, 9 | GQ922389 |
| R. hesperus ChiA2 gut clone Rh54cys | FDH-H | Fig. 3, 4, 9 | GQ922404 |
| R. hesperus ChiA2 gut clone Rh65cys | FDH-H | Fig. 3, 4, 9 | GQ922406 |
| R. hesperus ChiA2 gut clone Rh71sec | FDH-H | Fig. 3, 4, 9 | GQ922391 |
| R. hesperus ChiA2 gut clone Rh93cys | FDH-H | Fig. 3, 4, 9 | GQ922409 |
| R. hesperus ChiA2 gut clone Rh9sec | FDH-H | Fig. 3, 4, 9 | GQ922397 |
| Salmonella typhimurium LT2 | FDH-H | Fig. 3, 9 | NP_463150 |
| Serratia proteamaculans 568 | FDH-H | Fig. 3, 9 | YP_001478653 |
| Serratia grimesii ZFX-1 | FDH-H | Fig. 3, 9 | GQ922448 |
| Shigella sp. D9 | FDH-H | Fig. 3, 9 | ZP_05433594, ZP_05433593 |
| Yersinia frederiksenii ATCC 33641 (copy 1) | FDH-H | Fig. 3, 9 | ZP_04632644 |
| Yersinia frederiksenii ATCC 33641 (copy 2) | FDH-H | Fig. 3, 9 | ZP_04631307 |
| Treponema primitia str. ZAS-1 (copy 2) cys | FDH-H | Fig. 3, 4, 7, 9 | GQ922450 |
| Treponema primitia str. ZAS-1 (copy 1) sec | FDH-H | Fig. 3, 4, 7, 9 | GQ922449 |
| Treponema primitia str. ZAS-2 (copy 2) cys | FDH-H | Fig. 3, 4, 7, 9 | ADJ19594 |
| Treponema primitia str. ZAS-2 (copy 1) sec | FDH-H | Fig. 3, 4, 7, 9 | ADJ19611 |
| Nasutitermes sp. metagenome contig tgut2b_BHZN47861_b2 | FDH-H | Fig. 3, 4, 6, 9 | IMG Gene object ID: 2004163507 |
| Z. nevadensis ChiA1 gut clone Zn13cys | FDH-H | Fig. 3, 4, 9 | GQ922430 |
| Z. nevadensis ChiA1 gut clone Zn2cys | FDH-H | Fig. 3, 4, 9 | GQ922431 |
| Z. nevadensis ChiA1 gut clone Zn51sec | FDH-H | Fig. 3, 4, 9 | GQ922423 |
| Z. nevadensis ChiA1 gut clone Zn61sec | FDH-H | Fig. 3, 4, 9 | GQ922426 |
| Z. nevadensis ChiA1 gut clone Zn70sec | FDH-H | Fig. 3, 4, 9 | GQ922428 |
| Z. nevadensis ChiA1 gut clone Zn9cys | FDH-H | Fig. 3, 4, 9 | GQ922435 |
| Z. nevadensis ChiA1 gut clone ZnA4cys | FDH-H | Fig. 3, 4, 9 | GU563456 |
| Z. nevadensis ChiA1 gut clone ZnB3cys | FDH-H | Fig. 3, 4, 9 | GU563459 |
| Z. nevadensis ChiA1 gut clone ZnB5sec | FDH-H | Fig. 3, 4, 9 | GU563460 |
| Z. nevadensis ChiA1 gut clone ZnB8sec | FDH-H | Fig. 3, 4, 9 | GU563461 |
| Z. nevadensis ChiA1 gut clone ZnB9cys | FDH-H | Fig. 3, 4, 9 | GU563462 |
| Z. nevadensis ChiA1 gut clone ZnC11cys | FDH-H | Fig. 3, 4, 9 | GU563466 |
| Z. nevadensis ChiA1 gut clone ZnC1cys | FDH-H | Fig. 3, 4, 9 | GU563463 |
| Z. nevadensis ChiA1 gut clone ZnC6sec | FDH-H | Fig. 3, 4, 9 | GU563464 |
| Z. nevadensis ChiA1 gut clone ZnC8sec | FDH-H | Fig. 3, 4, 9 | GU563465 |
| Z. nevadensis ChiA1 gut clone ZnD2sec | FDH-H | Fig. 3, 4, 6, 9 | GU563467 |
| Z. nevadensis ChiA1 gut clone ZnD3cys | FDH-H | Fig. 3, 4, 9 | GU563468 |
| Z. nevadensis ChiA1 gut clone ZnE2cys | FDH-H | Fig. 3, 4, 9 | GU563469 |
| Z. nevadensis ChiA1 gut clone ZnF7sec | FDH-H | Fig. 3, 4, 9 | GU563458 |
| Z. nevadensis ChiA1 gut clone ZnH6cys | FDH-H | Fig. 3, 4, 9 | GU563457 |
| Z. nevadensis ChiA1 gut clone ZnH8cys | FDH-H | Fig. 3, 4, 9 | GU563470 |
| Z. nevadensis ChiA1 gut clone ZnHcys | FDH-H | Fig. 3, 4, 9 | GQ922420 |
| Amitermes sp. Cost010 gut clone cs10Dsec | FDH-H | Fig. 3, 4, 6, 9 | HM208218 |
| Amitermes sp. Cost010 gut clone cs10Isec | FDH-H | Fig. 3, 4, 6, 9 | HM208221 |
| Amitermes sp. Cost010 gut clone 10C7sec | FDH-H | Fig. 3, 4, 7, 9 | HM208226 |
| Amitermes sp. Cost010 gut clone 10E12bsec | FDH-H | Fig. 3, 4, 7, 9 | HM208228 |
| Amitermes sp. Cost010 gut clone 10G6sec | FDH-H | Fig. 3, 9 | HM208227 |
| Amitermes sp. Cost010 gut clone cs10Asec | FDH-H | Fig. 3, 4, 6, 9 | HM208219 |
| Amitermes sp. Cost010 gut clone cs10Gsec | FDH-H | Fig. 3, 4, 7, 9 | HM208220 |
| Amitermes sp. Cost010 gut clone cs10Ksec | FDH-H | Fig. 3, 4, 7, 9 | HM208222 |
| Amitermes sp. Cost010 gut clone cs10Qsec | FDH-H | Fig. 3, 4, 7, 9 | HM208223 |
| Amitermes sp. Cost010 gut clone cs10Vsec | FDH-H | Fig. 3, 4, 6, 9 | HM208224 |
| Amitermes sp. JT2 gut clone 2A1sec | FDH-H | Fig. 3, 4, 6, 9 | HM208230 |
| Amitermes sp. JT2 gut clone 2A3sec | FDH-H | Fig. 3, 4, 7, 9 | HM208237 |
| Amitermes sp. JT2 gut clone 2B12sec | FDH-H | Fig. 3, 4, 6, 9 | HM208236 |
| Amitermes sp. JT2 gut clone 2B4sec | FDH-H | Fig. 3, 4, 6, 9 | HM208232 |
| Amitermes sp. JT2 gut clone 2B9sec | FDH-H | Fig. 3, 4, 6, 9 | HM208234 |
| Amitermes sp. JT2 gut clone 2D2sec | FDH-H | Fig. 3, 4, 7, 9 | HM208231 |
| Amitermes sp. JT2 gut clone 2E6sec | FDH-H | Fig. 3, 4, 6, 9 | HM208235 |
| Amitermes sp. JT2 gut clone 2G3sec | FDH-H | Fig. 3, 4, 6, 9 | HM208233 |
| Gnathamitermes sp. JT5 gut clone 5A1sec | FDH-H | Fig. 3, 4, 6, 9 | HM208239 |
| Gnathamitermes sp. JT5 gut clone 5A2sec | FDH-H | Fig. 3, 4, 6, 9 | HM208246 |
| Gnathamitermes sp. JT5 gut clone 5A7sec | FDH-H | Fig. 3, 4, 6, 9 | HM208245 |
| Gnathamitermes sp. JT5 gut clone 5B11sec | FDH-H | Fig. 3, 4, 6, 9 | HM208242 |
| Gnathamitermes sp. JT5 gut clone 5B1sec | FDH-H | Fig. 3, 4, 6, 9 | HM208247 |
| Gnathamitermes sp. JT5 gut clone 5C2sec | FDH-H | Fig. 3, 4, 6, 9 | HM208240 |
| Gnathamitermes sp. JT5 gut clone 5C5sec | FDH-H | Fig. 3, 4, 7, 9 | HM208241 |
| Gnathamitermes sp. JT5 gut clone 5D3sec | FDH-H | Fig. 3, 4, 6, 9 | HM208243 |
| Gnathamitermes sp. JT5 gut clone 5F1cys | FDH-H | Fig. 3, 9 | HM208238 |
| Microcerotermes sp. Cost006 gut clone cs6_23sec | FDH-H | Fig. 3, 4, 6, 9 | HM208200 |
| Microcerotermes sp. Cost006 gut clone cs6_26sec | FDH-H | Fig. 3, 4, 6, 9 | HM208202 |
| Microcerotermes sp. Cost006 gut clone cs6_31cys | FDH-H | Fig. 3, 4, 6, 9 | HM208201 |
| Microcerotermes sp. Cost006 gut clone cs6_45cys | FDH-H | Fig. 3, 9 | HM208205 |
| Microcerotermes sp. Cost006 gut clone cs6_B1cys | FDH-H | Fig. 3, 9 | HM208203 |
| Microcerotermes sp. Cost006 gut clone cs6_F3cys | FDH-H | Fig. 3, 4, 6, 9 | HM208204 |
| Microcerotermes sp. Cost008 gut clone cs8Asec | FDH-H | Fig. 3, 4, 6, 9 | HM208215 |
| Microcerotermes sp. Cost008 gut clone cs8Bcys | FDH-H | Fig. 3, 4, 6, 9 | HM208216 |
| Microcerotermes sp. Cost008 gut clone cs8Csec | FDH-H | Fig. 3, 4, 6, 9 | HM208214 |
| Microcerotermes sp. Cost008 gut clone cs8Dcys | FDH-H | Fig. 3, 4, 6, 9 | HM208217 |
| Nasutitermes sp. Cost003 gut clone 3D6cys | FDH-H | Fig. 3, 4, 6, 9 | HM208184 |
| Nasutitermes sp. Cost003 gut clone cs3Bsec | FDH-H | Fig. 3, 4, 6, 9 | HM208180 |
| Nasutitermes sp. Cost003 gut clone cs3Csec | FDH-H | Fig. 3, 4, 6, 9 | HM208179 |
| Nasutitermes sp. Cost003 gut clone cs3Isec | FDH-H | Fig. 3, 4, 6, 9 | HM208181 |
| Nasutitermes sp. Cost003 gut clone cs3Psec | FDH-H | Fig. 3, 4, 6, 9 | HM208182 |
| Nasutitermes sp. Cost003 gut clone 3C4cys | FDH-H | Fig. 3, 9 | HM208183 |
| Nasutitermes corniger Cost007 gut clone 7B4sec | FDH-H | Fig. 3, 4, 6, 9 | HM208212 |
| Nasutitermes corniger Cost007 gut clone 7B7sec | FDH-H | Fig. 3, 4, 6, 9 | HM208208 |
| Nasutitermes corniger Cost007 gut clone 7D2sec | FDH-H | Fig. 3, 4, 9 | HM208209 |
| Nasutitermes corniger Cost007 gut clone 7E2cys | FDH-H | Fig. 3, 4, 9 | HM208210 |
| Nasutitermes corniger Cost007 gut clone 7G7sec | FDH-H | Fig. 3, 4, 6, 9 | HM208213 |
| Nasutitermes corniger Cost007 gut clone 7H1cys | FDH-H | Fig. 3, 4, 6, 9 | HM208211 |
| Nasutitermes corniger Cost007 gut clone cs7E6cys | FDH-H | Fig. 3, 4, 6, 9 | HM208207 |
| Nasutitermes corniger Cost007 gut clone cs7F6sec | FDH-H | Fig. 3, 4, 6, 9 | HM208206 |
| Rhynchotermes sp. Cost004 gut clone 4D7cys | FDH-H | Fig. 3, 9 | HM208198 |
| Rhynchotermes sp. Cost004 gut clone 4G3sec | FDH-H | Fig. 3, 4, 7, 9 | HM208199 |
| Rhynchotermes sp. Cost004 gut clone cs457sec | FDH-H | Fig. 3, 4, 7, 9 | HM208194 |
| Rhynchotermes sp. Cost004 gut clone cs489sec | FDH-H | Fig. 3, 4, 6, 9 | HM208196 |
| Rhynchotermes sp. Cost004 gut clone cs4Asec | FDH-H | Fig. 3, 4, 6, 9 | HM208185 |
| Rhynchotermes sp. Cost004 gut clone cs4Bsec | FDH-H | Fig. 3, 4, 7, 9 | HM208189 |
| Rhynchotermes sp. Cost004 gut clone cs4Dsec | FDH-H | Fig. 3, 4, 7, 9 | HM208191 |
| Rhynchotermes sp. Cost004 gut clone cs4Esec | FDH-H | Fig. 3, 4, 7, 9 | HM208187 |
| Rhynchotermes sp. Cost004 gut clone cs4Gsec | FDH-H | Fig. 3, 4, 7, 9 | HM208190 |
| Rhynchotermes sp. Cost004 gut clone cs4Lsec | FDH-H | Fig. 3, 4, 7, 9 | HM208193 |
| Rhynchotermes sp. Cost004 gut clone cs4Msec | FDH-H | Fig. 3, 4, 7, 9 | HM208192 |
| Rhynchotermes sp. Cost004 gut clone cs4Qsec | FDH-H | Fig. 3, 4, 7, 9 | HM208197 |
of Verenium, Inc., in termite collection and site access. Termites from Joshua Tree National Park were collected under permit JOTR-2008-SCI-0002.
Author Contributions
All authors participated in insect collection. XZ and JRL conceived of the experiments. XZ performed the experiments and analyzed the data. XZ and JRL wrote the manuscript.
Competing Interests
The authors have no competing interests.
References
Baumann, P., N. A. Moran, and L. Baumann. 2006. Bacteriocyte-associated endosymbionts of insects, p. 403-438. In M. Dworkin, S. Falkow, E. Rosenberg, K.-H. Schleifer, and E. Stackebrandt (ed.), The Prokaryotes, vol. 1. New York: Springer.
Berlanga, M., B. J. Paster, and R. Guerrero. 2007. Coevolution of symbiotic spirochete diversity in lower termites. International Microbiology 10:133-139.
Brauman, A., J. Dore, P. Eggleton, D. Bignell, J. A. Breznak, and M. D. Kane. 2001. Molecular phylogenetic profiling of prokaryotic communities in guts of termites with different feeding habits. FEMS Microbiology Ecology 35:27-36.
Brauman, A., M. D. Kane, M. Labat, and J. A. Breznak. 1992. Genesis of acetate and methane by gut bacteria of nutritionally diverse termites. Science 257:1384-1387.
Breznak, J. A., and J. R. Leadbetter. 2006. Termite gut spirochetes, p. 318-329. In M. Dworkin, S. Falkow, E. Rosenber, K. H. Schleifer, and E. Stackebrandt (ed.), The Prokaryotes, vol. 7. New York: Springer.
Breznak, J. A., and J. M. Switzer. 1986. Acetate synthesis from H2 plus CO2 by termite gut microbes. Applied and Environmental Microbiology 52:623-630.
Brugerolle, G., and R. Radek. 2006. Symbiotic protozoa of termites, p. 244-269. In H. König and A. Varma (ed.), Intestinal microorganisms of termites and other invertebrates. Springer, Heidelberg, Germany.
Brune, A., and U. Stingl. 2006. Prokaryotic symbionts of termite gut flagellates: phylogenetic and metabolic implications of a tripartite symbiosis. Progress in Molecular and Subcellular Biology 41:39-60.
Buchner, P. 1965. Endosymbiosis of animals with plant microorganisms. Interscience, New York.
Chen, X., S. Li, and S. Aksoy. 1999. Concordant evolution of a symbiont with its host insect species: molecular phylogeny of genus Glossina and its bacteriome-associated endosymbiont, Wigglesworthia glossinidia. Journal of Molecular Evolution 48:49-58.
Colwell, R. K. 2009, posting date. EstimateS: Statistical estimation of species richness and shared species from samples. version 8.2.0. [Online.]
Desai, M. S., J. F. H. Strassert, K. Meuser, H. Hertel, W. Ikeda-Ohtsubo, R. Radek, and A. Brune. 2010. Strict cospeciation of devescovinid flagellates and Bacteroidales ectosymbionts in the gut of dry-wood termites (Kalotermitidae). Environmental Microbiology 12:2120–2132.
Dethlefsen, L., M. Mcfall-Ngai, and D. Relman. 2007. An ecological and evolutionary perspective on human–microbe mutualism and disease. Nature 449:811-818.
Eggleton, P. 2006. The termite gut habitat: Its evolution and co-evolution, p. 373-404. In H. König and A. Varma (ed.), Intestinal microorganisms of termites and other invertebrates. Springer, Heidelberg, Germany.
Eggleton, P., D. E. Bignell, W. A. Sands, N. A. Mawdsley, J. H. Lawton, T. G. Wood, and N. C. Bignell. 1996. The diversity, abundance and biomass of termites under differing levels of disturbance in the Mbalmayo Forest Reserve, southern Cameroon. Philosophical Transactions of the Royal Society B: Biological Sciences 351:51-68.
Engel, M. S., D. A. Grimaldi, and K. Krishna. 2009. Termites (Isoptera): Their phylogeny, classification, and rise to ecological dominance. American Museum Novitates 3650:1-27.
Enquist, C. A. F. 2002. Predicted regional impacts of climate change on the geographical distribution and diversity of tropical forests in Costa Rica. Journal of Biogeography 29:519-534.
Felsenstein, J. 1989. PHYLIP - Phylogeny inference package (version 3.2). Cladistics 5:164-166.
Fishbein, L. 1983. Environmental selenium and its significance. Fundamental and Applied Toxicology. 3:411-419.
Grimaldi, D., and M. S. Engel. 2005. Evolution of the insects. New York: Cambridge University Press.
Hernes, P. J., and J. I. Hedges. 2004. Tannin signatures of barks, needles, leaves, cones, and wood at the molecular level. Geochimica et Cosmochimica Acta 68:1293-1307.
Holdridge, L. R., W. C. Grenke, W. H. Hatheway, and J. A. Tosi. 1971. Forest environments in tropical life zones. A pilot study. New York: Pergamon Press.
Hongoh, Y., M. Ohkuma, and T. Kudo. 2003. Molecular analysis of bacterial microbiota in the gut of the termite Reticulitermes speratus (Isoptera; Rhinotermitidae). FEMS Microbiology Ecology 44:231-242.
Hongoh, Y., P. Deevong, T. Inoue, S. Moriya, S. Trakulnaleamsai, M. Ohkuma, C. Vongkaluang, N. Noparatnaraporn, and T. Kudo. 2005. Intra-and interspecific comparisons of bacterial diversity and community structure support coevolution of gut microbiota and termite host. Applied and Environmental Microbiology 71:6590-6599.
Jones, J. B., and T. C. Stadtman. 1981. Selenium-dependent and selenium-independent formate dehydrogenases of Methanococcus vannielii. Separation of the two forms and characterization of the purified selenium-independent form. The Journal of Biological Chemistry256:656-663.
Kambhampati, S., and P. Eggleton. 2000. Taxonomy and phylogeny of termites, p. 1-24. In T. Abe, D. E. Bignell, and M. Higashi (ed.), Termites: Evolution, Sociality, Symbioses, Ecology. Kluwer Academic Publishers, Dordrecht, The Netherlands.
Larkin, M. A., G. Blackshields, N. P. Brown, R. Chenna, P. A. McGettigan, H. McWilliam, F. Valentin, I. M. Wallace, A. Wilm, R. Lopez, J. D. Thompson, T. J. Gibson, and D. G. Higgins. 2007. Clustal W and Clustal X version 2.0. Bioinformatics 23:2947-2948.
Leadbetter, J. R., T. M. Schmidt, J. R. Graber, and J. A. Breznak. 1999. Acetogenesis from H2 plus CO2 by spirochetes from termite guts. Science 283:686-689.
Lilburn, T. G., T. M. Schmidt, and J. A. Breznak. 1999. Phylogenetic diversity of termite gut spirochaetes. Environmental Microbiology 1:331-345.
Lo, N., and P. Eggleton. 2011. Termite phylogenetics and co-cladogenesis with symbionts, pp. 27-50. In D. E. Bignell, Y. Roisin, and N. Lo (ed.), Biology of Termites: A Modern Synthesis. Springer, Dordrecht, Netherlands.
Lozupone, C., and R. Knight. 2005. UniFrac: a new phylogenetic method for comparing microbial communities. Applied and Environmental Microbiology 71:8228-8235.
Ludwig, W., O. Strunk, R. Westram, L. Richter, H. Meier, Y. Kumar, A. Buchner, T. Lai, S. Steppi, G. Jobb, W. Förster, I. Brettske, S. Gerber, A. W. Ginhart, O. Gross, S. Grumann, S. Hermann, R. Jost, A. König, T. Liss, R. Lüßmann, M. May, B. Nonhoff, B. Reichel, R. Strehlow, A. Stamatakis, N. Stuckmann, A. Vilbig, M. Lenke, T. Ludwigh, A. Bode, K-H. Schleifer. 2004. ARB: a software environment for sequence data. Nucleic Acids Research 32:1363-1371.
Lugo, A. E., S. L. Brown, R. Dodson, T. S. Smith, and H. H. Shugart. 1999. The Holdridge life zones of the conterminous United States in relation to ecosystem mapping. Journal of Biogeography 26:1025-1038.
Masscheleyn, P. H., R. D. Delaune, and W. H. Patrick. 1990. Transformations of selenium as affected by sediment oxidation-reduction potential and pH. Environmental Science& Technology 24:91-96.
Matson, E. G., E. Ottesen, and J. R. Leadbetter. 2007. Extracting DNA from the gut microbes of the termite Zootermopsis nevadensis. Journal of Visualized Experiments 4:195.
Matson, E. G., X. Zhang, and J. R. Leadbetter. 2010. Selenium controls transcription of paralogous formate dehydrogenase genes in the termite gut acetogen, Treponema primitia. Environmental Microbiology 12:2245-2258.
McFall-Ngai, M. 2002. Unseen forces: the influence of bacteria on animal development. Developmental Biology 242:1-14.
Mira, A., H. Ochman, and N. A. Moran. 2001. Deletional bias and the evolution of bacterial genomes. Trends in Genetics 17:589-596.
Miura, T., K. Maekawa, O. Kitade, T. Abe, and T. Matsumoto. 1998. Phylogenetic relationships among subfamilies in higher termites (Isoptera: Termitidae) based on mitochondrial COII gene sequences. Annals of the Entomological Society of America 91:515-521.
Miura, T., Y. Roisin, and T. Matsumoto. 2000. Molecular phylogeny and biogeography of the Nasute termite genus Nasutitermes (Isoptera: Termitidae) in the Pacific Tropics. Molecular Phylogenetics and Evolution 17:1-10.
Miyata, R., N. Noda, H. Tamaki, K. Kinjyo, H. Aoyagi, H. Uchiyama, and J. Tanaka. 2007. Influence of feed components on symbiotic bacterial community structure in the gut of the wood-feeding higher termite Nasutitermes takasagoensis. Bioscience, Biotechnology, and Biochemistry 71:1244-1251.
Moran, N. A. 2002. Microbial minimalism: genome reduction in bacterial pathogens. Cell 108:583-6.
Moran, N. A., and P. Baumann. 2000. Bacterial endosymbionts in animals. Current Opinion in Microbiology 3:270-275.
Moran, N. A., and A. Telang. 1998. Bacteriocyte-associated symbionts of insects. Bioscience 48: 295-304.
Moran, N. A., H. J. McLaughlin, and R. Sorek. 2009. The dynamics and time scale of ongoing genomic erosion in symbiotic bacteria. Science 323:379-382.
Nalepa, C., and C. Bandi. 2000. Characterizing the ancestors: Paedomorphosis and termite evolution, p. 53-77. In T. Abe, D. E. Bignell, and M. Higashi (ed.), Termites: Evolution, Sociality, Symbioses, Ecology. Kluwer Academic Publishers, Dordrecht, Netherlands.
Noda, S., O. Kitade, T. Inoue, M. Kawai, and M. Kanuka. 2007. Cospeciation in the triplex symbiosis of termite gut protists (Pseudotrichonympha spp.), their hosts, and their bacterial endosymbionts. Molecular Ecology 16:1257-1266.
Nriagu, J. O. 1989. Global cycling of selenium, p. 327-340. In M. Ihnat (ed.), Occurrence and Distribution of Selenium. CRC Press, Boca Baton, Florida.
Odelson, D. A., and J. A. Breznak. 1983. Volatile fatty acid production by the hindgut microbiota of xylophagous termites. Applied and Environmental Microbiology 45:1602-1613.
Ohkuma, M., T. Iida, and T. Kudo. 1999. Phylogenetic relationships of symbiotic spirochetes in the gut of diverse termites. FEMS Microbiology Letters 181:123-129.
Ohkuma, M., Y. Hongoh, and T. Kudo. 2006. Diversity and molecular analyses of yet-uncultivated microorganisms, p. 303-317. In H. König and A. Varma (ed.), Intestinal microorganisms of termites and other invertebrates. Springer, Heidelberg, Germany.
Ohkuma, M., S. Noda, Y. Hongoh, C. A. Nalepa, and T. Inoue. 2009. Inheritance and diversification of symbiotic trichonymphid flagellates from a common ancestor of termites and the cockroach Cryptocercus. Proceedings of the Royal Society B: Biological Sciences 276:239-245.
Ottesen, E. A., and J. R. Leadbetter. 2011. Formyltetrahydrofolate synthetase gene diversity in the guts of higher termites with different diets and lifestyles. Applied and Environmental Microbiology 77:3461-3467.
Pester, M., and A. Brune. 2007. Hydrogen is the central free intermediate during lignocellulose degradation by termite gut symbionts. ISME Journal 1:551-565.
Schloss, P. D., and J. Handelsman. 2005. Introducing DOTUR, a computer program for defining operational taxonomic units and estimating species richness. Applied and Environmental Microbiology 71:1501-1506.
Shigenobu, S., H. Watanabe, M. Hattori, Y. Sakaki, and H. Ishikawa. 2000. Genome sequence of the endocellular bacterial symbiont of aphids Buchnera sp. APS. Nature 407:81-86.
Stamatakis, A.P., T. Ludwig, and H. Meier. 2004. The AxML program family for maximum likelihood-based phylogenetic tree inference. Concurrency and Computation: Practice and Experience 16:975-988.
Sudhaus, W. 2004. Radiation within the framework of evolutionary ecology. Organisms Diversity & Evolution 4:127-134.
Valente, F. M., C. C. Almeida, I. Pacheco, J. Carita, L. M. Saraiva, and I. A. Pereira. 2006. Selenium is involved in regulation of periplasmic hydrogenase gene expression in Desulfovibrio vulgaris Hildenborough. Journal of Bacteriology 188:3228-3235.
Van Wees, S. C. M., S. Van der Ent, and C. M. J. Pieterse. 2008. Plant immune responses triggered by beneficial microbes. Current Opinion in Plant Biology 11:443-448.
Vorholt, J. A., M. Vaupel, and R. K. Thauer. 1997. A selenium-dependent and a selenium-independent formylmethanofuran dehydrogenase and their transcriptional regulation in the hyperthermophilic Methanopyrus kandleri. Molecular Microbiology 23:1033-1042.
Warnecke, F., P. Luginbühl, N. Ivanova, M. Ghassemian, T. Richardson, J. T. Stege, M. Cayouette, A. C. McHardy, G. Djordjevic, N. Aboushadi, R. Sorek, S. G. Tringe, M. Podar, H. G. Martin, V. Kunin, D. Dalevi, Julita Madejska, E. Kirton, D. Platt, E. Szeto, A. Salamov, K. Barry, N. Mikhailova, N. C. Kyrpides, E. G. Matson, E. A. Ottesen, X. Zhang, M. Hernandez, C. Murillo, L. G. Acosta, I. Rigoutsos, G. Tamayo, B. D. Green, C. Chang, E. M. Rubin, E. J. Mathur, D. E. Roberton, P. Hugenholtz, and J. R. Ledbetter. 2007. Metagenomic and functional analysis of hindgut microbiota of a wood-feeding higher termite. Nature 450:560-565.
Wernegreen, J. J. 2002. Genome evolution in bacterial endosymbionts of insects. Nature Reviews Genetics 3:850-861.
Wu, D., S. C. Daugherty, S. E. Van Aken, G. H. Pai, K. L. Watkins, H. Khouri, L. J. Tallon, J. M. Zaborsky, H. E. Dunbar, P. L. Tran, N. A. Moran, and J. A. Eisen. 2006. Metabolic complementarity and genomics of the dual bacterial symbiosis of sharpshooters. PLoS Biology. 4:e188.
Yamada, A., T. Inoue, S. Noda, Y. Hongoh, and M. Ohkuma. 2007. Evolutionary trend of phylogenetic diversity of nitrogen fixation genes in the gut community of wood-feeding termites. Molecular Ecology 16:3768-3777.
Yang, H., D. Schmitt-Wagner, U. Stingl, and A. Brune. 2005. Niche heterogeneity determines bacterial community structure in the termite gut (Reticulitermes santonensis). Environmental Microbiology 7:916-932.
Zhang, X., E. G. Matson, and J. R. Leadbetter. 2011. Genes for selenium dependent and independent formate dehydrogenase in the gut microbial communities of three lower, wood-feeding termites and a wood-feeding roach. Environmental Microbiology 13:307-323.
Zinoni, F., A. Birkmann, T. C. Stadtman, and A. Böck. 1986. Nucleotide sequence and expression of the selenocysteine-containing polypeptide of formate dehydrogenase (formate-hydrogen-lyase-linked) from Escherichia coli. Proceedings of the National Academy of Sciences USA 83:4650-4654.
MATHEMATICAL AND COMPUTATIONAL CHALLENGES IN THE STUDY OF COMPLEX ADAPTIVE MICROBIAL SYSTEMS
Simon A. Levin,51Juan A. Bonachela,51and Carey D. Nadell51
Introduction
Microbial systems, like all ecological systems, are examples of what have been termed complex adaptive systems; that is, they are made up of individual agents whose localized interactions have consequences at higher levels of organization, and these higher-level properties feed back to affect individual behaviors and local interactions (Levin, 1998, 1999). In such systems, as in physical and socio-economic systems, macroscopic patterns emerge from microscopic interactions, to some extent independently of the microscopic details. Understanding how that occurs is a fundamental challenge, creating a need for a statistical mechanics of these heterogeneous systems, building from individual agents to their collective dynamics.
But the search for a unifying framework must go beyond naïve reductionism, elucidating those emergent properties that are not evident in the properties of the individual agents. The Nobel Prize–winning physicist Phil Anderson, in an insightful and influential paper simply called “More Is Different,” published 40 years ago, highlighted the novel challenges (Anderson, 1972). Anderson wrote that “the ability to reduce everything to simple fundamental laws does not imply the ability to start from those laws and reconstruct the universe.” He goes on to write, “the constructionist hypothesis breaks down when confronted with the twin difficulties of scale and complexity.” These are the features that we will explore in this paper.
For biological systems, shaped by evolution, the problem of scale is central, and raises unique challenges (Levin, 1992). In particular, individuals live in groups of other individuals, all of which have interlocking fitnesses. What is good for the individual is not necessarily good for the group, yet somehow features that are in the collective good are often maintained. How does this occur? How strong are evolutionary forces above the level of the individual? What game-theoretic compromises are achieved that sustain cooperation, and when does cooperation fail in dealing with these problems of the biological commons?
___________
51 Princeton University.
Emergence and Scaling
The implication of Anderson’s thesis is that complex adaptive systems exhibit properties that are emergent, meaning that they are not trivially deduced from the properties of individual agents. Collective motion of many similar individuals provide striking examples of such emergence, and have drawn mathematicians, physicists, and computer scientists to the study of such collective motion in organisms ranging from bacteria and cellular slime molds to invertebrate and vertebrate animals. Humans also provide fascinating study organisms, a theme to which we will return. One of the simplest examples of collective motion is provided by the moving fronts of bacteria, to which we turn in the next section.
Bacterial Fronts
Most microbial organisms exist within a social context, and bacteria are prime examples. Classical theories of invading fronts of organisms (or alleles) take the perspective of diffusive spread of non-interacting individuals (Fisher, 1937; Kolmogorov et al., 1937; Skellam, 1951), leading to smooth convex boundaries for the spreading fronts. But the assumption of independence naturally breaks down even for bacteria, which in reality exhibit a whole spectrum of nontrivial patterns depending on the growth conditions.
Imagine a bacterial colony growing on a petri dish. In such an experiment, the concentration of two principal substances deeply influences the spatio-temporal emergent pattern of the colony. On one hand, the colony grows on an agar plate, and the agar concentration determines the mobility of the bacterial cells: the larger the agar concentration, the harder the substratum becomes and the more difficult it is for cells to move. On the other hand, the nutrient concentration influences cell growth: the larger the nutrient concentration, the larger the growth rate of cells. Both physical and biological factors determine the final pattern of the colony. In laboratory experiments with Bacillus Subtilis, Fujikawa and Matsushita (Fujikawa and Matsushita, 1989) showed that variation in the concentrations of agar (CA) and nutrient (C) indeed results in substantially different spatial configurations of bacterial colonies, defining in this way a two-dimensional morphological phase diagram (see Figure A13-1) (Fujikawa, 1994; Fujikawa and Matsushita, 1989; Wakita et al., 1997):
- In the zone of low agar concentration and low nutrient concentration (zone I), nutrients rapidly become scarce near cells, but the cells can move in search of zones with more favorable growth conditions. As a result, the colony expands, forming numerous thin branches (Ben-Jacob and Garik, 1990).
- When agar density is low but nutrient concentration is high (zone II), there is little or no limitation of localized cell growth, as bacteria always find themselves in relatively nutrient-rich microenvironments. Consequently, the spatial configuration of the colony shows a compact, solid circular pattern.
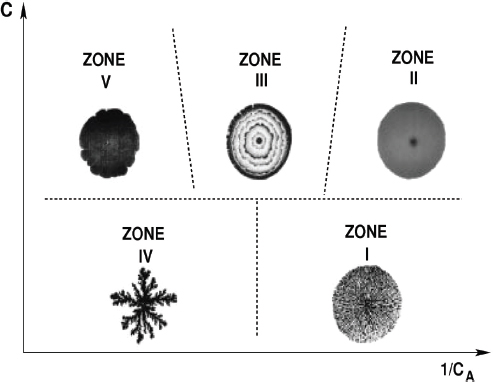
FIGURE A13-1 Morphological phase diagram depicting the five different qualitative behaviors shown by bacterial colonies growing under different agar concentration (CA) and nutrient concentration (C).
SOURCE: Adapted with permission from (Shimada et al., 2004), with copyright by the Physical Society of Japan.
- At medium agar concentrations and mid-to-high nutrient availability (zone III), the colony grows in episodic bursts, with alternating static and motile stages. Thus, the colony develops characteristic concentric rings (Fujikawa, 1992; Shimada et al., 2004).
- For high agar density, cells cannot move because of the hardness of the substratum. Therefore, bacteria can only grow where nutrients arrive by diffusion and, at small nutrient concentrations (zone IV), the colony grows in sparse, thick branches (Ben-Jacob and Garik, 1990; Fujikawa, 1994; Wakita et al., 1997).
- Finally, for high agar concentration and mid-to-high nutrient concentration (zone V), cells still remain unable to disperse effectively to find nutrient-rich patches because of their reduced motility. The colony shows a spatial pattern that is compact due to the higher levels of nutrient concentration, but rough at the interface between the colony and the surrounding medium because of enhanced competition between neighboring cells (Cserzö et al., 1990; Wakita et al., 1997).
In the early experimental work mentioned above, it was also shown that these patterns are fractal objects (Barabási and Stanley, 1995). Fractals are objects whose dimension (called fractal dimension) is fractional and smaller than the smallest spatial dimension they can be embedded in. An important property of fractal objects is that they are usually self-similar; that is, they show similar qualitative aspect at any scale of observation. Indeed, two-dimensional bacterial patterns such as those of zone IV have a fractal dimension smaller than 2 (specifically, 1.716±0.008 [Fujikawa and Matsushita, 1989]) and, as will be discussed below, some of its properties scale following a power law, a mathematical function whose shape remains invariant under changes in the scale of observation. These are examples of emergent properties, unlikely to have been selected for at the level of individuals, or indeed at higher levels.
Qualitative Understanding of the Colony Patterns
The complexity of bacterial colony patterns and the different biological mechanisms involved in their generation has attracted the attention of theoreticians from many disciplines. Physicists, chemists, and biologists have developed various models intended to replicate the qualitative behaviors shown in the morphological phase diagram.
Among the different approaches available in the literature, it is possible to find models that include complex physical ingredients (such as fluctuation-generated instabilities during cell diffusion [Kessler and Levine, 1998]) or biological mechanisms (e.g., cooperativity due to chemotactic signaling [Ben-Jacob and Garik, 1990]), with the aim of reproducing specific parts of the phase diagram; and more general models that attempt to replicate the whole picture portrayed in Figure 13A-1. Matsushita et al. (1998), for instance, developed a reaction-diffusion model able to generate patterns resembling those of the five zones described above. In the model, three different species or fields are defined at every time t and position r on the agar plate: bacteria that have access to the nutrient and, therefore, are physiologically active (i.e., can grow and reproduce), b(r,t); inactive bacteria, s(r,t); and the nutrient concentration field, which can diffuse and is consumed by the active cells, n(r,t). Thus, the set of interactions between these fields is given by:
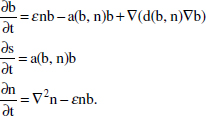
The first term of the active bacteria equation represents the dependence of growth on nutrient availability.52 The second term is the mortality term due to the lack of nutrient (the only term in the s(r,t) field equation). The third term is the diffusion term, whose exact shape is the key to reproduce the different colony patterns observed. For the nutrient concentration dynamics, the diffusivity parameter of the nutrient is constant, and therefore we find in that equation the classic diffusion term, together with the reduction of nutrient due to bacterial consumption and growth. If d(b,n) is considered constant, just fine-tuning its value and the concentration of nutrient far from the interface between the colony and nutrient medium (bulk nutrient concentration) is enough to reproduce qualitative patterns similar to those of zones I-IV. As d represents the ability of cells to move, this fine-tuning is equivalent to moving through the phase diagram by varying agar and nutrient concentrations as explained above. To reproduce zone V, it is necessary to include an explicit dependence of d on the active-bacteria field. A simple proportionality suffices to reproduce the characteristic rough compact patterns (Matsushita et al., 1998).
The Need for a Correct Quantitative Description
Reaction-diffusion models like that introduced above, which include the basic biological and physical ingredients, are able to reproduce successfully the qualitative features of the bacterial colony morphological phase diagram. However, the question remains as to whether the theoretical colony patterns are truly representative of their empirical counterparts and, therefore, whether the models reveal the true processes involved in the formation of colony patterns. Thus, it is necessary to move to a more quantitative description of the system based on the measurement of observables that allow for an objective comparison between experiments and models. A quantitative framework may also help to identify similarities with other systems, from which can be gained further understanding of the physics and biology of bacterial colonies.
For instance, the measurement of the fractal dimension of colonies in zone IV led to the identification of those patterns with the so-called diffusion-limited aggregation (DLA) patterns (Ben-Jacob and Garik, 1990; Fujikawa, 1994; Wakita et al., 1997; Witten and Jr., 1981). Thus, it can be deduced that, as happens in DLA systems, the shape of the colony in that zone is mainly determined by the diffusion of (severely limited) nutrients and relative immobility of bacterial cells.
However, for the zones in which colonies form a “less singular” compact pattern (zones II and V), the definition of more specific observables is needed. To
___________
52 For simplicity, the authors in Matsushita et al. (1998) used a linear dependence of bacterial growth on the nutrient concentration (with e being a constant), but more complicated terms can be defined instead, such as the classic Monod functional form, mmaxn/(n+K), where mmax is the maximum growth rate and K is the half-saturation constant (the value of the nutrient concentration at which growth equals mmax/2) (Monod, 1950).
this end, the propagating-front theory of nonliving systems, from statistical mechanics, can be used because of the similarity between these fronts and the front of active bacteria propagating on the agar plate. If the colony is initiated from a stripe-like inoculum, the advance of the front can be described by using the distance between the top of the cell group and the initial inoculum at each time, h(x,t), where x is the horizontal coordinate at the basal substratum (see Figure A13-2). The variance in this surface height, called interface width or roughness, is the main observable with which the front will be characterized:
![]()
where the brackets represent an average over different replicates of the experiment, and the overline represents spatial averages. When the front where the roughness is measured is a fractal object (see above), the roughness follows the so-called Family-Vicsek scaling relations:
![]()
where b and a are the growth and roughness exponents, respectively, and L is the system size, in this case the horizontal length of the inoculum. Thus, W(L,t) grows with time according to the power law above, reaching a saturating value at t=tx that scales with the system size. Straightforwardly, tx=Lz, where z=a/b is called the dynamic exponent. The set of exponents characterizes the behavior of the system. Therefore, two systems showing the same set of exponents will, asymptotically, behave in the same way at a large enough scale of observation, regardless of differences in the microscopic details of the dynamics of each system. Using statistical physics terminology, they show the same universal behavior or, in other words, they belong to the same universality class.
The classification of the patterns into the correct universality class is important for the understanding of colony formation: in the physics literature there are many classes that show, for instance, a compact, rough configuration, but belong to different universality classes; that is, the relevant ingredients necessary to generate them (i.e., the relevant biological and physical processes involved in their formation) are very different (Barabási and Stanley, 1995). Unfortunately, so far only one exponent has been measured experimentally, which is insufficient to determine the universal behavior of the patterns in zone II and V (Cserzö et al., 1990; Wakita et al., 1997). Moreover, that exponent has been measured by using different parts of the same system for the finite-size scaling, and, in consequence, it is a local version of the roughness exponent at, As explained in (López, 1999; López et al., 1997), systems with standard roughening fulfill a=aloc, but others present what is called anomalous roughening, i.e., a≠aloc. In summary, more experimental exponents are needed, because only one exponent is available and it is not necessarily representative of the behavior of the whole system.
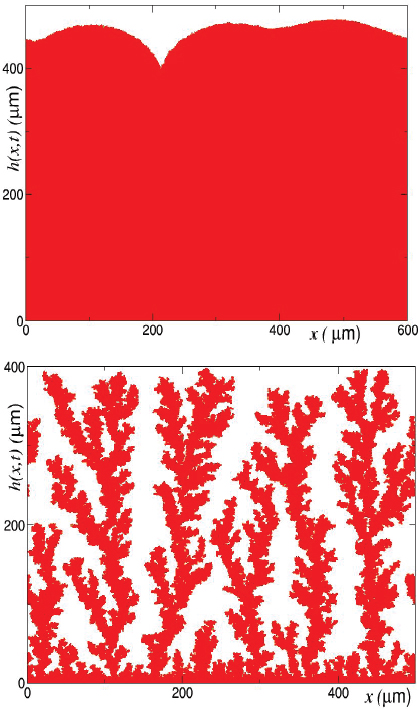
FIGURE A13-2 Snapshots of the bacterial colonies obtained in (Bonachela et al., 2011) with the detailed simulation framework described in the text. The framework is designed to replicate high agar growing conditions and, therefore, the fine-tune of the nutrient concentration generates patterns that can be classified in zones V (left) or IV (right).
The Universal Behavior of Zone-V Colonies
Theoretical efforts to classify zones IV and V into universality classes have followed two different approaches. On one hand, some have introduced mathematical models, replicated with them the procedures and measurements of the experimental work, and used the value of the resulting roughness exponent (Lacasta et al., 1999); the results are very close to the experiments, but are subject to the same limitations (see above). On the other hand, other models have been analyzed as physical systems, and the three global exponents presented above have been measured (Kobayashi et al., 2004); however, without measuring local exponents as well, a reliable comparison with experiments cannot be made.
In a theoretical attempt to tackle this problem, Bonachela et al. used a very biologically detailed individual-based model as a proxy for real experiments and measured the complete set of exponents including the local roughness (Bonachela et al., 2011). The model is constrained to high agar concentration conditions, because the cells cannot actively move (see below). Thus, the research focused on the determination of the universal behavior of patterns in zone V.
The model keeps track of each individual cell in the colony (Xavier et al., 2005b): each can grow at a rate imposed by a Monod functional dependence on the nutrient concentration experienced by each cell (see footnote above); when cells double their size, they divide into two daughter cells. As the model uses an off-lattice representation of space (i.e., cells are like rigid circles in a continuous space), a random shoving algorithm is implemented to prevent overlapping between cells during their growth and division. For the nutrient concentration, the model uses a continuous equation similar to that of the reaction-diffusion model presented above. See the Biofilm section below for more details.
The ability of the system to reproduce the high-agar regime is shown in Figure A13-2. The two colonies presented there are snapshots taken from this detailed simulation framework. As we can see, very low nutrient concentrations produce patterns resembling those of zone IV, while larger concentrations move the system to zone V. The exponents measured with the model in that regime can be found in Table A13-1. Those exponents are, within error bars, in agreement with the critical exponents of the so-called quenched Kardar-Parisi-Zhang universality class (qKPZ) (Csahók et al., 1993). Interfaces in the qKPZ class can be described by the following mesoscopic equation for the interface position:
![]()
where D, λ, F, and s are constants, and η is a noise term that only varies when the interface changes, i.e., a quenched noise. In other words, these interfaces are characterized by their diffusion (first term), lateral growth (second term), a constant pulling force (third term), and a quenched noise that prevents or facilitates their advance, depending on its sign. In bacterial colonies in zone V, diffusion
TABLE A13-1 Exponents Measured in the Different Theoretical and Experimental Work Cited in the Text (Bonachela et al. 2011). Only a comprehensive measurement of both local and global exponents can characterize completely the universal behavior of the colony, which, in the case of zone V patterns under mid-to-low nutrient concentration, belongs to qKPZ. See text for more details.
| β | α | z | αloc | Standard Self-Affinity | |
| KPZ (Kardar et al., 1986) | 1/3 | 1/2 | 3/2 | 1/2 | √ |
| qKPZ (Csahók et al., 1993) | 3/5 | 3/4 | 5/4 | 3/4 | √ |
| Experiments (Cserzö et al., 1990; Wakita et al., 1997) | — | — | — | 0.74-0.78(7) | ? |
| Theoretical Work | 0.65 (Kobayashi et al., 2004), 0.61(5) (Bonachela et al., 2011) | 0.80 (Kobayashi et al., 2004), 0.68(5) (Bonachela et al., 2011) | 1.15 (Kobayashi et al., 2004), 1.11(17) (Bonachela et al., 2011) | 0.68(5) (Bonachela et al., 2011) | √ (Bonachela et al., 2011) |
and lateral growth are due to the shoving between cells, and the pulling force can be related to their growth. The origin of the quenched noise is more difficult to identify. In previous work that pointed to qKPZ as universality class for zone V (Barabási and Stanley, 1995; Kobayashi et al., 2004; Lacasta et al., 1999), it has been argued that it can be related to, for instance, heterogeneities in the agar plate. However, in the framework used in (Bonachela et al., 2011), agar is not explicitly present, but still qKPZ exponents are measured.
The authors argue that quenchedness is an emergent property of the bacterial colony in zone V, not of the medium. The competition for the resource is responsible for a feedback effect that may mimic the quenched noise (see Figure A13-3) 53: for intermediate nutrient concentrations, it is easy for the interface to develop irregularities. Nutrient diffusion to the deeper zones of the interface is prevented by cells at the upper zones of the colony, which have better access to (and consume) the bulk nutrient concentration, growing in consequence faster. Thus, competition for resource generates a differential growth rate along the interface that is enhanced by the different access to the available nutrient, emerging in this way effective pinning points that imitate quenched disorder.
Bonachela et al. further build on the comparison with qKPZ systems. Equivalent to increasing the pulling force in nonliving interfaces, when nutrient concentration is larger cells have a better access to the nutrient and, eventually, the interface can overcome the pinning points. Eventually, the quenched disorder becomes irrelevant, and the randomness of the (now much more frequent) shoving events arises as the only source of noise in the system. That influences the universal behavior of the system, whose mesoscopic equation is now that of qKPZ (see above) with the quenched noise replaced by a thermal noise, i.e., a noise term that changes with time. Systems with that mesoscopic behavior belong to the so-called KPZ universality class (Kardar et al., 1986). Actually, this class has traditionally been associated with bacterial colonies, as the classic toy model used to replicate qualitatively the compact patterns of zone V, the Eden model, belongs to that universality class (Eden, 1961; Jullien and Botet, 1985; Paiva and Ferreira, 2007). Finally, for very large values of F, qKPZ systems develop a flat interface that moves fast; Bonachela et al. reported flat colony–medium interfaces when the nutrient concentration is very large, due to maximal growth rate of the cells along the bacterial interface, which now can access the same large amount of nutrient (Bonachela et al., 2011).
Further Work and Questions
The fascinating morphology of bacterial colonies growing on agar plates has been the focus of intense study for the past two decades. Experiments have made
___________
53 This is in accordance with the necessity of a dependence of d on b in the reaction-diffusion model presented above.
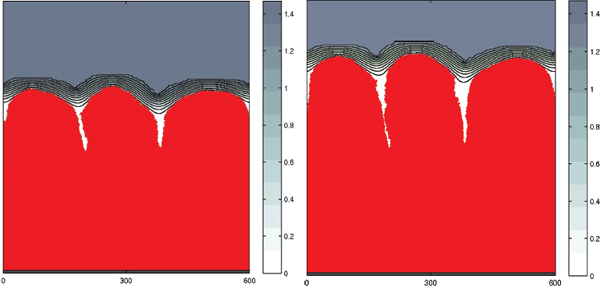
FIGURE A13-3 Bacterial fronts obtained in (Bonachela et al., 2011) with the simulation framework using mid-to-low nutrient concentrations, with an elapse of time of 8 hours. Cells at the deepest parts of the front (valleys) deplete completely the available nutrient, while cells at the upper zones prevent it from diffusing into the valleys. Cells at the bottom, consequently, stop growing, generating pinning points for the advance of the interface. The differential access to nutrient generates the differential growth rate responsible for this feedback effect.
it possible to identify five different qualitative behaviors, which can be reproduced with theoretical models. However, as argued in (Bonachela et al., 2011), a closer look at the quantitative behavior of the colony may reveal that these zones are much richer in phenomenology than expected from a qualitative point of view. Zone V has traditionally been considered to belong to the KPZ universality class based on the similarities between KPZ interfaces and colonies in this zone. Thus, all the phenomenology associated with strong competition for the resource, which generates the emerging pinning points for the interface, has been overlooked. The qKPZ behavior measured in (Bonachela et al., 2011) facilitates the connection between the KPZ behavior observed for nutrient-rich situations with the DLA behavior under strong limitation: as nutrient concentration is lowered, not only do pinning points emerge and form “valleys” in the interface, but also those valleys open further and further, forming fingers that eventually transform into the thick branches of zone IV.
Thus, it would be interesting to check what such a quantitative approach reveals in the rest of the morphological phase diagram when used with the theoretical models existing in the literature. For this purpose, the versatile reaction-diffusion model discussed above would be an excellent candidate to be used.
On the other hand, an experimental test of the theoretical results is needed. To this end, long-term growth and many replicas with nutrient and agar concentrations sweeping the entire phase diagram are needed in order to measure correctly the whole set of global and local exponents. However, such experiments must confront many unexpected constraints that preclude them from reproducing the ideal conditions represented in the models. Agar dryness, bacterial and fungal contamination, and the appearance of mutant bacterial cells with different growth rates during long time courses all introduce new ingredients with nontrivial effects on the behavior of the colony, no longer fully determined only by agar and nutrient concentrations.
The use of quantitative approaches like the one proposed in (Bonachela et al., 2011), for both theoretical models and experiments, may allow for a continuous description of the universal behavior of bacterial colonies with which to improve our understanding of the physical and biological mechanisms operating at each growth condition.
Collective Motion More Generally
As mentioned earlier, pattern formation in collective motion has been addressed theoretically for almost every taxon. Most generally, the problem is to elucidate the relationships between an individual agent, how it responds to its environment and the macroscopic properties of ensembles of such agents.
A natural framework exists in fluid mechanics from making these transitions, built on the duality between the Lagrangian (individual-based) and Eulerian perspectives. In short (Grünbaum, 1992; Grünbaum and Okubo, 1994), one
begins from an agent-based description of a population of organisms, for example (Grünbaum, 1992) in which each organism acceleration satisfies Newton’s law
![]()
in which Fi can represent random forces, taxis, grouping behavior, or other forces acting on the individual. One then can derive equations for statistical ensembles of such individuals, and then derive Eulerian population descriptions for the density functions of individuals across space.
More generally (Flierl et al., 1999), one can attempt to use the continuum equation
![]()
in which the flux J depends on ρ through a functional. More specifically, the spatial-velocity density function n(r, v, t+δt) for the position and velocity of the distribution of particles is expressed as an integral over all (r′, v′, t) of the density function at time t multiplied by the probability of transition to the new position and velocity (r,v) in time δt. The appropriate continuum equation is then derived by making assumptions that allow closure, for example that local densities are Poisson. One of the most successful applications of the continuum method was due to Keller and Segel (Keller and Segel, 1971), who derived a model for chemotaxis, in part to set the stage for work on myxamebae. Their paper has inspired considerable later work and has become a classic of the literature.
Consensus and Collective Motion
The continuum method works well for populations of identical agents; but real populations are heterogeneous, made up of individuals with different amounts of information, and different strategies for navigating their environments. For such situations, a good starting point is still an agent-based (individual-based) model (Couzin et al., 2005; DeAngelis and Gross, 1992), although various strategies exist for analytical approximation (Kevrekidis, 2002, 2003; Moon et al., 2007; Nabet et al., 2009; Raghib et al., 2010). The approach has been applied to organisms ranging from large vertebrates to microbes.
In the agent-based framework for collective motion and consensus explored by (Couzin et al., 2005), each individual is associated with a velocity vector at time t, and updates that at time t +δt according to a rule that balances information about the environment and information about the positions and velocities of neighbors. Every individual has a unique velocity vector; and equally importantly, every individual has a unique context within the population, unique information about the environment, and unique rules for balancing the various kinds of information and changing direction. Depending on the rules, groups can undergo fission and fusion, but consensus arises under a wide range of conditions.
Interestingly, consensus is facilitated when a large fraction of the population is “unopinionated”—that is, not strongly influenced by external information or biases, and whose movements are largely determined by what neighbors do. In the absence of these neutral individuals, groups are more likely to split; and when consensus does occur, it is strongly influenced by how strongly held opinions are. That is, if the majority of individuals is inclined to move in one direction, but a minority of individuals is more strongly committed to another direction, then the group may move in the minority direction. Increasing the number of neutral “followers,” however, both promotes consensus and makes it more likely that the majority viewpoint will prevail (Couzin et al., 2011).
Robustness
Complex systems in general, and complex adaptive systems in particular, are characterized by nonlinearities that can cause systems to flip from one pattern of behavior to another—in the mathematical jargon, from one basin of attraction to another. One need look no further than the collapse of financial markets in 2008 to understand the potential for contagion and systemic risk in over-connected networks (May et al., 2008). Positive feedbacks can exaggerate deviations from normative behavior, but so too can negative feedbacks that lead to overcompensation (May, 1974). A classic example involves the collapse of the Tacoma Narrows Bridge in Washington State, the result of a dynamic instability. The loss of robustness may lead not only to system flips, but also to hysteresis: one cannot necessarily simply retrace the steps that led to collapse to affect a recovery.
Not all system flips are bad: an economy locked in recession, or cultures locked in long-lasting conflict, can benefit from system flips. But most of the recent attention to so-called “phase transitions” has been associated with the loss of robustness of desirable states—eutrophication of oligotrophic lakes, desertification of fertile areas, disease outbreaks, collapse of fisheries, shifts in ocean circulation patterns, or even the onset of migraines or epileptic seizures. Many, but not all, such transitions are preceded by early-warning indicators—“critical slowing down,” flickering between basins of attraction, or changes in autocorrelation patterns (Scheffer and Carpenter, 2003). This is a rich and rapidly developing area in complex systems theory, although one must be cautious to avoid the excesses that followed earlier attempts to classify transitional behaviors (Thom, 1969; Zeeman, 1981).
Robustness (often called “resilience” in the ecological literature) (Carpenter and Brock, 2004; Holling, 1973; Levin and Lubchenco, 2008; Walker et al., 1997) is defined as the ability of a system to continue functioning in the face of perturbations, extrinsic or intrinsic. It combines both resistance to displacement from normal functioning and the ability to recover from perturbation if resistance has failed. This duality is matched by a duality in strategies: Achieving resistance may be best if concern is for the short term, whereas achieving the
ability to recover may be best on longer time scales. Ultimately, most organisms balance traits of both kinds in their evolutionary repertoires. For example, influenza and other viruses have evolved strategies to help resist the capability of the immune system to neutralize them (Nara et al., 2010), but also rely on mutation and reassortment to present new challenges (Earn et al., 2002). Similarly, the vertebrate immune system combines generalized short-term responses that resist infection with specialized longer-term mechanisms that allow adaptation.
The balance between resistance and recovery mechanisms is encoded largely, mechanistically, through redundancy or functional redundancy (degeneracy [Edelman and Gally, 2001]), diversity or heterogeneity (which are crucial to an adaptive response), and modularity and compartmentalization (Hartwell et al., 1999). Modular structures and design reduce systemic risk, provide building blocks for growth, recovery, and adaptation, and create pathways to multicellularity and the emergence of higher-level structures. Ultimately, redundancy, diversity, and modularity trade off against one another, and the optimal balance is context dependent (Levin, 1999).
Cooperation and the Commons
Cooperation is among the most important phenomena of the living world. Without cooperation, collectives could not exert a powerful influence on their environments, and without cooperation, there would be no evolutionary transitions in complexity (Maynard Smith and Szathmary, 1995; Queller, 2000). Broadly defined as any instance in which one organism increases the fitness of another, cooperation is generally favored with the emergence of population structure (Axelrod et al., 2004; Hamilton, 1964). The initial stages may simply be random, as cooperative individuals who find themselves to be associated with other cooperative individuals gain fitness benefits (Durrett and Levin, 1994; May and Nowak, 1992; Nowak et al., 1994). But once they exist, these beneficial associations can be reinforced by selection for attraction of like types, repulsion of others, punishment, and other social norms. These initial building blocks or cooperative modules can become elements in structures of higher-order cooperation, as advocated by Ostrom and others as an approach for dealing with global environmental problems (Levin, 2012; Ostrom, 2009).
The notion of the commons, and the potential tragedies inherent in them, was first formally introduced by William Forster Lloyd (Lloyd, 1833), although the phrase “Tragedy of the Commons” owes its origin to Garrett Hardin (Hardin, 1968), who resurrected Lloyd’s work. Hardin coined this phrase to note that the resources of a commons are inherently subject to exploitation by individuals who reap their benefits without themselves making a contribution to the public good. Charles Darwin, of course, was much concerned with cooperation, especially in its extreme form among eusocial insect colonies. Indeed, he delayed publication of his monumental Origin of Species because he was troubled by the implications
for his theory of evolution by natural selection. In particular he considered the following question: why devote energy to helping others, when that same investment could instead be used for one’s own reproduction? Darwin did not solve the problem, but he did foreshadow its solution by offering that cooperation could evolve when it is directed within families. It would be more than a century, however, until W. D. Hamilton constructed the first formal theory for the evolution of cooperation (Hamilton, 1964). Extending the contemporary theory of population genetics, Hamilton showed that cooperation could evolve when such behavior is preferentially directed toward individuals with whom the cooperative actor is closely related. That is, the genes responsible for cooperative behavior may increase in frequency when the beneficiaries of cooperation also possess such genes. Social evolution theory has been vastly expanded in the 50 years since his seminal papers (Gardner and Foster, 2008), but Hamilton’s insight remains one of the subject’s foundational pillars.
The theory of cooperation was first formulated to explain examples of metazoan behavior, and empirical tests of social evolution theory using numerous invertebrate and vertebrate animal systems, including humans, have been broadly successful. Recent years have seen an expansion of the field, with a focus on microscopic systems; researchers have realized that bacteria and other microbes are highly interactive, exhibiting the full spectrum of cooperative and antagonistic behavior that we have come to expect among more complex organisms (Nadell et al., 2009; West et al., 2006, 2007; Xavier, 2011). And in contrast to most of the animals historically at the center of attention for social evolutionists, microbes can be genetically manipulated, are tractable in the laboratory, and evolve over time scales that are accessible for experimentation.
Microbial Public Goods
Just as humans and other animals may be found to work in concert, cell groups exhibit simple forms of cooperative behavior that allow them to achieve goals that no single cell could attain on its own (Crespi, 2001; West et al., 2007). Microbial cooperation often manifests as the secretion of proteins or compounds whose benefits may be shared among neighboring cells. Common examples include extracellular digestive enzymes, nutrient chelating molecules, and secreted structural polymers, which are integral to the formation of bacterial communities (biofilms, see below). Experiments with bacteria have shown that these behaviors create a canonical commons, in that the enzyme or chelators secreted by one cell can be used by other cells, including exploitative strains that do not themselves produce the public good (Diggle et al., 2007; Griffin et al., 2004; Rumbaugh et al., 2009; West et al., 2006). In accordance with social evolution theory, bacterial cooperation is selectively favored when relatedness is high, that is, when cells of the cooperative strain preferentially benefit one another. Such preferential interaction can occur as a result of spatial structuring (Nadell et al., 2010), or as
a statistical consequence of small seeding populations and sufficiently frequent disturbance (Chuang et al., 2009).
Understanding the conditions under which cooperation evolves among bacteria bears directly upon numerous problems of human interest, most notably the virulence of bacterial infections. Bacterial pathogens often rely on the cooperative secretion of digestive enzymes to process host tissue into nutrient molecules small enough to be imported into the their cells (Arvidson, 2000; Galloway, 1991). Many cells of a pathogenic species cooperate with one another in order to harm their hosts, and interfering with their cooperation by introducing exploitative mutants has been demonstrated as an effective means of mitigating infections in a mouse model (Rumbaugh et al., 2009). Future progress in this application of bacterial social evolution to clinical medicine will benefit from theory tailored to the environmental conditions and selective pressures that bacterial pathogens experience within their hosts.
Bacterial cooperation can also occur indirectly when one strain produces toxins that specifically target other strains of the same species, or other species entirely (Gardner et al., 2004; Riley and Wertz, 2002). Cells that produce such toxins pay a cost associated with protein synthesis (and, in some cases, cell lysis as toxins are released into the environment), and they benefit their clonemates not by aiding them directly but by reducing the size of a competing population. The genes for synthesizing such toxins, referred to generally as bacteriocins, are often carried on plasmids and accompanied by genes encoding an antitoxin factor. Like classical public good systems, bacteriocin production is subject to exploitation by strains that possess the antitoxin gene, but do not produce the corresponding bacteriocin. Such strains avoid the cost of bacteriocin production but reap the benefits of reduced competition. Bacteriocin-mediated competition has been shown to be important for pathogen population dynamics (Inglis et al., 2009) and intestinal microbiota composition (Gillor et al., 2008), and several studies have found that the evolution of bacteriocin production is highly dependent on the spatial structure of a bacterial collective (Bucci et al., 2011; Durrett and Levin, 1997).
Biofilms
Spatial structure, or any other mechanism of nonuniform interaction among members of a population, has been increasingly recognized as critical to the evolutionary dynamics of bacterial populations. One of the most important and recent observations of microbial natural history is that many unicellular organisms do not live in isolation, but instead prefer to live in densely populated, spatially constrained groups (Hall-Stoodley et al., 2004; Nadell et al., 2009; Stewart and Franklin, 2008). Among bacteria, these cell collectives are termed biofilms, and it is likely that unicellular fungi, protists, and even viruses also inhabit biofilm-like communities (Fanning and Mitchell, 2012; Thoulouze and Alcover, 2011). Bacterial biofilms are defined by the presence of multiple cells
residing on a submerged surface or other substratum, in which they become encased in an envelope of secreted extracellular polymeric substances. In clinical contexts, biofilm-dwelling cells are superior to planktonic cells in their tolerance to antibiotics, their ability to evade consumption by the immune system, and their capacity to produce and concentrate digestive compounds that contribute to virulence. Biofilms are also highly resistant to—and may even benefit from—fluid shear, allowing them to rapidly clog pipes and porous media, which results in enormous costs to industry. Understanding and controlling biofilm structure and composition is therefore central to solving societal problems associated with bacterial pathogenesis and industrial biofouling.
Biofilms inhabit a vast array of surfaces, from intertidal rocks to the human intestinal tract. They vary widely in structure from continuously smooth, to rough and heterogeneous, with towering projections consisting of thousands of cells. Biofilms are also prime examples of complex adaptive systems: their physical structure and population composition are emergent properties of many interacting processes, including cell growth, motility, and polymer secretion, as well as solute diffusion and fluid shear. Seeing through the complexity of biofilms to derive general principles about them is therefore a significant theoretical challenge, but substantial headway has been made via a combination of dimensional analysis and individual-based modeling. This approach originated in the chemical engineering literature, and was developed with the goal of optimizing performance of wastewater treatment reactors, which rely on anaerobic biofilm activity to purify humans’ water supply (Kreft et al., 2001; Picioreanu, 1999; Picioreanu et al., 1998, 2005; Xavier et al., 2005a, 2007).
The predominant simulation models of biofilm formation implement individual bacterial cells as rigid circles in two-dimensional space. Each cell grows and behaves according to user-defined functions of nutrient availability in its local microenvironment and divides once it reaches a critical radius. Any overlap among cells resulting from growth and division is relaxed, resulting in the collective advance of the biofilm front. Following the standard assumption that solute diffusion occurs on a much faster time scale than bacterial growth, the uptake of growth substrate by cells is considered when calculating the spatial distribution of nutrients. This is achieved by solving a reaction-diffusion equation to equilibrium at each iteration of the simulation:
![]()
where [G] is the local concentration of growth substrate, DG is the diffusion coefficient of growth substrate, Y is the yield of bacterial biomass on substrate, and m is a growth rate expression.
Simulation frameworks of this kind have been used to generate numerous hypotheses for the evolution of common biofilm-associated phenotypes (Bucci et al., 2011; Foster and Xavier, 2007; Kreft, 2004; Mitri et al., 2011; Nadell et al., 2008,
2010; Xavier et al., 2009; Xavier and Foster, 2007). An early example is the work of Xavier and Foster that suggested, contrary to common thought, that the production of extracellular polymeric substances is used as a weapon by cell lineages to compete with one another within biofilms (Xavier and Foster, 2007). They specifically predicted that polymer secretion allows a cell lineage to selectively benefit itself, growing into a voluminous mass that smothers competing strains that do not secrete polymers. In other words, polymer secretion can be viewed as a public good that is inherently resistant to exploitation by cells that do not also produce it. This result was recently confirmed by experiments using genetically engineered strains of the human pathogen Vibrio cholerae (Figure A13-4) (Nadell and Bassler, 2011). These studies collectively indicate the utility of simulation modeling for accurate prediction of evolutionary dynamics, and they highlight the central importance of space in bacterial communities. Polymer secretion is advantageous in biofilms, where it provides resistance to shear stress and access to higher nutrient concentrations, which vary in space and time. In well-mixed liquid experiments, where nutrient concentrations are spatially uniform, polymer secretion is not advantageous, because it merely imposes a metabolic cost that lowers maximum growth rate (Nadell and Bassler, 2011; Xavier and Foster, 2007).
Quorum Sensing
Biofilm- and liquid-dwelling bacteria present still more subtlety in their social behavior: in addition to living in close physical proximity to each other and secreting substances that directly affect neighbor fitness, they regulate their social phenotypes by secreting, detecting, and responding to signaling molecules (Miller and Bassler, 2001; Waters and Bassler, 2005). Known as quorum sensing, this regulatory mechanism is common among both Gram-negative and Gram-positive bacteria, each species of which often possesses multiple circuits that produce and respond to different signal molecules (Miller et al., 2002). Quorum-sensing systems operate via the secretion of molecules into the extracellular environment; after such signals reach a critical concentration, due either to high population
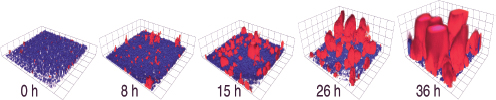
FIGURE A13-4 A time-series of polymer-producing cells (red) growing in a biofilm with nonproducing cells (blue) (Nadell and Bassler, 2011). The initial frequency of polymer-producing cells is <5 percent, and their final frequency is >90 percent. At 36 h the upper surfaces of some polymer-producing cell clusters appear flat because they have reached the ceiling of the chamber in which they are growing. Grid boxes are 11 µm on a side.
density or spatial confinement, cells alter the expression of numerous genes, some of which often control biofilm-associated traits. The secretion of extracellular polymers, for example, is frequently quorum-sensing regulated. Most species, such as the chronic pathogen Pseudomonas aeruginosa, use quorum sensing to activate polymer secretion at high cell density (Davies et al., 1998). Other pathogens including the human pathogen Vibrio cholerae, however, exhibit the opposite pattern of regulation. This species activates polymer secretion at low cell density following surface adhesion and represses polymer secretion at high cell density, at which point it initiates mass dispersal from its host (Hammer and Bassler, 2003). Simulation studies akin to those discussed in the previous section were used to suggest that this stark difference in quorum-sensing regulation is closely linked to the infection strategy of different pathogens. P. aeruginosa, which causes long-term infections, benefits from activating polymer secretion and maintaining polymer secretion at high cell density. V. cholerae, in contrast, causes short-lived, acute infections characterized by massive biofilm growth followed by rapid dispersal. For such a strategy, up-regulation of polymer secretion at low cell density and down-regulation at high cell density is strongly favored by selection (Nadell et al., 2008). Recent experiments have lent support to this hypothesis, showing that polymer production trades off against dispersal ability within biofilms grown in microfluidic devices (Nadell and Bassler, 2011).
Conclusions
Microbial systems are complex adaptive systems, with macroscopic features that are emergent from microscopic interactions. In such systems, characteristic patterns may form, as in bacterial fronts, and more generally the robustness of such systems is not guaranteed by evolution operating at lower scales of organization. How then do organisms sustain cooperative activity that maintains system properties, especially where there are public goods that emerge from individual actions? These are generic questions for any complex adaptive system, from biology to economics and even to physical systems, but microbial systems provide ideal vehicles for studying these interactions.
These points raise a number of mathematical and computational challenges, which we have explored in this paper. Crossing scales, from the microscopic to the macroscopic and back, requires methodologies that translate individual-based assumptions into field-type and ensemble descriptions, as has long been the norm in physics and fluid mechanics. The problem is made more difficult by the fact that the systems of interest are made up of heterogeneous collections of millions of agents, interacting nonlinearly. From a variety of perspectives, and for a variety of problems, however, considerable progress has been made, for systems from bacterial fronts to the collective motion of large vertebrates. Microbial systems provide a wonderful platform for interfacing theoretical and empirical approaches, and for the development of methodologies that can inform the science of complex adaptive systems more broadly.
References
Anderson, P. W. 1972. More is different. Science 177:393-396.
Arvidson, S. 2000. Extracellular enzymes. In Gram-positive pathogens, edited by R. P. N. V. A. Fischetti, J. J. Ferretti, D. A. Portnoy, and J. I. Rood. Washington DC: ASM Press. Pp. 379-385.
Axelrod, R., R. A. Hammond, and A. Grafen. 2004. Altruism via kin-selection strategies that rely on arbitrary tags with which they coevolve. Evolution: International Journal of Organic Evolution 58(8):1833-1838.
Barabási, A.-L., and H. E. Stanley. 1995. Fractal concepts in surface growth. Cambridge: Cambridge University Press.
Ben-Jacob, E., and P. Garik. 1990. The formation of patterns in non-equilibrium growth. Nature 434:523-530.
Bonachela, J. A., C. D. Nadell, J. B. Xavier, and S. A. Levin. 2011. Universality in bacterial colonies. Journal of Statistical Physics 144(2):303-315.
Bucci, V., C. D. Nadell, and J. B. Xavier. 2011. The evolution of bacteriocin production in bacterial biofilms. American Naturalist 178:E162-E173.
Carpenter, S. R., and W. A. Brock. 2004. Spatial complexity, resilience and policy diversity: Fishing on lake-rich landscapes. Ecology and Society 9(1):8.
Chuang, J. S., O. Rivoire, and S. Leibler. 2009. Simpson’s paradox in a synthetic microbial system. Science 323(5911):272-275.
Couzin, I. D., J. Krause, N. R. Franks, and S. A. Levin. 2005. Effective leadership and decision making in animal groups on the move. Nature 433:513-516.
Couzin, I. D., C. C. Ioannou, G. Demirel, T. Gross, C. J. Torney, A. Hartnett, L. Conradt, S. A. Levin, and N. E. Leonard. 2011. Uninformed individuals promote democratic consensus in animal groups. Science 334(6062):1578-1580.
Crespi, B. J. 2001. The evolution of social behavior in microorganisms. Trends in Ecology and Evolution 16(4):178-183.
Csahók, Z., K. Honda, and T. Vicsek. 1993. Dynamics of surface roughening in disordered media. Journal of Physics A: Mathematical and General 26:L171-L178.
Cserzö, M., V. K. Horváth, and T. Vicsek. 1990. Self-affine growth of bacterial colonies. Physica A 167:315-321.
Davies, D. G., M. R. Parsek, J. P. Pearson, B. H. Iglewski, J. W. Costerton, and E. P. Greenberg. 1998. The involvement of cell-to-cell signals in the development of a bacterial biofilm. Science 280(5361):295-298.
DeAngelis, D. S., and L. J. Gross. 1992. Individual-based models and approaches in ecology: Populations, communities and ecosystems. New York: Chapman & Hall.
Diggle, S., A. Griffin, G. Campbell, and S. West. 2007. Cooperation and conflict in quorum-sensing bacterial populations. Nature 450(7168):411-414.
Durrett, R., and S. A. Levin. 1994. The importance of being discrete and (spatial). Theoretical Population Biology 46:363-394.
———. 1997. Allelopathy in spatially distributed populations. Journal of Theoretical Biology 185(2): 165-171.
Earn, D. J., J. Dushoff, S. A. Levin. 2002. Ecology and evolution of the flu. Trends in Ecology and Evolution 7:355-369.
Edelman, G. M., and J. A. Gally. 2001. Degeneracy and complexity in biological systems. Proceedings of the National Academy of Science, USA 98:13764-13768.
Eden, M. 1961. A two-dimensional growth process. Proceedings of the Fourth Berkeley Symposium on Mathematical Statistics and Probability, Vol. 4: Contributions to Biology and Problems of Medicine:223-239.
Fanning, S., and A. P. Mitchell. 2012. Fungal biofilms. PLoS Pathogens 8(4):e1002585.
Fisher, R. A. 1937. The wave of advance of advantageous genes. Annals of Eugenics 7:355-369.
Flierl, G., D. Grünbaum, S. Levin, and D. Olson. 1999. From individuals to aggregations: The interplay between behavior and physics. Journal of Theoretical Biology 196:397-454.
Foster, K. R., and J. B. Xavier. 2007. Cooperation: Bridging ecology and sociobiology. Current Biology 17(9):R319-R321.
Fujikawa, H. 1992. Periodic growth of bacillus subtilis colonies on agar plates. Physica A 189:15-21.
———. 1994. Diversity of the growth patterns of bacillus subtilis colonies on agar plates. FEMS Microbiology Ecology 13:159-168.
Fujikawa, H., and M. Matsushita. 1989. Fractal growth of bacillus subtilis on agar plates. Journal of the Physical Society of Japan 58:3875-3878.
Galloway, D. R. 1991. Pseudomonas aeruginosa elastase and elastolysis revisited: Recent developments. Molecular Microbiology 5(10):2315-2321.
Gardner, A., and K. R. Foster. 2008. The evolution and ecology of cooperation: History and concepts ecology of social evolution. In Ecology of social evolution, edited by J. Korb and J. Heinze. Berlin Heidelberg: Springer. Pp. 1-36.
Gardner, A., S. A. West, and A. Buckling. 2004. Bacteriocins, spite and virulence. Proceedings of the Royal Society B: Biological Sciences 271(1547):1529-1535.
Gillor, O., A. Etzion, and M. A. Riley. 2008. The dual role of bacteriocins as anti- and pro-biotics. Applied Microbiology and Biotechnology 81:591-606.
Griffin, A. S., S. A. West, and A. Buckling. 2004. Cooperation and competition in pathogenic bacteria. Nature 430(7003):1024-1027.
Grünbaum, D. 1992. Local processes and global patterns: Biomathematical models of bryozoan feeding currents and density dependent aggregations in Antarctic krill. PhD diss., Grünbaum, Daniel: Cornell University, United States.
Grünbaum, D., and A. Okubo. 1994. Modeling social animal aggregations. In Frontiers in mathematical biology. Vol. 100, Lecture notes in biomathematics, edited by S. A. Levin. Heidelberg: Springer-Verlag. Pp. 296-325.
Hall-Stoodley, L., J. W. Costerton, and P. Stoodley. 2004. Bacterial biofilms: From the natural environment to infectious diseases. Nature Reviews Microbiology 2(2):95-108.
Hamilton, W. D. 1964. The genetical evolution of social behaviour I and II. Journal of Theoretical Biology 7(1):1-52.
Hammer, B. K., and B. L. Bassler. 2003. Quorum sensing controls biofilm formation in vibrio cholerae. Molecular Microbiology 50(1):101-104.
Hardin, G. 1968. The tragedy of the commons. Science 162:1243-1248.
Hartwell, L. H., J. J. Hopfield, S. Leibler, and A. W. Murray. 1999. From molecular to modular cell biology. Nature 402(6761 Suppl):C47-C52.
Holling, C. S. 1973. Resilience and stability of ecological systems. Annual Review of Ecology and Systematics 4:1-23.
Inglis, R. F., A. Gardner, P. Cornelis, and A. Buckling. 2009. Spite and virulence in the bacterium pseudomonas aeruginosa. Proceedings of the National Academy of Sciences, USA 106(14): 5703-5707.
Jullien, R., and R. Botet. 1985. Scaling properties of the surface of the eden model in d = 2, 3, 4. Journal of Physics A: Mathematical and General 18:2279-2287.
Kardar, M., G. Parisi, and Y.-C. Zhang. 1986. Dynamic scaling of growing interfaces. Physical Review Letters 56:889-892.
Keller, E. F., and L. A. Segel. 1971. Model for chemotaxis. Journal of Theoretical Biology 30:225-234. Kessler, D. A., and H. Levine. 1998. Fluctuation-induced diffusive instabilities. Nature 394:556-558. Kevrekidis, P. G., I. G. Kevrekidis, A. R. Bishop, and E. S. Tity. 2002. A continuum approach to discreteness. Physical Review E 65(046613-1):1-13.
Kevrekidis, I. G., C. W. Gear, J. M. Hyman, P. G. Kevrekidis, O. Runborg, and C. Theodoropoulos. 2003. Equation-free, coarse-grained multiscale computation: Enabling microscopic simulators to perform system-level analysis. Communications in Mathematical Sciences 1(4):715-762.
Kobayashi, N., O. Moriyama, S. Kitsunezaki, M. Yamazaki, and Y. Matsushita. 2004. Dynamic scaling of the growing rough surfaces. Journal of the Physical Society of Japan 73:2112-2116.
Kolmogorov, A. N., I. Petrovsky, and N. Piscounov. 1937. Étude de l’equation de la diffusion avec croissance de la quantité de matière et son application à un problème biologique. Moscow University Bulletin of Mathematics, International Series, Section A:1-25.
Kreft, J. U. 2004. Biofilms promote altruism. Microbiology-SGM 150:2751-2760.
Kreft, J. U., C. Picioreanu, J. W. T. Wimpenny, and M. C. M. van Loosdrecht. 2001. Individual-based modelling of biofilms. Microbiology-SGM 147:2897-2912.
Lacasta, A. M., C. E. Cantalapiedra, C. E. Auguet, A. Peñaranda, and L. Ramírez-Piscina. 1999. Modelling of spatio-temporal patterns in bacterial colonies. Physical Review E 59:7036-7041.
Levin, S. A. 1992. The problem of pattern and scale in ecology. Ecology 73:1943-1967.
———. 1998. Ecosystems and the biosphere as complex adaptive systems. Ecosystems 1:431-436.
———. 1999. Fragile dominion: Complexity and the commons. Reading, MA: Perseus Books.
———. 2012. The challenge of sustainability: Lessons from an evolutionary perspective. In Sustainability science: The emerging paradigm and the urban environment, edited by M. Weinstein and R. E. Taylor. New York: Springer. Pp. 168-174.
Levin, S. A., and J. Lubchenco. 2008. Resilience, robustness, and marine ecosystem-based management. Bioscience 58(1):27-32.
Lloyd, W. F. 1833. Two lectures on the checks to population. Oxford: Oxford University Press, 1833.
López, J. M. 1999. Scaling approach to calculate critical exponents in anomalous surface roughening. Physical Review Letters 83:4594-4597.
López, J. M., M. A. Rodríguez, and R. Cuerno. 1997. Superroughening versus intrinsic anomalous scaling of surfaces. Physical Review E 56:3993-3998.
Matsushita, M., J. Wakita, H. Itoh, I. Ràfols, T. Matsuyama, H. Sakaguchi, and M. Mimura. 1998. Interface growth and pattern formation in bacterial colonies. Physica A 249:517-524.
May, R. M. 1974. Biological populations with non-overlapping generations: Stable points, stable cycles, and chaos. Journal of Theoretical Biology 49:511-524.
May, R. M., and M. A. Nowak. 1992. Evolutionary games and spatial chaos. Nature 359:826-829.
May, R. M., S. A. Levin, and G. Sugihara. 2008. Complex systems: Ecology for bankers. Nature 451(7181):893-895.
Maynard Smith, J., and E. Szathmary. 1995. The major transitions in evolution. Oxford: Oxford University Press.
Miller, M. B., and B. L. Bassler. 2001. Quorum sensing in bacteria. Annual Review of Microbiology 55:165-199.
Miller, M. B., K. Skorupski, D. H. Lenz, R. K. Taylor, and B. L. Bassler. 2002. Parallel quorum sensing systems converge to regulate virulence in vibrio cholerae. Cell 110(3):303-314.
Mitri, S., J. B. Xavier, and K. R. Foster. 2011. Social evolution in multispecies biofilms. Proceedings of the National Academy of Sciences, USA 108:10839-10846.
Monod, J. 1950. Technique de culture continue. Theory et applications. Annales de l’Institut Pasteur 79:390-410.
Moon, S. J., B. Nabet, N. E. Leonard, S. A. Levin, and I. G. Kevrekidis. 2007. Heterogeneous animal group models and their group-level alignment dynamics: An equation-free approach. Journal of Theoretical Biology 246(1):100-112.
Nabet, B., N. E. Leonard, I. D. Couzin, and S. A. Levin. 2009. Dynamics of decision making in animal group motion. Journal of Nonlinear Science 19(4):399-435.
Nadell, C. D., and B. L. Bassler. 2011. A fitness trade-off between local competition and dispersal in vibrio cholerae biofilms. Proceedings of the National Academy of Sciences, USA 108(34):14181-14185.
Nadell, C. D., J. B. Xavier, S. A. Levin, and K. R. Foster. 2008. The evolution of quorum sensing in bacterial biofilms. PLoS Biology 6(1):e14.
Nadell, C. D., J. B. Xavier, and K. R. Foster. 2009. The sociobiology of biofilms. FEMS Microbiology Reviews 33(1):206-224.
Nadell, C. D., K. R. Foster, and J. B. Xavier. 2010. Emergence of spatial structure in cell groups and the evolution of cooperation. PLoS Computational Biology 6(3):e1000716.
Nara, P. L., G. J. Tobin, A. R. Chaudhuri, J. D. Trujillo, G. Lin, M. W. Cho, S. A. Levin, W. Ndifon, and N. S. Wingreen. 2010. How can vaccines against influenza and other viral diseases be made more effective? PLoS Biology 8(12):e1000571.
Nowak, M. A., S. Bonhoeffer, and R. M. May. 1994. Spatial games and the maintenance of cooperation. Proceedings of the National Academy of Sciences, USA 91(11):4877-4881.
Ostrom, E. 2009. A polycentric approach for coping with climate change. World Bank Policy Research Working Paper 5095.
Paiva, L. R., and S. C. Ferreira, Jr. 2007. Universality class of isotropic on-lattice eden clusters. Journal of Physics A: Mathematical and Theoretical 40:F43-F49.
Picioreanu, C. 1999. Multidimensional modeling of biofilm structure. PhD diss., Picioreanu, Christian: Delft University of Technology, The Netherlands.
Picioreanu, C., M. C. M. van Loosdrecht, and J. J. Heijnen. 1998. Mathematical modeling of biofilm structure with a hybrid differential-discrete cellular automaton approach. Biotechnology and Bioengineering 58(1):101-116.
Picioreanu, C., J. B. Xavier, and M. C. M. van Loosdrecht. 2005. Advances in mathematical modeling of biofilm structure. Biofilms 1(04):337-349.
Queller, D. C. 2000. Relatedness and the fraternal major transitions. Philosophical Transactions of the Royal Society of London Series: Biological Sciences 355(1403):1647-1655.
Raghib, M., S. A. Levin, and I. G. Kevrekidis. 2010. Multiscale analysis of collective motion and decision-making in swarms: An advection-diffusion equation with memory approach. Journal of Theoretical Biology 264(3):893-913.
Riley, M. A., and J. E. Wertz. 2002. Bacteriocins: Evolution, ecology, and application. Annual Review of Microbiology 56(1):117-137.
Rumbaugh, K. P., S. P. Diggle, C. M. Watters, A. Ross-Gillespie, A. S. Griffin, and S. A. West. 2009. Quorum sensing and the social evolution of bacterial virulence. Current Biology 19(4):341-345.
Scheffer, M., and S. R. Carpenter. 2003. Catastrophic regime shifts in ecosystems: Linking theory to observation. Trends in Ecology and Evolution 18(12):648-656.
Shimada, H., T. Ikeda, J.-I. Wakita, H. Itoh, S. Kurosu, F. Hiramatsu, M. Nakatsuchi, Y. Yamazaki, T. Matsuyama, and M. Matsushita. 2004. Dependence of local cell density on concentric ring colony formation by bacterial species bacillus subtilis. Journal of the Physical Society of Jaapn. 189:1082-1089.
Skellam, J. G. 1951. Random dispersal in theoretical populations. Biometrika 38:196-218.
Stewart, P. S., and M. J. Franklin. 2008. Physiological heterogeneity in biofilms. Nature Reviews Microbiology 6(3):199-210.
Thom, R. 1969. Topological models in biology. Topology 8:313-335.
Thoulouze, M.-I., and A. Alcover. 2011. Can viruses form biofilms? Trends in Microbiology 19(6):257-262.
Wakita, J., H. Itoh, T. Matsuyama, and M. Matsushita. 1997. Self-affinity for the growing interface of bacterial colonies. Journal of the Physical Society of Japan. 66:67-72.
Walker, B. H., J. L. Langridge, and F. McFarlane. 1997. Resilience of an Australian savanna grassland to selective and non-selective perturbations. Australian Journal of Ecology 22:125-135.
Waters, C. M., and B. L. Bassler. 2005. Quorum sensing: Cell-to-cell communication in bacteria. Annual Review of Cell and Developmental Biology 21:319-346.
West, S. A., A. S. Griffin, A. Gardner, and S. P. Diggle. 2006. Social evolution theory for microorganisms. Nature Reviews Microbiology 4(8):597-607.
West, S. A., S. P. Diggle, A. Buckling, A. Gardner, and A. S. Griffins. 2007. The social lives of microbes. Annual Review of Ecology Evolution and Systematics 38:53-77.
Witten, T. A., and S. Jr., L.M. 1981. Diffusion-limited aggregation, a kinetic critical phenomenon. Physical Review Letters 47:1400-1403.
Xavier, J. B. 2011. Social interaction in synthetic and natural microbial communities. Molecular Systems Biology 7:483.
Xavier, J. B., and K. R. Foster. 2007. Cooperation and conflict in microbial biofilms. Proceedings of the National Academy of Sciences, USA 104(3):876-881.
Xavier, J. B., C. Picioreanu, and M. C. M. van Loosdrecht. 2005a. A framework for multidimensional modelling of activity and structure of multispecies biofilms. Environmental Microbiology 7(8):1085-1103.
Xavier, J. B., C. Picioreanu, and M. C. M. van Loosdrecht. 2005b. A framework for multidimensional modelling of activity and structure of multispecies biofilms. Environonmental Microbiology 7:1085-1103.
Xavier, J. B., M. K. De Kreuk, C. Picioreanu, and M. C. M. Van Loosdrecht. 2007. Multi-scale individual-based model of microbial and bioconversion dynamics in aerobic granular sludge. Environmental Science and Technology 41(18):6410-6417.
Xavier, J. B., E. Martinez-Garcia, and K. R. Foster. 2009. Social evolution of spatial patterns in bacterial biofilms: When conflict drives disorder. American Naturalist 174(1-12).
Zeeman, E. C. 1981. Dynamics of evolution of animal conflicts. Journal of Theoretical Biology 89:249-270.
IDENTIFICATION OF A TARGET CELL PERMISSIVE FACTOR REQUIRED FOR CONTACT-DEPENDENT GROWTH INHIBITION (CDI)54
Elie J. Diner,55,56Christina M. Beck,55Julia S. Webb,55David A. Low,55,56and Christopher S. Hayes55,56,57
Bacterial contact-dependent growth inhibition (CDI) is mediated by the CdiB/CdiA family of two-partner secretion proteins. CdiA effector proteins are exported onto the surface of CDI+ inhibitor cells, where they interact with susceptible bacteria and deliver effectors/toxins derived from their C-terminal regions (CdiA-CT). CDI+ cells also produce an immunity protein that binds the CdiA-CT and blocks its activity to prevent autoinhibition.
___________
54 Reprinted with kind permission from Cold Springs Harbor Laboratory Press. Originally printed as Diner, E.J. et al. (2012). Identification of a target cell permissive factor required for contact-dependent growth inhibition. Genes & Development. Received November 2, 2011; revised version accepted January 20, 2012.
55 Department of Molecular, Cellular, and Developmental Biology, University of California at Santa Barbara, Santa Barbara, California 93106.
56 Biomolecular Science and Engineering Program, University of California at Santa Barbara, Santa Barbara, California 93106, USA.
57 Corresponding author. E-mail chayes@lifesci.ucsb.edu. Article published online ahead of print. Article and publication date are online at http://www.genesdev.org/cgi/doi/10.1101/gad.182345.111.
Keywords: CDI; contact-dependent growth inhibition; CysK; tRNase activity; UPEC536
Supplemental material is available for this article.
Here, we show that the CdiA-CT from uropathogenic Escherichia coli strain 536 (UPEC536) is a latent tRNase that requires activation by the biosynthetic enzyme CysK (O-acetylserine sulfhydrylase A). UPEC536 CdiA-CT exhibits no nuclease activity in vitro, but cleaves within transfer RNA (tRNA) anticodon loops when purified CysK is added. CysK and CdiA-CT form a stable complex, and their binding interaction appears to mimic that of the CysK/CysE cysteine synthase complex. CdiA-CT activation is also required for growth inhibition. Synthesis of CdiA-CT in E. coli cysK+ cells arrests cell growth, whereas the growth of ΔcysK mutants is unaffected by the toxin. Moreover, E. coli ΔcysK cells are completely resistant to inhibitor cells expressing UPEC536 CdiA, indicating that CysK is required to activate the tRNase during CDI. Thus, CysK acts as a permissive factor for CDI, providing a potential mechanism to modulate growth inhibition in target cells.
Bacteria possess a variety of systems that facilitate cooperation and competition with other organisms in the environment. One such mechanism is contact-dependent growth inhibition (CDI), which allows some bacteria to inhibit the growth of neighboring cells upon direct cellto- cell contact (Aoki et al. 2005, 2010; Hayes et al. 2010). CDI systems are widely distributed amongst the α-, β-, and γ-proteobacteria and have been shown to play a significant role in intraspecies growth competition (Aoki et al. 2010). CDI is mediated by the CdiB/CdiA family of two-partner secretion proteins. CdiB is a predicted outermembrane β-barrel protein that is required for the export and assembly of the CdiA toxic effector protein onto the cell surface. CdiA proteins are very large (250–600 kDa) and contain numerous hemagglutinin peptide repeats throughout their N-terminal regions. This extensive repeat region is predicted to form a β-helical structure projecting several hundred angstroms from the surface of CDI+ inhibitor cells (Kajava et al. 2001). Presumably, the long extended CdiA filaments facilitate interaction with neighboring bacteria to induce growth inhibition. All CDI loci also contain a small cdiI immunity gene located immediately downstream from cdiA (Aoki et al. 2005, 2010). The CdiI protein provides immunity to the CdiA-derived toxin, thereby protecting CDI+ cells from autoinhibition.
We recently localized the CDI growth inhibition activity to the C-terminal region of CdiA (CdiA-CT) (Aoki et al. 2010). The CdiA-CT is a highly variable region of ~230–360 residues at the extreme C terminus of CdiA proteins. This variable C-terminal region is sharply demarcated by the conserved VENN peptide motif, which is part of the DUF638 (Pfam, PF04829) domain of unknown function (Aoki et al. 2010). The polymorphic nature of the CdiA-CT region implies that a variety of distinct toxins are deployed by different CDI systems. The CdiA-CTEC93 from Escherichia coli isolate EC93 may form a pore in the inner membrane of target cells, leading to dissipation of the proton motive force and a concomitant decrease in respiration and ATP production (Aoki et al. 2009). Other CdiA-CTs possess distinct nuclease activities (Aoki et al. 2010). The
CdiA-CTIDd3937 from Dickeya dadantii 3937 has DNase activity, and the CdiACTUPEC536 from uropathogenic E. coli strain 536 (UPEC536) cleaves transfer RNA (tRNA) (Aoki et al. 2010). Like the CdiA-CT region, the CdiI immunity proteins from different CDI systems also share little sequence identity with one another and, accordingly, only confer immunity to their cognate CdiA-CT toxins (Aoki et al. 2010). In vitro experiments have demonstrated that the CdiIIDd3937 and CdiIUPEC536 immunity proteins bind specifically to their cognate CdiA-CTs and block nuclease activity (Aoki et al. 2010), suggesting that these enzymatic activities are responsible for growth inhibition during CDI.
Here we identify an additional step in the CDI pathway in which a CdiA-CT toxin is activated by a protein cofactor in the cytoplasm of target cells. Although CdiA-CTUPEC536 (hereafter referred to as CdiA-CT) exhibits tRNase activity when expressed inside E. coli cells, the purified protein does not cleave tRNA in vitro. Using a biochemical approach, we identified a biosynthetic enzyme, CysK (O-acetylserine sulfhydrylase A), which is required to activate the CdiA-CT nuclease. CysK is one of two O-acetylserine sulfhydrylase isoenzymes (along with CysM) that catalyze the second and final step of cysteine synthesis from serine. Purified CysK is sufficient to activate the CdiA-CT tRNase in vitro, and the resulting nuclease activity is blocked specifically by CdiIUPEC536 immunity protein (hereafter referred to as CdiI). CysK and CdiA-CT form a stable complex, which is directly associated with tRNase activity. Remarkably, the CysK/CdiACT-binding interaction appears to mimic that of the cysteine synthase complex formed between CysK and CysE (serine O-acetyltransferase) in some bacteria and higher plants (Kredich et al. 1969; Droux et al. 1998; Zhu et al. 1998; Mino et al. 2000b; Kumaran et al. 2009). The cysteine synthase complex interaction is mediated by the C-terminal GDGI peptide of CysE, which binds in the active site cleft of CysK (Mino et al. 1999, 2000a; Zhao et al. 2006; Kumaran and Jez 2007). UPEC536 CdiA contains a similar C-terminal GYGI peptide motif, and these residues are required for binding to CysK. In accord with the biochemical data, we found that CysK is also required for tRNase activity when CdiA-CT is expressed inside E. coli cells. Moreover, E. coli DcysK mutants are completely resistant to cell-mediated CDIUPEC536, demonstrating that CysK is a critical player in this pathway. Based on these findings, we propose that CysK acts as a specific permissive factor for CDI mediated by UPEC536. These results reveal unanticipated complexity in the CDI pathway and raise the possibility that CdiA-CTs may play roles in communication between CDI+ cells.
Results
CdiA-CT-Associated tRNase Activity Requires a Cofactor
We recently reported that purified CdiA-CT from UPEC536 (corresponding to residues Val 3016–Ile 3242 of CdiA) cleaves tRNA in the S100 fraction of cell
lysates (Aoki et al. 2010). The S100 fraction is the supernatant from a 100,000g centrifugation and contains a number of soluble proteins in addition to substrate tRNA. To characterize this tRNase activity under defined conditions, we extracted E. coli S100 fractions with guanidinium isothiocyanate-phenol (GITC-phenol) to isolate tRNAs for in vitro assays. Surprisingly, CdiA-CT had no activity on purified tRNA (Fig. A14-1A). In contrast, CdiA-CT induced tRNA cleavage when added to S100 lysates, and this tRNase activity was neutralized with equimolar CdiI-His6 immunity protein (Fig. A14-1A). We reasoned that tRNA could be denatured during GITC-phenol extraction, rendering them resistant to cleavage. Therefore, we purified E. coli tRNA under nondenaturing conditions using DEAEcellulose chromatography and found this substrate was also refractory to cleavage (Fig. A14-1A,B). Together, these results suggest that a factor (or factors) present in the S100 fraction is required to support tRNase activity. To test this hypothesis, we removed nucleic acids from the S100 fraction using DEAE-cellulose in buffer containing 250 mM NaCl (Fig. A14-1B). Most of the proteins present in the S100 fraction were not retained on the DEAE-cellulose column under these conditions and were recovered in the flowthrough fraction (Fig. A14-1B; data not shown). This S100 protein fraction supported tRNase activity on purified tRNA isolated by both DEAE-cellulose and GITC- phenol methods (Fig. A14-1A; data not shown), suggesting that a protein in this fraction activates CdiA-CT.
To identify the factor required for CdiA-CT activation, we fractionated S100 lysates using DEAE-cellulose chromatography and a linear salt gradient (Fig. A14-1B). The activator eluted from the column at ~100–125mM NaCl, and these fractions were pooled for further purification by butyl-Sepharose chromatography. SDS-PAGE analysis of the resulting active fraction revealed several proteins (Fig. A14-1B), which were identified by mass spectrometry following digestion with trypsin. This analysis identified several dozen E. coli proteins in the CdiA-CT-activating fraction, although most were present at very low levels (Supplemental Table S1). To identify the activating factor, we screened S100 lysates prepared from E. coli strains deleted for genes that encode candidate proteins. We focused on the most abundant candidate proteins, testing those with >35 unique tryptic peptides and >60% sequence coverage in the mass analysis (Table A14-1). The S100 lysates from ΔsucC, ΔsucD, ΔahpC, and ΔtreC mutants all supported tRNase activity to a level similar to that of the lysate prepared from wild-type cells (Fig. A14-2A). In contrast, there was dramatically less tRNase activity in the S100 lysate from E. coli ΔcysK cells (Fig. A14-2A). These results suggest that CysK plays a role in activating the CdiA-CT tRNase.
CysK Activates the CdiA-CT tRNase In Vitro
To determine whether CysK is sufficient to stimulate tRNase activity, we overproduced and purified His6-tagged CysK protein for in vitro assays. Equimolar mixtures of CysK-His6 and CdiA-CT were able to cleave purified
FIGURE A14-1 CdiA-CT tRNase activity requires a cofactor. (A) In vitro tRNase assays. S100 lysates or isolated tRNA (purified by either GITC-phenol or DEAE-cellulose chromatography) were incubated with CdiA-CT and CdiI-His6 (where indicated) as described in the Materials and Methods. The samples labeled DEAE tRNA+S100 protein contained a reconstituted S100 lysate in which the separated tRNA and protein fractions were recombined. Reactions were run on denaturing polyacrylamide gels, and tRNAs were visualized by ethidium bromide staining. The migration positions of full-length and cleaved tRNAs are indicated. (B) Purification scheme for enrichment of the CdiACT-activating factor. Proteins from E. coli S100 lysates were fractionated by anion exchange (DEAE-cellulose) and hydrophobic interaction (butyl-Sepharose) chromatography as illustrated in the flow chart. The final peak activating fraction was analyzed by SDS-PAGE, and proteins were visualized by staining with Coomassie blue.
TABLE A14-1 Proteins Identified in the Cdi-CT Activating Fractiona
| Identified Protein | Gene | UniProt accession number | Molecular mass | Unique peptides | Sequence coverage |
| Alkyl hydroperoxide reductase subunit C | ahpC | P0AE08 | 21 kDa | 37 | 94% |
| O-acetylserine sulfhydrylase A | cysK | P0ABK5 | 34 kDa | 40 | 90% |
| Succinyl-CoA ligase (ADP-forming) subunit α | sucD | P0AGE9 | 30 kDa | 36 | 80% |
| Succinyl-CoA ligase (ADP-forming) subunit β | sucC | P0A836 | 41 kDa | 44 | 74% |
| Trehalose-6-phosphate hydrolase | treC | P28904 | 64 kDa | 40 | 64% |
a This includes proteins with >35 unique tryptic peptides and >60% sequence coverage. See Supplemental Table S1 in the Supplemental Material for a complete list of identified proteins.
tRNA, and this activity was blocked by the CdiI immunity protein (Fig. A14-2B). CysK is a PLP-dependent enzyme that catalyzes the second and final step of cysteine synthesis from serine. To address whether O-acetylserine sulfhydrylase activity is required for tRNase activation, we tested a mutated version of CysK in which Lys 42 had been changed to an alanine residue (K42A). Lys 42 forms a Schiff base with PLP and is required for enzymatic activity (Rabeh and Cook 2004). Although catalytically inactive, purified CysK(K42A)-His6 protein still supported tRNase activity in vitro (Fig. A14-2B). E. coli contains an additional O-acetylserine sulfhydrylase isoenzyme encoded by the cysM gene (Tai et al. 1993). We tested purified E. coli CysM-His6 and found that it did not support tRNase activity (Fig. A14-2B). Together, these results show that nuclease activation requires CysK, but is not dependent on its O-acetylserine sulfhydrylase activity.
Because both CysK and CdiA-CT are required for tRNA cleavage in vitro, it is formally possible that CysK is in fact the tRNase and that CdiA-CT is the activating factor. We used BLAST analysis to identify CdiA-CT homologs, reasoning that multiple sequence alignment with related proteins could identify conserved residues required for tRNase activity. This analysis revealed that the CdiA-CT is bipartite, with the N-terminal and C-terminal regions sharing sequence identity with two distinct sets of proteins (Fig. A14-3A; Supplemental Figs. S1, S2). The N-terminal region of CdiA-CT (residues Val 1–Tyr 82) is homologous to the corresponding region in CdiA proteins from Yersinia pestis, Photorhabdus luminescens, and Enterobacter cloacae, but the extreme C-terminal sequences of these proteins are divergent (Fig. A14-3A; Supplemental Fig. S1). Because the
FIGURE A14-2 CysK is necessary and sufficient for tRNase activity. (A) CysK is required for tRNase activity. E. coli S100 lysates from the indicated genetic backgrounds were incubated with purified CdiA-CT (and CdiI-His6) and then analyzed by gel electrophoresis and ethidium bromide staining to assay tRNase activity. The migration positions of full-length and cleaved tRNAs are indicated. (B) CysK and CdiA-CT are sufficient for tRNase activity in vitro. GITC-phenol-extracted tRNA was treated with purified CysKHis6, CysK(K42A)-His6, and CysM-His6 in combination with CdiACT and CdiI-His6 where indicated. Buffer was added to the mock treatment control in place of CysK/CysM. Reactions were analyzed by denaturing gel electrophoresis as described for A.
CDI systems from these other bacteria encode distinct CdiI immunity proteins that are unrelated to the UPEC536 CdiI, we concluded that the shared N-terminal region of CdiA-CT is not required for tRNase activity. To test this prediction, we purified a truncated version of CdiA-CT lacking the N-terminal 82 residues and tested its nuclease activity in vitro. Remarkably, the truncated CdiA-CT cleaved tRNA in a CysK-independent fashion, and its activity was completely blocked by equimolar CdiI immunity protein (Fig. A14-3B). Multiple sequence alignment of the C-terminal tRNase domain with related sequences from γ-proteobacteria and Grampositive bacteria revealed a handful of completely conserved residues that could be involved in catalysis (Fig. A14-3A; Supplemental Fig. S2). We changed the conserved His 178 residue in CdiA-CT (His 3193 in full-length CdiA) to alanine and found that the resulting protein lacked tRNase activity in vitro even in the presence of CysK-His6 (Fig. A14-3A,B). The loss of nuclease activity was not the result of gross structural perturbation, because the mutant CdiA-CT(H178A) still bound tightly to the cognate CdiI-His6 immunity protein (data not shown).
FIGURE A14-3 CdiA-CT is an intrinsic tRNase. (A) Multiple sequence alignment suggests that UPEC536 CdiA-CT is comprised of two domains. Homologous CdiA-CT regions from various proteobacteria were aligned with UPEC536 CdiA-CT using ClustalW. The N-terminal region of UPEC536 CdiA-CT (Val 1–Tyr 82) shares sequence identity with the corresponding regions in CdiA proteins from Y. pestis (Uniprot Q74T84), P. luminescens (Q7MB60), and E. cloacae (D5CBA0). The C-terminal region (Asn 89–Ile 227) is homologous to CdiA-related proteins from E. coli MS 153-1 (E6AEZ0), Enterobacter sp. 638 (A4W4W8), and Pseudomonas syringae (F3FGM0). UPEC536 CdiA-CT residues Gly 83 and His 178 (numbered with respect to Val 1 of the VENN motif) are highlighted in red. The alignment was rendered with 50% conservation visibility using Jalview 2.7. (B) The C-terminal domain of CdiA-CT has intrinsic tRNase activity. GITC-phenol-extracted tRNA was treated with the C-terminal domain of CdiA-CT (residues Gly 83–Ile 227) and CdiI-His6 in the presence and absence (mock control) of CysK-His6, and reactions were analyzed by denaturing gel electrophoresis. The migration positions of full-length and cleaved tRNAs are indicated. (C) The His178Ala missense mutation ablates CdiA-CT tRNase activity. GITC-phenol-extracted tRNA was treated with purified CdiA-CT(H178A) and CdiI-His6 in the presence and absence (mock control) of CysKHis6. Reactions were analyzed by denaturing gel electrophoresis.
Taken together, these results demonstrate that tRNase activity is intrinsic to the C-terminal 145 residues of UPEC536 CdiA.
CysK and CdiA-CT Form a Stable Complex In Vitro
Because the biosynthetic function of CysK is not required for tRNase activation, we asked whether CysK and CdiACT form a stable complex. We incubated CdiA-CT with CysK-His6 and then subjected the mixture to Ni2+-affinity chromatography. SDS-PAGE analysis of the bound and free fractions revealed that untagged CdiA-CT was retained with CysK-His6 on the Ni2+-NTA column, suggesting a physical interaction between the proteins (Fig. A14-4A). Copurification assays also showed that CdiA-CT forms a stable complex with mutant CysK(K42A)-His6 protein but not CysM-His6 (Supplemental Fig. S3), consistent with the results from the in vitro tRNase assays. The only known binding partner of CysK is CysE, the serine O-acetyltransferase that catalyzes the first step in cysteine biosynthesis. CysK and CysE form the cysteine synthase complex in many bacteria and higher plants (Kredich et al. 1969; Droux et al. 1998; Zhu et al. 1998). Structural and biochemical studies of the cysteine synthase complex indicate that the C terminus of CysE binds in the active site cleft of CysK (Mino et al. 2000a; Campanini et al. 2005; Huang et al. 2005; Francois et al. 2006; Zhao et al. 2006; Kumaran et al. 2009). Notably, the C terminus of UPEC536 CdiA shares some sequence identity with the C terminus of CysE (Fig. A14-4B), raising the possibility that CysK binds the C-terminal Gly–Tyr–Gly–Ile (GYGI) peptide of CdiA-CT. In accord with this hypothesis, CdiA-CT proteins lacking the GYGI sequence (ΔGYGI) or the C-terminal isoleucine residue (ΔI) failed to copurify with CysK-His6 (Fig. A14-4A) and exhibited no in vitro tRNase activity in either the presence or absence of CysK (Supplemental Fig. S4). The cysteine synthase complex dissociates in the presence of the CysK substrate O-acetyl-Lserine (Kredich et al. 1969), presumably because this small molecule displaces the C-terminal tail of CysE upon binding the CysK active site. Similarly, we found that preincubation of CysK-His6 with O-acetyl- L-serine blocked CdiACT/CysK-His6 complex formation, whereas pretreatment with L-serine had little effect on the binding interaction (Fig. A14-4C). Taken together, these results suggest that the CdiA-CT GYGI motif mimics the C terminus of CysE to bind the CysK active site.
We next asked whether the CdiI immunity protein blocks tRNase activity by disrupting the CysK/CdiA-CT complex. We incubated untagged CdiI with CdiACT and CysK-His6 and found that all three proteins copurified as an apparent ternary complex during Ni2+-affinity chromatography (Fig. A14-4D). CdiI does not appear to interact directly with CysK because these proteins do not copurify in the absence of CdiA-CT (Fig. A14-4D). These results indicate that CysK and CdiI bind to nonoverlapping sites on CdiA-CT and that immunity function does not entail dissociation of the tRNase complex.
FIGURE A14-4 CdiA-CT and CysK form a stable complex in vitro. (A) CdiA-CT and CysK form a stable complex in vitro. His6- tagged CysK was used as bait protein to test for copurification of untagged CdiA-CT variants. CysK-His6/CdiA-CT mixtures (input) were incubated with Ni2+-NTA agarose, and the free and resin-bound fractions were isolated for analysis by SDS-PAGE. The ΔGYGI and ΔI variants are truncated CdiA-CT proteins lacking the indicated C-terminal residues. The gel migration positions for each protein are indicated. (B) Comparison of the C-terminal residues of UPEC536 CdiA-CT and E. coli CysE. Residue numbers are indicated for each protein. (C) O-acetyl-Lserine blocks formation of the CdiA-CT/CysK complex. CysKHis6 was incubated with either O-acetyl-L-serine or L-serine prior to addition of CdiA-CT. Samples were then processed as described in A. The gel migration positions for each protein are indicated. (D) CdiA-CT/CdiI forms a ternary complex with CysK. Untagged CdiA-CT and/or CdiI proteins were incubated with CysK-His6, and the mixtures were subjected to Ni2+-NTA chromatography. All fractions were analyzed by SDS-PAGE. The gel migration positions for each protein are indicated.
CysK is Required for CdiA-CT Toxicity In Vivo
The cleavage of tRNA should block protein synthesis and is presumably the molecular basis of CdiA-CT-mediated growth inhibition. To induce CdiA-CT tRNase activity in vivo, we used the controlled proteolysis system of McGinness et al. (2006) to specifically degrade the CdiI immunity protein. Briefly, CdiI was tagged at its C terminus with the ssrA(DAS) peptide, which targets tagged proteins for degradation by the ClpXP protease only in the presence of the SspB adaptor protein (McGinness et al. 2006). Coexpression of CdiA-CT and CdiIDAS did not inhibit E. coli ΔsspB cell growth, but production of SspB from a plasmid-borne PBAD promoter resulted in growth inhibition after ~2 h of induction (Fig. A14-5A). No growth inhibition was seen in cells expressing SspB(Δ47), which binds the ssrA(DAS) peptide but is unable to deliver tagged proteins to ClpXP (Wah et al. 2002, 2003; McGinness et al. 2006). These results show that growth inhibition is dependent on CdiI degradation. Gel analysis of RNA from the inhibited cells revealed that their tRNAs were degraded (Fig. A14-5B). Northern blot hybridization and S1 nuclease protection assays showed that tRNA was cleaved in the anti-codon loop upon activation of CdiA-CT (Fig. A14-5B; Supplemental Fig. S5). The appearance of cleaved tRNA in vivo was coincident with growth inhibition, strongly suggesting that tRNase activity is cytotoxic. This conclusion was supported by a similar controlled degradation experiment using the inactive H178A variant of CdiACT, which did not inhibit cell growth (data not shown).
Because tRNase activity arrests cell growth, we next asked whether CysK is required to activate the CdiA-CT toxin in vivo. We repeated the CdiI-DAS degradation experiment in ΔcysK cells and found that SspB induction had no effect on cell growth in this background (Fig. A14-6A). Northern blot analysis showed no evidence of tRNase activity in ΔcysK cells, whereas tRNA2Arg was cleaved and ultimately degraded in the cysK+ background (Fig. A14-6B). We also tested CdiA-CT proteins lacking C-terminal residues for growth inhibition activity. The ΔGYGI version of CdiACT had no effect on cysK+andΔcysK cell growth (data not shown), consistent with its lack of tRNase activity in vitro (Supplemental Fig. S4). Although the ΔI version of CdiA-CT did not form a stable complex with CysK-His6 and had no detectable tRNase activity in vitro (Supplemental Fig. S4), this protein inhibited cell growth in a cysK-dependent manner (Fig. A14-6A). This growth inhibition was associated with tRNase activity, although at a significantly lower level than that observed with fulllength CdiA-CT (Fig. A14-6B). Together, these results suggest that CdiA-CT(ΔI) retains tRNase activity, but its reduced affinity for CysK limits growth inhibition to an intermediate level.
We next sought to complement the ΔcysK mutation with a plasmid-borne copy of the gene. We introduced plasmid pCH450-CysK (which expresses cysK under the control of an arabinose-inducible promoter) into ΔcysK sspB+ and ΔcysK ΔsspB backgrounds and then tested whether the resulting cells could be
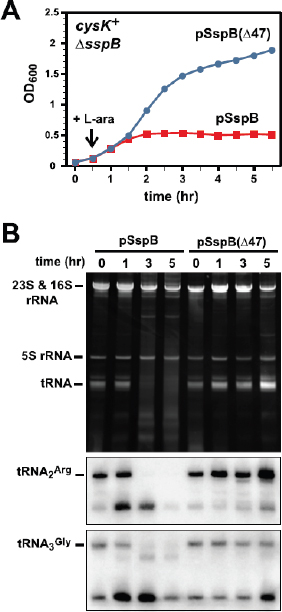
FIGURE A14-5 Activation of CdiA-CT in E. coli cells results in growth arrest and tRNA degradation. (A) E. coli cysK+ DsspB cells producing the CdiA-CT/CdiI-DAS complex were treated with L-arabinose (L-ara) to induce synthesis of either SspB or SspB(Δ47) from plasmid vectors. Wild-type SspB delivers DAStagged CdiI immunity protein to the ClpXP protease, whereas the SspB(Δ47) variant does so less efficiently. Cell growth was monitored by measuring the OD600 as a function of time. (B) Cells from the experiment in A were removed at various times, and total RNA was isolated for analysis by denaturing gel electrophoresis and Northern blot hybridization. The top panel shows total cellular RNA visualized by ethidium bromide staining. The bottom panels are Northern blots using probes specific for E. coli tRNA2Arg and tRNA3Gly. The gel migration positions of ribosomal RNAs (rRNAs) and tRNAs are indicated.
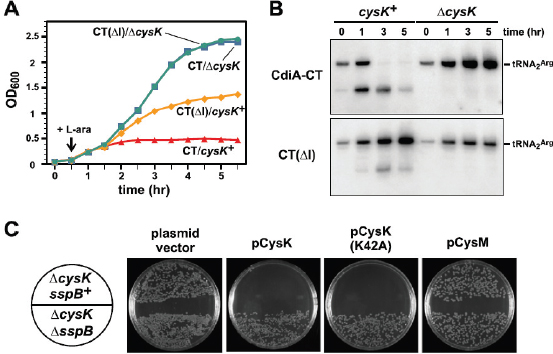
FIGURE A14-6 CysK is required for CdiA-CT-mediated growth inhibition and tRNase activity in vivo. (A) The DAS-tagged CdiI immunity protein was targeted for proteolysis by SspB production (induced by L-arabinose at the indicated time point) to liberate either CdiA-CT or CdiA-CT(DI) proteins in cysK+ and ΔcysK cells. Cell growth was monitored by measuring the OD600 as a function of time. (B) Cells from the experiment shown in A were removed at various times, and total RNA was isolated for Northern blot analysis. The gel migration positions of full-length and cleaved tRNA2Arg are indicated. (C) Complementation of the ΔcysK mutation. E. coli ΔcysK cells expressing the CdiACT/CdiI-DAS complex were transformed with plasmids that produce CysK, CysK(K42A), or CysM under control of the arabinose-inducible PBAD promoter. Transformants were selected on LB agar plates supplemented with 0.2% L-arabinose and the appropriate antibiotics. Transformation of E. coli ΔcysK ΔsspB cells serves as a control to demonstrate that CdiIDAS degradation is required for growth inhibition.
transformed with a compatible plasmid expressing the CdiA-CT/CdiI-DAS toxin/immunity pair. Control cells carrying the pCH450 vector plasmid without cysK were readily transformed with the CdiA-CT/CdiI-DAS plasmid (Fig. A14-6C). In contrast, no stable transformants were obtained with ΔcysK sspB+ pCH450CysK cells when plated on selective medium supplemented with L-arabinose to induce CysK synthesis (Fig. A14-6C). However, the ΔcysK ΔsspB pCH450-CysK cells could be readily transformed with the CdiA-CT/CdiI-DAS plasmid (Fig. A14-6C), reconfirming that SspB-dependent degradation of the DAS-tagged CdiI immunity protein is required for growth inhibition. This transformation assay was also used to examine growth inhibition in cells carrying plasmid-borne copies of the cysK(K42A) and cysM genes. Consistent with the in vitro tRNase experiments, we found that cysK(K42A) supported growth inhibition, whereas cysM did not (Fig. A14-6C). Together, these results demonstrate that CysK is required for CdiA-CTmediated growth inhibition.
CysK Is Required for UPEC536 CdiA-Mediated CDI
The toxicity of the CdiA-CT tRNase suggests that this nuclease activity is responsible for growth inhibition during cell-mediated CDIUPEC536. However, the UPEC536 CdiA protein is very large (~331 kDa) and could possess multiple toxic activities that act in concert to inhibit target cell growth. Therefore, we examined the role of tRNase activity by performing growth competitions using inhibitor cells that express full-length CdiA proteins from cosmid-borne CDIUPEC536 systems. Viable target cell counts were reduced ~100-fold after coculture with inhibitor cell expressing wild-type CdiA, whereas target cell growth was unaffected by inhibitor cells that express the His3193Ala version of CdiA lacking tRNase activity (Fig. A14-7A). Immunofluorescence staining using antibodies specific for the CdiA-CT confirmed that CdiA(H3193A) protein was expressed on the cell surface at approximately the same level as wild-type CdiA (Supplemental Fig. S6). These data strongly suggest the CdiA tRNase activity is solely responsible for growth inhibition during CDIUPEC536.
We next tested whether CysK is required to activate CdiA tRNase activity during cell-mediated CDI. Target cells carrying the ΔcysK mutation were completely resistant to inhibitor cells expressing UPEC536 CdiA (Fig. A14-7B), consistent with the toxin-activating function of CysK. Susceptibility to CDIUPEC536 was almost completely restored by providing ΔcysK target cells with a plasmid-borne copy of the cysK gene (Fig. A14-7B). In contrast, the ΔcysK mutation provided no protection against the E. coli EC93 CDI system (Fig. A14-7B), which delivers a different CdiA-CT toxin that is thought to inhibit cell growth by forming a pore in the inner membrane of target cells (Aoki et al. 2009, 2010). Thus, CysK plays a critical and specific role in CDI mediated by the CDIUPEC536 system.
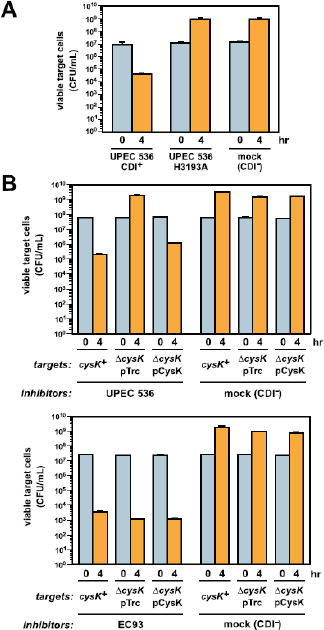
FIGURE A14-7 CysK is required for growth inhibition during CDIUPEC536. (A) tRNase activity is required for the inhibition of target cell growth during CDIUPEC536. Target cells were cocultured with inhibitor cells expressing either wild-type CdiA or a variant carrying the His3193Ala missense mutation, which ablates tRNase activity. Growth inhibition was assessed by quantifying the number of viable target cells as colony-forming units per milliliter (CFU/mL) at 0 and 4 h of coculture. The CDI– competition contained mock inhibitor cells carrying a cosmid vector with no CDI system. (B) CysK is required for growth inhibition during CDIUPEC536. Inhibitor cells expressing either the UPEC536 or EC93 CDI system were cocultured with cysK+, ΔcysK, and pCysK-complemented ΔcysK target cells. Viable target cells were determined (CFU/mL) at 0 and 4 h of coculture.
Discussion
The results presented here demonstrate that the CdiACT from UPEC536 is an anti-codon nuclease responsible for the inhibition of target cell growth during CDI. Remarkably, the cytotoxic tRNase activity of CdiA-CT is latent and requires activation by the biosynthetic enzyme CysK. CdiA-CT and CysK bind stably to one another, and this complex appears to be required for tRNase activity in vitro and in vivo. CdiA-CT variants lacking one to four C-terminal residues have a much lower affinity for CysK and exhibit no tRNase activity in vitro. Of course, the C-terminal deletions could also interfere with CdiA-CT structure and ablate tRNase activity independently of the CysK-binding defect. However, three observations argue against this latter possibility. First, both C-terminal deletion variants copurify with His6-tagged CdiI immunity protein during Ni2+-affinity chromatography, indicating that CdiA-CT structure is not grossly perturbed by these changes. Second, although CdiA-CT(ΔI) (which lacks the C-terminal Ile residue) has no detectable tRNase in vitro, it significantly interferes with cell growth when expressed in E. coli. This growth inhibition is dependent on CysK and is associated with the partial degradation of cellular tRNAs. These findings suggest that CdiA-CT(ΔI) remains an intrinsic tRNase, but its activity is limited by a lower binding affinity for CysK. Last, appending a Flag peptide epitope onto the C terminus of CdiA-CT also blocks CysK binding and abrogates tRNase activity (EJ Diner and CS Hayes, unpubl.). As with the other CdiA-CT variants, the Flag-tagged domain has high affinity for CdiI, again suggesting that it retains the wild-type fold. Thus, the CysK/CdiA-CT complex is likely to represent the functional tRNase. Importantly, these findings are relevant to cell-mediated CDI. Target cells deleted for the cysK gene are completely resistant to inhibitor cells expressing UPEC536 CdiA, demonstrating that CysK is critical for growth inhibition during CDIUPEC536. This function is unique and distinct from the roles played by other target cell proteins that act as receptors and/or mediators of CdiA-CT translocation. Thus, CysK acts as a permissive factor during CDIUPEC536, allowing the toxic tRNase activity of CdiA-CT to be manifest in the target cell cytoplasm.
Although CysK-binding is required to activate the CdiACT tRNase domain, the precise mechanism of activation is not clear. Initially, we hypothesized that the N-terminal domain of CdiA-CT suppressed the activity of its C-terminal tRNase domain and CysK binding altered the orientation of the two domains to relieve inhibition. This model is consistent with the observation that the C-terminal 145 residues of CdiA exhibit tRNase activity in the absence of CysK. However, deletion of the C-terminal Ile residue in the context of the CysK-independent tRNase domain significantly reduces activity in vitro (EJ Diner and CS Hayes, unpubl.), indicating that the GYGI peptide does not function simply as a toggle switch for nuclease activity. Perhaps CysK binding induces a rearrangement of active site residues to promote catalysis. Presumably, these conformational changes in the tRNase domain are subtle because CysK-bound CdiA-CT retains its affinity for the CdiI immunity protein. Alternatively, CysK could facilitate substrate binding,
perhaps even making direct contacts with tRNA. Finally, it is possible that the oligomerization of CdiA-CT is required for activation. CysK is a dimeric protein, and the proposed CdiA-CT-binding sites are presented on the same side of the homodimer (Rabeh and Cook 2004; Francois et al. 2006). Therefore, binding to CysK would tether two CdiA-CT proteins together in close approximation to one another. It is not immediately clear why an anticodon nuclease should require dimerization for activity, but this mechanism may explain why the truncated tRNase domain (Gly 83–Ile 227) requires 10-fold higher concentrations to attain the same activity of the CysK/CdiA-CT complex. We are currently testing these models using biochemical approaches and high-resolution crystallography.
In many bacteria and higher plants, CysK also binds stably to the CysE protein to form the cysteine synthase complex (Kredich et al. 1969; Droux et al. 1998; Zhu et al. 1998; Mino et al. 2000b; Kumaran et al. 2009). The molecular basis of the CysK/CysE interaction has been examined in detail, and these studies have demonstrated that the C terminus of CysE binds in the active site cleft of CysK (Bogdanova and Hell 1997; Mino et al. 2000a; Campanini et al. 2005; Huang et al. 2005; Kumaran et al. 2009). The C-terminal Ile residue of CysE is particularly critical for complex formation and mediates many of the contacts with CysK (Francois et al. 2006; Salsi et al. 2010). CdiA-CT contains a C-terminal GYGI peptide motif that is similar to the GDGI sequence in CysE, and like the cysteine synthase complex, the CdiA-CT/CysK interaction requires the C-terminal Ile residue of CdiA-CT and can be disrupted by O-acetyl-L-serine. These observations suggest that CdiA-CT and CysE both bind CysK in the same manner. The evolutionary significance of this molecular mimicry is unclear, but perhaps the CdiA-CT has coopted a well-conserved protein–protein interaction to ensure activation in a wide variety of bacteria. The CysK proteins from other bacterial species are capable of promoting CdiA-CT nuclease activity, but CDI growth inhibitory activities appear to be restricted to the same or closely related species (EJ Diner, ZC Ruhe, and CS Hayes, unpubl.). Intriguingly, the CdiA-CT tRNase domain shares significant sequence identity with a handful of predicted proteins from the Gram-positive species Ruminococcus lactaris, Clostridium acetobutylicum, Listeria innocua, and Geobacillus sp. Y412MC10 (see Supplemental Fig. S2). In Ruminococcus, Geobacillus, and C. acetobutylicum, the genes encoding the CdiA-CT homologs are immediately followed by genes for proteins that are clearly related to UPEC536 CdiI, suggesting that these genes encode toxin/immunity pairs. The function of these gene pairs has not been examined, but they may represent a growth competition system analogous to CDI. The CdiA-CT homolog in Geobacillus contains a WXG100 domain (Pfam PF06013) in its N terminus, suggesting it is exported through an ESX/type VII secretion pathway (Simeone et al. 2009; Sutcliffe 2011). It is unclear whether these Gram-positive tRNase domains also require activation by CysK. Although each Grampositive homolog contains the GYGI motif, these proteins are predicted to have additional C-terminal residues, which should prevent CysK binding. However, CysK from Bacillus subtilis activates CdiA-CT in vitro and in E. coli cells (EJ Diner and
CS Hayes, unpubl.), suggesting that the same activation mechanism could operate in Gram-positive bacteria, provided the C terminus of the tRNase domain is processed to expose the GYGI motif.
If growth inhibition is the sole function of the CDIUPEC536 system, then the benefit conferred by CysK-mediated toxin activation is not immediately obvious. In fact, toxin activation provides an additional opportunity for target cells to evolve resistance to CDIUPEC536 because cysK is not an essential gene. In contrast, soluble bacteriocins also deliver toxic domains into bacteria to inhibit growth, but typically only require cell envelope proteins for recognition and translocation of the toxin (Cascales et al. 2007; Chauleau et al. 2011). One exception appears to be colicinM(an inhibitor of peptidoglycan synthesis), which is remodeled into its active conformation by a peptidylprolyl cis-trans isomerase (FkpA) in the periplasm of target cells (Schaller et al. 1982; El Ghachi et al. 2006; Hullmann et al. 2008; Helbig et al. 2011). CysK has no known chaperone activity, but could perhaps stabilize the CdiA-CT in target cells. The hydrophobic C-terminal GYGI sequence resembles known recognition determinants for the ClpXP and ClpAP proteases (Sauer et al. 2004; Sauer and Baker 2011). Therefore, CysK could accentuate growth inhibition by protecting the tRNase domain from proteolysis. However, E. coli ΔclpX and ΔclpP mutants are no more sensitive to CDIUPEC536 than wild-type cells (CM Beck, JS Webb, DA Low, and CS Hayes, unpubl.). Perhaps the CysK/CdiA-CT complex serves other functions in addition to its characterized role in growth inhibition. For example, the interaction with CysK provides a possible mechanism to modulate sulfur metabolism and cysteine biosynthesis, which influence stress responses, antibiotic resistance, and biofilm formation (Ren et al. 2005; Ackerley et al. 2006; Fuentes et al. 2007). According to this model, the delivery of CdiA-CT between immune CDI+ cells would serve a contact-dependent signaling function to coordinate cellular activities in the same manner as quorum-sensing systems. Prior work with E. coli EC93 indicates that there is no exclusion mechanism to prevent CdiA-CT delivery between CDI+ bacteria (Aoki et al. 2010), suggesting that toxin exchange between isogenic cells is common. Intriguingly, we also found that UPEC536 carrying the His3193Ala missense mutation in cdiA exhibits a defect in biofilm formation compared with wild-type CDI+ cells (JS Webb, T Smith, and DA Low, unpubl.). We are currently exploring how tRNase activity impinges on the regulatory pathways that control biofilm formation and whether CdiA-CT exchange between UPEC536 serves an intercellular signaling function.
Materials and Methods
Bacterial strains and plasmids
All bacterial strains used in this study are listed in Supplemental Table S2. TheΔcysK::kan, ΔsucC::kan, ΔahpC::kan, ΔtreC::kan, and ΔsucD::kan gene disruptions were obtained from the Keio collection (Baba et al. 2006) and transduced into
E. coli strains CH1944 (Garza-Sánchez et al. 2006) or JCM158 wzb::kan (Aoki et al. 2008) using bacteriophage P1-mediated generalized transduction. Kanamycin resistance cassettes were excised using FLP recombinase as described (Datsenko and Wanner 2000). All plasmids and cosmids are listed in Supplemental Table S2, and construction details are outlined in the Supplemental Material.
Protein Purification
All CdiA-CT/CdiI-His6 complexes were overproduced and purified under nondenaturing conditions in reaction buffer (20mMsodium phosphate at pH 7.0, 150 mM NaCl, 10 mM b-mercaptoethanol) as described previously (Aoki et al. 2010). Each complex was denatured in reaction buffer containing 6 M guanidineHCl, and the CdiA-CT variants were isolated from CdiI-His6 by Ni2+-affinity chromatography. Purified CdiA-CT and CdiI-His6 proteins were refolded by dialysis into reaction buffer. Untagged CdiI was purified in the same manner from a complex with His6-tagged CdiA-CT. The various CysK-His6 and E. coli CysM-His6 proteins were purified by Ni2+-affinity chromatography under nondenaturing conditions. All His6-tagged proteins were eluted from Ni2+-NTA resin using reaction buffer supplemented with 250 mMimidazole. Imidazole was subsequently removed by dialysis against reaction buffer, and the purified proteins were quantified by absorbance at 280 nm.
Protein–Protein Interaction Assessed by Ni2+-Affinity Chromatography
Binding interactions between CdiA-CT and His6-tagged CysK proteins were assayed by copurification on Ni2+-NTA resin. Briefly, His6-tagged ‘‘bait’’ (i.e., CysK or CysM) and untagged ‘‘prey’’ CdiA-CT proteins were mixed together at a final concentration of 10 µM in reaction buffer. An aliquot of the protein mixture was removed (for subsequent SDS-PAGE analysis), and then Ni2+-NTA resin was added and the mixture was incubated at room temperature for 1 h. The reactions were centrifuged to collect the resin, and the supernatant was removed and analyzed as the ‘‘free’’ fraction. The resin was then washed three times with reaction buffer supplemented with 20 mM imidazole. Resin-bound proteins were eluted with reaction buffer supplemented with 250 mM imidazole. For the CdiACT/CysK complex- blocking experiments, CysK-His6 was preincubated for 15 min with 50 mM O-acetyl-L-serine (or 50 mM L-serine) in 100 mM Tris-HCl (pH 6.5) prior to the addition of CdiA-CT. All fractions (input, free, and bound) were analyzed by SDS-PAGE and staining with Coomassie brilliant blue.
In Vitro tRNase Assays
Dialyzed S100 fractions were used for tRNase activity assays, as described previously (Aoki et al. 2010). Purified tRNA substrates were prepared by either
GITC-phenol extraction (Garza-Sánchez et al. 2006) or DEAE-cellulose chromatography of E. coli S100 lysates (as described below). Reactions contained 0.1 µM CdiACT (and equimolar CdiI-His6, where indicated) and 130 ng/µL tRNA in reaction buffer supplemented with 10 mM MgCl2. The truncated CdiACT(G83-I227) domain was used at a higher concentration (1 µM final) for in vitro tRNase assays. Where indicated, CysM-His6 and CysK-His6 protein variants were included at a final concentration of 0.1 µM. Reactions were extracted with GITC-phenol extraction, and the isolated tRNAs were analyzed by gel electrophoresis on 8.3 M urea/6% polyacrylamide gels in 1×Tris-borate-EDTA (TBE) buffer. Gels were stained with ethidium bromide to visualize nucleic acids.
Purification of the CdiA-CT-Activating Factor
E. coli strain X90 was grown to OD600 ~1.0 in LB medium at 37°C and harvested over crushed ice. Cells were broken by French press, and the S100 fraction was prepared by ultracentrifugation at 100,000g for 4 h at 4°C as described (Powers and Noller 1991). Following ultracentrifugation, the S100 fraction was dialyzed against 20 mM Tris-HCl (pH 6.0) and 250 mM NaCl. The dialyzed S100 was passed over a DEAE-cellulose 52 column pre-equilibrated in 20 mM Tris-HCl (pH 6.0) and 250 mM NaCl. The flowthrough fraction (fraction A) contained most of the proteins present in the original S100 fraction (as determined by SDS-PAGE). Fraction B (which contained tRNAs and some proteins) was eluted from the DEAE-cellulose column with 20 mM Tris-HCl (pH 6.0) and 500 mM NaCl and dialyzed against reaction buffer for use as substrate tRNA for in vitro tRNase assays. Fraction A was dialyzed against 20 mM sodium phosphate (pH 7.0) and 75 mM NaCl and further fractionated by DEAE-cellulose chromatography to enrich for the CdiA-CT-activating factor. Proteins were eluted using a linear gradient of 75–150 mM NaCl in 20 mM sodium phosphate (pH 7.0), and individual fractions from the gradient were tested for the ability to stimulate the tRNase activity. The activating fractions were pooled, adjusted to 0.8 M (NH4)2SO4, and applied to a HiTrap butyl-Sepharose hydrophobic interaction column (GE Healthcare). Proteins were eluted by decreasing the (NH4)2SO4 concentration using a step gradient. Each fraction was dialyzed against reaction buffer and assayed for tRNase activity with 0.1 µM purified CdiA-CT. The fraction eluting at 0.6 M (NH4)2SO4 activated CdiA-CTand was analyzed by SDS-PAGE. This protein fraction (35 µg) was dialyzed into 50 mM ammonium bicarbonate and lyophilized for trypsin digestion and liquid chromatography–mass spectrometry analysis.
Growth Inhibition Activity of CdiA-CT
E. coli strains X90 ΔsspB and X90 ΔsspB ΔcysK carrying plasmids pCH410::sspB or pCH410::sspB(Δ47) (Poole et al. 2011) were transformed with plasmid pTrc99a::CdiA-CT/CdiI-DAS, and the resulting cells were grown to
mid-log phase in LB supplemented with 150 µg/mL ampicillin and 10 µg/mL tetracycline and then diluted to OD600 of 0.05 in fresh LB medium supplemented with ampicillin and tetracycline. Cells were grown for 30 min and then adjusted to 0.4% L-arabinose to induce the synthesis of SspB or SspB(Δ47). The OD600 was measured every 30 min following induction to monitor cell growth. Cell samples from each culture were removed and fixed with an equal volume of ice-cold methanol. Whole-cell RNA was then extracted by GITC-phenol for analysis by denaturing polyacrylamide gel electrophoresis. Specific tRNAs were also analyzed by Northern blot hybridization using end-labeled oligonucleotide probes as described (Hayes and Sauer 2003; Garza-Sánchez et al. 2006). Complementation experiments were performed with E. coli X90 ΔcysK and X90 ΔsspB ΔcysK strains carrying plasmid pTrc99a::CdiA-CT/CdiIDAS. These cells were made chemically competent and then transformed with plasmid constructs that express cysM and cysK variants under control of the L-arabinose-inducible PBAD promoter. Transformed cells were selected on LB agar plates supple-A permissive factor for CDI mented with L-arabinose (0.2%), ampicillin (150 µg/mL), and tetracycline (10 µg/mL).
Growth Competition Assays
Inhibitor and target E. coli strains were grown separately to midlog phase (OD600 ~0.5) at 37°C in LB medium without antibiotics. Inhibitor and target cells were then diluted to ~3 × 10⁷ colony-forming units (CFU) per milliliter and mixed at a 1:1 ratio in 10 mL of fresh LB medium. The coculture was then incubated with shaking in a 125-mL baffled flask at 37°C. Samples were taken at the 0-h and 4-h time points for serial dilution and quantification of viable cells (CFUs per milliliter) on LB agar plates supplemented with the appropriate antibiotics to select for either inhibitor or target cells. All inhibitor cells were based on E. coli strain EPI100 carrying cosmids pWEB-TNC (CDI–), pDAL866 (CdiAUPEC536), pDAL660Δ1-39 (CdiAEC93), and pDAL893 [CdiA(H3193A)UPEC536]. All target cells were based on the JCM158 Δwzb background. For the ΔcysK complementation studies, target cells carrying pTrc99A::cysK (or pTrc99A vector control) were grown in 1 mM IPTG prior to coculture with inhibitor cells.
Cell Surface Immunofluorescence
Cells expressing UPEC536 CdiA were grown to OD600 ~0.8 in LB medium at 37°C with aeration. Cells were harvested by centrifugation and resuspended in 0.2 mL of 4% formaldehyde in phosphate-buffered saline (PBS). After fixation for 15 min at room temperature, the cells were washed twice with 0.2 mL of PBS and resuspended in 1% bovine serum albumin in PBS. Rabbit polyclonal antisera specific for the CdiA-CT (1:50 dilution) were added and incubated at room temperature for 30 min. Cells were washed twice with 0.2 mL of PBS
and resuspended in 1% bovine serum albumin in PBS. Anti-rabbit Alexa- Fluor 488 antibody was added and incubated on ice for 30 min. Cells were washed, resuspended in PBS supplemented with 0.02% sodium azide, and pipetted onto poly-D-lysine slides. After drying for 5 min, slides were washed three times with 50 µL of Nanopure water and dried once more. One drop of FluoroGel in TES buffer (Electron Microscopy Sciences) was applied, followed by the cover slip. Slides were allowed to dry overnight at 4°C prior to fluorescence microscopy.
Acknowledgments
We thank Travis Smith and Aubrey MacMillan for performing preliminary growth competition experiments. Mass spectrometry and peptide identification were conducted at the University of California Davis Proteomics core facility. This work was supported by grants GM078634 (to C.S.H.) and U54AI065359 (to D.A.L.) from the National Institutes of Health, and grant 0642052 (to D.A.L.) from the National Science Foundation.
References
Ackerley DF, Barak Y, Lynch SV, Curtin J, Matin A. 2006. Effect of chromate stress on Escherichia coli K-12. J Bacteriol 188:3371–3381.
Aoki SK, Pamma R, Hernday AD, Bickham JE, Braaten BA, Low .DA. 2005. Contact-dependent inhibition of growth in Escherichia coli. Science 309: 1245–1248.
Aoki SK, Malinverni JC, Jacoby K, Thomas B, Pamma R, Trinh BN, Remers S, Webb J, Braaten BA, Silhavy TJ, et al 2008. Contact-dependent growth inhibition requires the essential outer membrane protein BamA (YaeT) as the receptor and the inner membrane transport protein AcrB. Mol Microbiol 70: 323–340.
Aoki SK, Webb JS, Braaten BA, Low DA. 2009. Contactdependent growth inhibition causes reversible metabolic down-regulation in Escherichia coli. J Bacteriol 191: 1777–1786.
Aoki SK, Diner EJ, de Roodenbeke CT, Burgess BR, Poole SJ, Braaten BA, Jones AM, Webb JS, Hayes CS, Cotter PA, et al. 2010. A widespread family of polymorphic contact-dependent toxin delivery systems in bacteria. Nature 468: 439–442.
Baba T, Ara T, Hasegawa M, Takai Y, Okumura Y, Baba M, Datsenko KA, Tomita M, Wanner BL, Mori H. 2006. Construction of Escherichia coli K-12 in-frame, single-gene knockout mutants: The Keio collection. Mol Syst Biol 2: 2006.0008. doi: 10.1038/msb4100050.
Bogdanova N, Hell R. 1997. Cysteine synthesis in plants: Protein– protein interactions of serine acetyltransferase from Arabidopsis thaliana. Plant J 11: 251–262.
Campanini B, Speroni F, Salsi E, Cook PF, Roderick SL, Huang B, Bettati S, Mozzarelli A. 2005. Interaction of serine acetyltransferase with O-acetylserine sulfhydrylase active site: Evidence from fluorescence spectroscopy. Protein Sci 14: 2115–2124.
Cascales E, Buchanan SK, Duche D, Kleanthous C, Lloubes R, Postle K, Riley M, Slatin S, Cavard D. 2007. Colicin biology. Microbiol Mol Biol Rev 71: 158–229.
Chauleau M, Mora L, Serba J, de Zamaroczy M. 2011. FtsHdependent processing of RNase colicins D and E3 means that only the cytotoxic domains are imported into the cytoplasm. J Biol Chem 286: 29397–29407.
Datsenko KA, Wanner BL. 2000. One-step inactivation of chromosomal genes in Escherichia coli K-12 using PCR products. Proc Natl Acad Sci 97: 6640–6645.
Droux M, Ruffet ML, Douce R, Job D. 1998. Interactions between serine acetyltransferase and O-acetylserine (thiol) lyase in higher plants–structural and kinetic properties of the free and bound enzymes. Eur J Biochem 255: 235–245.
El Ghachi M, Bouhss A, Barreteau H, Touze T, Auger G, Blanot D, Mengin-Lecreulx D. 2006. Colicin M exerts its bacteriolytic effect via enzymatic degradation of undecaprenyl phosphate-linked peptidoglycan precursors. J Biol Chem 281: 22761–22772.
Francois JA, Kumaran S, Jez JM. 2006. Structural basis for interaction of O-acetylserine sulfhydrylase and serine acetyltransferase in the Arabidopsis cysteine synthase complex. Plant Cell 18: 3647–3655.
Fuentes DE, Fuentes EL, Castro ME, Perez JM, Araya MA, Chasteen TG, Pichuantes SE, Vasquez CC. 2007. Cysteine metabolism-related genes and bacterial resistance to potassium tellurite. J Bacteriol 189: 8953–8960.
Garza-Sánchez F, Janssen BD, Hayes CS. 2006. Prolyl-tRNA(Pro) in the A-site of SecM-arrested ribosomes inhibits the recruitment of transfer-messenger RNA. J Biol Chem 281: 34258–34268.
Hayes CS, Sauer RT. 2003. Cleavage of the A site mRNA codon during ribosome pausing provides a mechanism for translational quality control. Mol Cell 12: 903–911.
Hayes CS, Aoki SK, Low DA. 2010. Bacterial contact-dependent delivery systems. Annu Rev Genet 44: 71–90.
Helbig S, Patzer SI, Schiene-Fischer C, Zeth K, Braun V. 2011. Activation of colicin M by the FkpA prolyl cis-trans isomerase/chaperone. J Biol Chem 286: 6280–6290.
Huang B, Vetting MW, Roderick SL. 2005. The active site of O-acetylserine sulfhydrylase is the anchor point for bienzyme complex formation with serine acetyltransferase. J Bacteriol 187: 3201–3205.
Hullmann J, Patzer SI, Romer C, Hantke K, Braun V. 2008. Periplasmic chaperone FkpA is essential for imported colicin M toxicity. Mol Microbiol 69: 926–937.
Kajava AV, Cheng N, Cleaver R, Kessel M, Simon MN, Willery E, Jacob-Dubuisson F, Locht C, Steven AC. 2001. b-Helix model for the filamentous haemagglutinin adhesin of Bordetella pertussis and related bacterial secretory proteins. Mol Microbiol 42: 279–292.
Kredich NM, Becker MA, Tomkins GM. 1969. Purification and characterization of cysteine synthetase, a bifunctional protein complex, from Salmonella typhimurium. J Biol Chem 244: 2428–2439.
Kumaran S, Jez JM. 2007. Thermodynamics of the interaction between O-acetylserine sulfhydrylase and the C-terminus of serine acetyltransferase. Biochemistry 46: 5586–5594.
Kumaran S, Yi H, Krishnan HB, Jez JM. 2009. Assembly of the cysteine synthase complex and the regulatory role of protein-protein interactions. J Biol Chem 284: 10268–10275.
McGinness KE, Baker TA, Sauer RT. 2006. Engineering controllable protein degradation. Mol Cell 22: 701–707.
Mino K, Yamanoue T, Sakiyama T, Eisaki N, Matsuyama A, Nakanishi K. 1999. Purification and characterization of serine acetyltransferase from Escherichia coli partially truncated at the C-terminal region. Biosci Biotechnol Biochem 63: 168–179.
Mino K, Hiraoka K, Imamura K, Sakiyama T, Eisaki N, Matsuyama A, Nakanishi K. 2000a. Characteristics of serine acetyltransferase from Escherichia coli deleting different lengths of amino acid residues from the C-terminus. Biosci Biotechnol Biochem 64: 1874–1880.
Mino K, Yamanoue T, Sakiyama T, Eisaki N, Matsuyama A, Nakanishi K. 2000b. Effects of bienzyme complex formation of cysteine synthetase from Escherichia coli on some properties and kinetics. Biosci Biotechnol Biochem 64: 1628–1640.
Poole SJ, Diner EJ, Aoki SK, Braaten BA, t’Kint de Roodenbeke C, Low DA, Hayes CS. 2011. Identification of functional toxin/immunity genes linked to contact-dependent growth inhibition (CDI) and rearrangement hotspot (Rhs) systems. PLoS Genet 7: e1002217. doi: 10.1371/journal.pgen.1002217.
Powers T, Noller HF. 1991. A functional pseudoknot in 16S ribosomal RNA. EMBO J 10: 2203–2214.
Rabeh WM, Cook PF. 2004. Structure and mechanism of O-acetylserine sulfhydrylase. J Biol Chem 279: 26803–26806.
Ren D, Zuo R, Gonzalez Barrios AF, Bedzyk LA, Eldridge GR, Pasmore ME, Wood TK. 2005. Differential gene expression for investigation of Escherichia coli biofilm inhibition by plant extract ursolic acid. Appl Environ Microbiol 71: 4022–4034.
Salsi E, Bayden AS, Spyrakis F, Amadasi A, Campanini B, Bettati S, Dodatko T, Cozzini P, Kellogg GE, Cook PF, et al. 2010. Design of O-acetylserine sulfhydrylase inhibitors by mimicking nature. J Med Chem 53: 345–356.
Sauer RT, Baker TA. 2011. AAA+ proteases: ATP-fueled machines of protein destruction. Annu Rev Biochem 80: 587–612.
Sauer RT, Bolon DN, Burton BM, Burton RE, Flynn JM, Grant RA, Hersch GL, Joshi SA, Kenniston JA, Levchenko I, et al. 2004. Sculpting the proteome with AAA+ proteases and disassembly machines. Cell 119: 9–18.
Schaller K, Holtje JV, Braun V. 1982. Colicin M is an inhibitor of murein biosynthesis. J Bacteriol 152: 994–1000.
Simeone R, Bottai D, Brosch R. 2009. ESX/type VII secretion systems and their role in host-pathogen interaction. Curr Opin Microbiol 12: 4–10.
Sutcliffe IC. 2011. New insights into the distribution of WXG100 protein secretion systems. Antonie van Leeuwenhoek 99: 127–131.
Tai CH, Nalabolu SR, Jacobson TM, Minter DE, Cook PF. 1993. Kinetic mechanisms of the A and B isozymes of O-acetylserine sulfhydrylase from Salmonella typhimurium LT-2 using the natural and alternative reactants. Biochemistry 32: 6433–6442.
Wah DA, Levchenko I, Baker TA, Sauer RT. 2002. Characterization of a specificity factor for an AAA+ ATPase: Assembly of SspB dimers with ssrA-tagged proteins and the ClpX hexamer. Chem Biol 9: 1237–1245.
Wah DA, Levchenko I, Rieckhof GE, Bolon DN, Baker TA, Sauer RT. 2003. Flexible linkers leash the substrate binding domain of SspB to a peptide module that stabilizes delivery complexes with the AAA+ ClpXP protease. Mol Cell 12: 355–363.
Zhao C, Moriga Y, Feng B, Kumada Y, Imanaka H, Imamura K, Nakanishi K. 2006. On the interaction site of serine acetyltransferase in the cysteine synthase complex from Escherichia coli. Biochem Biophys Res Commun 341: 911–916.
Zhu X, Yamaguchi T, Masada M. 1998. Complexes of serine acetyltransferase and isozymes of cysteine synthase in spinach leaves. Biosci Biotechnol Biochem 62: 947–952.
CHEATS AS FIRST PROPAGULES: A NEW HYPOTHESIS FOR THE EVOLUTION OF INDIVIDUALITY DURING THE TRANSITION FROM SINGLE CELLS TO MULTICELLULARITY58
Paul B. Rainey59,60and Benjamin Kerr61
Abstract
The emergence of individuality during the evolutionary transition from single cells to multicellularity poses a range of problems. A key issue is how variation in lower-level individuals generates a corporate (collective) entity with Darwinian characteristics. Of central importance to this process is the evolution of a means of collective reproduction, however, the evolution of a means of collective reproduction is not a trivial issue, requiring careful consideration of mechanistic details. Calling upon observations from experiments, we draw attention to proto-life cycles that emerge via unconventional routes and that transition, in single steps, individuality to higher levels. One such life cycle arises from conflicts among levels of selection and invokes cheats as a primitive germ line: it lays the foundation for collective reproduction, the basis of a self-policing system, the selective environment for the emergence of development, and hints at a plausible origin for a soma/germ line distinction.
Introduction
The panoply of plant and animal form that defines life owes much to the rise of multicellularity (Conway Morris, 1998). From a genetically diverse range of starting positions, independent unicellular lineages have made the transition to multicellularity (Bonner, 2000). The most ancient transitions occurred in the major lineages of large multicellular eukaryotes approximately 1,000 million years ago
___________
58 Rainey and Kerr, “Cheats as first propagules: A new hypothesis for the evolution of individuality during the transition from single cells to multicellularity,” BioEssays, 2010, Volume 32, Pp. 872-880. Copyright Wiley-VCH Verlag GmbH & Co. KGaA. Reproduced with permission.
59 New Zealand Institute for Advanced Study and Allan Wilson Centre for Molecular Ecology & Evolution, Massey University, Auckland, New Zealand. Email: Paul B. Rainey (p.b.rainey@massey. ac.nz).
60 New Zealand Institute for Advanced Study, Massey University, Private Bag 102904, North Shore Mail Centre 0745, Auckland, New Zealand.
61 Department of Biology, University of Washington, Box 351800 Seattle, Washington 98195, USA.
Abbreviations: MLS, multi-level selection; WS, wrinkly spreader.
(Wray, 2001). Multicellularity has also arisen in the ciliates, slime molds, diatoms, and certain groups of prokaryotes (Bonner, 2001; Kaiser, 2001; Keim et al., 2004; Shapiro, 1998; Tomitani et al., 2006); most recently it has occurred in the volvocine algae (Bonner, 1998; Kirk, 1998; Herron and Michod, 2008; Sachs, 2008).
The evolution of multicellularity involved a hierarchical shift in Darwinian individuality during which individual cells relinquished their capacity to reproduce as independent units and came to reproduce as part of a larger whole (Maynard Smith and Szathmary, 1995; Okasha, 2006). Explaining this shift in selection—from individual cells to groups of cells—poses a range of significant problems. Okasha (2006) summarizes: “The challenge is to understand […] transitions in Darwinian terms. Why was it advantageous for the lower-level units to sacrifice their individuality and form themselves into a corporate body? And how could such an arrangement, once first evolved, be evolutionarily stable?” Equally, one might focus on the higher level and ask how individuality emerges at the level of the corporate body. In placing the emphasis on individuality at the higher level (Michod, 1999) there is recognition that individuality is a derived character and one that requires an evolutionary explanation (Buss, 1987). The key issue is to explain how variation in lower-level individuals generates a corporate entity with Darwinian characteristics (Dennett, 1995). In this context we argue that the critical problem is the evolution of a means of collective reproduction.
The obvious solution is a life cycle: life cycles involving single-cell bottlenecks are a ubiquitous feature of multicellular life (Buss, 1987; Wolpert, 1990; Wolpert and Szathmary, 2002): life cycles allow collectives to produce offspring. Despite their biological significance, the evolutionary origins of life cycles are unclear (Buss, 1987; Minelli and Fusco, 2010). Here, informed by experimental studies, we draw attention to critical issues and mechanistic problems that lie at the heart of life cycle evolution. We suggest solutions—albeit of an unconventional sort—and even go so far as to suggest that one route to a proto-life cycle may have been fueled by the tension inherent in levels of selection and may have involved cheating genotypes as propagules.
The Multi-Level Selection Framework
Multi-level selection (MLS) theory (Damuth and Heisler, 1998; Heisler and Damuth, 1987; Okasha, 2006; Sober and Wilson, 1998) provides a powerful theoretical framework within which to consider major evolutionary transitions. During initial stages of the transition from single cells to multicellularity, the focus is individual cells. Given appropriate ecological conditions (Bell, 1985; Boraas et al., 1998; Rainey and Rainey, 2003), selection favors the evolution of simple undifferentiated groups—arising, for example, from the production of adhesive glues (Rainey and Rainey, 2003; Rokas, 2008; Sebe-Pedros et al., 2010, Velicer and Yu, 2003). The cause of cooperation (production of adhesive glues) is the property of the individual cells. Selection at the higher (group) level affects the spread of the trait, but group fitness is nothing more than the average (or sum) of
the fitness of the individual cells that comprise the group. From a formal perspective the spread of cooperation is readily explained by kin selection and traditional group selection theory and is encompassed by MLS-1 theory. Within this MLS-1 framework, the fittest groups are those that contribute the greatest number of individual cells to the next generation (Damuth and Heisler, 1988; Okasha, 2006).
However, the transition to multicellularity is far more than the evolution of cooperation. Critical for the evolution of multicellular organisms is the evolution of group level adaptations including group reproduction, mechanisms to suppress cheating, and the emergence of development and differentiation. The focus of attention thus shifts from traits that are defined by the properties of individual entities to traits that are the properties of groups of cells. This shift marks a significant alteration in perspective and a move to the MLS-2 framework (Damuth and Heisler, 1988). However, in MLS-2, group fitness is defined independently of particle fitness. The most successful groups are those that contribute the greatest number of group offspring to the next generation irrespective of the number of cells those groups contain. Thus, fitness in MLS-1 and MLS-2 contexts is different: in the MLS-1 context, fitness is the number of offspring particles, whereas, in MLS-2, the number of offspring collectives defines fitness. While this makes intuitive—and theoretical—sense (Okasha, 2006), it does not amount to an explanation: just how individuality transfers from particles to collectives is a profound problem.
Theoretical studies of Michod and Nedelcu have made important contributions, particularly the concept of fitness decoupling: the need—during an evolutionary transition—for fitness at the higher level to become decoupled from the fitness of lower level (Michod and Nedelcu, 2003). While being a seminal insight, the mechanism by which it comes about is unclear. For example, Michod (1999) uses a simple model for the evolution of multicellularity that begins with “adult” organisms comprised of two cell types (cooperate and defect). Although the adult organisms are capable of producing offspring propagules, the production of propagules is not a consequence of adult functionality, but rather is dependent on the average fitness of the individual entities of which each adult is comprised. As Okasha (2006) remarks, this is “a sort of gray area between MLS-1 and MLS-2.” Gradually, as the transition proceeds, fitness becomes “decoupled” from the lower level and with this, individuality emerges at the level of the adult, to the point where the capacity to leave offspring is a product of adult functionality and independent of the reproductive properties of the individual cells. While such a scenario describes plausible changes, the model assumes that the capacity to leave group offspring is already in place. But how such a new level of reproduction emerges requires explanation.
The Evolutionary Emergence of Group Reproduction
From a theoretical perspective the shift from MLS-1 to MLS-2 encapsulates an evolutionary transition in individuality. The transition completes when the
higher-level entities become Darwinian individuals, that is, when populations of these organisms display variation, heritability, and reproduction. Thus, one critical trait that marks individuality at the higher level is the capacity for groups to leave offspring groups.
Reproduction of collectives requires development and a life cycle, which is not something that newly formed groups are necessarily born with (Buss, 1987; Griesemer, 2000; Minelli and Fusco, 2010). When considering the evolutionary origins of such a capability—particularly via natural selection—problems arise. The evolution of traits adaptive at a given level of biological organization requires the existence—at that level—of the necessary prerequisites for Darwinian individuality (Dawkins, 1982; Dennett, 1995; Hull, 1980; Lewontin, 1970; Maynard Smith, 1988). When the trait whose origin we wish to explain is reproduction we face a dilemma: appeals to natural selection would seem to presuppose the existence of collective reproduction—the very trait whose evolution requires explanation. Griesemer foresaw precisely this problem when he argued that explaining the emergence of a new level of organization is necessary before invoking the evolution of adaptations specific to that new level (Griesemer, 2000).
Below we outline two adaptive solutions in which individuality emerges at the very same moment that the capacity for groups to leave collective offspring evolves. However, we also recognize the potential for non-adaptive solutions. A third possibility is that evolution of a means of collective reproduction is not necessary and that selection on group viability alone is sufficient. This final option we consider unlikely and explain why in the next section.
The Inadequacy of Viability Selection
The absence of a means of collective reproduction does not mean that selection cannot act on collectives, but its capacity to do so is limited to selection at the level of collective viability. Provided that simple undifferentiated groups can evolve repeatedly from the ancestral state (which is readily envisaged), then selection will favor the most viable groups (Figure A15-1A). Although such groups are seen by selection, the connection between the consequences of selection at the level of groups at one point in time and the properties of groups at a latter point in time is lacking. The only connection is via the lower-level entities. It is difficult to see how viability selection alone could result in the evolution of true group-level traits such as the capacity for group reproduction, let alone self-policing, development, and differentiation.
Imagine, however, that the viability process operates in tandem with a process by which groups are created from the lower-level parts of pre-existing groups (Figure A15-1B). For selection to work creatively—and potently—on the higher level it is crucial for groups to beget groups. But this returns us to the paradoxical situation described above: namely, that the capacity of groups to beget groups requires groups to have evolved this capacity.
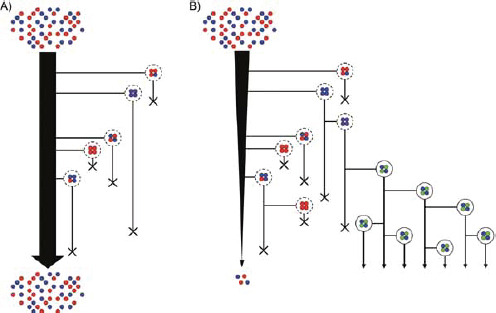
FIGURE A15-1 The role of group reproduction in group adaptation. A: A scenario is shown in which loose groups form from individual cells (given as red and blue circles). These groups do not beget new groups, nor do they contribute individual cells back to the cell population. Natural selection can certainly act on these groups. For example, in the picture, groups with more blue cells live longer and therefore the frequency of blue cells within groups remains high (this occurs even though the blue cells are at a frequency equal to the red cells within the “free cell” population). However, there is no way for evolutionary innovations at the group level to propagate through this form of group viability selection (given finite group lifetimes). For example, it is not the case that groups with blue cells are more likely to form in future generations because they have a viability advantage at the group level. B: A scenario is shown where group reproduction occurs. This opens the door for fecundity selection at the level of groups. In this picture, if a group possesses an innovation improving its survival or reproduction, then the innovation can be passed on to daughter groups. For example, the production of specialized cell types (shown in green) leads to a proliferation of groups with these specialized cells. Such a scheme requires both group reproduction and heredity of the developmental program. In this figure we surround the constituent cells with a solid outer circle as they now have some of the properties associated with a higher-level individual (i.e. differentiation of parts and capacity to reproduce). If these groups compete with their free cell cousins and group formation confers advantages, then this population could shift from lower-level individuals to higher-level individuals, thereby accomplishing a major transition.
Insights from Experiments
Our experimental work uses populations of the bacterium Pseudomonas fluorescens. When propagated in a spatially structured environment, the ancestral bacterium diversifies producing a range of niche specialist genotypes (Rainey and Travisano, 1998). Among the numerous emergent forms is a class of genotypes collectively known as wrinkly spreader (WS), which form a self-supporting mat at the air-liquid interface (Figure A15-2).
WS genotypes arise from a wide range of simple mutations that result in over-activation of adhesive factors (a cellulosic polymer and a proteinaceous factor (Spiers et al., 2003; Spiers et al., 2002; Spiers and Rainey, 2005). The overproduction of“glues” causes cells to remain attached after cell division. While there is a significant fitness cost to each individual WS mutant (Knight et al., 2006; MacLean et al., 2004; Rainey and Rainey, 2003), WS cells nonetheless increase in frequency ultimately out-competing the ancestral genotype. They achieve this because the cost to individual cells is traded against a benefit that accrues to the group of WS cells. It works as follows: the production of adhesive glues means that upon binary fission, daughter cells remain linked. Continuing cell division causes the population of cells to expand in a single-cell layer across the air-liquid
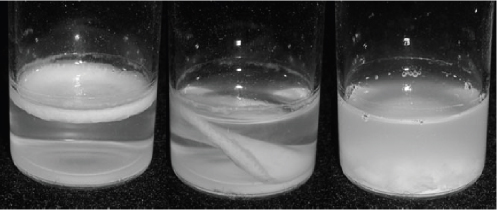
FIGURE A15-2 The rise, fall, and destruction of a simple undifferentiated group. Left: The wrinkly spreader mat is the cumulative product of the cooperative interactions of millions of cells. By working together the cells in the mat colonize the air-liquid interface—a niche that is unavailable for the ancestral (broth-colonizing) type. In colonizing this new niche the cells of the mat are rewarded with an abundance of oxygen. Middle: When the mat becomes too heavy, it collapses into the broth (it is not buoyant). The collapse is hastened by the presence of cheating genotypes that grow like a cancer within the mat adding no structural strength, but reaping the benefits (access to oxygen). Right: A mat is far more than the sum of the individual parts. This photo was taken immediately after disturbing (with a brief shake) a microcosm with an intact mat. The mat breaks into many pieces (just visible on the bottom) and does not spontaneously reform. While a mat will eventually re-emerge, it will do so by a process of growth and development from a limiting inoculum.
interface ultimately joining and becoming attached to the edge of the glass vial. Once the surface is colonized, the mat grows in thickness, becoming a robust structure that is the cumulative product of the cooperative interactions of many millions of cells. By working together, the cells in the mat colonize a niche unavailable to the ancestral type. In colonizing this new niche the cells of the mat are rewarded with an abundance of oxygen (Rainy and Rainey, 2003).
The evolution of a WS mat involves the evolution of cooperation—de novo and in real time—from an ancestral state that is asocial and unicellular. The spread of polymer production is readily explained by kin selection (Hamilton, 1964a, 1964b). Baring mutation, clonal reproduction means that WS mats are comprised of individuals whose relatedness is complete, the mat being a clone of genetically identical cells. Given mutation, the evolution of cheating (selfish) types is to be expected. Such types evolve and grow as a cancer within the mat. Cheats do not produce adhesive polymers and therefore grow rapidly—they are also highly motile. Provided they arise within the fabric of the mat then they reap the benefits of group membership (access to oxygen) while forgoing the cost of polymer production: in doing so they make no contribution to the network of polymeric strands required for maintenance of mat integrity. As might be anticipated, the cancerous growths compromise the WS mat, and it ultimately collapses (Rainey and Rainey, 2003) (Figure A15-2): a classic tragedy of the commons (Hardin, 1968).
The emergence of groups leads to questions as to their further evolution. At this point, standard (MLS-1) group selection models are invoked, but it becomes apparent that such models fail to fit with the biological reality of newly formed WS groups. Standard group selection models effectively explain the maintenance of cooperation in the face of selfish types that emerge as a consequence of selection at the lower level. In the absence of population structure, selfish types ultimately out-compete cooperating types causing their extinction. If population structure exists, then cooperating types can be maintained provided there is periodic dispersal of cells into a global population, reassortment, followed by the formation of new groups (Maynard Smith, 1964; Wilson, 1975). This requires that the cells within each group periodically switch off traits that determine social behavior and then reactivate their expression to form new groups. This requires the existence of developmental control—a group-level trait—the evolution of which raises the problems discussed above. In the absence of a means of regulating social behavior, newly formed groups are driven extinct by selfish types.
One way forward would be for group reproduction to be effected by an external factor, for example, stochastic disturbance of microcosms. Individuality of a kind would therefore be endowed to the groups, but it is difficult to see how this haphazard means of reproduction would be effective. Dawkins (Hull, 1980) comes to a similar conclusion regarding the difficulty of organismal adaptation given reproduction through a type of slapdash fissioning.
Life Cycles: Solutions and Transitions
For Dawkins, adaptive evolution at the level of the multicellular organism requires a developmental cycle (e.g. multicellular differentiation from a single-cell origin each generation). However, to avoid the pitfall of invoking group reproduction as a precondition for its own evolution any adaptive solution to the evolution of a life cycle would appear to require the emergence of a life cycle concomitant with the transition in individuality. While seemingly improbable, we outline two scenarios, the first arising directly from experimental studies.
Consider the model Pseudomonas populations: the moment the number of WS cells become sufficient to form a mat the stage is set for the evolution of cheating types. Cheats, while being the nemesis of the mat, are also its potential savior. Cheats have characteristics of propagules: they can disperse from the mat—like a germ line they can regenerate WS, albeit upon further mutation (Figure A15-3). Indeed, in the case of Pseudomonas, the modular nature of the genetic architecture underlying the evolution of WS genotypes provides considerable evolutionarily flexibility (Beaumont et al., 2006; McDonald et al., 2009). Ancestral genotypes readily give rise to WS genotypes, which in turn lose the mat-forming phenotype by simple mutations that suppress production of the adhesive glues. The effects of these suppressor mutations can be readily reversed by mutations at additional loci (Beaumont et al., 2009). Thus, from the tension among levels of selection, a proto-life cycle emerges spontaneously (given appropriate ecological conditions) and with no requirement to invoke group-level reproduction as a precondition.
A life cycle that requires mutation to transition the emerging “organism” between phenotypic states is a far cry from a developmentally regulated life cycle; however, its existence is sufficient to allow selection to operate at the level of the collective. Indeed, we suggest that the proto-life cycle might provide the basis for the evolutionary emergence of development—a “kick-start”—that establishes the ecological conditions necessary for the eventual integration of “life cycle” phases within a single cohesive organism (Boxes A15-1 and A15-2). Indeed, a recent experiment in which P. fluorescens cells were “forced” to transition between groups gives reason for optimism. After just four cycles, in two (of twelve) replicate lines, genotypes arose that evolved the capacity to switch stochastically between states by an epigenetic mechanism (Beaumont et al., 2009).
The emergence of such phenotype switching is a critical event in the evolution of developmental control (Schlichting and Pigliucci, 1993; West-Eberhard, 2003). While the end product remains to be experimentally realized, we envisage developmental control emerging as a multi-step process, the first stage being the realization of a novel phenotypic state (the mat-forming phenotype)—the result of selection in an “extraordinary environment” (Lande, 2009). Mutation brings the existing pathway to an expression (and phenotypic) state inaccessible to the ancestral genotype (Bantinaki et al., 2007). While adaptive in the new environment, the trait is not environmentally responsive. Critical
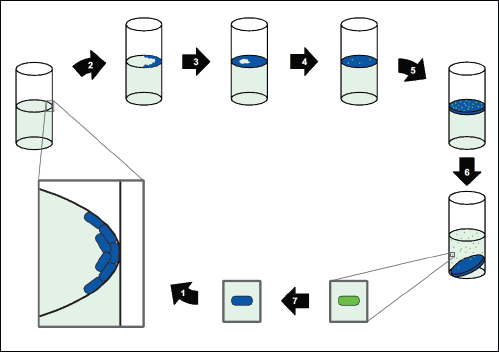
FIGURE A15-3 A putative life cycle for mat-forming bacteria. We start with a single bacterium (given in blue) capable of producing an extracellular adhesive. (1) It reproduces at the interface between liquid and air (in the case shown, starting at the inner surface of a glass tube). Daughter cells stick together because of the adhesive they produce. (2, 3) The resulting mat spreads over the liquid’s surface as a single-cell layer. (4) Due to prime access to oxygen, a robust mat forms. Mutation generates “cheats” (green cells that do not produce any adhesive polymer and grow faster as a consequence). (5) These cheats spread like a cancer within the mat and contribute to (6) the collapse of the mat. Because the cheats do not produce the adhesive, they are liberated from the mat upon collapse. (7) Back mutation from one of these cheats to a mat-producing cell completes the life cycle. Of course, we do not imagine such a life cycle playing out in an environment where only a single mat can form (like a single tube). Rather, the back mutants from the liberated cheats could establish mats in different locations from their parent mat. Here the cell type leading to the death of the group also leads to its rebirth. The cheats amount to propagules (‘‘germ line’’), arising de novo from the mat-forming ‘‘soma’’ of an incipient multicellular individual.
evolutionary events are thus required to “rewire” the organism, such that mat formation comes under developmental control. We suggest that continued selection in an environment that favors alternate phenotypic states (mat-forming and cheating) provides such an opportunity. In outlining this scenario we recognize both parallels and differences with traditional and emerging ideas surrounding the evolution of developmental control (Lande, 2009; Minelli and Fusco, 2010; Pigliucci et al., 2006; Schmalhausen, 1949; Snell-Rood et al., 2010; Waddington, 1942; West-Eberhard, 2003).
BOX A15-1
Model for the Development of a Single Mat
Here we develop a simple discrete-time model to track differentiation within a mat and its eventual collapse. The model follows two cell types: mat formers and cheats. We begin by describing the population dynamics within a single mat. Assuming that every mat is initialized by a single mat former cell, then over time, mutation generates cheats. Let m(t) and c(t) be the sizes of the mat former and cheat populations, respectively, in a single mat at time t. Populations within a mat grow according to the following branching process (Haccou et al., 2005):

The sets {X1, X2, X3, …} and {Y1, Y2, Y3, …} contain independent and identically distributed (i.i.d.) Poisson-distributed random variables (X~Poisson(βm) and Y~Poisson(βc)). The ith mat former has Xi offspring cells, whereas the jth cheat has Yj offspring cells. In this model, βm and βc are the average number of offspring cells per mat-forming cell and cheat, respectively, per unit of time (β′s are birth factors). Because cheats reproduce without contributing to the integrity of the mat, we assume that these cells have a birth rate advantage, i.e. βc > βm.
The sets {F1, F2, F3, …} and {G1, G2, G3, …} contain i.i.d. binomially distributed random variables (F(n)~Binomial(n,μm,c) and G(n)~Binomial(n,μc,m)). Of its Xi offspring, the ith mat former has Fi cheating mutants, and of its Yj offspring, the jth cheat has Gj mat former mutants. For simplicity, we let the probability of mutation from mat former to cheat (μm,c) and from cheat to mat former (μc,m) be equal: μm,c= μc,m=μ (Box A15-2).
The cell dynamics within a microbial mat are given by equations (1) and (2). In addition, we assume that any mat has a finite lifetime (t*). The probability that a mat collapses at time t* = T is given by:
| Pr(t* = T) = 1−exp{−(αmm(T) + αcc(T))} | (3) |
Thus, as the number of cells in a mat increase, the mat is more likely to collapse. Again, because cheats do not contribute to mat integrity, they have a disproportionate negative effect on the lifetime of the mat, i.e. αc > αm.
Additional scenarios for the evolution of life cycles that might effect the transition from MLS-1 to MLS-2 can be envisaged. Before considering non-adaptive models for life cycle evolution, we describe an alternative hypothesis in which, unlike the model above where the “germ line” is interrupted by mutation, here the germ line is uninterrupted by mutation. From the outset such a model is appealing because it removes the potentially restrictive requirement of mutation for the transition between stages of the life cycle.
Once again we make use of the model Pseudomonas populations as a vehicle for our ideas, but this time we take as the focus of interest the lower-level (cheating) entities. Consider the cheating type as a totipotent germ line. Imagine that during the course of its growth it produces, by chance mutation, a cell type with which it interacts, either directly, or indirectly, and which, via that interaction, aids its own reproductive output. We might consider this a “helper” type; indeed, we might consider the WS genotype an exemplar of such a helper, although in so doing we add a level of complexity (and selection) that is not necessary: the helper may be any kind of reproductive altruist. An interesting example is provided by the suicidal altruists of Salmonella typhimurium that die while preparing the ground for infection (Ackermann et al., 2008).
Nonetheless, returning to the familiar WS: as the mat forms it becomes infiltrated by cells of the germ line which reap the advantage that accrues from growth at the air-liquid interface. Eventually the mat collapses and the WS lineage goes extinct; nonetheless, the germ line remains and in time gives rise to further WS types which it again exploits for its own advantage. Such a scenario captures aspects of an earlier hypothesis in which the germ line originates as a consequence of “other cell lineages altruistically removing themselves from the reproductive line to perform some somatic benefit to the organism” (Queller et al., 2000). From one perspective, the WS is an extreme altruist, sacrificing its life for the germ line (altruism being an indirect consequence of the short-term advantage gained from colonization of the oxygen-replete air-liquid interface). From another perspective, the WS is an unfortunate pawn, sacrificed by the germ line.
Thus from different starting positions we arrive at essentially the same end point: in both, interrupted and uninterrupted models, there exists potential for the evolution of a life cycle and with that exists potential to arrest in the germ line stage: individuality in an MLS-2 sense is apparent. There are, however, some differences. For example, the interrupted model carries with it the initially burdensome requirement for mutation to mediate the transition between different stages of the life cycle, whereas the uninterrupted model requires only one-way mutation (to dead-end helper cells). The uninterrupted model thus seems to offer a lower hurdle for an evolutionary transition. However, things get more complex when one considers a second distinguishing feature, namely the origin of multicellular differentiation. The uninterrupted model requires the emergence of extreme altruism via mutation in the presence of would-be cheats. On the other hand, the interrupted model involves nothing more than the advent of cheats in the face of cooperation. We do, however, note that for both models, the reliance on mutation sets a lower limit to the number of cells that comprise each collective.
In outlining these two models our intention has been to portray possible scenarios for the evolution of life cycles, particularly the selective conditions favoring ecologically distinct phenotypes, that might eventually evolve to come under regulatory (developmental) control. The molecular details by which such control could emerge are unknown but are likely to depend on non-adaptive processes such
BOX A15-2
Adaptive Developmental Programs in Mat Populations
A life cycle initially dependent upon mutation and fueled by conflicts among levels of selection appears understandably restrictive. In particular, there is the thorny issue of heritability, which arises from the mutational lottery that determines the fate of cells. However, this problem is not as great as it may first seem: the critical issue is the rate of transition between states and this rate is heritable. Indeed, the way a mat consigns cells to different categories via mutation defines its developmental program. In turn, this yields the life history of the mat. Thus, we focus on how changes in mutation rate (μ) affect mat fitness. Here we show how the developmental program can be adaptively tuned to specific ecological conditions.
Mat-level fitness is the ability of the mat to generate offspring mats and is proportional to the number of cheats contained in the mat upon its collapse. This fitness metric is fully adequate if mats always have the same generation time. However, the generation time of a mat is specified (at least probabilistically) by its developmental program [Eq. (3) in Box A15-1].
All else being equal, a shorter generation time is beneficial within a growing population of mats. However, because cheats simultaneously contribute to mat reproduction and expiration, all else is not equal. For instance, if a slightly longerlived mat can have many more cheats upon collapse, then it may be advantageous to live longer. Different ecological circumstances will favor different developmental programs. Here, we consider two ecological conditions. In the first (r-selection), sites for mat formation are always available, so there is a premium on a short mat generation time. Production of cheats should be adjusted as to maximize growth rate within an expanding population of mats. In the second condition (K-selection), sites for mat formation are rarely encountered and there is pressure to lengthen mat generation time to maximize the absolute number of cheat cells produced by a mat. We use the model from Box A15-1 to identify the optimal mutation rate under r- and K-selection.
As in Box A15-1, assume a given mat collapses at t*. There are c(t*) cheats at this time, which we label c*. Under r-selection, we maximize growth rate of mats within a mat population. To do this, we consider the joint distribution of t* and c*. Specifically, for any mat, we have:
Pr(t* – T and c* = C) = π(T,C)
Armed with this distribution, the long-term growth rate (r) of a mat population with a specified developmental program is given by the solution to the Euler-Lotka equation (Euler, 1760; Fisher, 1930; Lotka, 1925):
![]()
For simplicity, we assume that a fraction μ of the cheats mutate back to mat formers directly after the mat collapses.
We use a Monte Carlo simulation approach to generate the joint distribution π. Specifically, we generate 50,000 points (t*, c*)i using equations (1)–(3). An example of this joint distribution is shown in Fig. A15-2-1. In the figure we see the
life history tradeoff faced by the mat: higher fecundity requires a longer generation time. With this joint distribution, we solve the following equation for r:
![]()
We then look for the mutation rate (μ) that maximizes r. For K-selection, we search for the mutation rate that maximizes c*. We employ the same Monte Carlo approach to generate 50,000 c* values, then we look for the mutation rate that maximizes the average c* value.
Figure A15-2-2 shows the results of this analysis: under rselection, high mutation rates are favored; under K-selection, lower mutation rates are favored. Under r-selection, longevity is sacrificed for a quick investment in cheats allowing a rapid explosion of mats. Under K-selection, longerlived mats are selectively favored to maximize cheat output.
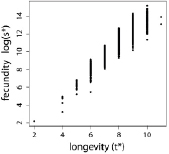
FIGURE A15-2-1 The joint distribution of mat longevity and mat fecundity. These points were generated from simulations of mat development given by Eqs. (1), (2), and (3) (βm = 4.0, βc = 6.0, αm = 10-6, αc = 10-5).
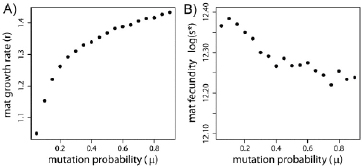
FIGURE A15-2-2 Optimal mutation rates in mat development. A: Long-term growth (in an r-selected environment) is shown as a function of the mutation probability. Here we see higher mutation rates yielding faster growth of lineage of mats. B: Mat fecundity (favored in a K-selected environment) is maximized at lower rates of mutation. In parts A and B, the parameters of the model are the same as those in Fig. A15-2-1.
as mutation and genetic drift (Lynch, 2007), opportunities for co-option (True and Carroll, 202; Wu et al., 2007) (facilitated by mutation and drift) and the existence of plasticity (West-Eberhard, 1989, 2003). Under some circumstances it is even possible that the plasticity inherent in the genomic and regulatory organization of certain unicellular entities might be sufficient to produce a simple life cycle with minimal involvement from selection. For example, single cells driven to group formation as a mechanism of predation-avoidance might—given an appropriately organized and pre-prepared regulatory system—be capable of utilizing gradients generated across the colony as a means of, for example, regulating the transition between clumping and dispersing behaviors (Hochberg et al., 2008).
An idea like this involving co-option of a life history gene has been suggested to explain the evolution of reproductive altruism in the higher volvocine algae (Nedelcu and Michod, 2006). The central idea is that in the ancestral (unicellular) state expression of the life history gene is conditioned on an environmental cue, but during the transition to multicellularity it evolves to come under the control of spatial (developmental) signals. Such a scenario makes a good deal of sense and is even supported by studies of regA expression (a regulator of chloroplast expression) in unicellular versus multicellular volvocine algae (Nedelcu and Michod, 2006). However, just how such a change comes about—particularly the change necessary to bring differentiation under the control of endogenous signals—still requires an evolutionary explanation (see Michod et al., 2006 and Michod, 2006 for a possible mechanism based on a viability-fecundity tradeoff).
Conclusion
Darwinian transitions in individuality, particularly those originating from a fraternal alliance among lower-level entities (Queller, 2000), pose some of the most tantalizing problems in biology. Here we have drawn attention to the need to explain, in mechanistic terms, how variation in lower-level individuals generates a corporate entity with Darwinian characteristics (Dennett, 1995). Our emphasis on this issue stems from the recognition that any explanation for the evolution of multicellularity from unicells—for the transition between MLS-1 and MLS-2—is dependent upon explaining how collectives evolve the capacity to leave collective offspring. The life cycle, we argue, is the critical innovation: life cycles decouple fitness—they transition individuality.
The unconventional life cycles that span the MLS-1 to MLS-2 juncture are founded in experimental reality. The interrupted life cycle model can operate in experimental Pseudomonas populations and, via its operation, WS mats can assume the role of “organisms”—organisms whose fitness is measured, not by the number of bacterial cells within each mat, but by the number of mat offspring left by parents. In advocating this model as one route to a proto-life cycle we recognize the irony. Tensions between levels of selection are typically viewed as significant impediments to evolutionary transitions (Jablonka and Lamb, 2006; Maynard Smith and Szathmary, 1995; Michod, 1996) but our altered perspective
reveals a creative role for conflict. This conflict generates in a single step a means of collective reproduction, a life cycle, the basis of a self-policing system (Boxes A15-1 and A15-2), and ecological circumstances possibly conducive to the eventual emergence of development. In addition, the hypothesis provides a plausible scenario for the origin of a soma/germ line distinction, and for sequestration of the germ line by soma—the latter arising from the fact that WS “soma” is under strong selection to check increased replication of cheating germ line types. In this context it is interesting to note recent ideas on the evolution of ageing as a deprivation syndrome driven by the tension between soma and germ line (Heininger, 2002)—a tension that perhaps, at least for some evolutionary transitions, may have an ancient past.
Acknowledgements
This work is supported by the Marsden Fund Council from government funding administered by the Royal Society of New Zealand. We thank members of the Rainey and Kerr labs and particularly Katrin Hammerschmidt, Eric Libby, Peter Meintjes, Jennifer Nemhauser, and Caroline Rose for valuable discussion. Brett Calcott and Kim Sterelny provided insightful comments on drafts of the manuscript. We also thank Andrew Moore and three anonymous referees for constructive criticism leading to a significant improvement of the essay.
References
Ackermann M, Stecher B, Freed NE, et al. 2008. Self-destructive cooperation mediated by phenotypic noise. Nature 454: 987–990.
Bantinaki E, Kassen R, Knight C, et al. 2007. Adaptive divergence in experimental populations of Pseudomonas fluorescens. III. Mutational origins of wrinkly spreader diversity. Genetics 176: 441–453.
Beaumont HJ, Gallie J, Kost C, et al. 2009. Experimental evolution of bet hedging. Nature 462: 90–93.
Beaumont HJE, Kassen R, Knight CG, et al. 2006. The genetics of phenotypic innovation. In Logan N, ed; Prokaryotic Diversity: Mechanisms and Significance. Cambridge: Cambridge University Press. p 91–104.
Bell G. 1985. The origin and early evolution of germ cells as illustrated by the Volvocales. In HalvorsonH, MornoyA, ed; The Origin and Evolution of Sex. New York: Alan R. Liss. p 221–56.
Bonner JT. 1998. The origins of multicellularity. Integr Biol 1: 27–36.
Bonner JT. 2000. First Signals: The Evolution of Multicellular Development. Princeton: Princeton University Press.
Boraas ME, Seale DB, Boxhorn JE. 1998. Phagotrophy by a flagellate selects for colonial prey: a possible origin of multicellularity. Evol Ecol 12: 153–64.
Buss LW. 1987. The Evolution of Individuality. Princeton: Princeton University Press.
Conway Morris S. 1998. The Crucible of Creation. Oxford: Oxford University Press.
Damuth J, Heisler IL. 1988. Alternative formulations of multi-level selection. Biol Phil 3: 407–30.
Dawkins R. 1982. The Extended Phenotype. Oxford: Oxford University Press.
Dennett DC. 1995. Darwin’s Dangerous Idea: Evolution and the Meanings of Life. London: Penguin Books. p 586.
Euler L. 1760. Recherches générales sur la mortalité: la multiplication du genre humain. Memoires de l’academie des sciences de Berlin 16: 144–64.
Fisher RA. 1930. The Genetical Theory of Natural Selection. Oxford: Oxford University Press.
Griesemer J. 2000. The units of evolutionary transition. Selection 1: 67–80.
Haccou P, Jagers P, Vatutin V. 2005. Branching Processes: Variation, Growth, and Extinction of Populations. New York: Cambridge University Press.
Hamilton WD. 1964. The genetical evolution of social behavior. 1. J Theor Biol 7: 1–16.
Hamilton WD. 1964. The genetical evolution of social behavior. 2. J Theor Biol 7: 17–52.
Hardin G. 1968. The tragedy of the commons. Science 162: 1243–1248.
Heininger K. 2002. Aging is a deprivation syndrome driven by a germ–soma conflict. Aging Res Rev 1: 481–536.
Heisler IL, Damuth J. 1987. A method for analyzing selection in hierarchically structured populations. Am Nat 130: 582–602.
Herron MD, Michod RE. 2008. Evolution of complexity in the volvocine algae: transitions in individuality through Darwin’s eye. Evolution 62: 436–51.
Hochberg ME, Rankin DJ, Taborsky M. 2008. The coevolution of cooperation and dispersal in social groups and its implications for the emergence of multicellularity. BMC Evol Biol 8: 238.
Hull DL. 1980. Individuality and selection. Ann Rev Ecol Syst 11: 311–32.
Jablonka E, Lamb MJ. 2006. The evolution of information in the major transitions. J Theor Biol 239: 236–246.
Kaiser D. 2001. Building a multicellular organism. Annu Rev Genet 35: 103–23.
Keim CN, Martins JL, Abreu F, et al. 2004. Multicellular life cycle of magnetotactic prokaryotes. FEMS Microbiol Lett 240: 203–8.
Kirk DL. 1998. Volvox: Molecular Genetic Origins of Multicellularity and Cellular Differentiation. Cambridge: Cambridge University Press.
Knight CG, Zitzmann N, Prabhakar S, et al. 2006. Unravelling adaptive evolution: how a single point mutation affects the protein co-regulation network. Nat Genet 38: 1015–22.
Lande R. 2009. Adaptation to an extraordinary environment by evolution of phenotypic plasticity and genetic assimilation. J Evolution Biol 22: 1435–1446.
Lewontin RC. 1970. The units of selection. Ann Rev Ecol Syst 1: 1–18.
Lotka AJ. 1925. Elements of Physical Biology. Baltimore: Williams & Watkins.
Lynch M. 2007. The frailty of adaptive hypotheses for the origins of organismal complexity. Proc Natl Acad Sci USA 104 (Suppl 1): 8597–8604.
MacLean RC, Bell G, Rainey PB. 2004. The evolution of a pleiotropic fitness tradeoff in Pseudomonas fluorescens. Proc Natl Acad Sci USA 101: 8072–7.
Maynard Smith J, Szathmary E. 1995. The Major Transitions in Evolution. Oxford: Freeman.
Maynard Smith J. 1964. Group selection and kin selection. Nature 201: 1145–6.
Maynard Smith J. 1988. Evolutionary progress and the levels of selection. In NiteckiMH, ed; Evolutionary Progress. Chicago : University of Chicago Press. p 219–30.
McDonald MJ, Gehrig SM, Meintjes PL, et al. 2009. Adaptive divergence in experimental populations of Pseudomonas fluorescens. IV. Genetic constraints guide evolutionary trajectories in a parallel adaptive radiation. Genetics 183: 1041–53.
Michod RE, Nedelcu AM. 2003. On the reorganization of fitness during evolutionary transitions in individuality. Integr Comp Biol 43:64–73.
Michod RE, Viossat Y, Solari CA, et al. 2006. Life-history evolution and the origin of multicellularity. J Theor Biol 239: 257–272.
Michod RE. 1996. Cooperation and conflict in the evolution of individuality. 2. Conflict mediation. Proc R Soc B 263: 813–822.
Michod RE. 1999. Darwinian Dynamics: Evolutionary Transitions in Fitness and Individuality. Princeton: Princeton University Press.
Michod RE. 2006. The group covariance effect and fitness trade-offs during evolutionary transitions in individuality. Proc Natl Acad Sci USA 103: 9113–9117.
Minelli A, Fusco G. 2010. Developmental plasticity and the evolution of animal complex life cycles. Phil Trans R Soc Lond, B 365:631–40.
Nedelcu AM, Michod RE. 2006. The evolutionary origin of an altruistic gene. Mol Biol Evol 23: 1460–144.
Okasha S. 2006. Evolution and the Levels of Selection. Oxford: Oxford University Press.
Pigliucci M, Murren CJ, Schlichting CD. 2006. Phenotypic plasticity and evolution by genetic assimilation. J Exp Biol 209: 2362–7.
Queller DC. 2000. Relatedness and the fraternal major transitions. Phil Trans R Soc Lond B 355: 1647–1655.
Rainey PB, Rainey K. 2003. Evolution of cooperation and conflict in experimental bacterial populations. Nature 425: 72–4.
Rainey PB, Travisano M. 1998. Adaptive radiation in a heterogeneous environment. Nature 394: 69–72.
Rokas A. 2008. The origins of multicellularity and the early history of the genetic toolkit for animal development. Annu Rev Genet42: 235–51.
Sachs JL. 2008. Resolving the first steps to multicellularity. Trends Ecol Evol 5: 245–8.
Schlichting CD, Pigliucci M. 1993. Control of phenotypic plasticity via regulatory genes. Am Nat 142: 366–70.
Schmalhausen II. 1949. Factors of Evolution: The Theory of Stabilizing Selection. Chicago: University of Chicago Press.
Sebe-Pedros A, Roger AJ, Lang FB, et al. 2010. Ancient origin of the integrin-mediated adhesion and signaling machinery. Proc Natl Acad Sci USA 107: 10142–47.
Shapiro JA. 1998. Thinking about bacterial populations as multicellular organisms. Annu Rev Microbiol 52: 81–104.
Snell-Rood EC, Van Dyken JD, Cruickshank T, et al. 2010. Toward a population genetic framework of developmental evolution: the costs, limits, and consequences of phenotypic plasticity. Bioessays 32: 71–81.
Sober E, Wilson DS. 1998. Unto Others: The Evolution and Psychology of Unselfish Behavior. Cambridge, MA: Harvard University Press.
Spiers AJ, Bohannon J, Gehrig SM, et al. 2003. Biofilm formation at the air-liquid interface by the Pseudomonas fluorescensSBW25 wrinkly spreader requires an acetylated form of cellulose. Mol Microbiol 50: 15–27.
Spiers AJ, Kahn SG, Bohannon J, et al. 2002. Adaptive divergence in experimental populations of Pseudomonas fluorescens. I. Genetic and phenotypic bases of wrinkly spreader fitness. Genetics 161: 33–46.
Spiers AJ, Rainey PB. 2005. The Pseudomonas fluorescens SBW25 wrinkly spreader biofilm requires attachment factor, cellulose fibre and LPS interactions to maintain strength and integrity. Microbiology 151: 2829–39.
Tomitani A, Knoll AH, Cavanaugh CM, et al. 2006. The evolutionary diversification of cyanobacteria: molecular-phylogenetic and paleontological perspectives. Proc Natl Acad Sci USA 103: 5442–7.
True JR, Carroll SB. 2002. Gene co-option in physiological and morphological evolution. Annu Rev Cell Dev Biol 18: 53–80.
Velicer GJ, Yu YTN. 2003. Evolution of novel cooperative swarming in the bacterium Myxococcus xanthus. Nature 425: 75–8.
Waddington CH. 1942. The canalization of development and genetic assimilation of acquired characters. Nature 150: 1008–23.
West-Eberhard MJ. 1989. Phenotypic plasticity and the origins of diversity. Ann Rev Ecol Syst 20: 249–278.
West-Eberhard MJ. 2003. Developmental Plasticity and Evolution. Oxford: Oxford University Press. Wilson DS. 1975. A theory of group selection. Proc Natl Acad Sci USA 72: 143–146.
Wolpert L, Szathmary E. 2002. Multicellularity: evolution and the egg. Nature 420: 745.
Wolpert L. 1990. The evolution of development. Biol J Linn Soc 39: 109–24.
Wray GA. 2001. Dating branches on the tree of life using DNA. Genome Biol 3: 1–7.
Wu J, Zhao F, Wang S, et al. 2007. cTFbase: a database for comparative genomics of transcription factors in cyanobacteria. BMC Genomics 8: 104.
AN ECOLOGICAL AND EVOLUTIONARY PERSPECTIVE ON HUMAN-MICROBE MUTUALISM AND DISEASE62
Les Dethlefsen,63Margaret McFall-Ngai,64and David A. Relman63,65,66
The microbial communities of humans are characteristic and complex mixtures of microorganisms that have co-evolved with their human hosts. The species that make up these communities vary between hosts as a result of restricted migration of microorganisms between hosts and strong ecological interactions within hosts, as well as host variability in terms of diet, genotype and colonization history. The shared evolutionary fate of humans and their symbiotic bacteria has selected for mutualistic interactions that are essential for human health, and ecological or genetic changes that uncouple this shared fate can result in disease. In this way, looking to ecological and evolutionary principles might provide new strategies for restoring and maintaining human health.
Nowhere in the study of human biology are basic concepts changing more rapidly than with respect to the human microbiota. Microorganisms were first shown to cause disease in humans in the 1800s, and after this finding, the popular and scientific views of the microbial world became dominated by the quest to understand, prevent and cure microbial disease. This led to millions of lives being saved through improved hygiene, vaccinations and antibiotics. However, most interactions between humans and microorganisms do not result in disease. Beneficial host–microbe interactions have been studied for more than a century, but it was not until the advent of molecular biology that the pathogen-dominated view of human-associated microorganisms began to change. Gene-sequence-based approaches have recently allowed complex microbial communities to be characterized more comprehensively and have removed the constraint of being able to identify only microorganisms that can be cultured, greatly increasing knowledge about commensal microorganisms and mutualistic microorganisms of humans (Aas et al., 2005; Bik et al., 2006; Eckburg et al., 2005; Gao et al.,
___________
62 Reprinted with kind permission from Nature Publishing Group.
63 Department of Microbiology and Immunology, Stanford University, Stanford, California 94305, USA.
64 Department of Medical Microbiology and Immunology, Symbiosis Cluster, 4835A Medical Sciences Center, 1300 University Avenue, University of Wisconsin, Madison, Wisconsin 53706, USA.
65 Department of Medicine, Stanford University, Stanford, California 94305, USA.
66 Veterans Affairs Palo Alto Health Care System 154T, 3801 Miranda Avenue, Palo Alto, California 94304, USA.
2007; Pei et al., 2004; Verhelst et al., 2004; Zhou et al., 2004; Lay et al., 2005; Matsuki et al., 2004; Palmer et al., 2007; Vanhoutte et al., 2004; Zoetendal et al., 2001) (that is, organisms in a relationship in which one partner benefits and the other is unharmed, and organisms in a relationship in which both partners benefit, respectively), as well as human pathogens (Leavis et al., 2006; Miragaia et al., 2007; Callaghan et al., 2006; Robinson and Enright, 2004; Robinson et al., 2006; Wirth et al., 2006). Researchers are now finding that host–microbe interactions are essential to many aspects of normal “mammalian” physiology, ranging from metabolic activity to immune homeostasis (Bäckhed et al., 2004; Cash et al., 2006; Guarner et al., 2006; Kelly et al., 2004; Martin et al., 2007; Mazmanian et al., 2005; Rakoff-Nahoum et al., 2004). With the availability of new tools to investigate complex microbial communities and the expanded appreciation for the importance of the human indigenous microbiota, this is an opportune time to apply ecological and evolutionary principles to improve the current understanding of both health and disease.
So far, the human microbiota has not been fully described, but it is clear that microorganisms are present in site-specific communities on the skin and mucosal surfaces and in the intestinal lumen. Each community contains microorganisms from certain families and genera that are found in the same habitat in many or most individuals, although at the species and strain levels the microbiota of an individual can be as unique as a fingerprint (Eckburg et al., 2005; Ley et al., 2006; Vanhoutte et al., 2004). The microbial communities of other terrestrial vertebrates mainly contain lineages that are related to, but distinct from, those in humans (Gong et al., 2007; Maackie et al., 2004; Nelson et al., 2003; Uenishi et al., 2007; Wilson et al., 2006). These characteristics indicate that humans have co-evolved with their microbial partners. In this review, we examine evolutionary and ecological principles that are relevant to these relation- ships, and we consider microbial pathogenesis in this context.
Evolution of Mutualism
In the 1960s, evolutionary biologists rejected the idea that natural selection would generally favour the good of the species (or any group), because individual types with the greatest reproductive success in a population increase in relative abundance regardless of the consequences for the population as a whole (Wilson, 1997). Since then, the evolution of traits that benefit individuals other than the trait bearer has been extensively researched, both theoretically and empirically. Although the field has been contentious at times, there is now general agreement about the conditions that promote cooperation, including mutualism between species (Wilson, 1997; Foster and Wenseleers, 2006; Sachs et al., 2004).
Organisms can have traits that contribute directly to their own fitness and also incidentally benefit members of another species. When such “by-product benefits” occur in both directions, the result is a no-cost mutualism (Sachs et al.,
2004). For example, plant polysaccharides that are not digestible by humans are the main substrates for microbial growth in the colon, whereas butyrate and other products of microbial fermentation are important energy sources for the host (Flint, 2004; Flint et al., 2007). Intestinal symbionts are selected to be effective consumers of available resources through direct effects on their fitness, but this also benefits the host because resource competition provides an additional barrier to colonization by potential pathogens (Fons et al., 2000; Reid and Bruce, 2006; Brook, 2005; Servin, 2004; Tilman, 2004).
If mutualistic by-product interactions such as the example above are possible, but not ecologically inevitable, then traits that improve the likelihood or stability of a relationship (for example, site-specific attachment molecules) might evolve in one or both partners. A species might also evolve to increase its own fitness by increasing the fitness of a mutualistic partner (Sachs et al., 2004). For example, microbial symbionts that secrete molecules that inhibit host pathogens (known as pathogen interference) (Reid and Bruce, 2006; Brook, 2005; Servin, 2004) or detoxify compounds that harm the host (Pool-Zobel et al., 2005) can augment the lifespan and reproductive capacity of the host, thereby giving the symbionts more opportunities to spread. Evolution to increase mutualistic benefits has been called “partner fidelity feedback,” and it is strengthened if the same lineages of partners interact across multiple generations (Foster and Wenseleers, 2006; Sachs et al., 2004). Unlike traits that sup-port mutualism incidentally, traits that evolve specifically to improve mutualism, such as the production of compounds dedicated to pathogen interference, can impose a direct fitness cost, although a net benefit would be expected in the context of the evolved mutualism (Sachs et al., 2004).
Mutualism-promoting traits with a direct cost for the bearer, however, create the potential for “cheating.” When organisms interact to create a shared benefit, cheaters are organisms that obtain the benefit without helping to create it. For example, a cheating microbial phenotype could result from a mutation that redirects resources towards faster growth of the microorganism itself instead of detoxification or pathogen interference. The cheater therefore increases its relative fitness in a host by avoiding costly contributions towards host fitness while benefiting from the improved host fitness that results from the mutualistic contributions of its competitors (Foster and Wenseleers, 2006; Sachs et al., 2004). Various evolutionary outcomes are possible, including the absence of costly contributions to mutualism, contributions to mutualism that are below the level that would maximize the mutualistic benefit, and the coexistence of mutualists and cheaters in the community (Doebeli et al., 2004). A possible example of this dynamic balance is that certain benefits attributed to probiotic bacterial species are characteristic of only a subset of the strains that make up the species (Reid and Bruce, 2006; Servin, 2004). For any mutualism that is not cost free, the partners can evolve mechanisms to protect their relationship from being exploited by cheaters (Wilson, 1997; Sachs et al., 2004; McFall-Ngai, 2007), and mutualism can be stronger and more stable where ecological features limit the potential for exploitation (discussed later).
The immune system is the most conspicuous set of anti-exploitation adaptations involved in human–microbial symbiosis. The gastrointestinal mucosa is intimately associated with the most abundant and diverse microbial communities in the human body, but the gut-associated immune system neither controls the composition of the gut microbiota nor remains ignorant of it. Instead, specialized tissues and cells actively sample the intestinal contents and initiate local immune responses that help to confine the microbiota to the gut, avoiding a damaging systemic inflammatory response to the microorganisms present in the healthy gut (Macpherson et al., 2005). However, if host tissue is damaged (Matzinger, 2002) or if microorganisms spread to normally sterile sites (Macpherson et al., 2005), then there is a vigorous systemic response to clear the infection. Therefore, microorganisms are free to compete for resources in the gut, generating a robust and disease-resistant community (Fons et al., 2000; Tilman et al., 2004), but are prevented (usually) from exploiting the host to obtain additional resources. Recent work has also shown that the normal development and activity of the “host” immune system is itself a result of mutualistic interactions (Cash et al., 2006; Guarner et al., 2006; Kelly et al., 2004; Mazmanian et al., 2005; Rakoff-Nahoum et al., 2004).
Humans and their collective microbiota are segmented into many local communities, each comprising an individual human with his or her symbionts. This ecological pattern, characterized by strong interactions within distinct local communities and limited interactions or migration between them, is described as a metacommunity. Another level of metacommunity organization exists because individual humans belong to social groups that tend to share a similar microbiota (O’Keefe et al., 2007; Moore and Moore, 1995). At both levels, the metacommunity structure allows selection to occur between the local units (that is, between individuals or between social groups), which promotes mutualism and restrains cheating within the human–microbe symbiosis (Swenson et al., 2000; Wilson, 1997). Such selection occurs when a local symbiotic community succeeds or fails together, with more successful communities increasing in abundance or prevalence relative to less successful communities (Wilson, 1997). For example, a human individual or social group that carries a microbiota with strong defences against an abundant pathogen is likely to leave more progeny than those lacking such defences. If the progeny tend to carry the parental microbiota, then mutualistic microorganisms that make costly contributions to pathogen defence are favoured by selection between distinct local symbiotic communities. This community-level selection opposes the tendency for cheating non-defenders to increase in relative abundance within each local symbiotic community (Wilson, 1997). The greater similarity of the microbiota within a human family than between human families (Zoetendal et al., 2001) (and within, rather than between, chimpanzee social groups; Uenishi et al., 2007) shows that there is, indeed, a shared evolutionary fate. The individualized microbiota of each person has a stake in his or her fitness.
Human–microbe mutualism often involves more than two partners, although the same principles apply. For example, the colonic degradation of polysaccharides that provides butyrate for the host is a cooperative microbial process (Flint, 2004; Flint et al., 2007). Extracellular enzymes from multiple species are required for complete hydrolysis of the polymers. In addition, some of the resultant sugars are consumed by strains that do not produce extracellular enzymes but provide growth factors to strains that do (Flint, 2004). Some fermenters such as Bifidobacterium spp. release lactate as waste. Their fermentation efficiency is increased by lactate fermenters, such as Eubacterium hallii, that release butyrate as waste, and this butyrate is then used by the host (Flint et al., 2007). Sugar-fermenting lactobacilli that produce neither hydrolytic enzymes nor growth factors could be considered cheaters from the perspective of polysaccharide degradation, but they could be considered mutualists of the entire symbiotic community if they interfere with the colonization of pathogens (Servin, 2004). The butyrate-producing consortium as a whole is a mutualist of the host and would be favoured by community-level selection over consortia producing less-desirable fermentation products (Flint et al., 2007). However, selection for mutualistic functional traits such as butyrate production cannot entirely determine the composition of the microbiota, because communities of different composition can have similar functional characteristics in a given context. Not only selection on community-level traits but also competition within the community and chance colonization events affect the structure of the microbiota (Dethlefsen et al., 2006).
Human Microbial Communities and Health
The distribution of microorganisms in and on the human body reflects adaptations to life on land, which were made about 400 million years ago. Terrestrial vertebrates developed skin, lungs, internal fertilization, and protective membranes around the embryo. The skin became relatively impermeable, and mucous membranes were confined to protected sites. Because microorganisms generally thrive only in moist environments, these adaptations to a mostly dry environment have shaped the abundance, location and phenotypes of human-associated microorganisms and have limited the exchange of microorganisms between individuals.
The current understanding of the human microbiota relies heavily on cultivation-based approaches and therefore is biased and incomplete. Although imperfect, molecular approaches that identify microorganisms from small-subunit (16S) ribosomal RNA gene sequences offer advantages over cultivation. The 16S rRNA gene is typically chosen because it is present universally and can provide a taxonomic identification ranging from the domain and phylum level to approximately the species level. However, these methods have been used to study human microbial ecology for only a decade, and the available data are limited. There are few deep surveys of microbial-community membership in any human habitat and even fewer assessments of functional potential or activity. In general, 16S rRNA gene-sequence data have been collected from one site in a few humans
at one time, representing a narrow range of health and disease states (Bik et al., 2006; Pei et al., 2004; Verhelst et al., 2004; Zhou et al., 2004), although there are studies that include several temporal or spatial samples per individual (Aas et al., 2005; Eckburg et al., 2005; Gao et al., 2007; Young and Schmidt, 2004). Sequence-dependent approaches that are less labour-intensive but yield lower-resolution data have been applied to a larger number of individuals, at various time points and under various conditions (Lay et al., 2005; Matsuki et al., 2004; Vanhoutte et al., 2004; Zoetendal et al., 2001; Li et al., 2004). Even so, the microbial communities associated with only a small proportion of the diversity of human genotypes, lifestyles, diets and diseases have been investigated. One high-throughput method for obtaining information about bacterial communities is to use phylogenetic microarrays, which yield high-resolution data, but this method also depends on adequate 16S rRNA gene-sequence databases (Palmer et al., 2007). Like these microarray studies, metagenomic and proteomic analyses are just beginning to be published (Gill et al., 2006; Klassens et al., 2007). Technical and ethical constraints restrict sampling from humans; therefore, model systems will continue to be important, and examples of these are listed in Table A16-1.
Despite the limited data available, analyses of the human microbiota have revealed intriguing features. Most of the phylogenetic diversity is found in shallow, wide radiations in a small subset of the known deep lineages (Ley et al., 2006). Specifically, there are more than 50 bacterial phyla on Earth, but human-associated communities are dominated by only 4 phyla (Firmicutes, Bacteroidetes, Actinobacteria and Proteobacteria), with 9 other phyla (Chlamydiae, Cyanobacteria, Deferribacteres, Deinococcus–Thermus, Fusobacteria, Spirochaetes, Verrucomicrobia, and the candidate phyla TM7 and SR1) found in some sites and individuals (Figure A16-1). In contrast to the paucity of phyla represented, the human microbiota contains an abundance of species and strains. Uniform probabilities of speciation and extinction over time would result in an exponential increase in the number of lineages throughout evolution. However, in humans, there is a marked excess of phylotype diversity at the species and strain level compared with the trends in more inclusive taxa (Figure A16-2); there are similar patterns in other vertebrate hosts (Ley et al., 2006). This finding might reflect a long history of stability in the types of microbial niche associated with terrestrial animals, together with factors (such as host heterogeneity and metacommunity structure) that promote diversification among organisms in similar niches. In contrast to the remarkable diversity of bacterial species, a striking but unexplained finding is that the only Archaea found frequently in humans are several species of methanogens. Methanobrevibacter smithii is abundant in the colon of some humans (Eckburg et al., 2005; Gill et al., 2006). Also, Methanobrevibacter oralis and close relatives can be found within the subgingival crevice in the human mouth but only in the setting of moderate to severe disease (Lepp et al., 2004). Overall, the human microbiota is similar to that of other mammals at the phylum level, but most bacterial families and genera seem to be distinct (Figure A16-3).
TABLE A16-1 Model Systems for Animal–Microbe Symbioses
| Type of symbiosis | Specific system (Host/symbiont species) | Host phylogenetic affiliation | Host tissue colonized | Reference |
| Highly complex consortia (102–103)* | Mus musculus (mouse) | Vertebrate chordate | Intestine | Bäckhed et al. (2004) |
| Danio rerio (zebrafish) | Vertebrate chordate | Intestine | Cheesman and Guillemin (2007) | |
| Microcerotermes spp. and Reticulitermes spp. (termites) | Insect arthropod | Hindgut | Hongoh et al. (2005) | |
| Relatively simple consortia (~2–25)* | Hirudo medicinalis (leech) | Oligochaete annelid | Intestine | Kikuchi and Graf (2007) |
| Lymantria dispar (gypsy moth) | Insect arthropod | Larval midgut | Broderick et al. (2006) | |
| Drosophila melanogaster (fruitfly) | Insect arthropod | Intestine | Cox and Gilmore (2007) | |
| Hydra oligactis and Hydra vulgaris | Hydrozoan cnidarian | Not determined | Fraune and Bosch (2007) | |
| Monospecific (1)* | Euprymna scolopes (sepiolid squid)/Vibrio fischeri | Cephalopod mollusc | Light organ | Nyholm and McFall-Ngai (2004) |
| Eisenia fetida (earthworm)/Acidovorax spp. | Oligochaete annelid | Excretory tissues | Davidson and Stahl (2006) | |
| Steinernema spp./Xenorhabdus spp. and Heterorhabditis spp./Photorhabdus spp. | Entomopathogenic nematodes | Gut-associated vesicle or region | Goodrich-Blair and Clarke (2007) | |
* Number of bacterial-symbiont phylotypes found reproducibly.
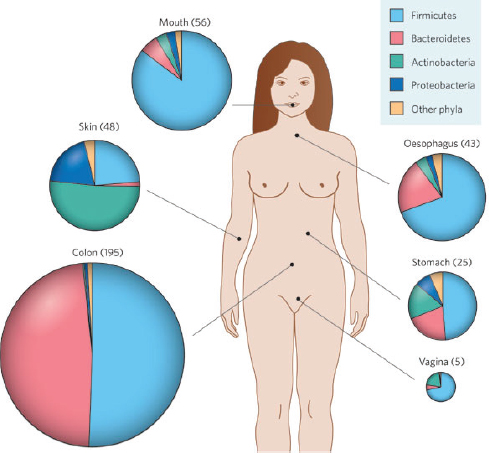
FIGURE A16-1 Site-specific distributions of bacterial phyla in healthy humans. The area of the chart for each site represents the average number of distinct phylotypes (approximate species-level taxa, based on 16S rRNA gene-sequence analysis) per individual. (The mean number of phylotypes per individual is shown in parentheses; 3–11 individuals were studied per habitat.) The coloured wedges represent the proportion of phylotypes belonging to different phyla. More than 50 bacteria phyla exist, but human microbial communities are overwhelmingly dominated by the 4 that are shown. The relative abundance of these phyla at most sites tends to be consistent across individuals: for example, in almost all humans studied so far, Bacteroidetes and Firmicutes predominate in the colon. By contrast, the composition of the vaginal microbiota is more variable; most women have a preponderance of Firmicutes with few other representatives, whereas a minority of women have a preponderance of Actinobacteria with few other representatives. An estimated 20–80% of human- associated phylotypes (depending on habitat) are thought to have eluded cultivation so far. Data taken from Aas et al., 2005; Bik et al., 2006; Eckburg et al., 2005; Gao et al., 2007; Pei et al., 2004; Verhelst et al., 2004; Zhou et al., 2004).
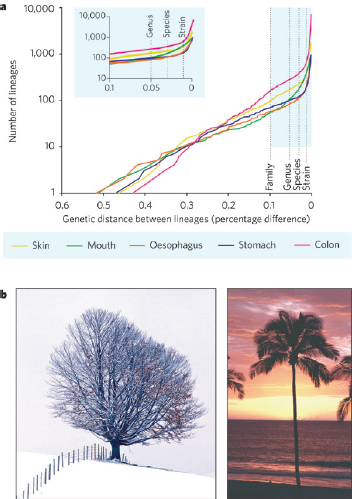
FIGURE A16-2 Patterns of human-associated microbial diversity. a, Lineage-by-distance analysis of 16S rRNA gene-sequence data from human microbial communities in specific habitats. The x axis shows the percentage difference threshold (Olsen correction), over 1,241 nambiguously aligned positions of near full-length 16S rRNA gene sequences, for delineating separate lineages. The y axis shows the number of distinct lineages that exist at the distance threshold. If speciation and extinction occur with constant probabilities as 16S rRNA gene sequences diverge, this would result in an exponentially increasing number of lineages with diminishing evolutionary distances between them (a straight line on a semi logarithmic plot). Such a pattern seems to hold from the phylum level (largest distances between lineages) to approximately the species level. However, relative to this trend, all sites have an excess of recently diverged lineages. The excess lineages accumulate in the range of 16S rRNA gene divergence that is typically associated with species and strains. The inset depicts a portion of the same data at a larger scale. Samples were taken from 3–11 individuals, depending on the site. Data taken from refs 1–5. b, When displayed as a dendrogram, 16S rRNA gene-based patterns of microbial diversity in soil and aquatic environments generally resemble the tree shape on the left, with new branches arising at all distances from the root. Patterns of diversity in vertebrate-associated communities resemble the tree shape on the right, with few branches arising close to the root and many branches arising close to the branch tips.
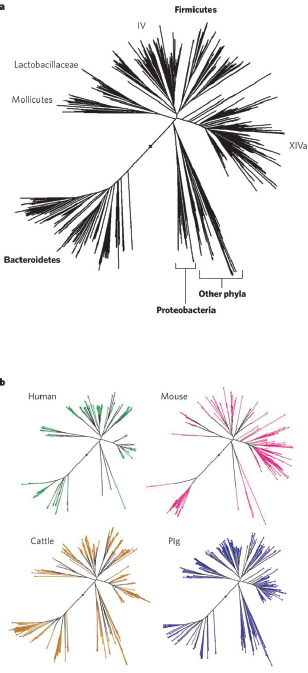
FIGURE A16-3 Relationships between bacterial 16S rRNA gene sequences from the intestinal microbiota of animals. A set of aligned, high-quality, full-length sequences was obtained from Greengenes. (DeSantis et al., 2006) Sequences derived from one human stool sample and caecal samples from one mouse family were chosen to obtain approximately the same number of sequences as obtained from multiple studies of the bovine rumen and pig caecum and colon (range 617–748 sequences per host species). a, A neighbourjoining tree was created from 1,241 unambiguously aligned positions in all 2,735 sequences, with selected taxa indicated. Mollicutes, Lactobacillaceae and Clostridium clusters IV and XIVa are within the irmicutes (Collins et al., 1994). b, Host- specific trees were created with the same topology as the entire tree, shown in part a, but they depict only the sequences derived from the indicated host species. Branches shared with at least one other host species are shown in black, and branches specific to a single species are coloured. The same phyla and classes predominate in these animals (evident from the overlapping tree topologies and shared branches), although their relative abundances vary. By contrast, most genera and many families are specific to a single host species (coloured branches).
Multiple samples of the microbiota that are taken separated in time or space from a single body habitat within one individual are generally more similar to each other than they are to samples from the same habitat in another individual (Eckburg et al., 2005; Matsuki et al., 2004; Vanhoutte et al., 2004), although temporal variation in the skin microbiota of an individual is as great as the variation between individuals (Gao et al., 2007). In addition, the bacterial communities at a given site are more similar between human family members than between unrelated individuals (Zoetendal et al., 2001), but more studies are necessary to distinguish the effects of genetic relatedness and a shared early environment (Dethlefsen et al., 2006). Antibiotics can markedly affect the composition of the microbiota in the short term, with most (but not all) families and genera of gut microorganisms returning to typical levels within weeks of exposure (Young et al., 2004; Jemberg et al., 2005). However, pathogens can exploit the reduced competitiveness of a community disturbed by antibiotics, thereby establishing themselves in the host (Brook, 2005; Pepin et al., 2005). The degree to which the unique bacterial communities of an individual are re-established after antibiotic treatment is unclear, but particular antibiotic-resistant strains that colonize or evolve during treatment can persist for years (Lofmark et al., 2006; Sjolund et al., 2005).
A human infant acquires its microbiota from the environment. In humans, symbionts are not vertically transmitted (that is, transmitted through the germ line), as they are in some invertebrate animals. Colonization, succession and diversification occur within characteristic windows of time in the various microbial habitats in the body, ranging over the first weeks, months or years of life (Palmer et al., 2007; Kolenbrander et al., 2006; Savage, 2005). The composition of faecal communities in early infancy, for example, is dynamic and reflects opportunistic environmental exposures, especially to the mother. The introduction of solid foods then begins the transition to an individualized, adult-like microbiota (Palmer et al., 2007). The assembly of bacterial communities on tooth surfaces also follows a consistent pattern as teeth emerge (Canfield et al., 2000), as well as after the removal of pre-existing biomass (that is, plaque) (Li et al., 2004; Kolenbrander et al., 2006). The horizontal transfer of microorganisms to every human generation favours strains that are locally abundant at that time (for example, those present in parents and kin), but colonization remains somewhat stochastic (Dethlefsen et al., 2006). The mixing of lineages from different sources that occurs during community assembly is analogous to the reassortment of parental alleles during sexual reproduction (Swenson et al., 2000), and it promotes the adaptation of community composition to local conditions and the rapid spread of beneficial strains. However, strains that become locally abundant by cheating can also spread.
Competition for niches within the human microbiota is ubiquitous and occurs together with the selective forces that promote mutualism in the community as a whole. Microorganisms can even compete and cooperate simultaneously.
For example, Bacteroides thetaiotaomicron and M. smithii facilitate each other’s growth by complementary energy metabolism, while competing for nitrogen (Samuel and Gordon, 2006). Cooperatively crosslinked biofilms containing multiple species promote the colonization of tooth surfaces, even while the constituent species compete with each other for individual binding sites (Kolenbrander et al., 2002). Symbionts that are highly prevalent and abundant probably have effective mechanisms for competing for resources: for example, B. thetaiotaomicron (Xu et al., 2003) and Bifidobacterium longum (Schell et al., 2002) have a wide variety of inducible genes encoding factors involved in the binding, uptake and degradation of plant- and host-derived polysaccharides. Competition within the human microbiota involves not only resources but also interference; that is, the direct inhibition of one strain by another in a resource-independent manner. In some cases, the metabolic byproducts of one species (such as lactate or short-chain fatty acids) inhibit other microorganisms. In other cases, dedicated compounds are generated solely because of their inhibitory effect: for example, reactive oxygen species and the peptide antibiotics known as bacteriocins (Brook, 2005; Servin, 2004). The immediate fitness costs and context-dependent benefits of dedicated interference compounds result in selection for diversity: for example, the capacity to produce and resist bacteriocins evolves rapidly among closely related strains (Czárán et al., 2002; Gordon et al., 1998). Both resource competition and interference competition contribute to the resistance of the intact microbiota to colonization by pathogens (Fons et al., 2000; Reid and Bruce, 2006; Brook, 2005; Servin, 2004).
Microbial Evolution and Human Disease
Microbial symbionts occupy a complex adaptive landscape. Many traits affect fitness, and many different trait combinations can generate a local optimum fitness (that is, a fitness peak). Natural selection generally acts on subtle phenotypic differences to move microorganisms ‘uphill’ towards a fitness peak, but larger changes can move an organism onto the slope of a different fitness peak (Figure A16-4). The fitness of a symbiont depends on environmental features that can change, such as the coexisting microbiota, the diet of the host, and which species and even particular individual is the host. Thus, the adaptive landscape is dynamic.
Changes in the genotype or environment of a non-pathogenic symbiont can result in the invasion of host tissue. The usual outcome is then an immune response that eliminates the infection. This high rate of microbial mortality imposes a strong selective pressure: the rare changes that enable a symbiont to survive such a challenge would involve avoiding immune recognition or circumventing immune control, at least until some progeny have been transmitted to a new host. Alternatively, changes that increase the opportunities for a non-pathogen to be transmitted to a new host reduce the dependence of the microorganism on the fate of the current host. In this case, the selective pressures on the fitness of
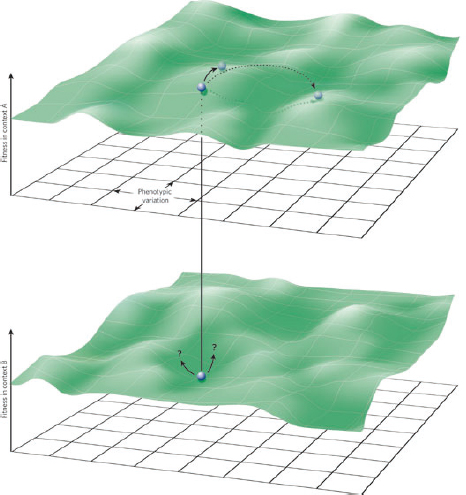
FIGURE A16-4 Adaptive landscapes. The plane is a conceptual representation of the multidimensional phenotypes that are available to a microorganism. The height of the surface above the plane represents the fitness of the corresponding phenotypes in a given ecological context, including biotic and abiotic components of the environment. In a given environment (context A, upper panel), for mutations that have a small effect, a phenotype (circle) under natural selection will tend to evolve along the steepest path uphill towards higher fitness (solid arrow), eventually moving the mean phenotype of a population to a local fitness maximum. Mutations that have a large effect, such as horizontal gene transfer, can shift a phenotype to the slope of a different fitness peak (dashed arrow).This can markedly alter the outcome for the host; for example, it can result in pathogenesis instead of mutualism. The valley separating the peaks represents phenotypes of low fitness, such as those that are likely to elicit an immune response but lack the adaptations necessary to survive it. For a given phenotype, a change in context (for example, a change in host diet, alterations in coexisting microbial populations, or transfer to a different host or host species; context B, lower panel) can have subtle or marked effects on fitness. A phenotype near a fitness peak in context A might be in a valley of low fitness in context B. If the microorganism survives, the subsequent course of evolution might depend on the direction of phenotypic change caused by the next mutation.
the symbiont are less constrained by the need to preserve host fitness as well. In either case, the microorganism can begin adapting towards a fitness peak as a pathogen.
All human microbial symbionts must be able to establish themselves in new hosts. The adaptations of mutualistic or commensal microorganisms towards this end can facilitate a pathogenic lifestyle as well. For example, the biochemical mechanisms for sensing host environments, interacting with host surfaces and even communicating with the host are often the same in human pathogens, commensal microorganisms and mutualistic microorganisms (Callaghan et al., 2006; Sperandio et al., 2003; Shiner et al., 2005; Rendon et al., 2007). Not surprisingly, many common human pathogens are closely related to non-pathogenic symbionts: examples are found in the genera Staphylococcus, Streptococcus, Neisseria and Enterococcus, and in the family Enterobacteriaceae (Leavis et al., 2006; Miragaia et al., 2007; Callaghan et al., 2006; Robinson and Enright, 2004; Robinson et al., 2006; Wirth et al., 2006). It is not coincidental that these taxa tolerate the aerobic environment between hosts, whereas the more abundant, but less aerotolerant, taxa of the colon have fewer known pathogens as close relatives. The greater ability of aerotolerant taxa to be transmitted to a new host weakens the selection for mutualism in the current host (Foster and Wenseleers, 2006; Sachs et al., 2004). In general, the pathogenic phenotypes in taxa that contain abundant nonpathogenic symbionts have multiple evolutionary origins (Leavis et al., 2006; Miragaia et al., 2007; Callaghan et al., 2006; Robinson and Enright, 2004; Robinson et al., 2006; Wirth et al., 2006), emphasizing that pathogenicity is not necessarily a considerable evolutionary barrier for microorganisms. By contrast, other pathogens have originated only once (Wren, 2003; Monot et al., 2005), but the continued emergence of new diseases is a reminder that there might be many unoccupied pathogen fitness peaks at present.
The evolution of pathogen virulence has received considerable attention, largely centred on the paradox that pathogens both harm and depend on their hosts (Brown et al., 2006). The view that highly virulent pathogens originated recently, with selection inevitably reducing virulence over time, has been supplanted by the realization that there is an optimal level of virulence (for the pathogen) that depends on the biology of its host interactions (Brown et al., 2006; Woolhouse et al., 2002). For example, if pathogen transmission is inherently damaging to the host (as occurs with Salmonella enterica serovar Typhimurium; Wickham et al., 2007), then selective pressure on the pathogen balances the benefit of higher transmission against the loss of host viability as a result of higher virulence. By contrast, pathogens with environmental reservoirs (for example, Vibrio cholerae), transmission vectors (for example, Plasmodium falciparum) or environmentally resistant propagules (such as spores; for example, Clostridium tetani) might be able to afford a higher level of virulence than those that depend on direct transmission (Walther and Ewald, 2004). For pathogens that depend on normal host activity for transmission, such as sexually transmitted pathogens (for
example, Chlamydia trachomatis and Treponema pallidum), low virulence and/or long latencycan promote the spread of pathogen. In host populations with a reduced potential for pathogens to encounter new hosts, the optimal virulence is reduced to allow the host to survive long enough to ensure pathogen transmission (Boots and Mealor, 2007).
The observed level of virulence for a pathogen, however, does not necessarily correspond to its evolutionary optimum. Many pathogens are zoonotic (that is, transmitted from animals to humans) (Taylor et al., 2001) and can be adapted to a low-virulence niche in their primary host; an example is enterohaemorrhagic Escherichia coli in cattle (Naylor et al., 2005). Unless transmission by humans contributes to the evolutionary success of the pathogen, excessive (or suboptimal) virulence in humans exerts no selective pressure on the microorganism. Competition between different strains of a pathogen (as a result of co-infection, as occurs with Plasmodium spp., or in-host evolution, as occurs with human immunodeficiency virus) can affect virulence, because an optimally virulent pathogen (as measured by transmission success) might not be the best competitor during mixed infections in a single host (Read and Taylor, 2001). A rapidly replicating, excessively virulent strain might kill the host or provoke a successful immune response before transmission of a co-infecting, less virulent strain, even if the latter strain is optimally virulent when infecting a host alone (Read and Taylor, 2001). Competition between pathogens can also decrease virulence. The production of extracellular iron-scavenging molecules (known as siderophores) contributes to the virulence of many bacterial pathogens, but cheating lineages that consume siderophores without producing them reduce virulence, thereby benefiting the host (West and Buckling, 2003). The diverse biology of host–pathogen and pathogen–pathogen interactions precludes simple predictions about the effect of inter-pathogen competition on virulence (Read and Taylor, 2001; Gardner et al., 2004).
The importance of opportunity for the origin of pathogens is emphasized by a recent analysis of the 25 infectious diseases that cause the most human death and disability (Wolfe et al., 2007). The preferred host of a pathogen is thought to change most easily to a species closely related to the current host (Woolhouse et al., 2001). Indeed, although primates constitute only a small proportion of all animal species on Earth, they are the origin of a large proportion of these serious human diseases. However, an even larger proportion of these diseases originated from domestic animals, reflecting greater opportunities for the symbionts of domesticated species to be transmitted to humans (Wolfe et al., 2007). With the advent of agriculture, changes in human populations simultaneously created a new niche for deadly pathogens. Ten of these 25 major infectious diseases could have arisen only after urbanization, because they depend on human–human transmission and quickly kill infected individuals or leave them with lifelong immunity (Wolfe et al., 2007). Such “crowd” diseases could not have survived in the small dispersed human societies present before agriculture. Common pathogens derived from human mutualistic microorganisms have also exploited these changes in
the human population, with many clonal lineages being disseminated globally (Leavis et al., 2006; Miragaia et al., 2007; Callaghan et al., 2006; Robinson and Enright, 2004; Robinson et al., 2006; Wirth et al., 2006).
Urbanization and global travel have eroded some of the barriers to microbial transmission between social groups that contribute to the metacommunity structure of the human–microbe symbiosis. The diminished fidelity of host and symbiont lineages to each other (both within and between generations) and reduced opportunities for community-level selection between human social groups have reduced the strength of selection for mutualism. Microbial cheaters that allocate resources to their own growth and dissemination instead of pathogen interference or other costly contributions to host fitness can now spread globally, instead of merely within a tribe. Symbionts that colonize an infant who resides in an urban area include many microorganisms that are not derived from the infant’s relatives, much less from an extended kin group with a consistent lifestyle and geographic range over generations. This disruption of co-evolved mutualism between humans and human microbiota, as a result of changes in human ecology, contributes to the increasing prevalence of chronic and degenerative disease in industrialized countries (Guarner et al., 2006; O’Keefe et al., 2007).
Paths Forward
Researchers have only just begun to describe the microbial communities that are associated with humans and the extent of the interactions between host and microbiota. Understanding this symbiotic “landscape” will require research that spans the biological hierarchy from molecules to communities and is informed by ecological and evolutionary theory. Only with an integrated approach will it be possible to comprehend the complex ecology of human health and the many ways in which interactions between humans and microorganisms can go awry.
The first step in improving our understanding is to describe the composition of microbial communities in each habitat of the human body and how this varies over time, among individuals and with respect to variables such as diet, host genotype and health status. This project is now in its early stages, with the first successful forays having laid the groundwork for more ambitious studies, such as the Human Microbiome Project.
Several recent studies highlight remarkable examples of how a co-evolved microbiota can markedly affect host biology at the molecular level (Bäckhed et al., 2004; Cash et al., 2006; Guarner et al., 2006; Kelly et al., 2004; Martin et al., 2007; Mazmanian et al., 2007; Rakoff-Nahoum et al., 2005), and these findings call for a complete re-examination of human physiology and immunology (McFall-Ngai, 2007). Attributes that were assumed to be human traits have been shown to result from human–microbe interactions.
Although human studies are essential, the technical and ethical limitations of carrying out experiments and obtaining samples from humans mean that
experimental model systems also need to be used. These two approaches offer complementary information. The relevance of human studies is clear. But experimental model systems have two main advantages: they highlight evolutionarily conserved features that are likely to be crucial for function, and they show diversity (how a single ‘goal’ is accomplished differently), thereby exposing the essence of a characteristic. Models for the study of symbioses range from binary relationships between an invertebrate and one microbial species to complex vertebrate systems involving consortia of microorganisms (Table A16-1). For models with complex consortia, gnotobiotic techniques are used to manipulate the symbiosis experimentally. By contrast, using simpler consortia facilitates the molecular dissection of interactions in the intact natural setting. The genetic tools available for some model hosts allow the identification of genes and proteins that control host responses and manage the consortia.
From the microbial perspective, the host is a simply a complex environment — the distinction between human health and disease is important only as far as it affects microbial fitness. To think that we can intervene effectively in human–microbe relationships without considering microbial ecology and evolution is folly, as demonstrated by the spread of anti bioticresistant microorganisms (Leavis et al., 2006; Miragaia et al., 2007; Robinson and Enright, 2004; Robinson et al., 2006; Lofmark et al., 2006; Sjolund et al., 2005) and by the connections between some modern diseases and alterations in the human microbiota (Guarner et al., 2006; O’Keefe et al., 2007). The principles and mechanisms that underlie microbial community structure and host–symbiont relationships must become incorporated into our definitions of human health. It will be crucial to consider the role of microbial communities, and not just individual species, as pathogens and mutualists (Lepp et al., 2004). Moreover, one of the goals of medical intervention during disease should be minimizing damage to the health-associated homeostasis between humans and their microbiota. Medical and general educational curricula will need to be modified accordingly.
Acknowledgements
Research in the laboratory of D.A.R. is supported by funds from the Doris Duke Charitable Foundation, the Horn Foundation, the Office of Naval Research and the National Institutes of Health (NIH). Research in the laboratory of M.M.-N. is supported by the NIH and the National Science Foundation. D.A.R. is a recipient of an NIH Director’s Pioneer Award and a Doris Duke Distinguished Clinical Scientist Award.
Author Information
Reprints and permissions information is available at npg.nature.com/reprints. Correspondence should be addressed to D.A.R. (relman@stanford.edu).
References
Aas, J. A., Paster, B. J., Stokes, L. N., Olsen, I. & Dewhirst, F. E. Defining the normal bacterial flora of the oral cavity. J. Clin. Microbiol. 43, 5721–5732 (2005).
Bäckhed, F. et al. The gut microbiota as an environmental factor that regulates fat storage. Proc. Natl Acad. Sci. USA 101, 15718–15723 (2004).
Bik, E. M. et al. Molecular analysis of the bacterial microbiota in the human stomach. Proc. Natl Acad. Sci. USA 103, 732–737 (2006).
Boots, M. & Mealor, M. Local interactions select for lower pathogen infectivity. Science 315, 1284–1286 (2007).
Broderick, N. A., Raffa, K. F. & Handelsman, J. Midgut bacteria required for Bacillus thuringiensis insecticidal activity. Proc. Natl Acad. Sci. USA 103, 15196–15199 (2006).
Brook, I. The role of bacterial interference in otitis, sinusitis and tonsillitis. Otolaryngol. Head Neck Surg. 133, 139–146 (2005).
Brown, N. F., Wickham, M. E., Coombes, B. K. & Finlay, B. B. Crossing the line: selection and evolution of virulence traits. PLoS Pathog. 2, e42 (2006).
Callaghan, M. J., Jolley, K. A. & Maiden, M. C. Opacity-associated adhesin repertoire in hyperinvasive Neisseria meningitidis. Infect. Immun. 74, 5085–5094 (2006).
Cash, H. L., Whitham, C. V., Behrendt, C. L. & Hooper, L. V. Symbiotic bacteria direct expression of an intestinal bactericidal lectin. Science 313, 1126–1130 (2006).
Caufield, P. W. et al. Natural history of Streptococcus sanguinis in the oral cavity of infants: evidence for a discrete window of infectivity. Infect. Immun. 68, 4018–4023 (2000).
Cheesman, S. E. & Guillemin, K. We know you are in there: conversing with the indigenous gut microbiota. Res. Microbiol. 158, 2–9 (2007).
Collins, M. D. et al. The phylogeny of the genus Clostridium: proposal of five new genera and eleven new species combinations. Int. J. Syst. Bacteriol. 44, 812–826 (1994).
Cox, C. R. & Gilmore, M. S. Native microbial colonization of Drosophila melanogaster and its use as a model of Enterococcus faecalis pathogenesis. Infect. Immun. 75, 1565–1576 (2007).
Czárán, T. L., Hoekstra, R. F. & Pagie, L. Chemical warfare between microbes promotes biodiversity. Proc. Natl Acad. Sci. USA 99, 786–790 (2002).
Davidson, S. K. & Stahl, D. A. Transmission of nephridial bacteria of the earthworm Eisenia fetida. Appl. Environ Microbiol. 72, 769–775 (2006).
DeSantis, T. Z. et al. Greengenes, a chimera-checked 16S rRNA gene database and workbench compatible with ARB. Appl. Environ. Microbiol. 72, 5069–5072 (2006).
Dethlefsen, L., Eckburg, P. B., Bik, E. M. & Relman, D. A. Assembly of the human intestinal microbiota. Trends Ecol. Evol. 21, 517–523 (2006).
Doebeli, M., Hauert, C. & Killingback, T. The evolutionary origin of cooperators and defectors. Science 306, 859–862 (2004).
Eckburg, P. B. et al. Diversity of the human intestinal microbial flora. Science 308, 1635–1638 (2005).
Flint, H. J. Polysaccharide breakdown by anaerobic microorganisms inhabiting the mammalian gut. Adv. Appl. Microbiol. 56, 89–120 (2004).
Flint, H. J., Duncan, S. H., Scott, K. P. & Louis, P. Interactions and competition within the microbial community of the human colon: links between diet and health. Environ. Microbiol. 9, 1101-1111 (2007).
Fons, M., Gomez, A. & Karjalainen, T. Mechanisms of colonisation and colonization resistance of the digestive tract. Part 2: bacteria/bacteria interactions. Microb. Ecol. Health Dis. 12, 240–246 (2000).
Foster, K. R. & Wenseleers, T. A general model for the evolution of mutualisms. J. Evol. Biol. 19, 1283–1293 (2006).
Fraune, I. & Bosch, T. Long-term maintenance of species-specific bacterial microbiota in the basal metazoan Hydra. Proc. Natl Acad. Sci. USA 104, 13146–13151 (2007).
Gao, Z., Tseng, C. H., Pei, Z. & Blaser, M. J. Molecular analysis of human forearm superficial skin bacterial biota. Proc. Natl Acad. Sci. USA 104, 2927–2932 (2007).
Gardner, A., West, S. A. & Buckling, A. Bacteriocins, spite and virulence. Proc. R. Soc. Lond B 271, 1529–1535 (2004).
Gill, S. R. et al. Metagenomic analysis of the human distal gut microbiome. Science 312, 1355–1359 (2006).
Gong, J. et al. 16S rRNA gene-based analysis of mucosa-associated bacterial community and phylogeny in the chicken gastrointestinal tracts: from crops to ceca. FEMS Microbiol.Ecol. 59, 147–157 (2007).
Goodrich-Blair, H. & Clarke, D. J. Mutualism and pathogenesis in Xenorhabdus and Photorhabdus: two roads to the same destination. Mol. Microbiol. 64, 260–268 (2007).
Gordon, D. M., Riley, M. A. & Pinou, T. Temporal changes in the frequency of colicinogeny in Escherichia coli from house mice. Microbiology 144, 2233–2240 (1998).
group-specific 16S rRNA gene primers. FEMS Microbiol. Ecol. 48, 437–446 (2004).
Guarner, F. et al. Mechanisms of disease: the hygiene hypothesis revisited. Nature Clin. Pract. Gastroenterol. Hepatol. 3, 275–284 (2006).
Hongoh, Y. et al. Intra- and interspecific comparisons of bacterial diversity and community structure support coevolution of gut microbiota and termite host. Appl. Environ. Microbiol. 71, 6590–6599 (2005).
Jernberg, C., Sullivan, A., Edlund, C. & Jansson, J. K. Monitoring of antibiotic-induced alterations in the human intestinal microflora and detection of probiotic strains by use of terminal restriction fragment length polymorphism. Appl. Environ. Microbiol. 71, 501–506 (2005).
Kelly, D. et al. Commensal anaerobic gut bacteria attenuate inflammation by regulating nuclear–cytoplasmic shuttling of PPAR- and RelA. Nature Immunol. 5, 104–112 (2004).
Kikuchi, Y. & Graf, J. Spatial and temporal population dynamics of a naturally occurring two-species microbial community inside the digestive tract of the medicinal leech. Appl. Environ. Microbiol. 73, 1984–1991 (2007).
Klaassens, E. S., de Vos, W. M. & Vaughan, E. E. Metaproteomics approach to study the functionality of the microbiota in the human infant gastrointestinal tract. Appl. Environ. Microbiol. 73, 1388–1392 (2007).
Kolenbrander, P. E. et al. Communication among oral bacteria. Microbiol. Mol. Biol. Rev. 66, 486–505 (2002).
Kolenbrander, P. E. et al. Bacterial interactions and successions during plaque development. Periodontol. 2000 42, 47–79 (2006).
Lay, C. et al. Colonic microbiota signatures across five northern European countries. Appl. Environ. Microbiol. 71, 4153–4155 (2005).
Leavis, H. L., Bonten, M. J. & Willems, R. J. Identification of high-risk enterococcal clonal complexes: global dispersion and antibiotic resistance. Curr. Opin. Microbiol. 9, 454–460 (2006).
Lepp, P. W. et al. Methanogenic Archaea and human periodontal disease. Proc. Natl Acad. Sci. USA 101, 6176–6181 (2004).
Ley, R. E., Peterson, D. A. & Gordon, J. I. Ecological and evolutionary forces shaping microbial diversity in the human intestine. Cell 124, 837–848 (2006).
Li, J. et al. Identification of early microbial colonizers in human dental biofilm. J. Appl. Microbiol. 97, 1311–1318 (2004).
Lofmark, S., Jernberg, C., Jansson, J. K. & Edlund, C. Clindamycin-induced enrichment and long-term persistence of resistant Bacteroides spp. and resistance genes. J. Antimicrob. Chemother. 58, 1160–1167 (2006).
Mackie, R. I., Rycyk, M., Ruemmler, R. L., Aminov, R. I. & Wikelski, M. Biochemical and microbiological evidence for fermentative digestion in free-living land iguanas (Conolophus pallidus) and marine iguanas (Amblyrhynchus cristatus) on the Galapagos archipelago. Physiol. Biochem. Zool. 77, 127–138 (2004).
Macpherson, A. J., Geuking, M. B. & McCoy, K. D. Immune responses that adapt the intestinal mucosa to commensal intestinal bacteria. Immunology 115, 153–162 (2005).
Martin, F. P. et al. A top-down systems biology view of microbiome–mammalian metabolic interactions in a mouse model. Mol. Syst. Biol. 3, 112 (2007).
Matsuki, T., Watanabe, K., Fujimoto, J., Takada, T. & Tanaka, R. Use of 16S rRNA genetargeted group-specific primers for real-time PCR analysis of predominant bacteria in human feces. Appl. Environ. Microbiol. 70, 7220–7228 (2004).
Matzinger, P. The danger model: a renewed sense of self. Science 296, 301–305 (2002).
Mazmanian, S. K., Liu, C. H., Tzianabos, A. O. & Kasper, D. L. An immunomodulatory molecule of symbiotic bacteria directs maturation of the host immune system. Cell 122, 107–118 (2005).
McFall-Ngai, M. Adaptive immunity: care for the community. Nature 445, 153 (2007).
Miragaia, M., Thomas, J. C., Couto, I., Enright, M. C. & de Lencastre, H. Inferring a population structure for Staphylococcus epidermidis from multilocus sequence typing data. J. Bacteriol. 189, 2540–2552 (2007).
Monot, M. et al. On the origin of leprosy. Science 308, 1040–1042 (2005).
Moore, W. E. & Moore, L. H. Intestinal floras of populations that have a high risk of colon cancer. Appl. Environ. Microbiol. 61, 3202–3207 (1995).
Naylor, S. W., Gally, D. L. & Low, J. C. Enterohaemorrhagic E. coli in veterinary medicine. Int. J. Med. Microbiol. 295, 419–441 (2005).
Nelson, K. E. et al. Phylogenetic analysis of the microbial populations in the wild herbivore gastrointestinal tract: insights into an unexplored niche. Environ. Microbiol. 5, 1212–1220 (2003).
Nyholm, S. V. & McFall-Ngai, M. J. The winnowing: establishing the squid–Vibrio symbiosis. Nature Rev. Microbiol. 2, 632–642 (2004).
O’Keefe, S. J. et al. Why do African Americans get more colon cancer than Native Africans? J. Nutr. 137, 175S–182S (2007).
Palmer, C., Bik, E. M., DiGiulio, D. B., Relman, D. A. & Brown, P. O. Development of the human infant intestinal microbiota. PLoS Biol. 5, e177 (2007).
Pei, Z. et al. Bacterial biota in the human distal esophagus. Proc. Natl Acad. Sci. USA 101, 4250–4255 (2004).
Pepin, J. et al. Emergence of fluoroquinolones as the predominant risk factor for Clostridium difficile-associated diarrhea: a cohort study during an epidemic in Quebec. Clin. Infect. Dis. 41, 1254–1260 (2005).
Pool-Zobel, B., Veeriah, S. & Bohmer, F. D. Modulation of xenobiotic metabolising enzymes by anticarcinogens—focus on glutathione S-transferases and their role as targets of dietary chemo-prevention in colorectal carcinogenesis. Mutat. Res. 591, 74–92 (2005).
Rakoff-Nahoum, S., Paglino, J., Eslami-Varzaneh, F., Edberg, S. & Medzhitov, R. Recognition of commensal microflora by Toll-like receptors is required for intestinal homeostasis. Cell 118, 229–241 (2004).
Read, A. F. & Taylor, L. H. The ecology of genetically diverse infections. Science 292, 1099 1102 (2001).
Reid, G. & Bruce, A. W. Probiotics to prevent urinary tract infections: the rationale and evidence. World J. Urol. 24, 28–32 (2006).
Rendon, M. A. et al. Commensal and pathogenic Escherichia coli use a common pilus adherence factor for epithelial cell colonization. Proc. Natl Acad. Sci. USA 104, 10637–10642 (2007).
Robinson, D. A. & Enright, M. C. Multilocus sequence typing and the evolution of methicillinresistant Staphylococcus aureus. Clin. Microbiol. Infect. 10, 92–97 (2004).
Robinson, D. A., Sutcliffe, J. A., Tewodros, W., Manoharan, A. & Bessen, D. E. Evolution and global dissemination of macrolide-resistant group A streptococci. Antimicrob. Agents Chemother. 50, 2903–2911 (2006).
Sachs, J. L., Mueller, U. G., Wilcox, T. P. & Bull, J. J. The evolution of cooperation. Q. Rev. Biol. 79, 135–160 (2004).
Samuel, B. S. & Gordon, J. I. A humanized gnotobiotic mouse model of host–Archaealbacterial mutualism. Proc. Natl Acad. Sci. USA 103, 10011–10016 (2006).
Savage, D. C. in Mucosal Immunology (eds Mestecky, J. et al.) 19-34 (Elsevier, Boston, 2005).
Schell, M. A. et al. The genome sequence of Bifidobacterium longum reflects its adaptation to the human gastrointestinal tract. Proc. Natl Acad. Sci. USA 99, 14422–14427 (2002).
Servin, A. L. Antagonistic activities of lactobacilli and bifidobacteria against microbial pathogens. FEMS Microbiol. Rev. 28, 405–440 (2004).
Shiner, E. K., Rumbaugh, K. P. & Williams, S. C. Inter-kingdom signaling: deciphering the language of acyl homoserine lactones. FEMS Microbiol. Rev. 29, 935–947 (2005).
Sjolund, M., Tano, E., Blaser, M. J., Andersson, D. I. & Engstrand, L. Persistence of resistant Staphylococcus epidermidis after single course of clarithromycin. Emerg. Infect. Dis. 11, 1389–1393 (2005).
Sperandio, V., Torres, A. G., Jarvis, B., Nataro, J. P. & Kaper, J. B. Bacteria–host communication: the language of hormones. Proc. Natl Acad. Sci. USA 100, 8951–8956 (2003).
Swenson, W., Wilson, D. S. & Elias, R. Artificial ecosystem selection. Proc. Natl Acad. Sci. USA 97, 9110–9114 (2000).
Taylor, L. H., Latham, S. M. & Woolhouse, M. E. Risk factors for human disease emergence. Phil. Trans. R. Soc. Lond. B 356, 983–989 (2001).
Tilman, D. Niche tradeoffs, neutrality, and community structure: a stochastic theory of resource competition, invasion, and community assembly. Proc. Natl Acad. Sci. USA 101, 10854–10861 (2004).
Uenishi, G. et al. Molecular analyses of the intestinal microbiota of chimpanzees in the wild and in captivity. Am. J. Primatol. 69, 367–376 (2007).
Vanhoutte, T., Huys, G., De Brandt, E. & Swings, J. Temporal stability analysis of the microbiota in human feces by denaturing gradient gel electrophoresis using universal and
Verhelst, R. et al. Cloning of 16S rRNA genes amplified from normal and disturbed vaginal microflora suggests a strong association between Atopobium vaginae, Gardnerella vaginalis and bacterial vaginosis. BMC Microbiol. 4, 16 (2004).
Walther, B. A. & Ewald, P. W. Pathogen survival in the external environment and the evolution of virulence. Biol. Rev. Camb. Philos. Soc. 79, 849–869 (2004).
West, S. A. & Buckling, A. Cooperation, virulence and siderophore production in bacterial parasites. Proc. R. Soc. Lond B 270, 37–44 (2003).
Wickham, M. E., Brown, N. F., Boyle, E. C., Coombes, B. K. & Finlay, B. B. Virulence is positively selected by transmission success between mammalian hosts. Curr. Biol. 17, 783–788 (2007).
Wilson, D. S. Biological communities as functionally organized units. Ecology 78, 2018–2024 (1997).
Wilson, K. H., Brown, R. S., Andersen, G. L., Tsang, J. & Sartor, B. Comparison of fecal biota from specific pathogen free and feral mice. Anaerobe 12, 249–253 (2006).
Wirth, T. et al. Sex and virulence in Escherichia coli: an evolutionary perspective. Mol. Microbiol. 60, 1136–1151 (2006).
Wolfe, N. D., Dunavan, C. P. & Diamond, J. Origins of major human infectious diseases. Nature 447, 279–283 (2007).
Woolhouse, M. E., Taylor, L. H. & Haydon, D. T. Population biology of multihost pathogens. Science 292, 1109–1112 (2001).
Woolhouse, M. E., Webster, J. P., Domingo, E., Charlesworth, B. & Levin, B. R. Biological and biomedical implications of the co-evolution of pathogens and their hosts. Nature Genet. 32, 569–577 (2002).
Wren, B. W. The yersiniae — a model genus to study the rapid evolution of bacterial pathogens. Nature Rev. Microbiol. 1, 55–64 (2003).
Xu, J. et al. A genomic view of the human–Bacteroides thetaiotaomicron symbiosis. Science 299, 2074–2076 (2003).
Young, V. B. & Schmidt, T. M. Antibiotic-associated diarrhea accompanied by large-scale alterations in the composition of the fecal microbiota. J. Clin. Microbiol. 42, 1203–1206 (2004).
Zhou, X. et al. Characterization of vaginal microbial communities in adult healthy women using cultivation-independent methods. Microbiology 150, 2565–2573 (2004).
Zoetendal, E. G., Akkermans, A. D. L., Akkermans-van Vliet, W. M., de Visser, J. A. G. M. & de Vos, W. M. The host genotype affects the bacterial community in the human gastrointestinal tract. Microb. Ecol. Health Dis. 13, 129–134 (2001).
INCOMPLETE RECOVERY AND INDIVIDUALIZED RESPONSES OF THE HUMAN DISTAL GUT MICROBIOTA TO REPEATED ANTIBIOTIC PERTURBATION67
Les Dethlefsen68and David A. Relman68,69,70
Abstract
The indigenous human microbiota is essential to the health of the host. Although the microbiota can be affected by many features of modern life, we know little about its responses to disturbance, especially repeated
___________
67 Reprinted with permission from PNAS. Edited by Jeffrey I. Gordon, Washington University School of Medicine, St. Louis, MO, and approved August 17, 2010 (received for review March 15, 2010).
68 Department of Microbiology and Immunology and Department of Medicine, Stanford University School of Medicine, Stanford, CA 94305.
69 Veterans Affairs Palo Alto Health Care System, Palo Alto, CA 94304.
70 To whom correspondence should be addressed. E-mail:relman@stanford.edu.
Author contributions: L.D. and D.A.R. designed research; L.D. performed research; L.D. contributed new reagents/analytic tools; L.D. and D.A.R. analyzed data; and L.D. and D.A.R. wrote the paper.
The authors declare no conflict of interest.
This paper results from the Arthur M. Sackler Colloquium of the National Academy of Sciences, “Microbes and Health,” held November 2–3, 2009, at the Arnold and Mabel Beckman Center of the National Academies of Sciences and Engineering in Irvine, CA. The complete program and audio files of most presentations are available on the NAS Web site at http://www.nasonline.org/SACKLER_Microbes_and_Health.
This article is a PNAS Direct Submission.
Database deposition: The sequences reported in this paper have been deposited in the NCBI Short Read Archive database (accession no.SRA020961).
This article contains supporting information online atwww.pnas.org/lookup/suppl/doi:10.1073/pnas.1000087107/-/DCSupplemental.
Keywords: human microbiome | microbial community resilience | alternative stable state | ecosystem | ciprofloxacin
disturbances, and how these changes compare with baseline temporal variation. We examined the distal gut microbiota of three individuals over 10 mo that spanned two courses of the antibiotic ciprofloxacin, analyzing more than 1.7 million bacterial 16S rRNA hypervariable region sequences from 52 to 56 samples per subject. Interindividual variation was the major source of variability between samples. Day-to-day temporal variability was evident but constrained around an average community composition that was stable over several months in the absence of deliberate perturbation. The effect of ciprofloxacin on the gut microbiota was profound and rapid, with a loss of diversity and a shift in community composition occurring within 3–4 d of drug initiation. By 1 wk after the end of each course, communities began to return to their initial state, but the return was often incomplete. Although broadly similar, community changes after ciprofloxacin varied among subjects and between the two courses within subjects. In all subjects, the composition of the gut microbiota stabilized by the end of the experiment but was altered from its initial state. As with other ecosystems, the human distal gut microbiome at baseline is a dynamic regimen with a stable average state. Antibiotic perturbation may cause a shift to an alternative stable state, the full consequences of which remain unknown.
All mammals have evolved in the presence of a complex and intimately associated microbial ecosystem, with the highest cell densities found in the gut. The vertebrate gut was no doubt a microbial habitat even before the origin of mammals; during thislong coevolutionary history, distinct lineages of bacteria arose that are specialized for the gut habitat. Because the gut microbiota tends to be shared within families (Turnbaugh et al., 2009), these lineages can expand their habitat by enhancing the fitness of their hosts. Mammalian hosts have come to depend on microbial activities to assist digestion, provide vitamins, resist pathogens, and regulate metabolism and the immune system. Thus, there has been and continues to be selection for mutualism between the microbiota and its host (Dethlefsen et al., 2007; Ley et al., 2006).
Many aspects of the modern world influence the interactions of humans with their microbiota in ways that are unprecedented in our evolutionary history. These factors include urbanization, rapid global mobility, highly processed diets, improved sanitation and hygiene, nonfamilial child care, and medical therapies, especially antibiotics (Dethlefsen et al., 2007). There are a number of concerns related to the impact of antibiotics on the human microbiota. One is the spread of antibiotic resistance among pathogens, which is facilitated by transfer from and between mutualists (Salyers et al., 2004; Sommer et al., 2009). More generally, there is a concern that altering the composition of the microbiota will interfere with some of the human–microbe interactions that are integral to human physiology (Blaser and Falkow, 2009). Although most courses of antibiotics result in no immediate signs or symptoms, acute (Beaugerie and Petit, 2004) and chronic
(Flöistrup et al., 2006; Marra et al., 2006) health problems are associated with antibiotic use. The hygiene hypothesis asserts that increasing rates of autoimmune disorders in the developed world, such as asthma and inflammatory bowel disease, are related to the disruption of the normal interactions within and between the human microbiota and the host (Gaumer et al., 2006).
The dynamics of a single complex community over time can reveal more about interactions between community members than a collection of one-time snapshot samples from distinct communities in similar habitats. The interpersonal variation in the composition of the human microbiota implies that the same species may occupy somewhat different niches in different individuals and have different linkages to other taxa, thus displaying different responses to disturbance. However, averaging the effects of a disturbance across multiple individuals may inappropriately treat these diverse phenomena as a single, albeit noisy phenomenon. In contrast, measurements within an individual over time may reveal the range of variation possible in a system governed by the same set of interactions. Time series that span an experimental intervention in a complex community can be particularly useful, because the hypothesized relationships can be examined in potentially different states.
We present here a cultivation-independent survey through time of the composition of the distal gut microbiota of three individuals before, during, and after two exposures to the same antibiotic (in this case, ciprofloxacin). The findings reveal a dynamic ecological system with considerable resilience but also suggest that, in some cases, the system retains a memory of past disturbance; in all cases, repeated disturbance led to a persistent regime shift.
Results
We monitored bacterial communities in the distal gut of three subjects (D, E, and F) by collecting stool samples (52–56 per subject) over a 10-mo interval, during which time these subjects took two 5-d courses of the antibiotic ciprofloxacin (Cp) separated by 6 mo. Samples were collected daily for two 19-d periods surrounding each Cp course and weekly or monthly at other times (Table S1). Analysis of 18 samples before, during, and after the first Cp course in subjects A–C from the same study has been reported previously (Dethlefsen et al., 2008).
Colony Counts in the Presence of 0, 1, and 10 μg/mL Cp
Aliquots of fresh stool samples from immediately before, immediately after, and 4 wk after each Cp course were diluted and plated in duplicate on aerobic trypticase soy agar medium containing no, low, or high levels of Cp (0, 1, and 10 µg/mL Cp). The density of cells capable of growth in these conditions ranged from 1.3 × 10⁴ cfu/mL to 1.6 × 10⁷ cfu/mL at times not associated with Cp and from 7.5 × 10³ cfu/mL to 2.2 × 10⁵ cfu/mL immediately after Cp (Table S2).
The concentration of cultivable cells increased during the first Cp in subject D and then, fell over the next 4 wk. For the second Cp in D and both courses in the other two subjects, the cultivable population decreased by ~1–2 log with Cp administration and increased again over the subsequent 4 wk. The proportion of cultivable cells that were capable of growth in 10 µg/mL Cp was increased by Cp and fell over the subsequent 4 wk in all instances. The same pattern was observed in most cases for cells capable of growth in 1 µg/mL Cp. For both courses in subjects D and F, the concentrations of bacteria capable of growth at both low and high Cp concentrations at 4-wk posttreatment were greater than they had been immediately before Cp exposure.
Sequencing Depth and Community Diversity
From PCR amplicons spanning the V1, V2, and V3 hypervariable regions of the 16S rRNA gene, 1.76 million pyrosequencing reads (5,901–41,901 per sample) (Table A17-1) were clustered into 2,582 reference operational taxonomic units (refOTUs; 1,610–2,019 per subject) (Table A17-1 and SI Text). Good’s coverage (estimated probability that the next read will belong to a refOTU that has already been found) averaged 98.5%± 0.5% (mean ± SD, range = 96.9–99.5%) for individual samples; coverage for each subject exceeded 99.99%. Fig. A17-1 depicts refOTU relative abundance as a heat map for the Bacteroidetes phylum and subsets of Lachnospiraceae and Ruminococcaceae in the Firmicutes phylum; a heat map with all 2,582 refOTUs is provided in Fig. S1. The same clades of related refOTUs tended to be abundant across all samples and subjects; most refOTUs declined in relative abundance immediately after Cp. On closer examination (Fig. A17-1 and Fig. S2), a variety of temporal patterns was evident, such as taxa that became more abundant after Cp (e.g., Moreyella and related refOTUs in the Lachnospiraceae), those that showed perturbations of different duration after the two courses (e.g., Faecalibacterium), those that recovered from the first Cp but not the second Cp (Alistipes in D), those that were no longer detected after the first Cp (e.g., Subdolilgranulum in F), and those that varied in abundance independently of Cp treatment (e.g., a clade within Lachnospira in E). Despite the traditional characterization of the gut microbiota as a stable community, few refOTUs maintained uniformabundance, even considering only the Cp-free intervals of the experiment.
Of the 2,582 refOTUs detected in the study (Dataset S1), 1,089 (42%) were found at least one time in each of the three subjects, and 150 (5.8%) were detected in at least one-half of the samples of each subject. Only 120 refOTUs (4.6%) were found at a relative abundance of at least 10−3 in at least one sample from each subject, and 4 refOTUs (0.4%) attained at least that abundance in at least one-half of the samples of all three subjects. A taxon at 10−3 relative abundance has about a 99% probability of being detected in the sample with the fewest pyrosequencing reads. For questions related to the core microbiota, it makes sense to
TABLE A17-1 Pyrosequencing Reads, refOTUs, and Coverage
| Subject | Reads (range per sample | Observed refOTUs (range per sample | Estimated refOTUs* ± SEM | Good’s coverage (range per sample) | Phyla |
| D | 506,662 (5,901–16,415) | 1,732 (137–552) | 2,621 ± 163 | 0.9993 (0.969−0.994) | 8 |
| E | 672,947 (7,013–41,901) | 2,019 (336–796) | 2,787 ± 110 | 0.9995 (0.973−0.995) | 10 |
| F | 581,365 (6,426–14,583) | 1,610 (135–596) | 2,267 ± 73 | 0.9994 (0.981−0.995) | 7 |
| Total | 1,760,974 | 2,691 | 3,520 ± 139 | 0.9998 | 11 |
* Parametric estimate of total refOTU richness by best-fitting model of abundance distribution (Bunge and Barger, 2008).
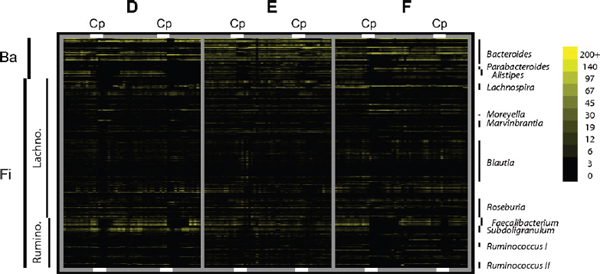
FIGURE A17-1 Heat map displaying the relative abundance of refOTUs in three prominent clades of bacteria. Relative abundance is based on the number of pyrosequencing reads clustering into each refOTU after normalizing the number of reads per sample. Clades are indicated on the left; Ba is all 174 refOTUs within the Bacteroidetes phylum. Within the Firmicutes phylum (Fi), the figure shows clades within the Lachnospiraceae (573 refOTUs) and the Ruminococcaceae (211 refOTUs) that contain the prominent genera named on the right. Each column corresponds to a sample in sequential order for each of subjects D, E, and F, with the times of Cp administration indicated by white bars at the top and bottom of the heat map. Each row corresponds to 1 refOTU, listed in phylogenetic order as defined by the Silva 100 reference tree. Color intensity is proportional to the logarithm of refOTU abundance from 0 to 200 reads as indicated by the scale; color is saturated for abundance of 200 or more.
consider only non-Cp samples rather than confounding the effects of a deliberate perturbation with comparisons of taxon representation across subjects. Individual non-Cp samples contained 91 ± 14, 96 ± 11, and 109 ± 21 refOTUs (mean ± SD) with relative abundance of at least 10−3 in subjects D, E, and F, respectively, with 309, 336, and 351 refOTUs attaining that abundance at least one time over all non-Cp time points froma single subject. There were 111 refOTUs that attained 10−3 relative abundance in at least one non-Cp sample of each subject. The list of abundant refOTUs (>10−3 relative abundance) in a single non-Cp sample typically contained about one-half or fewer of these 111 refOTUs that were shared among subjects and at least sometimes abundant (50%, 47%, and 43% on average for D, E, and F).
Between 49% and 56% of the reads in each subject were affiliated with the Bacteroidetes phylum (167 refOTUs), 37–48% with Firmicutes (2,266 refOTUs), 1.2–3.1% with Proteobacteria (90 refOTUs), 1.2–2.7% with Verrucomicrobia (3 refOTUs), and fewer than 0.1% with Actinobacteria (35 refOTUs) (Fig. S3). The proportion of reads classified to the same refOTU correlated well between technical replicates (mean Pearson correlation = 0.9905 ± 0.0159 SD, range = 0.9183–0.9991, n = 39 pairs of replicates) (Fig. S4 and Table S3). Additional discussion of the inferred community composition and the reproducibility of the results is found in SI Text.
The observed richness of refOTUs differed significantly between subjects (E > D > F, P < 10−6) when comparisons were made after rarefaction to the same number of reads (506,000/subject) to standardize sampling effort. Parametric estimation of total OTU richness per subject according to the best fitting of several models (Bunge and Barger, 2008) showed the same relative order, although the difference between E and D was not significant (Table A17-1 and additional discussion in SI Text). The rank order was reversed for taxon evenness (F, 0.88; D, 0.85; E, 0.82; P < 10−6) and diversity (F, 6.47; D, 6.35; E, 6.22; P < 10−6) assessed through Shannon entropy. Within-subject (α) 1° diversity according to Jost (2006) showed the same pattern (F, 644; D, 584; E, 502; P < 10−6), with an average of 577 effective refOTUs/subject (i.e., average diversity per subject was equivalent to a community with 577 equally common taxa). Between-subject (β) 1° diversity across all subjects was 1.84 effective communities [i.e., the 1° diversity in the three subjects combined (γ diversity) was 1,062 refOTUs, which was 1.84 times the average α diversity for a single subject].
Effects of Cp on Diversity
Cp had a marked effect on the distal gut microbiota, despite the absence of any gastrointestinal symptoms reported by subjects. The Cp-associated disturbances shared some features across all subjects and both Cp courses, as indicated by plots of refOTU richness, phylogenetic diversity, and Shannon entropy over time (Fig. A17-2). Richness and diversity (assessed after rarefaction to 5,900
reads/sample to standardize sampling intensity) plunged rapidly 3–4 d after the subjects began Cp; the lowest values of these parameters occurred on the last 2 d of Cp treatment or during the several days thereafter. Richness and diversity also rebounded rapidly, recovering much of their lost value in 1–2 d. Parametric estimation of total richness per treatment interval within each subject (Bunge and Barger, 2008) showed a drop in richness in each Cp-perturbed interval relative to the intervals immediately before and after; the drop was statistically significant in all cases except the comparison of pre-Cp with first Cp in E (Fig. S5 and SI Text). In addition to the obvious similarities between each Cp perturbation, however, there were less obvious differences between subjects and between courses in the effect of Cp on richness and diversity. Displacement from the pre-Cp values of these parameters was strongest in D and weakest in E (P < 10−6), and although the magnitude of the first and second perturbations did not differ significantly in D and E (P > 0.05), the second perturbation was smaller than the first in F (P < 10−6). The differences between subjects in the effects of Cp on diversity and richness had no obvious relationship to the initial richness and diversity values. The response to the first Cp course in E was unique, with wide day-today fluctuations in the diversity of the microbiota (Fig. A17-2). A subset of taxa with daily oscillations in abundance was responsible for this phenomenon (e.g., refOTUs in the genera Blautia, Roseburia, and Dorea) (Fig. A17-1, Fig. S1, and SI Text).
The short-duration, asymptomatic drop in richness and diversity of the microbiota after Cp was consistent with our previously reported results (Dethlefsen et al., 2008). However, the restricted set of samples in the previous analysis limited the temporal resolution of recovery time to 4 wk after the first course of Cp and did not permit comparison of the Cp perturbation with non–Cp-associated temporal fluctuations in the diversity of the gut microbiota at a range of time scales.
Effects of Cp on Community Membership
Similarities and differences between the membership of the distal gut microbial communities of the three subjects and between the first and second Cp responses are portrayed by principal coordinate analysis (PCoA) of unweighted UniFrac distances, a measure of community dissimilarity based on OTU presence/absence (community membership) that takes into account evolutionary relatedness among OTUs (Lozupone et al., 2006) (Fig. A17-3). As suggested by the diversity statistics (Fig. A17-2), the responses of the gut microbiota to Cp shared features across all subjects, despite interindividual community differences. On closer examination, differences in theCp response among subjects and between the first and second Cp course in some subjects were also apparent.
The first principal coordinate (PC1) explains 13.6% of intersample variance and is driven primarily by the response to Cp, with maximally perturbed samples on the right clearly separated from clusters of non-Cp (pre-Cp, interim,
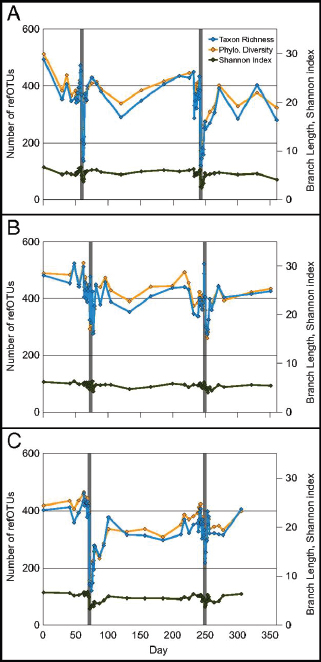
FIGURE A17-2 Three measures of biological diversity for samples from subjects D (A), E (B), and F (C). Calculations were made after rarefying to an equal number of reads for all samples to control for unequal sampling effort. Narrow gray rectangles indicate the 5-d Cp courses; daily sampling around these times allowed visualization of daily fluctuations in diversity parameters that were not evident during less frequent sampling. RefOTU richness (number of refOTUs observed per sample) is shown on the left y axis; phylogenetic diversity (PD; total branch length of the phylogenetic tree relating all refOTUs in the sample) and the Shannon index of diversity are shown on the right y axis. The x axis reflects experiment day.
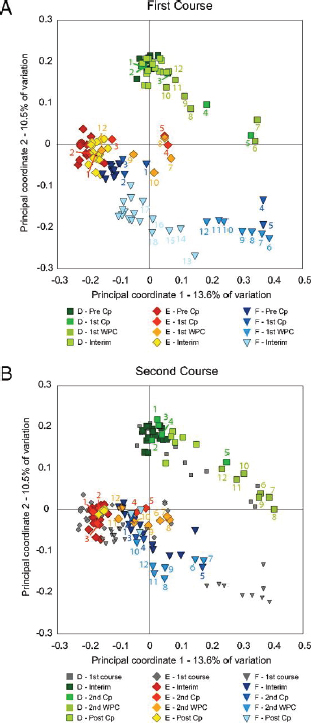
FIGURE A17-3 PCoA of unweighted UniFrac distances, a phylogenetically aware measure of intersample (β) diversity. A covers the period encompassing the first Cp, with samples before Cp (pre-Cp), during the first Cp course (first Cp), during the first week post-Cp (first WPC), and in the interim period between Cp courses (interim) progressing from darker to lighter shades. B covers the second Cp period, with interim samples in the darkest shades and the second Cp course, second WPC, and post-Cp periods becoming progressively lighter. Data points from A are also shown on B with small gray symbols to facilitate comparisons between the two parts of the experiment. Numbers adjacent to some samples track the Cp perturbation by indicating the number of days elapsed since the start of Cp administration; missing numbers indicate that samples were not collected on those days.
and post-Cp) samples on the left. The community response to the first Cp in F is unique in that it required several months, not merely 1 wk, to approach a stable interim state; the prolonged transition represents slow directional change as opposed to prolonged instability. Both PC2 (10.5% of variance) and PC3 (9.7% of variance) (Fig. S6) reflect a mixture of the Cp response and interpersonal differences. Most samples of the three subjects are separated into distinct regions on PC2. The gut microbiota of subjects D and F responded to the first Cp in the same direction along PC2, but whereas samples from D eventually regained their pre-Cp values and then responded similarly to the second Cp, samples from F did not rebound along PC2 after the initial Cp perturbation and were not influenced on this axis by the second Cp. Samples from E showed no obvious trend along PC2 in response to Cp.
On PC3 (Fig. S6), non-Cp samples of D and F are offset only slightly from each other, and the Cp effects of both courses are reflected in vectors of similar direction and magnitude for these two subjects. The coordinates of non-Cp samples were lower and the Cp effect was smaller along PC3 for E than for the other subjects, but the direction of the effect was consistent. In contrast to the first three PCoA axes, PC4 (4.0%) captures an effect that differs in direction between the subjects. After each Cp course, samples from D shifted in a positive direction on PC4 and returned, whereas those from E did the opposite. The refOTUs that most differentiated the responses of D and E (SI Text and Dataset S1) were roughly evenly divided among the Bacteroidetes (particularly Bacteroides and Parabacteroides), the Lachnospiraceae (Blautia and uncharacterized), and the Ruminococcaceae (Faecalibacterium and several other genera.) The pattern was more complex in F and differed between the courses.
For comparison, previously reported results examining a single Cp course showed responses in the same direction for all subjects along the first ordination axis and in the opposite direction for one of three subjects along the second ordination axis, with the magnitude of the Cp response being much smaller in one of three subjects (Dethlefsen et al., 2008). Because only one or two Cp-affected samples were included in the earlier analysis, we were unable at that time to assess the dynamics of the response and whether it followed a linear trajectory to the perturbed state and back or some more complicated pattern.
Because the unweighted UniFrac distance between communities represents the absence of shared, related (or identical) taxa, samples with similar PCoA coordinates (i.e., low UniFrac distance between them) share a set of related taxa. A trajectory of changing coordinates over time represents the gain or loss of taxa, and therefore, Cp responses associated with vectors of similar direction on the first three axes indicate that most taxa that appeared or disappeared in response to Cp in one subject tended to behave similarly in other subjects, if they responded at all. The refOTUs that by their presence or absence most clearly differentiated the perturbed and nonperturbed samples across all subjects (Dataset S1) were dominated by taxa that were often present in non-Cp samples and absent in most
Cp-perturbed samples (and not taxa that appeared only in perturbed samples). About one-half of these disturbance-differentiating taxa are affiliated with the Ruminococcaceae in the Firmicutes phylum, and about one-half of these
Ruminococcaceae refOTUs can be assigned to the genus Faecalibacterium, a genus we found to be reduced or eliminated in response to Cp in other subjects as well (Dethlefsen et al., 2008). The second most common affiliation of refOTUs that differentiated non-Cp from Cp-perturbed samples by their presence or absence was uncultivated or uncharacterized Lachnospiraceae, highlighting the importance of continuing attempts to cultivate and characterize strains from this prominent family of intestinal microbes.
Effects of Cp on Community Composition
We assessed the changing community composition during different time periods of the experiment by using distance-based redundancy analysis (dbRDA) of Bray–Curtis intersample distances (BC). BC is a common metric of community dissimilarity because it makes the reasonable assumption that the shared absence of a taxon is not evidence of community similarity. dbRDA is a supervised ordination technique designed to handle ecologically meaningful but non-Euclidean measures of dissimilarity, such as BC (Legendre and Anderson, 1999). Taxon relative abundance was represented as the logarithm of the number of reads affiliated with each refOTU after rarefaction of the number of reads/sample to a consistent value to control for differences in sampling effort. Log weighting of counts is appropriate for organisms capable of exponential growth on the time scale of our sampling; comparisons of growth (or death) rates are measured by changes in the logarithm of organism abundance. Ordination followed by permutation testing confirmed that the composition of the microbiota varied between subjects and between the time intervals defined with respect to Cp administration (P < 0.01 for each) and that the effect of Cp was not the same in each subject (P < 0.01 for interaction term), with 58.7% of intersample variance explained by these terms. dbRDA of datasets containing only samples from Cp-free intervals of individual subjects indicated that the composition of the pre-Cp, interim, and post-Cp communities differed in every subject (P < 0.01, P = 0.04, and P < 0.01 for D, E, and F, respectively). Posthoc testing within each subject revealed that (i) for both courses in each subject, the composition of the Cp-perturbed microbiota differed from that of the preceding time interval, (ii) the maximally perturbed communities differed between the first and second courses for all subjects, and (iii) the composition of the pre-Cp and post-Cp communities was different in every subject, but in D, the interim community resembled the pre-Cp state, whereas in E and F, the interim communities resembled the post-Cp community.
Visualization of the dbRDA ordination of BC distances (Fig. A17-4) shows that the first two components (together explaining 30.7% of intersample variance) primarily separate samples according to subject but also shows a Cp effect
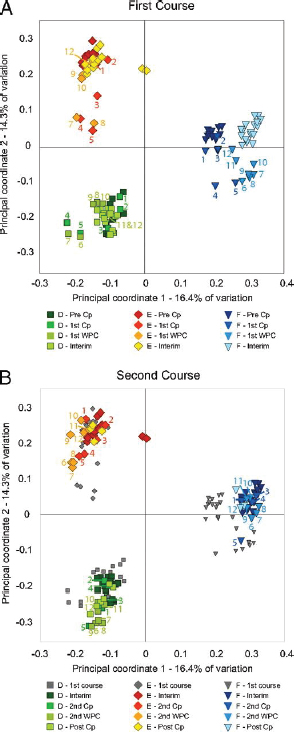
FIGURE A17-4 Distance-based redundancy analysis (Legendre and Anderson, 1999) of Bray–Curtis intersample distances calculated with log2-transformed abundance data. As in Fig. A17-3, A and B show samples surrounding the first and second Cp course respectively, with interim samples appearing in both panels. Symbol color and numbering are as described for Fig. A17-3.
that varies in direction for each subject. Relative to other samples from the same subject, the perturbed samples from D, E, and F tended to be displaced left, down, and right, respectively. In contrast, the third component explaining 9.4% of variance was driven almost entirely by a Cp response that was similar in all subjects (Fig S7). The fourth component (3.8%) captures the unique phenomenon of a prolonged directional shift in the community of F after the first Cp, which was also evident along the first principal coordinate of the unweighted Unifrac analysis. Taken together, the dbRDA data show that community composition is influenced primarily by subject identity and secondarily by Cp effects and that the latter exhibits shared and unique features in these subjects. Plots of the BC intersample distances over time in comparison with a reference sample (Fig S8), chosen as the last sample before the first Cp, also show the relative stability of communities during Cp-free intervals and the shifts in community state that can occur in these communities when they are perturbed by Cp.
The taxa making the greatest contribution to the common Cp response among subjects (SI Text and Dataset S1) include 43 refOTUs that decrease and 11 refOTUs that increase in relative abundance after Cp administration. These taxa include 11 of 20 most abundant refOTUs over all subjects. Within this set of 54 shared Cp responders, those that decrease in abundance after Cp include eight refOTUs in the genus Faecalibacterium and similar numbers of refOTUs elsewhere in the Ruminococcaceae and the Lachnospiraceae; most of these refOTUs are closely related to butyrate-producing isolates from the gut. Seven of eleven shared Cp responders that increase in abundance after Cp are also affiliated with Lachnospiraceae, at least some of which are also closely related to known butyrate producers. The common Cp response also features representatives of the Bacteroidetes phylum, including some that decrease in abundance (seven refOTUs in the genus Bacteroides, four in the genus Alistipes, and two in the family Porphyromonadaceae) and some that increase (four Bacteroides refOTUs) as well as refOTUs affiliated with Sutterella (a β proteobacterium gut symbiont), Thalassospira (first described as an oligotrophic marine α-proteobacterium genus), and 4C0d-2, representing a little-known, deeply branching lineage related to Cyanobacteria, all of which decrease after Cp.
Of note, the diversity statistics (Fig. A17-2), unweighted UniFrac PCoA (Fig. A17-3 and Fig. S6), and dbRDAof BC distances (Fig. A17-4 and Fig. S7) all showed differences between the responses to the first and second courses of Cp in all subjects. For example, after the first Cp, the diversity of the gut microbiota in D recovered in essentially 1 d. In contrast, after the second Cp, there was a biphasic response in measurements of diversity in D. In F, it was the opposite case: a biphasic response after the first Cp and a single-day return after the second Cp. The subject-specific Cp effects displayed along the first two components of the BC ordination differed subtly between the first and second Cp in D and E; for these subjects, the direction of the Cp displacement shifted 30–45° between courses, implying that within each subject, the taxa responding to the two courses
are not entirely the same. The difference between the two perturbations was not subtle in F; we have already noted the prolonged return to a stable state in F after the first Cp that is evident on the first UniFrac ordination axis and fourth BC ordination axis. Furthermore, a large proportion of the first Cp perturbation in F was changes from which no recovery was made; unidirectional displacement is found along the first dbRDA component and the second UniFrac component. After the second Cp, the community composition in F showed essentially no displacement along either of these axes. Another distinction between the first and second Cp in F is found along the third dbRDA component; the second perturbation has a similar direction but roughly one-half the magnitude of the first perturbation.
The taxa that differentiated the two Cp responses were typically found in low abundance in most samples and increased in abundance after Cp (SI Text and Dataset S1). Most such taxa increased dramatically with the first Cp course and less so, if at all, with the second. This pattern contrasts with that of the taxa that most effectively distinguished between Cp-associated and non–Cp-associated samples, which were typically abundant at most sampling times and then decreased in abundance after Cp. The most prominent taxa differentiating between the two Cp responses were refOTUs affiliated with Bacteroides dorei, Akkermansia municiphilia, and several Roseburia species (a genus of butyrate-producing microbes) (Duncan et al., 2002, 2006) as well as other known butyrate producers. Fewer taxa increased to a greater extent during the second Cp course than they did during the first, but among these refOTUs, there are also close relatives to the Roseburia species and to Bacteroides thetaiotaomicron. Intriguingly, this relatively small group of refOTUs included two in different phyla whose closest cultivated relative was named for the ability to degrade xylans (Bacteroides xylanisolvens and Clostridium xylanolyticum) and in general, included refOTUs more distant from their nearest cultivated relative than were the refOTUs showing a greater increase after the first Cp. For example, in addition to the C. xylanolyticum relative, the group included a refOTUclustered around a database clone sequence ~95% (genus level) similar to a cultivated Oscillospira sp., another with ~8–9% (family level) sequence divergence from Eubacterium rectale, and a number of uncharacterized butyrate-producing isolates.
We examined the matrix of BC distances for temporal autocorrelation, finding that, for the pre-Cp and interim periods, the composition of the microbiota was more similar on adjacent sampling days than it was on average over all pairs of samples over that Cp-free interval (P range from 0.001 to 0.043 for five of six comparisons; P = 0.054 for pre-Cp in E). The similarity between adjacent-day samples was significantly less than the similarity between technical replicates (P < 0.001). It is difficult to estimate the time required for autocorrelation of community composition to decay (i.e., the interval after which the community is, on average, as different from its starting composition as it ever becomes without a perturbation), both because of limited data for any given time interval between samples and because of variance in the BC data. Nonetheless, we took the average
BC distance between samples in the same Cp-free interval but separated by at least 2 wk as an estimate of the expected dissimilarity between uncorrelated samples. For subject D, intersample BC distances averaged over a sliding 3-d window (i.e., samples separated by 1–3 d, 2–4 d, etc.) were within an SD of the uncorrelated BC distance after samples were separated by 4–6 d and 5–7 d for pre-Cp and interim samples, respectively. Comparable intervals for F are 3–5 d and 4–6 d, but for E, average BC distances for samples separated by 1–3 d were already within 1 SD of the average for uncorrelated samples during both the pre-Cp and interim intervals. Considering the human gut as a flow-through system with a retention time of about 1–2 d, the decay of autocorrelation over about three retention times is not surprising.
Discussion
The human distal gut is one of the most complex ecosystems on the planet. However, it may be a tractable and powerful system for the study of both basic ecological principles and health-related community interactions through the exploitation of disturbance. Daily sampling in each subject allowed us to compare day to day with longer term changes in the composition of the gut microbiota under both perturbed and nonperturbed conditions. We found that the composition of the gut microbiota is, on average, more similar on adjacent sampling days than on a random pair of days in the same disturbance-free interval and that this temporal autocorrelation decays over several days to a week, depending on the subject. Although most taxa changed in relative abundance from day to day, communities were no more different when compared at times separated by 2–5 mo, on average, than they were at times separated by more than about 1 wk.
The dynamic composition of the gut microbiota over time makes it more difficult to address the concept of the core microbiota. The core microbiota has been taken to mean those components (taxa orgenes) common to all or the vast majority of humans (Turnbaugh et al., 2007), although others have used the term simply to mean those taxa present in a majority of their subjects (Tap et al., 2009). The incomplete characterization of these complex communities must be acknowledged when addressing questions about the core microbiota and especially, its absence (Turnbaugh et al., 2009); the problems are exacerbated if complete characterization requires sampling an individual over time. The apparent conflict between our finding of considerable overlap of refOTUs between subjects and the recent conclusion of Turnbaugh et al. (Turnbaugh et al., 2009) that a core microbiota may not exist with respect to phylogenetic groups (Turnbaugh et al., 2009) evaporates when one realizes that our comparison involves over 5 × 10⁵ pyrosequencing reads per subject collected over many months from three subjects, whereas the Turnbaugh et al. (2009) paper involved an average of ~1.2 × 10⁴ reads collected at a single time from each of 154 subjects.
The routine fluctuations in community composition indicate that the long-term stability of the distal gut community is not maintained by inertia, or resistance to change, but rather, by the action of restoring forces that maintains the state of this dynamic system within a certain range. One might imagine that such restoring forces would be strong enough to allow the community composition to resist change in the face of disturbance. This was not the case for exposure to Cp, despite the fact that Cp is generally believed to have minimal effects on the anaerobic microbiota of the gut. Within 3–4 d of initiating Cp in each subject (perhaps the soonest that might be expected given the time required for Cp concentrations to rise in the cecum and large intestine and the transit time required for material to leave the colon), the community composition made a dramatic shift to a different state. After Cp was discontinued and a lag that must at least partially be explained by these same factors, the community began to return to a state more similar to its pre-Cp state. This return occurred despite the fact that abundant taxa accounting for 25–50% of the community before Cp exposure in the three subjects were essentially wiped out after Cp exposure. For Bacteroides and Lachnospiraceae and to a lesser extent, for Ruminococcaceae (although not Faecalibaterium), taxa closely related to those that had been eliminated surged in abundance at these times but were then rapidly replaced by the original taxa after Cp was withdrawn. At this time, intersubject differences were apparent. In subject D, there was a complete return to pre-Cp conditions after the first perturbation. In E, the first return was largely complete, but the composition of the interim samples remained slightly closer to the perturbed samples. In F, the first Cp perturbation included some taxa that largely rebounded to pre-Cp values (cf dbRDA component 2) and others that made no return at all (cf dbRDA components 1 and 4). Furthermore, whereas 1 wk was sufficient time for samples of Dand E to attain the composition that they maintained during the interim between courses, samples from F continued to show directional change in composition for about 2 mo.
The absence of any GI-related symptoms experienced by the subjects during these times supports the idea that the gut microbiota has functional redundancy among its constituent taxa (Kurokawa et al., 2007; Turnbaugh et al., 2009), at least for functions likely to generate symptoms within several days, such as the fermentation of various food- and host-derived resources entering the large intestine. Thus, the mechanisms responsible for the restoring forces on community composition would not seem to include deficiencies in substrate fermentation in the colon or overt intolerance of the altered communities by the host.
By the end of the study, the community composition in each subject was different from what it had been before the first course of antibiotic, and it seemed to be stable in the new state over the final 2 mo of the study. The contrast with the initial community was most evident in F, where even interim samples never regained the position of pre-Cp samples along the primary ordination axes. This discrepancy was more evident in the dbRDA analysis than in the unweighted Uni-Frac analysis, suggesting that the change was driven more by altered taxon
abundance than by the gain or loss of community members. However, the recovery in F was more complete after the second Cp, with little change between the interim and post-Cp communities. In contrast, the microbiota of D made essentially a complete recovery from the first Cp but stabilized in a state distinct from the initial composition after the second Cp. The stability of community composition over 2 mo in all three subjects before Cp exposure offered no clue as to the different degrees of resilience in the microbiota of the subjects after Cp exposure. However, the existence of sudden regimen shifts in ecosystems, sometimes triggered by perturbations, is a familiar ecological phenomenon, and the return of external conditions to their former state may not reverse such changes in community composition (Scheffer and Carpenter, 2003). Repeated perturbations may be particularly likely to cause such shifts, even when the community seems to have recovered from the initial perturbation (Paine et al., 1998).
One potential ramification of the altered community is an enhanced carriage of antibiotic-resistance genes in the human population (Salyers et al., 2004). The responses to Cp that we observed are likely to have included both direct effects because of intrinsic or acquired resistance of strains to Cp and indirect effects mediated through numerous ecological interactions among microbial populations (Flint et al., 2007). Although 16S rRNA surveys cannot track the spread of antibiotic resistance, the persistence of some changes in communitycomposition that occurred at the time of Cp may mean that the proportion of resistant strains was increased. The proportion of cfu that were able to grow in the presence of 1 or 10 µg/mL Cp increased with Cp treatment, although the total number of cfu per mass of stool decreased in five of six cases for these three subjects. A higher proportion of Cp-resistant strains in the community is one possible explanation for an increased lag time between initiating Cp and community perturbation for the second Cp course in subjects D and F.
The functional consequences of the alterations that we observed in the composition of the gut microbiota are unclear. It seems likely that the ability of the community to ferment substrates in the colon was grossly unchanged, not only because of the absence of antibiotic-associated diarrhea (an osmotic effect after reduced colonic fermentation and thus, lower concentrations of short-chain fatty acids) (Beaugerie and Petit, 2004) but also because the presence of an unused fermentable substrate in the c olon is likely to stimulate the growth of strains that can use it. If the substrate is sufficiently abundant to attain a high concentration in the colon, there are likely to be many such strains. With respect to the use of growth substrates, competition among microbes is likely to ensure a rapid return to an efficient microbiota (Dethlefsen et al., 2007; Ley et al., 2006) if the collective ability of the microbiota to use the available resources is ever diminished in the first place.
Other traits attributed to members of the gut microbiota, however, such as inhibiting the growth (Servin, 2004), attachment (Ingrassia et al., 2005), or virulence (Medellin-Peña et al., 2007) of particular pathogens, helping to regulate
host immunity (Flint et al., 2007; Paine et al., 1998; Scheffer and Carpenter, 2003) or energy balance (Servin, 2004), or participating with host enzymes in cometabolism of specific substances (Li et al., 2008; Ridlon et al., 2006), may be restricted to a small subset of the community. Unlike carbon use, these traits are not essential to the microbes; variation in the trait between close relatives is predicted by evolutionary theory (Velicer, 2003; West et al., 2006) and observed in practice (Peña et al., 2004; Reid and Bruce, 2006; Servin, 2004). If a trait is beneficial to the community as a whole (e.g., by keeping the host healthy), community-level selection acting over host generations can favor the mutualistic trait in the long term (Foster and Wenseleers, 2006; Sachs et al., 2004). However, if expression of the trait incurs some cost for the microbe, cheater phenotypes lacking the trait will have a fitness advantage over altruist phenotypes within a host generation (Velicer, 2003). If a cheater occupies the former niche of a mutualist that has been eliminated by an antibiotic, host health is diminished. Every course of antibiotics may represent another roll of the dice, potentially allowing displacement of a mutualist with a strain that may or may not provide the same benefit. Although it is possible for a mutualist to replace a cheater, the dice are loaded in the opposite direction for altruistic traits that impose a cost on the bearer. Furthermore, to the extent that antibiotic treatment weakens the fidelity of the association between lineages of microbes and hosts across generations, it weakens community-level selection for mutualistic traits in the microbiota by eliminating some strains that were inherited from kin and allowing outside strains to enter the community (Foster and Wenseleers, 2006; Sachs et al., 2004).
The use of broad-spectrum antibiotics to treat acute infectious disease will undoubtedly continue because of immediate, undeniable benefits for human health. Nonetheless, the imminent and well-publicized threat of losing those benefits because of the spread of antibiotic-resistant microbes has led to constraints on antibiotic use. Even if the success of such resistance-control strategies could be assured, however, there would remain a less obvious but perhaps more important risk to antibiotic use. The antimicrobial agents that we deploy against pathogens also disrupt coevolved microbial communities that are integral to human health. Fortunately, our native microbiota can display considerable resilience as well as functional redundancy for at least some processes. However, because we have only a limited understanding of the ecosystem services provided to us by our resident microbiota, caution and additional research are warranted.
Materials and Methods
Participants and Sampling
Healthy adult participants were recruited from Stanford and the surrounding community; exclusion criteria included antibiotics within the previous 12 mo, past reactions to fluoroquinolone antibiotics, pregnancy or nursing, and age
under 18. Written informed consent was obtained; the study was approved by the Stanford University Institutional Review Board. Participants provided stool samples over ~10 mo at frequencies varying from daily to monthly (Table S1). Daily samples were collected in the weeks before, during, and after each of two 5-d courses of Cp (500 mg orally two times daily), which took place at 2 mo and 8 mo into the 10-mo study. Subjects collected samples in sterile vials, which were frozen immediately in their home freezers (−20 °C), and brought them to the laboratory within several days for storage at −80 °C. Participants were requested to report any symptoms co-occurring with Cp administration, including mild gastrointestinal symptoms; none were reported.
Cultivation
Unfrozen stool samples were collected by participants in tubes containing Cary-Blair medium (Medical Chemical) on six sampling dates: 1 d before, 1 d after, and 4 wk after each Cp course. Samples were transported to the lab and processed within no more than 6 h, most often within 2 h. Subsamples of ~1 g stool (wet weight) were suspended and diluted in neutral Hepes-buffered saline and plated in duplicate at dilutions ranging from 10−3 to 10−7 on trypticase soy agar plates containing 5 g/L glucose and 0, 1, or 10 µg/mL Cp. Plates were incubated aerobically at 37 °C for 5 d, with colonies counted daily. Aerobic conditions were chosen because of the logistical constraints of rapidly transferring samples to anaerobic conditions. The intention was not to characterize the gut microbiota through cultivation but to examine the effect of Cp treatment on a consistent subset of the microbiota defined by the ability to grow under a particular set of conditions.
DNA Extraction, Amplification, and Pyrosequencing
DNA extraction was as described in ref. 11. Briefly, the QIAamp DNA stool mini kit (Qiagen) was used as directed for extraction of bacterial DNA, with the addition of a beadbeating step (FastPrep machine for 45 s at setting 5; Bio 101), which took place in the lysis buffer immediately before the initial incubation at 95 °C. Controls treated identically but lacking fecal material uniformly failed to produce detectable bands after PCR and gel electrophoresis. PCR amplification of a region of the small subunit rRNA (16S rRNA) gene was performed with 50 ng or 5 ng template DNA (Nanodrop) in 50 µL reactions as described (Roche). Fusion primers adapted for the general sequencing kit of the GS FLX Titanium pyrosequencing platform (Roche) comprised of A linker–10-mer barcode–dinucleotide spacer–533–515R reverse primer (proximal primer) or B linker–dinucleotide spacer–8–27F forward primer (distal primer). (Forward and reverse refer to 16S rRNA orientation; sequencing was from the A-linked proximal toward the B-linked distal primer.) Spacers were chosen to match few or no dinucleotides adjacent to the priming site (with reference to public 16S rRNA databases) to
interrupt chance complementarity with the barcode or linker. Primer sequences are listed in Table S4. PCR amplicon libraries were gel purified, quantified using PicoGreen (Invitrogen) in 96-well plates on a Typhoon scanner (GE Healthcare), pooled in equal ratios by mass, and submitted for pyrosequencing.
Data Analysis
Approximately 5 million raw pyrosequencing reads were processed using mothur version 1.7 (Foster and Wenseleers, 2006) to obtain 2.32 million filtered, quality-trimmed reads that were assigned unambiguously to a sample. Unique reads were clustered at a 5% genetic distance threshold using Uclust software (http://www.drive5.com/uclust) with non-default settings resulting in thorough searches for the optimal clusters and cluster seeds provided by a high-quality subset of the Silva 100 reference database (http://www.arb-silva.de/). The database sequences were preclustered so that the 27,231 reference sequences were approximately uniformly spaced at 3% genetic distance in densely sampled regions of bacterial phylogeny. About 0.34 million pyrosequencing reads failing to cluster with a reference sequence at the 5% distance threshold were omitted from the analysis to minimize the effect of pyrosequencing errors (Sachs et al., 2004; Pruesse et al., 2007). Another 0.21 million reads were derived from samples that were not analyzed as part of the time series dataset (control experiments, aberrant replicates, and data from other experiments), leaving 1,760,974 reads in the current dataset (Table A17-1 and Dataset S1). Data-processing parameters are described in greater detail in SI Text.
Reads that clustered with the same reference sequence were defined as refOTUs (Dethlefsen, 2008). An abundance matrix of refOTUs by subject and sample (Dataset S1) and a phylogenetic tree of reference sequences obtained by pruning the Silva 100 reference tree (Pruesse et al., 2007) to the observed cluster seeds were the basis of subsequent analysis. Quantitative Insights Into Microbial Ecology (QIIME) 0.8 (http://qiime.sourceforge.net/) was used to perform rarefactions, calculate α and β diversity measures, and conduct PCoA of unweighted Uni-Frac distances between samples. Calculation of true diversity values as the effective number of taxa (α diversity) and effective number of communities (β diversity) according to Jost (2006, 2007) and simple tests of statistical significance were performed using NeoOffice spreadsheet software. dbRDA (Legendre and Anderson, 1999) was performed using the capscale command of the vegan package (1.15–4) of R statistical software (2.9.1; http://cran.r-project.org).
Acknowlegements
We thank Lisa Bukovnik of the Duke Institute for Genome Science and Policy Sequencing Core Facility for assistance with pyrosequencing, Robert Edgar for making Uclust available and for assistance with its use, members of the
Knight laboratory for assistance with the QIIME pipeline, members of the D.A.R. laboratory for helpful discussion and support, and all of our study participants. This work was funded by the Doris Duke Charitable Trust (D.A.R.) and by a National Institutes of Health Pioneer Award DP1OD000964 (to D.A.R.). D.A.R. is supported by the Thomas C. and Joan M. Merigan Endowment at Stanford University.
References
Beaugerie L, Petit JC (2004) Microbial-gut interactions in health and disease. Antibiotic-associated diarrhoea. Best Pract Res Clin Gastroenterol 18:337–352.
Blaser MJ, Falkow S (2009) What are the consequences of the disappearing human microbiota? Nat Rev Microbiol 7:887–894.
Bunge J, Barger K (2008) Parametric models for estimating the number of classes. Biom J 50:971–982.
Dethlefsen L, Huse S, Sogin ML, Relman DA (2008) The pervasive effects of an antibiotic on the human gut microbiota, as revealed by deep 16S rRNA sequencing. PLoS Biol 6:e280.
Dethlefsen L, McFall-Ngai M, Relman DA (2007) An ecological and evolutionary perspective on human-microbe mutualism and disease. Nature 449:811–818.
Duncan SH, et al. (2006) Proposal of Roseburia faecis sp. nov., Roseburia hominis sp. nov. and Roseburia inulinivorans sp. nov., based on isolates from human faeces. Int J Syst Evol Microbiol 56:2437–2441.
Duncan SH, Hold GL, Barcenilla A, Stewart CS, Flint HJ (2002) Roseburia intestinalis sp. nov., a novel saccharolytic, butyrate-producing bacterium from human faeces. Int J Syst Evol Microbiol 52:1615–1620.
Flint HJ, Duncan SH, Scott KP, Louis P (2007) Interactions and competition within the microbial community of the human colon: Links between diet and health. Environ Microbiol 9:1101–1111.
Flöistrup H, et al. (2006) Allergic disease and sensitization in Steiner school children. J Allergy Clin Immunol 117:59–66.
Foster KR, Wenseleers T (2006) A general model for the evolution of mutualisms. J Evol Biol 19:1283–1293.
Guarner F, et al. (2006) Mechanisms of disease: The hygiene hypothesis revisited. Nat Clin Pract Gastroenterol Hepatol 3:275–284.
Ingrassia I, Leplingard A, Darfeuille-Michaud A (2005) Lactobacillus casei DN-114 001 inhibits the ability of adherent-invasive Escherichia coli isolated from Crohn’s disease patients to adhere to and to invade intestinal epithelial cells. Appl Environ Microbiol 71:2880–2887.
Jost L (2006) Entropy and diversity. Oikos 113:363–375.
Jost L (2007) Partitioning diversity into independent alpha and beta components.Ecology 88: 2427–2439.
Kurokawa K, et al. (2007) Comparative metagenomics revealed commonly enriched gene sets in human gut microbiomes. DNA Res 14:169–181.
Legendre P, Anderson MJ (1999) Distance-based redundancy analysis: Testing multispecies responses in multifactorial ecological experiments. Ecol Monogr 69:1–24.
Ley RE, Peterson DA, Gordon JI (2006) Ecological and evolutionary forces shaping microbial diversity in the human intestine. Cell 124:837–848.
Li M, et al. (2008) Symbiotic gut microbes modulate human metabolic phenotypes. Proc Natl Acad Sci USA 105:2117–2122.
Lozupone C, Hamady M, Knight R (2006) UniFrac—an online tool for comparing microbial community diversity in a phylogenetic context. BMC Bioinformatics 7:371.
Marra F, et al. (2006) Does antibiotic exposure during infancy lead to development of asthma?: A systematic review and metaanalysis. Chest 129:610–618.
Medellin-Peña MJ, Wang H, Johnson R, Anand S, GriffithsMW(2007) Probiotics affect virulence-related gene expression in Escherichia coli O157:H7. Appl Environ Microbiol 73:4259–4267.
Paine RT, Tegner MJ, Johnson EA (1998) Compounded perturbations yield ecological surprises. Ecosystems 1:535–545.
Peña JA, et al. (2004) Genotypic and phenotypic studies of murine intestinal lactobacilli: Species differences in mice with and without colitis. Appl Environ Microbiol 70:558–568.
Pruesse E, et al. (2007) SILVA: A comprehensive online resource for quality checked and aligned ribosomal RNA sequence data compatible with ARB. Nucleic Acids Res 35: 7188–7196.
Reid G, Bruce AW (2006) Probiotics to prevent urinary tract infections: The rationale and evidence. World J Urol 24:28–32.
Ridlon JM, Kang DJ, Hylemon PB (2006) Bile salt biotransformations by human intestinal bacteria. J Lipid Res 47:241–259.
Sachs JL, Mueller UG, Wilcox TP, Bull JJ (2004) The evolution of cooperation. Q Rev Biol 79: 135–160.
Salyers AA, Gupta A, Wang Y (2004) Human intestinal bacteria as reservoirs for antibiotic resistance genes. Trends Microbiol 12:412–416.
Scheffer M, Carpenter SR (2003) Catastrophic regime shifts in ecosystems: Linking theory to observation. Trends Ecol Evol 18:648–656.
Servin AL (2004) Antagonistic activities of lactobacilli and bifidobacteria against microbial pathogens. FEMS Microbiol Rev 28:405–440.
Sommer MO, Dantas G, Church GM (2009) Functional characterization of the antibiotic resistance reservoir in the human microflora. Science 325:1128–1131.
Tap J, et al. (2009) Towards the human intestinal microbiota phylogenetic core. Environ Microbiol 11:2574–2584.
Turnbaugh PJ, et al. (2007) The human microbiome project. Nature 449:804–810.
Turnbaugh PJ, et al. (2009) A core gut microbiome in obese and lean twins. Nature 457:480–484.
Velicer GJ (2003) Social strife in the microbial world. Trends Microbiol 11:330–337. 30.
West SA, Griffin AS, Gardner A, Diggle SP (2006) Social evolution theory for microorganisms. Nat Rev Microbiol 4:597–607.
STUDYING THE ENTERIC MICROBIOME IN INFLAMMATORY BOWEL DISEASES: GETTING THROUGH THE GROWING PAINS AND MOVING FORWARD71
Vincent B. Young,72Stacy A. Kahn,73
Thomas M. Schmidt,74 and Eugene B. Chang75
In this commentary, we will review some of the early efforts aimed at understanding the role of the enteric microbiota in the causality of inflammatory bowel diseases. By examining these studies and drawing on our own experiences bridging clinical gastroenterology and microbial ecology as part of the NIH-funded Human Microbiome Project (Turnbaugh et al., 2007), we hope to help define some of the “growing pains” that have hampered these initial efforts. It is our sincere hope that this discussion will help advance future efforts in this area by identifying current challenges and limitations and by suggesting strategies to overcome these obstacles.
The notion that the indigenous enteric microbiota play an important role in the etiopathogenesis of inflammatory bowel diseases (IBD; Annese et al., 2005) is now well accepted. This realization has prompted a flurry of research activity that is aimed at determining the mechanisms by which changes in the gut microbiota contribute to the development and progression of IBD. Much of this research has been made possible by advances in culture-independent microbial ecology. Microbial ecologists who have been studying complex communities in natural environments such as soil and seawater have leveraged advanced molecular
___________
71 Originally printed as Young VB, Kahn SA, Schmidt TM and Chang EB (2011) Studying the enteric microbiome in inflammatory bowel diseases: getting through the growing pains and moving forward. Front. Microbio. 2:144. doi: 10.3389/fmicb.2011.00144.
72 Department of Medicine, University of Michigan, Ann Arbor, MI, USA.
73 Department of Pediatric Gastroenterology, Hepatology, and Nutrition, University of Chicago, Chicago, IL, USA.
74 Department of Microbiology and Molecular Genetics, Michigan State University, East Lansing, MI, USA.
75 Department of Medicine, Knapp Center for Biomedical Discovery, University of Chicago, Chicago, IL, USA.
Correspondence: Eugene B. Chang, Martin Boyer Professor of Medicine, The University of Chicago, Department of Medicine, Section of Gastroenterology, 900E 57th Street, Room9130, Chicago, IL, USA.
E-mail: echang@medicine.bsd. uchicago.edu
Edited by: Peter J. Turnbaugh, Harvard University, USA
Reviewed by: Alain Stintzi, Ottawa Institute of Systems Biology, Canada Daniel Peterson, University of Nebraska–Lincoln, USA.
Keywords: inflammatory bowel diseases, human enteric microbiome, microbial dysbiosis, microbial ecology, new generation DNA sequencing.
microbiological techniques to profile the structure and dynamics of these microbial consortia. However, the application of these techniques to human-associated microbial communities has not been particularly straightforward. Most clinicians and researchers who study clinically related problems are not familiar with the concepts and techniques employed by microbial ecology. Conversely, most microbial ecologists have not had a great deal of experience interpreting their data in a clinical context, therefore, both sets of investigators need to understand and develop new paradigms. By working together, clinical experts and microbial ecologists can design studies that will leverage their respective expertise and avoid potential pitfalls.
Clinical Considerations in Approaching This Area
IBD is Not a Single Disease
An inflammatory bowel disease is not a single disease, nor is it fully or accurately represented by the commonly used classifications of Crohn’s disease and ulcerative colitis (UC). Crohn’s disease includes a wide range of presentations and can affect any part of the gastrointestinal tract from the mouth to the rectum. Crohn’s disease causes a transmural inflammation that can be associated with structuring, penetrating, and perianal disease. By definition, UC is limited to the colon and is characterized by confluent mucosal inflammation starting at the rectum and extending proximally to various lengths in the colon. The remaining 10–15% of patients are given the diagnosis of “indeterminate colitis,” a classification based on having features of both Crohn’s disease and UC, but also reflecting the ambiguities of clinical descriptors. None of the terms take into account the many types of genetic and pathophysiological processes that can lead to disease having similar clinical phenotypes. Thus, studies aimed at establishing a role of enteral microbial dysbiosis in the etiopathogenesis of“IBD” are not likely to be useful without recognition or consideration of the complexity and heterogeneity of IBD patient populations. The solution must involve designing studies where more homogeneous patient subsets can be defined. Unfortunately, this task remains a difficult as few molecular and genetic markers have emerged that identify a clear disease subset. Thus, the challenge remains in developing better metrics to identify IBD patients that share genetic and/or pathophysiological features. When this is achieved, we can truly begin to understand the relationship of enteric microbiomes to etiopathogenesis and clinical outcomes.
Microbial Dysbiosis in IBD: Cause or Consequence?
Dysbiosis of the intestinal microbiota is commonly found in patients with IBD (Peterson et al., 2008), but in almost all cases, it cannot be determined whether these changes are causal or merely consequences of the activated
immune and inflammatory condition. Typically, large changes in 16S rRNA gene-based profiles are observed at the phylum level. These changes are characterized by blooms of Proteobacteria and decline in Firmicutes and Bacteroidetes (Frank et al., 2007), the latter typically associated with the microbiota of a normal, healthy colon (Eckburg et al., 2005). Similar patterns have been observed in other non-IBD inflammatory states (Lupp et al., 2007; Sekirov et al., 2008) and in experimental colitis (McKenna et al., 2008; Hoffmann et al., 2009; Nagalingam et al., 2011), suggesting that these changes are largely a consequence of the altered immune and inflammatory state. Similarly, studies of healthy and IBD-associated microbial functional metagenomes have shown significant differences (Manichanh et al., 2006). In the final analysis, however, these studies have resulted in the accumulation of large, descriptive datasets that have shed little light on fundamental mechanisms of IBD etiopathogenesis. What is needed are prospective studies, initiated at a time point before the onset of disease in order to capture information on functional and structural characteristics of the enteric microbiome that correlate with eventual development of disease or with maintained health. Unfortunately, these types of studies are difficult to do in IBD, because the means to identify subjects at risk do not yet exist. Moreover, long term, population-based studies that include microbiome analysis are impractical and cost-prohibitive. Nevertheless, a few opportunities exist for longitudinal studies of the enteric microbiome in IBD risk, particularly when the study questions and types of test subjects can be more precisely defined. As one example, the development of pouchitis in patients with UC is a condition where the incidence of disease is high and predictable (Hurst et al., 1996; Ferrante et al., 2008). Pouchitis is an inflammatory complication of the surgically created ileal pouch that serves as a pseudo-rectal vault in patients with UC who have undergone total colectomy. The condition is unique to UC, as it is rarely seen in patients with familial adenomatous polyposis (FAP) who undergo the same surgical procedure (Salemans et al., 1992). The study of pouchitis offers several advantages: (1) a clear “time-zero” can be defined when all patients are absent of disease and off medications, (2) each patient serves as his/her own control, (3) sampling of both luminal and mucosa-associated pouch microbiota is feasible, eliminating potential confounders such as the need for lavage preparation, and (4) the analysis of microbiome and host responses can be easily correlated with clinical outcomes.
Confounding Variables Associated with Clinical Research
Very few studies to date that have examined the relationship between IBD and intestinal microbial dysbiosis have taken into account confounding variables such as age of onset, disease duration, patient age, gender, life style, smoking history, ethnic background, diet, environmental exposures, surgical history, and medications. Each of these factors may be important in IBD patients and can
independently impact host biology and enteric microbiota, directly or indirectly. Conclusions drawn from data analysis in absence of careful multivariate analysis or patient stratification can be misleading and lead to both type I and type II errors. As one example, dietary modifications are common in the management or clinical course of IBD patients. Dietary components such as fat and carbohydrates have also been shown to have dramatic effects on the enteric microbiota in animal models (Hildebrandt et al., 2009; Turnbaugh et al., 2009). Since the diets of patients in remission versus those that have active disease are likely to be quite different, this introduces a variable that confounds interpretation of data aimed at defining a causal relationship between changes in enteric microbiota and disease activity. Few studies have taken into consideration the types of medications patients may be taking. IBD patients take a number of medications which are aimed at altering the immune response and promoting intestinal healing. Although no data exists to indicate how the various classes of medications impact the intestinal microbiome in IBD, preliminary data from animal models suggest that medications may have a dramatic and sustained impact (Croswell et al., 2009; Hill et al., 2010; Manichanh et al., 2010; Robinson and Young, 2010). The nature of these confounding variables are perhaps more significant in complex immune-based disorders and challenge our ability to design studies that can yield unambiguous results. They underscore the importance of a team effort that involves clinician investigators, microbial ecologists, and biostatisticians in the design of microbiome-IBD studies in compiling, reviewing, and analyzing these important patient factors.
Technical Nuances and Challenges of Microbiome Research Related to IBD
Researchers who are considering embarking on studies of the microbiome in IBD need to consider numerous factors before initiating their studies. The planning and design phase are essential and arguably the most critical aspects of any research endeavor. The explosion of microbiome-based technologies provides numerous research opportunities and emphasizes the need for collaboration between clinical researcher and microbiologist, particularly in the early stages of study development.
These considerations can be divided into two main categories. The first involves the clinical (e.g., patient-oriented) aspects of the research. The second major category involves consideration of the technical aspects of microbiome research. Although most researchers who study clinical aspects of IBD might consider the latter category to be of prime importance, it is critical to realize that the nature of microbiome research requires re-evaluation of the patient-oriented components of IBD research.
Clinical Considerations (Sampling, Replicates, etc.)
Microbiome research involves characterizing complex microbial communities that inhabit a particular ecological niche. A major concern with regards to this question is exactly what samples should be studied. Current evidence suggests that in a genetically susceptible individual, IBD results from an abnormal interaction between the indigenous microbiota and the host epithelium/immune system (Sartor, 2008; Round and Mazmanian, 2009; Garrett et al., 2010). As such, consideration has to be given as to whether it is appropriate to sample luminal contents versus the microbes that are associated with the mucosa. It has been proposed that examination of fecal material is an appropriate surrogate for all of the microbial communities that are upstream of the rectum. In this manner, stool can be considered to be the “summary statement” of the entire gastrointestinal (GI) tract. However, while many of the organisms that inhabit the GI tract can be detected in feces, the relative abundance of these organisms in fecal material is likely to be quite different from that found either luminally or mucosal-associated in more proximal sections of the GI tract. Since the relative abundance of microbes in a community is important to the actual function of that community, stool may not be the most appropriate analyte for microbiota research in all types of IBD (Lepage et al., 2005). For example in patients with ileal Crohn’s disease, analysis of fecal material is likely to be a poor surrogate for the microbial community found in the terminal ileum.
Given the realization that fecal material may not be the most suitable sample for assessing microbial communities associated with IBD, despite the ease of obtaining this material and its relative abundance, many microbiome studies related to IBD utilize material retrieved via endoscopy. With regards to endoscopically harvested material, it should be noted that there is also an axial variation in the microbiota. Studies have demonstrated that the intestinal microbiota have both a structural and spatial organization that may be altered in patients with IBD and vary with disease activity (Swidsinski et al., 2002; Hu et al., 2010; Wang et al., 2010a,b). In addition to the axial variation, the variation in communities along the GI tract, coupled with the known regional variation in IBD from region to region, makes it important to take these variables into consideration when designing studies. A comprehensive experimental design might therefore involve sampling from both mucosal and luminal communities.
Another important consideration arises when obtaining samples via endoscopy; the standard bowel preparation regimens can have a significant impact on the gut microbiome. The washout of luminal intestinal contents can skew or abolish both the longitudinal and axial gradients that are normally present within the GI tract (Wang et al., 2010a,b) and thus affect the entire gut microbial community. Although bowel preparation is required for standard diagnostic and interventional endoscopic procedures, its routine use may adversely affect research endoscopies performed to understand the role of the indigenous microbiota in IBD. Even local endoscopic washes prior to sample collection could alter the community structure
of the associated microbes and should be avoided or taken into consideration when interpreting findings. Furthermore, the exact sampling technique needs to be considered. Biopsies are commonly used, but cause local trauma (which may affect subsequent longitudinal samples) and survey a limited area. Brushings can be used, but it needs to be established whether these two techniques yield similar samples. Regardless of what types of specimens are obtained, investigators should carefully follow established protocols for collection, handling, and storage of samples. Inconsistencies in these steps may dramatically alter microbial communities thereby decreasing the reliability and accuracy of the results.
In addition to these considerations regarding sample acquisition from an individual patient, there are multiple considerations relating to overall planning and establishing a study population. It is becoming abundantly clear that although certain features of the gut microbiome are encountered in many normal individuals, there is also considerable person-to-person variation (Costello et al., 2009; Benson et al., 2010; Willing et al., 2010; Walker et al., 2011). As such, considerations related to replication, study size, and selection of controls related to microbiome research require significant attention. The analytic methods related to processing microbiome data involve statistical methods that previously were not commonly applied to biomedical research (see below). Therefore, the standard power analyses that are applied to clinical research are not always easily translated to microbiome study design. Given that this field is in its infancy, there is no consensus yet on which statistical methods and power analyses are most appropriate. However, given the ongoing work in this area, clarification of which statistical methodology to use is forthcoming. In addition, because many early microbiome studies have been aimed at finding associations between aspects of the microbiome and health or disease, these studies have been “hypothesis generating”; once they are completed, appropriately powered confirmatory studies can be designed.
Experimental replication also requires significant consideration (Prosser, 2010). Replication can be in the form of multiple samples from the same region from a given individual at a specific time, longitudinal sampling from an individual patient, or obtaining samples from multiple individuals stratified by specific clinical criteria. Each form of replication may be important depending on the actual clinical question posed. Selection of appropriate controls can also be problematic given the inherent individual variation in microbiome structure. Comparative studies of the microbiome in IBD have used “healthy” controls that included patients with irritable bowel syndrome (IBS), diverticulosis, acute self-limited colitis, and a variety of other gastrointestinal conditions. Clearly many of these controls may also have perturbations in their microbiome, which must be accounted for in the data analysis and interpretation of results. In some cases, patients might be able to serve as their own controls, which will be useful for understanding how the microbiota changes correlate with the course of disease. With such a study design the status of the microbiome within a given patient prior to a particular intervention, for example treatment with a biologic agent or
antibiotics or surgery, could serve as the controls for subsequent samplings that were done in a longitudinal manner.
Finally, although study of human patients is a necessary component of IBD research, there is a distinct utility for using animal models of disease (Wirtz and Neurath, 2007). Animal models, including the wide variety of murine models of IBD, can be used in conjunction with human clinical and translations studies to address questions mechanism and causality in IBD pathogenesis. Specific hypotheses that arise from observations in human patients can be directly tested in appropriate animal models. The same considerations with regards to sampling need to be applied to animal model studies, especially to provide comparability with observations made in patients.
Analysis of the Microbiome: Where to Begin?
For investigators who have not conducted or even considered performing microbiome research the variety of analytic methods that are available can appear daunting (Robinson et al., 2010). Many of the culture-independent methods for studying microbial ecology have benefited from the advances in next-generation sequencing platforms (Andersson et al., 2008; Huse et al., 2008). Additionally advances in mass spectroscopy and other means for large-scale analysis of complex mixtures of proteins and metabolites have been applied for microbiome research in order to try and make sense of which methods might be appropriate for specific biomedical questions. Investigators can start by understanding what types of questions each specific method is best suited to address. One way to consider the suite of methods for microbiome analysis available is to divide them into groups based on the specific types of information they provide about a given microbial community. There are several useful reviews that describe the available technologies (Zoetendal et al., 2008; Simon and Daniel, 2011). The first type of information available is information about the structure of a specific consortium of microbes. This can be thought of as a census of microbes both in terms of the number of different types of microbes and their relative abundance. The next type of information goes beyond community structure and provides a cataloging of functional capacity of the entire community. The final type of information that can be gained by certain analytic methods gives information regarding the in situ activity of the given microbial community. We will discuss each of these platforms in more detail as well as describe in general terms specific analytic methods that can provide each of these types of data.
16S Sequence Retrieval: Choosing the Appropriate Platform
Landmark ideas and research from Woese et al. (1990) and Pace (2009) established a common metric for identifying microbes—the nucleotide sequence of the small subunit (SSU) ribosomal RNA. The gene encoding the SSU rRNA has a sedimentation coefficient of 16S which is unique to bacteria and archaea
and allows distinction from the SSU rRNA from human eukaryotic cells. Initially, SSU sequences were obtained by amplification and sequencing of SSU genes from complex microbial communities and then compared to databases containing more than 2 million aligned rRNA gene sequences (DeSantis et al., 2006; Pruesse et al., 2007; Cole et al., 2009) to provide a census of microbes in each sample. More recently, the application of “next-generation” sequencing platforms has increased the number of sequences that can be obtained, as well as lowering the cost of analysis (Sogin et al., 2006; Huse et al., 2008).
Analysis of the data obtained by SSU sequence analysis continues to evolve, but two general approaches are used to bin or classify the sequences into microbial populations. Sequences can be compared to reference taxonomic outlines and binned based on similarity to references sequences (“phylotyping”) or the sequences can be assigned to operation taxonomic units (OTUs) based on similarity to other sequences within a given dataset. There are relative advantages and disadvantages of each method (seeSchloss and Westcott, 2011 for a discussion). It should be noted however, that the desire to “name” a given community member based on SSU analysis can be complicated by the fact that most existing taxonomies for bacteria are based solely on cultured organisms.
The number of sequences required to assess microbial communities depends both on the questions being asked as well as the spatial and temporal variability in a community. Deeper sequencing will uncover less common members of a community, which may be necessary to enumerate a particular pathogen, but shifts in overall community structure can be detected identified with many fewer sequences (Young and Schmidt, 2004; Antonopoulos et al., 2009). A critical factor in determining the depth of sequencing required to address a question is to assess variability within replicate samples and determine if the variability is less than that found in treatment level comparisons. Pilot studies with either clone libraries or high-throughput sequencing methods are essential to identify the degree of variability and will establish the extent of sequencing required in a full-scale experimental design.
The next step is to consider how the structure of the microbial community might relate to its function. 16S sequences on their own do not provide specific functional information. However, if there is a genome sequence available corresponding to a bacterium with a given 16S with a known function, it may be possible to infer the functional capacity. It should be noted that inference of the metabolic potential of an organism based on its SSU rRNA gene sequences may also be complicated by the lateral transfer of genes between microbes.
Looking at the “Big Picture”: Metagenomes, Metatranscriptomes, and in situ Analysis
Rather than inferring metabolic potential from 16S rRNA gene sequences, the genetic diversity of the microbiome can be accessed directly through shotgun
metagenomes (Handelsman, 2004; Riesenfeld et al., 2004; Streit and Schmitz, 2004; Gill et al., 2006). In this approach, DNA extracted from a sample of the microbiome is sequenced directly, rather than following amplification of a specific gene (e.g., 16S rRNA). The absence of a specific amplification step to recover microbial genes often means that suitable amounts of DNA from microbial communities are difficult to obtain, particularly without interference from host DNA. Physical methods for separating microbial communities from host tissue, including the user of lasers to remove attached microbes from epithelial cells in the GI tract (Wang et al., 2010a), can be effective, but typically provides insufficient DNA for direct sequencing. Fortunately, there are approaches for whole genome amplification that can be employed to produce sufficient DNA for metagenomic sequencing (Binga et al., 2008). Understanding the biases and variability introduced by each of these steps is essential for a meaningful analysis of the resulting sequences.
When sequences derived from metagenomes are compared to previously characterized genes, using platforms such as MG-RAST (Glass et al., 2010), a picture of the metabolic potential of a community emerges. Millions of sequences from shotgun metagenomes from the human GI tract (Qin et al., 2010) have been generated in an effort to identify those that are consistent with health and various disease states. It has been suggested that while the taxonomic structure of microbiomes can fluctuate considerably, the composition of metabolic genes remains consistent (Turnbaugh et al., 2009). The definition of OTUs for both rRNA genes and protein-encoding genes will certainly influence this interpretation of the data: defining the appropriate level of resolution in sequence analysis is central to future analysis of microbiome sequences.
A logical extension of the metabolic potential suggested by community metagenomic sequencing is insight into the actual activity of a community gained through metatranscriptomic sequencing (Gilbert and Hughes, 2011; Gosalbes et al., 2011). In this case, total RNA is isolated and structural RNAs removed to enrich for mRNA, which is then reverse transcribed into cDNA for sequence analysis. Rather than just revealing the potential activity, this will indicate which of the potential metabolic pathways are actually being used on the basis of their transcription within the community. To move even closer to actual function, metaproteomics employs high-throughput, high-resolution mass spectroscopy to determine which proteins are actually present in a given community (Verberkmoes et al., 2009). This approach generally requires some knowledge of the coding potential of a community in order to make predictions about potential proteins based in mass/charge ratios, and thus is often combined with metagenomic sequencing. A final approach used to assess in situ function, often via mass spectroscopy, is to measure the complement of metabolites (e.g., short chain fatty acids, lipids, small molecules) associated with a community. This so-called metabolomics or metabonomics approach assesses function based on the presence of metabolites,
many of which will be produced by specific members of the community (Martin et al., 2007; Kinross et al., 2011).
The three dimensional structure of microbial communities in the GI tract, particularly those in close proximity to epithelial cells may also provide useful information about the function of the community, including cell–cell interactions among microbes and between microbes and their host. Extraction and purification of DNA for microbiome analysis obliterates the architecture of microbial communities, but fortunately the sequence data gathered as part of a SSU microbial census can be used to design fluorescently labeled probes that permit visualization of the structural organization of microbes in preserved samples. The recent application of combinatorial labeling of probes and spectral imaging (Valm et al., 2011) offers the potential to visualize dozens of microbes in a community and holds considerable promise for microbiome studies.
Selecting the Appropriate Methodology; An Argument for the Team Approach
With this immense armamentarium of tools for microbiome analysis, the decision as to which method to employ must return to the most basic considerations, namely, what is the scientific and/or clinical question(s) to be addressed? In some cases, associations with disease based on 16S sequence retrieval are an appropriate first step, in an exercise as we discussed earlier that can be thought of as being hypothesis generating. However, in order to specifically test a given hypothesis or to monitor the physiologic effects of specific microbiome alterations, functional assessments via metagenomics or metabolomics might be more appropriate. To help in such decision making, a “team science” approach is often necessary, bringing together clinicians with expertise in IBD with microbial ecologists, bioinformatics specialists, statisticians, and microbial physiologists. As demonstrated by the NIH Human Microbiome Project (HMP) and the European MetaHIT projects, collaborative teams of scientists from a broad range of disciplines working together to address questions of the microbiome in health and disease are an important and effective approach. Similarly, the study of IBD using a “systems science,” with interdisciplinary teams and expertise will be essential for discovering the etiopathogenesis of these diseases, novel therapies, and potentially a cure.
Summary
We propose that collaboration between microbial ecologists and clinician investigators is critical and should be considered an essential component for translational studies of the role of the microbiome in IBD. We caution against overzealous claims about the significance of the findings based on our current evidence. Existing descriptive studies should be used to generate hypotheses and help us move toward mechanistic studies that will truly help us discover the
causes and potential cures for IBD and other gastrointestinal diseases. As our molecular techniques for evaluating the microbiome evolve and become more refined, the field needs to move beyond the descriptive studies which constitute the current state of microbiome-IBD research and toward mechanistic studies that will fundamentally improve and expand our understanding of IBD.
Conflict of Interest Statement
The authors declare that the research was conducted in the absence of any commercial or financial relationships that could be construed as a potential conflict of interest.
References
Andersson, A. F., Lindberg, M., Jakobsson, H., Backhed, F., Nyren, P., and Engstrand, L. (2008). Comparative analysis of human gut microbiota by barcoded pyrosequencing. PLoS ONE 3, e2836.
Annese, V., Lombardi, G., Perri, F., D’Inca, R., Ardizzone, S., Riegler, G., Giaccari, S., Vecchi, M., Castiglione, F., Gionchetti, P., Cocchiara, E., Vigneri, S., Latiano, A., Palmieri, O., and Andriulli, A. (2005). Variants of CARD15 are associated with an aggressive clinical course of Crohn’s disease–an IG-IBD study. Am. J. Gastroenterol. 100, 84–92.
Antonopoulos, D. A., Huse, S. M., Morrison, H. G., Schmidt, T. M., Sogin, M. L., and Young, V. B. (2009). Reproducible community dynamics of the gastrointestinal microbiota following antibiotic perturbation. Infect. Immun. 77, 2367–2375.
Benson, A. K., Kelly, S. A., Legge, R., Ma, F., Low, S. J., Kim, J., Zhang, M., Oh, P. L., Nehrenberg, D., Hua, K., Kachman, S. D., Moriyama, E. N., Walter, J., Peterson, D. A., and Pomp, D. (2010). Individuality in gut microbiota composition is a complex polygenic trait shaped by multiple environmental and host genetic factors. Proc. Natl. Acad. Sci. U.S.A. 107, 18933–18938.
Binga, E. K., Lasken, R. S., and Neufeld, J. D. (2008). Something from (almost) nothing: the impact of multiple displacement amplification on microbial ecology. ISME J. 2, 233–241.
Cole, J. R., Wang, Q., Cardenas, E., Fish, J., Chai, B., Farris, R. J., Kulam-Syed-Mohideen, A. S., Mcgarrell, D. M., Marsh, T., Garrity, G. M., and Tiedje, J. M. (2009). The Ribosomal Database Project: improved alignments and new tools for rRNA analysis. Nucleic Acids Res. 37, D141–D145.
Costello, E. K., Lauber, C. L., Hamady, M., Fierer, N., Gordon, J. I., and Knight, R. (2009). Bacterial community variation in human body habitats across space and time. Science 326, 1694–1697.
Croswell, A., Amir, E., Teggatz, P., Barman, M., and Salzman, N. H. (2009). Prolonged impact of antibiotics on intestinal microbial ecology and susceptibility to enteric Salmonella infection. Infect. Immun. 77, 2741–2753.
DeSantis, T. Z., Hugenholtz, P., Larsen, N., Rojas, M., Brodie, E. L., Keller, K., Huber, T., Dalevi, D., Hu, P., and Andersen, G. L. (2006). Greengenes, a chimera-checked 16S rRNA gene database and workbench compatible with ARB. Appl. Environ. Microbiol. 72, 5069–5072.
Eckburg, P. B., Bik, E. M., Bernstein, C. N., Purdom, E., Dethlefsen, L., Sargent, M., Gill, S. R., Nelson, K. E., and Relman, D. A. (2005). Diversity of the human intestinal microbial flora. Science 308, 1635–1638.
Ferrante, M., Declerck, S., De Hertogh, G., Van Assche, G., Geboes, K., Rutgeerts, P., Penninckx, F., Vermeire, S., and D’Hoore, A. (2008). Outcome after proctocolectomy with ileal pouch-anal anastomosis for ulcerative colitis. Inflamm. Bowel Dis. 14, 20–28.
Frank, D. N., St Amand, A. L., Feldman, R. A., Boedeker, E. C., Harpaz, N., and Pace, N. R. (2007). Molecular-phylogenetic characterization of microbial community imbalances in human inflammatory bowel diseases. Proc. Natl. Acad. Sci. U.S.A. 104, 13780–13785.
Garrett, W. S., Gordon, J. I., and Glimcher, L. H. (2010). Homeostasis and inflammation in the intestine. Cell 140, 859–870.
Gilbert, J. A., and Hughes, M. (2011). Gene expression profiling: metatranscriptomics. Methods Mol. Biol. 733, 195–205.
Gill, S. R., Pop, M., Deboy, R. T., Eckburg, P. B., Turnbaugh, P. J., Samuel, B. S., Gordon, J. I., Relman, D. A., Fraser-Liggett, C. M., and Nelson, K. E. (2006). Metagenomic analysis of the human distal gut microbiome. Science 312, 1355–1359.
Glass, E. M., Wilkening, J., Wilke, A., Antonopoulos, D., and Meyer, F. (2010). Using the metagenomics RAST server (MG-RAST) for analyzing shotgun metagenomes. Cold Spring Harb. Protoc. 2010, pdb.prot5368.
Gosalbes, M. J., Durban, A., Pignatelli, M., Abellan, J. J., Jimenez-Hernandez, N., Perez-Cobas, A. E., Latorre, A., and Moya, A. (2011). Metatranscriptomic approach to analyze the functional human gut microbiota. PLoS ONE 6, e17447.
Handelsman, J. (2004). Metagenomics: application of genomics to uncultured microorganisms. Microbiol. Mol. Biol. Rev. 68, 669–685.
Hildebrandt, M. A., Hoffmann, C., Sherrill-Mix, S. A., Keilbaugh, S. A., Hamady, M., Chen, Y.-Y., Knight, R., Ahima, R. S., Bushman, F., and Wu, G. D. (2009). High-fat diet determines the composition of the murine gut microbiome independently of obesity. Gastroenterology 137, 1716–1724.e1–2.
Hill, D. A., Hoffmann, C., Abt, M. C., Du, Y., Kobuley, D., Kirn, T. J., Bushman, F. D., and Artis, D. (2010). Metagenomic analyses reveal antibiotic-induced temporal and spatial changes in intestinal microbiota with associated alterations in immune cell homeostasis. Mucosal Immunol. 3, 148–158.
Hoffmann, C., Hill, D. A., Minkah, N., Kirn, T., Troy, A., Artis, D., and Bushman, F. (2009). Community-wide response of the gut microbiota to enteropathogenic Citrobacter rodentium infection revealed by deep sequencing. Infect. Immun. 77, 4668–4678.
Hu, S., Wang, Y., Lichtenstein, L., Tao, Y., Musch, M. W., Jabri, B., Antonopoulos, D., Claud, E. C., and Chang, E. B. (2010). Regional differences in colonic mucosa-associated microbiota determine the physiological expression of host heat shock proteins. Am. J. Physiol. Gastrointest. Liver Physiol. 299, G1266–G1275.
Hurst, R. D., Molinari, M., Chung, T. P., Rubin, M., and Michelassi, F. (1996). Prospective study of the incidence, timing, and treatment of pouchitis in 104 consecutive patients after restorative proctocolectomy. Arch. Surg. 131, 497–502.
Huse, S. M., Dethlefsen, L., Huber, J. A., Welch, D. M., Relman, D. A., and Sogin, M. L. (2008). Exploring microbial diversity and taxonomy using SSU rRNA hypervariable tag sequencing. PLoS Genet. 4, e1000255.
Kinross, J. M., Darzi, A. W., and Nicholson, J. K. (2011). Gut microbiome-host interactions in health and disease. Genome Med. 3, 14.
Lepage, P., Seksik, P., Sutren, M., De La Cochetiere, M. F., Jian, R., Marteau, P., and Dore, J. (2005). Biodiversity of the mucosa-associated microbiota is stable along the distal digestive tract in healthy individuals and patients with IBD. Inflamm. Bowel Dis. 11, 473–480.
Lupp, C., Robertson, M. L., Wickham, M. E., Sekirov, I., Champion, O. L., Gaynor, E. C., and Finlay, B. B. (2007). Host-mediated inflammation disrupts the intestinal microbiota and promotes the overgrowth of Enterobacteriaceae. Cell Host Microbe 2, 119–129.
Manichanh, C., Reeder, J., Gibert, P., Varela, E., Llopis, M., Antolin, M., Guigo, R., Knight, R., and Guarner, F. (2010). Reshaping the gut microbiome with bacterial transplantation and antibiotic intake. Genome Res. 20, 1411–1419.
Manichanh, C., Rigottier-Gois, L., Bonnaud, E., Gloux, K., Pelletier, E., Frangeul, L., Nalin, R., Jarrin, C., Chardon, P., Marteau, P., Roca, J., and Dore, J. (2006). Reduced diversity of faecal microbiota in Crohn’s disease revealed by a metagenomic approach. Gut 55, 205–211.
Martin, F. P., Dumas, M. E., Wang, Y., Legido-Quigley, C., Yap, I. K., Tang, H., Zirah, S., Murphy, G. M., Cloarec, O., Lindon, J. C., Sprenger, N., Fay, L. B., Kochhar, S., Van Bladeren, P., Holmes, E., and Nicholson, J. K. (2007). A top-down systems biology view of microbiome-mammalian metabolic interactions in a mouse model. Mol. Syst. Biol. 3, 112.
McKenna, P., Hoffmann, C., Minkah, N., Aye, P. P., Lackner, A., Liu, Z., Lozupone, C. A., Hamady, M., Knight, R., and Bushman, F. D. (2008). The macaque gut microbiome in health, lentiviral infection, and chronic enterocolitis. PLoS Pathog. 4, e20.
Nagalingam, N. A., Kao, J. Y., and Young, V. B. (2011). Microbial ecology of the murine gut associated with the development of dextran sodium sulfate-induced colitis. Inflamm. Bowel Dis. 17, 917–926.
Pace, N. R. (2009). Mapping the tree of life: progress and prospects. Microbiol. Mol. Biol. Rev. 73, 565–576.
Peterson, D. A., Frank, D. N., Pace, N. R., and Gordon, J. I. (2008). Metagenomic approaches for defining the pathogenesis of inflammatory bowel diseases. Cell Host Microbe 3, 417–427.
Prosser, J. I. (2010). Replicate or lie. Environ. Microbiol. 12, 1806–1810.
Pruesse, E., Quast, C., Knittel, K., Fuchs, B. M., Ludwig, W., Peplies, J., and Glöckner, F. O. (2007). SILVA: a comprehensive online resource for quality checked and aligned ribosomal RNA sequence data compatible with ARB. Nucleic Acids Res. 35, 7188–7196.
Qin, J., Li, R., Raes, J., Arumugam, M., Burgdorf, K. S., Manichanh, C., Nielsen, T., Pons, N., Levenez, F., Yamada, T., Mende, D. R., Li, J., Xu, J., Li, S., Li, D., Cao, J., Wang, B., Liang, H., Zheng, H., Xie, Y., Tap, J., Lepage, P., Bertalan, M., Batto, J.-M., Hansen, T., Le Paslier, D., Linneberg, A., Nielsen, H. B., Pelletier, E., Renault, P., Sicheritz-Ponten, T., Turner, K., Zhu, H., Yu, C., Li, S., Jian, M., Zhou, Y., Li, Y., Zhang, X., Li, S., Qin, N., Yang, H., Wang, J., Brunak, S., Dore, J., Guarner, F., Kristiansen, K., Pedersen, O., Parkhill, J., Weissenbach, J., Bork, P., Ehrlich, S. D., and Wang, J. (2010). A human gut microbial gene catalogue established by metagenomic sequencing. Nature 464, 59–65.
Riesenfeld, C. S., Schloss, P. D., and Handelsman, J. (2004). Metagenomics: genomic analysis of microbial communities. Annu. Rev. Genet. 38, 525–552.
Robinson, C. J., Bohannan, B. J., and Young, V. B. (2010). From structure to function: the ecology of host-associated microbial communities. Microbiol. Mol. Biol. Rev. 74, 453–476.
Robinson, C. J., and Young, V. B. (2010). Antibiotic administration alters the community structure of the gastrointestinal microbiota. Gut Microbes 1, 279–284.
Round, J. L., and Mazmanian, S. K. (2009). The gut microbiota shapes intestinal immune responses during health and disease. Nat. Rev. Immunol. 9, 313–323.
Salemans, J. M. J. I., Nagengast, F. M., Lubbers, E. J. C., and Kuijpers, J. H. (1992). Postoperative and long-term results of ileal pouch-anal anastomosis for ulcerative colitis and familial polyposis coli. Dig. Dis. Sci. 37, 1882–1889.
Sartor, R. B. (2008). Microbial influences in inflammatory bowel diseases. Gastroenterology 134, 577–594.
Schloss, P. D., and Westcott, S. L. (2011). Assessing and improving methods used in operational taxonomic unit-based approaches for 16S rRNA gene sequence analysis. Appl. Environ. Microbiol. 77, 3219–3226.
Sekirov, I., Tam, N. M., Jogova, M., Robertson, M. L., Li, Y., Lupp, C., and Finlay, B. B. (2008). Antibiotic-induced perturbations of the intestinal microbiota alter host susceptibility to enteric infection. Infect. Immun. 76, 4726–4736.
Simon, C., and Daniel, R. (2011). Metagenomic analyses: past and future trends. Appl. Environ. Microbiol. 77, 1153–1161.
Sogin, M. L., Morrison, H. G., Huber, J. A., Welch, D. M., Huse, S. M., Neal, P. R., Arrieta, J. M., and Herndl, G. J. (2006). Microbial diversity in the deep sea and the underexplored “rare biosphere”. Proc. Natl. Acad. Sci. U.S.A. 103, 12115–12120.
Streit, W. R., and Schmitz, R. A. (2004). Metagenomics – the key to the uncultured microbes. Curr. Opin. Microbiol. 7, 492–498.
Swidsinski, A., Ladhoff, A., Pernthaler, A., Swidsinski, S., Loening-Baucke, V., Ortner, M., Weber, J., Hoffmann, U., Schreiber, S., Dietel, M., and Lochs, H. (2002). Mucosal flora in inflammatory bowel disease. Gastroenterology 122, 44–54.
Turnbaugh, P. J., Ley, R. E., Hamady, M., Fraser-Liggett, C. M., Knight, R., and Gordon, J. I. (2007). The human microbiome project. Nature 449, 804–810.
Turnbaugh, P. J., Ridaura, V. K., Faith, J. J., Rey, F. E., Knight, R., and Gordon, J. I. (2009). The effect of diet on the human gut microbiome: a metagenomic analysis in humanized gnotobiotic mice. Sci. Transl. Med. 1, 6ra14.
Valm, A. M., Mark Welch, J. L., Rieken, C. W., Hasegawa, Y., Sogin, M. L., Oldenbourg, R., Dewhirst, F. E., and Borisy, G. G. (2011). Systems-level analysis of microbial community organization through combinatorial labeling and spectral imaging. Proc. Natl. Acad. Sci. U.S.A. 108, 4152–4157.
Verberkmoes, N. C., Russell, A. L., Shah, M., Godzik, A., Rosenquist, M., Halfvarson, J., Lefsrud, M. G., Apajalahti, J., Tysk, C., Hettich, R. L., and Jansson, J. K. (2009). Shotgun metaproteomics of the human distal gut microbiota. ISME J. 3, 179–189.
Walker, A. W., Ince, J., Duncan, S. H., Webster, L. M., Holtrop, G., Ze, X., Brown, D., Stares, M. D., Scott, P., Bergerat, A., Louis, P., Mcintosh, F., Johnstone, A. M., Lobley, G. E., Parkhill, J., and Flint, H. J. (2011). Dominant and diet-responsive groups of bacteria within the human colonic microbiota. ISME J. 5, 220–230.
Wang, Y., Antonopoulos, D., Zhu, X., Harrell, L., Hanan, I., Alverdy, J., Meyer, F., Musch, M., Young, V., and Chang, E. (2010a). Laser capture microdissection and metagenomic analysis of intact mucosa-associated microbial communities of human colon. Appl. Microbiol. Biotechnol. 88, 1333–1342.
Wang, Y., Devkota, S., Musch, M. W., Jabri, B., Nagler, C., Antonopoulos, D. A., Chervonsky, A., and Chang, E. B. (2010b). Regional mucosa-associated microbiota determine physiological expression of TLR2 and TLR4 in murine colon. PLoS ONE 5, e13607.
Willing, B. P., Dicksved, J., Halfvarson, J., Andersson, A. F., Lucio, M., Zheng, Z., Jarnerot, G., Tysk, C., Jansson, J. K., and Engstrand, L. (2010). A pyrosequencing study in twins shows that gastrointestinal microbial profiles vary with inflammatory bowel disease phenotypes. Gastroenterology 139, 1844–1854.e1.
Wirtz, S., and Neurath, M. F. (2007). Mouse models of inflammatory bowel disease. Adv. Drug Deliv. Rev. 59, 1073–1083.
Woese, C. R., Kandler, O., and Wheelis, M. L. (1990). Towards a natural system of organisms: proposal for the domains Archaea, Bacteria, and Eucarya. Proc. Natl. Acad. Sci. U.S.A. 87, 4576–4579.
Young, V. B., and Schmidt, T. M. (2004). Antibiotic-associated diarrhea accompanied by large-scale alterations in the composition of the fecal microbiota. J. Clin. Microbiol. 42, 1203–1206.
Zoetendal, E. G., Rajilic-Stojanovic, M., and De Vos, W. M. (2008). High-throughput diversity and functionality analysis of the gastrointestinal tract microbiota. Gut 57, 1605–1615.
INTER-KINGDOM SIGNALLING: COMMUNICATION BETWEEN BACTERIA AND THEIR HOSTS76
David T. Hughes and Vanessa Sperandio77
Abstract
Microorganisms and their hosts communicate with each other through an array of hormonal signals. This cross-kingdom cell-to-cell signalling involves small molecules, such as hormones that are produced by eukaryotes and hormone-like chemicals that are produced by bacteria. Cell-to-cell signalling between bacteria, usually referred to as quorum sensing, was initially described as a means by which bacteria achieve signalling in microbial communities to coordinate gene expression within a population. Recent evidence shows, however, that quorum-sensing signalling is not restricted to bacterial cell-to-cell communication, but also allows communication between microorganisms and their hosts.
Prokaryotes and eukaryotes have coexisted for millions of years. It is estimated that humans have 1013 human cells and 1014 bacterial cells (comprising the endogenous bacterial flora). Eukaryotes have a variable relationship with prokaryotes, and these interactions can be either beneficial or detrimental. Humans maintain a symbiotic association with their intestinal microbial flora, which is crucial for nutrient assimilation and development of the innate immune system (Hooper and Gordon, 2001). These mutually beneficial associations are possible because microorganisms and mammals can communicate with each other through various hormone and hormone-like chemical compounds. These signals, however, can be ‘hijacked’ by bacterial pathogens to activate their virulence genes.
The hormonal communication between microorganisms and their hosts, dubbed inter-kingdom signalling, is a recent field of research. This field evolved from the initial observation that bacteria can communicate with each other through hormone-like signals (Nealson et al., 1970), a process that was later named quorum sensing (QS) (Fuqua et al., 1996). This field expanded with the realization that these bacterial signals can modulate mammalian cell-signal
___________
76 Reprint permission granted courtesy of Nature Publishing Group.
77 Department of Microbiology, University of Texas Southwestern Medical Center, Dallas, Texas 75235, USA.
Correspondence to V.S. e-mail: vanessa.sperandio@utsouthwestern.edu
transduction (Telford et al., 1998) and that host hormones can cross-signal with QS signals to modulate bacterial gene expression (Molina, 2006). In this Review, we discuss several mechanisms that are used for hormonal communication between microorganisms and their hosts. Owing to space constraints, we mainly consider pathogenic interactions. We focus primarily on acyl-homoserine lactones (AHLs) and aromatic (autoinducer78 (AI)-3) signals, because of the wealth of reports that link these signals to inter-kingdom communication, but it is worth noting that bacteria use an array of additional chemical molecules to communicate with one another, and it is expected that future research will implicate these in inter-kingdom signalling. After discussing bacteria–mammal and bacteria–plant interactions, we will discuss the evolutionary parallels between host and microorganism signalling systems.
The Hormonal Signals
There are three broad categories of mammalian hormones: proteins (or peptides), steroids (a subclass of lipidic hormones) and amino-acid derivatives (or amines). The structure of a hormone dictates the location of its receptor. Amine and peptide hormones cannot cross the cell membrane and bind to cell-surface receptors (such as receptor kinases and G-protein-coupled receptors (GPCRs)), whereas steroid hormones can cross plasma membranes and primarily bind to intracellular receptors.
Protein and peptide hormones constitute most of the hormones, contain 3–200 amino acids and are usually post-translationally processed. Peptide hormones include the epidermal growth factor (EGF), insulin and glucagons. Steroid hormones are derived from cholesterol, and amines are synthesized from tyrosine. Amine hormones include the catecholamines adrenaline, noradrenaline (NA) and dopamine (Molina, 2006). All of these hormones (Figure A19-1) are engaged in inter-kingdom signaling with microorganisms.
Communicating through Cell-Surface Receptors
Here, we summarize signalling through mammalian and bacterial extracellular receptors that recognize hormones that do not cross the cellular membrane. Owing to the abundance of reports on inter-kingdom signalling through intracellular receptors, these signalling mechanisms will be discussed separately.
Signalling through Receptor Kinases
Receptor kinases are cell-surface receptors that possess intrinsic tyrosine- or threonine-kinase activity that becomes activated upon the binding of a hormone to
___________
78 Autoinducer: A bacterial hormone-like signalling molecule.
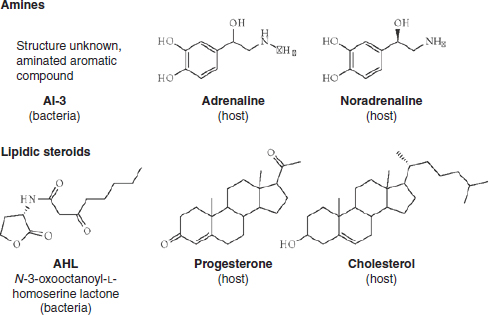
FIGURE A19-1 Chemical structures of bacterial and host signals. The bacterial signal autoinducer (AI)-3 is an aromatic aminated signal; its final structure is still unknown. Because AI-3 is, to a certain degree, hydrophobic, it is not thought to be able to cross the cell membrane. The bacterial signal acyl homoserine lactone (AHL) is composed of a conserved homoserine ring and a variable acyl chain, and usually can cross the cell membrane. The host hormones adrenaline and noradrenaline are cathecolamines that are synthesized from tyrosine and usually do not cross the cell membrane. The host signals progesterone and cholesterol are two examples of lipid host hormones that can cross the cell membrane and bind intracellular receptors.
the extracellular amino-terminal region of the receptor. This activation results in the recruitment and phosphorylation of intracellular downstream proteins, which initiates signalling cascades (Figure A19-2). One receptor tyrosine kinase that is important for host–microorganism communication is the EGF receptor (EGFR). EGFR exists on the cell surface and is activated by the binding of EGFs, small proteins that are widely used as signals by animal cells (Moghal and Sternberg, 1999). Upon activation by EGF, EGFR undergoes a transition from an inactive monomeric form to an active homodimer, which stimulates the intrinsic intracellular tyrosine-kinase activity of EGFR. Autophosphorylation results in downstream activation and signalling by other proteins, which initiates the signal-transduction cascades, principally the mitogen-activated protein kinase (MAPK), Akt and Jun amino-terminal-kinase (JNK) pathways that lead to DNA synthesis and cell proliferation. EGFR signalling is required for cell-fate specification, growth and survival at multiple steps of development (Moghal and Sternberg, 1999) (Figure A19-2).
The membrane serine protease rhomboid (Rho) regulates EGFR signalling by allowing the secretion of EGFR ligands through the proteolytic activation of
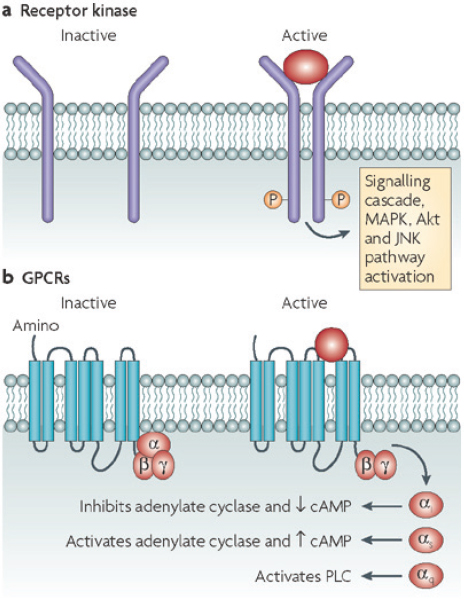
FIGURE A19-2 Mammalian signalling through membrane receptors. a | Membrane receptor kinases dimerize and autophosphorylate a tyrosine or threonine residue upon binding to a hormone. They then initiate a phosphorelay signalling cascade in the cell. These cascades can include the mitogen-activated protein kinase (MAPK), Akt and Jun amino-terminal-kinase (JNK) pathways, and often lead to DNA synthesis and cell proliferation. b | G-protein-coupled receptors (GPCRs) are receptors that are coupled to guanine-binding proteins (G proteins) when they are inactive. G proteins consist of an α-, a β- and a γ-subunit. If a GPCR binds its signal (such as adrenaline or noradrenaline (NA)), the α-subunit of the G protein is uncoupled and exerts its effect. Different families of the α-subunit associate with different effectors and exert different effects. The αi inhibits adenylate cyclase and diminishes the levels of intracellular cyclic AMP (cAMP), the αs activates adenylate cyclase to increase the levels of cAMP and the αq activates phospholipase C (PLC).
EGF from the signal-emitting cells, and provides a link between eukaryotic signalling and host–microorganism communication (Table A19-1). Rho is conserved between eukaryotic and prokaryotic cells. The Providencia stuartii Aar protein is a Rho-related protease that can functionally substitute the Drosophila Rho (Gallio et al., 2002; Stevenson et al., 2007). Additionally, eukaryotic Rho can complement a P. stuartii aar mutant, which shows that the function of these proteins is conserved between prokaryotes and eukaryotes. Rho is involved in signalling in animal cells, and Aar is also required for the production of a bacterial QS signal (Gallio et al., 2002; Stevenson et al., 2007). QS in P. stuartii represses the expression of an acetyl-transferase that modifies peptidoglycan (an intrinsic component of the bacterial cell wall) (Rather et al., 1997, 1999).
Signalling through GPCRs
Another type of cellsurface receptor that can be activated by hormones is the GPCRs. These receptors have seven transmembrane domains and are coupled to heterotrimeric guanine-binding proteins (G proteins), which consist of an α-, a β- and a γ-subunit. Hormone binding to a GPCR results in a conformational change that induces the receptor to interact with a regulatory G protein; this stimulates the release of GDP in exchange for GTP and results in G-protein activation. The activated G protein (bound to GTP) dissociates from the receptor, which is followed by α–βγ dissociation, and activates its intracellular target, which can be either an ion channel or an enzyme. GPCR specificity is controlled by the type of G protein with which a GPCR is associated. G proteins can be divided into four families depending on their association with different effector proteins. The signalling pathways of three of these—Gαs, Gαi and Gαq—have been extensively studied. The Gαs family activates adenylate cyclase, the Gαi family inhibits adenylate cyclase and the Gαq family activates phospholipase C. Within the largest class of the GPCRs are the mammalian adrenergic receptors, which change their conformation upon binding adrenaline or NA and thereby activate their coupled G protein to initiate a signalling cascade (Molina, 2006) (Figure A19-2).
Bacterial cells do not express adrenergic receptors, but many studies indicate that they respond to adrenaline and/or NA. Most of these studies were conducted in bacteria that inhabit the human gastrointestinal (GI) tract (Sperandio et al., 2003; Lyte, 1992; Lyte and Ernst, 1992; Lyte et al., 1996; Lyte et al., 1997; Freestone et al., 2003; Freestone et al., 2000; Burton et al., 2002; Clarke and Sperandio, 2005(19); Clarke and Sperandio, 2005(20); Reading et al., 2007; Kendall et al., 2007; Clarke et al., 2006; Walters and Sperandio, 2006; Nakano et al., 2007; Furness, 2000), in which, notably, both adrenaline and NA are present. NA is synthesized in the adrenergic neurons of the enteric nervous system79 (Furness, 2000). By contrast, adrenaline is synthesized in the central nervous system and
___________
79 Enteric nervous system: A nervous system that innervates the gastrointestinal tract.
TABLE A19-1 Hormonal Signals, Receptors and Biological Functions
| Signal | Prokayotic receptor | Prokaryotic function | Eukaryotic receptor | Eukaryotic function | Refs |
| Prokaryotic | |||||
| Providencia stuartti autoinducer (AI) | Unknown | Peptidoglycan modifications | Unknown | Unknown | 10,11 |
| AI-3 | QseC | Type III secretion system (T3SS) activation, motility, toxin expression, iron uptake and virulence | Unknown | Unknown | 5,19-25 |
| Acyl homoserine lactones | LuxR, TraR, LasR and others | Virulence, T3SS regulation, biofilm formation, motility, antibiotic production and others | Unknown | Immunomodulation, intracellular calcium signalling and apoptosis | 65-94 |
| Eukaryotic | |||||
| Adrenaline and noradrenaline | QseC | T3SS activation, motility, toxin expression, iron uptake, virulence, growth and quorum sensing (QS) | Adrenergic receptors | Cyclic AMP levels, phospholipase C activation, stress, cell proliferation, enzyme production and ion channels | 5,6,12-25 |
| Peptide (epidermal growth factor (EGF)) | Unknown | Unknown | EFG receptor | Cell proliferation, growth and development | 6,8 |
| Dynorphin | Unknown | QS virulence | u dynorphin opiate receptor | Stress responses | 63 |
| Steroid hormones | Unknown | Unknown | Nuclear receptors | Reproduction and regulated metabolism | 6 |
the adrenal medulla; it acts in a systemic manner after being released into the bloodstream, thereby reaching the intestine (Purves et al., 2001).
Although during homeostasis NA is probably the predominant signal in the intestine (as it is produced in the enteric nervous system), during stress, adrenaline acts systemically and affects the whole body, including the human GI system (Purves et al., 2001). Both hormones modulate intestinal smooth-muscle contraction, submucosal blood flow and chloride and potassium secretion in the intestine (Horger et al., 1998). Freddolino and colleagues (2004) reported that the ligand-binding sites for adrenaline and NA in a human adrenergic receptor are similar, and there is evidence to indicate that both adrenaline and NA are recognized by the same receptors and have important biological roles in the human GI tract (Horger et al., 1998). Furthermore, although these hormones are usually found at a nanomolar level in sera, the level of NA in the intestine is in the micromolar range; this is because the enteric nervous system is rich in adrenergic neurons, which have axon terminations that are close to the intestinal epithelia (Eldrup and Richter, 2000).
Interpreting Adrenaline and NA
Bacteria sense and respond to adrenaline and NA to regulate a multitude of phenotypes that range from metabolism to virulence-gene expression.
EHEC as a Case Study: Lessons from a Hijacker
NA induces bacterial growth, fimbriae and toxin expression in pathogenic Escherichia coli (Lyte, 1992; Lyte and Ernst, 1992; Lyte et al., 1996; Lyte et al., 1997; Freestone et al., 2003; Freestone et al., 2000; Burton et al., 2002). There are also reports in the literature (albeit conflicting) that imply that NA functions as a siderophore80 (Freestone et al., 2000; Kinney et al., 2000). Recently, NA was implicated in the induced expression of enterobactin and iron uptake in E. coli, which suggests that this is the mechanism that is involved in growth induction (Burton et al., 2002). However, the role of NA in bacterial pathogenesis seems to be more complex, and the line that divides signalling and iron uptake is becoming increasingly blurred; for example, the siderophore pyoverdine in Pseudomonas aeruginosa also acts as a signalling molecule (Lamont et al., 2002). It has also been reported that during surgical trauma NA release into the intestine induces the expression of virulence traits in P. aeruginosa, which leads to gut-derived sepsis (Alverdy et al., 2002). The role of adrenaline and NA signalling in bacterial pathogenesis was solidified by the discovery that both hormones induce the expression of flagella and the type III secretion system81 (T3SS) in the deadly
___________
80 Siderophore: A small organic molecule that is produced by bacteria to sequester iron.
81 Type III secretion system: A specialized syringe-like secretion system that is used to inject bacterial effectors into host cells.
pathogen enterohaemorrhagic E. coli (EHEC) O157:H7. EHEC can sense either the host adrenaline and NA or a bacterial aromatic QS signal, dubbed AI-3, to express its virulence traits, which suggests that these host and bacterial signals are interchangeable (Sperandio et al., 2003). EHEC are food-borne pathogens that cause major outbreaks of bloody diarrhoea and haemolytic uraemic syndrome82 throughout the world (Kaper and O’Brien, 1998). EHEC colonization of the large intestine causes attaching and effacing (AE) lesions on epithelial cells. These AE lesions are characterized by the destruction of microvilli and pedestal-like structures that ‘cup’ the bacterium (Moon et al., 1983; Knutton et al., 1987; Tzipori et al., 1986). The genes that are involved in the formation of the AE lesion are encoded by the locus of enterocyte83 effacement (LEE) chromosomal pathogenicity island (McDaniel et al., 1995). The LEE region encodes a T3SS (Jarvis et al., 1995), an adhesion (Jerse et al., 1990) and its receptor (Kenny et l., 1997), and effector proteins (McNamara and Donnenberg, 1998; Kenny and Jepson, 2000; Elliott et al., 2001; Tu et al., 2003; Kanack et al., 2005). The mortality that is associated with EHEC infections stems from the production and release of potent Shiga toxin. Shiga toxin induces cell death in endothelial cells, primarily in the urinary tract, thereby causing haemolytic uraemic syndrome (Karmali et al., 1983).
EHEC sense three signals to activate their virulence genes—the bacterial signal AI-3, which is produced by several species of bacteria in the normal human GI microbial flora, and adrenaline and NA, both of which are produced by the host (Sperandio et al., 2003; Walters et al., 2006; Tannock et al., 2005). Recognition of these three signals is essential for in vivo virulence expression, as shown using rabbit and bovine infection models (Clarke et al., 2006; Vlisidou et al., 2004). AI-3, adrenaline and NA are agonistic signals, and responses to all three can be blocked by adrenergic antagonists (Sperandio et al., 2003; Clarke et al., 2006; Walters and Sperandio, 2006). These signals are sensed by the histidine sensor kinases in the membrane of EHEC that activate a complex regulatory cascade. This cascade culminates in the activation of genes that are necessary for motility, the expression of the LEE (which results in intestinal colonization through the formation of AE lesions) and Shiga-toxin expression (Sperandio et al., 2003; Clarke and Sperandio, 2005; Clarke et al., 2006; Sperandio et al., 2001). QseC is one such sensor kinase.
Signal Interpretation through QseC and QseB
QseC specifically senses AI-3, adrenaline and NA (to augment its phosphorylation state) by directly binding to these signals. Thus, QseC is a bacterial functional analogue of adrenergic receptors (Clarke et al., 2006). As a qseC
___________
82 Haemolytic uraemic syndrome: A complication, caused mostly by Shiga toxin, that can cause the kidneys to shut down and results in high morbidity and mortality.
83 Enterocyte: An epithelial cell in the intestine.
mutant was attenuated for virulence in two rabbit animal models of infection (Clarke et al., 2006) (V.S., unpublished observations), QseC is essential for full virulence in EHEC.
Typically, sensor kinases constitute two-component systems that act in concert with response regulators. In response to an environmental signal, the sensor autophosphorylates its own conserved histidine residue (Figure A19-3). Subsequently, the histidine-bound phosphoryl group of the sensor kinase is transferred onto a specific aspartate residue on the cognate response regulator for activation. The activated response regulator then directly regulates the transcription of its target genes. In bacteria, the two-component system is the major system of signal transduction (Igo et al., 1989). Importantly, mammals do not have histidine sensor kinases (Lyon and Muir, 2003; Roychoudhury et al., 1993). Upon sensing
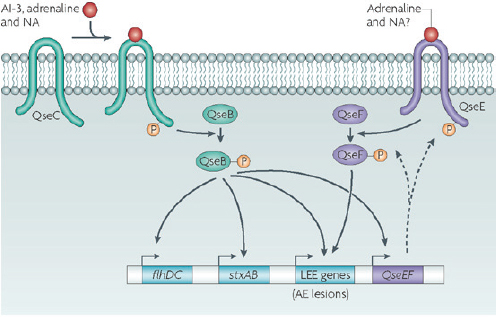
FIGURE A19-3 Adrenergic sensing in enterohaemorrhagic Escherichia coli. Autoinducer (AI)-3, adrenaline and noradrenaline (NA) bind the bacterial membrane receptor QseC, which results in its autophosphorylation. QseC then phosphorylates its response regulator QseB and initiates a complex phosphorelay signalling cascade that activates the expression of a second two-component system (QseEF), the locus of enterocyte effacement (LEE) genes (which encode various proteins, including the components of a type III section system that are involved in attaching and effacing (AE) lesion formation), the motility genes (flhDC) and Shiga toxin (stxAB). The QseEF two-component system is also involved in the expression of the LEE genes, and although its activators have not yet been elucidated, it is possible that it senses adrenaline and/or NA.
AI-3, adrenaline or NA, QseC phosphorylates the QseB response regulator, which activates the expression of motility genes (Clarke and Sperandio, 2005) and itself (Clarke and Sperandio, 2005). In addition, QseBC plays an important part in the regulation of the LEE genes, iron-uptake systems, several adhesins, other two-component systems and Shiga toxin (D.T.H. and V.S., unpublished observations). These in vitro and in vivo data suggest that QseC has a pivotal role in EHEC pathogenesis and inter-kingdom signalling. The QseC sensor is the first example of a receptor for both a bacterial and a host signal, and, therefore, QseC integrates bacteria–host signalling at the biochemical level.
QseC homologues are present in several other bacterial pathogens, including Salmonella enterica serovar Typhi (S. typhi), Salmonella enterica serovar Typhimurium (S. typhimurium), Vibrio parahaemolyticus and Francisella tularensis. The role of QseC in other bacterial pathogens is beginning to be elucidated. QseC regulates the expression of the PmrAB two-component system in S. typhimurium, which, in turn, regulates virulence-gene expression (Merighi et al., 2006). Also, a recent report demonstrated that a qseC mutant was defective in colonization of the swine GI tract (Bearson and Bearson, 2007). The important role that sensing adrenaline and NA has during Salmonella spp. infection and colonization was further highlighted by a report that, in swine, either social stress or stress induced by transportation reactivates subacute Salmonella spp. infections and can increase the faecal excretion of these bacteria (Callaway et al., 2006). F. tularensis qseC mutants are attenuated for the infection of mice (Weiss et al., 2007). Although it has not been associated with QseC, NA has been shown to induce the expression of the V. parahaemolyticus T3SS, cytotoxicity and pathogenicity in vivo, and these effects were blocked by adrenergic antagonists (Nakano et al., 2007). NA has also been shown to regulate the expression of the OspA protein in Borrelia burgdorferi, which is important for the survival of B. burgdorferi in the tick host and its infection of mice (Scheckelhoff et al., 2007).
Signal interpretation through QseE and QseF
In EHEC, QseC autophosphorylation in response to the three signals that are discussed above can only be blocked by an α-adrenergic antagonist (phentolamine) (Clarke et al., 2006). However, AE lesion formation can be blocked by a β-adrenergic antagonist (propranolol) (Sperandio et al., 2003). These findings suggest that there is a second sensor for these signals. The interaction of AI-3, adrenaline and NA with more than one sensor kinase could also provide a “timing” mechanism during infection, which is desirable, as it would be inefficient for EHEC to express attachment and motility genes simultaneously. In addition to controlling the expression of the motility genes, the LEE and Shiga toxin, QseC also activates the transcription of a two-component system (QseEF), which is involved in AE lesion formation (Reading et al., 2007). QseE is a membrane-bound sensor kinase, and QseF is its response regulator. Although the signals
that are sensed by this two-component system have not yet been elucidated, the expression of QseE is essential for AE lesion formation by EHEC (Reading et al., 2007) and it could constitute a second adrenaline and/or NA sensor in E. coli.
AI-3 Signalling—Talking Back to the Host?
AI-3 is a bacterial signal that activates the expression of the EHEC virulence genes. AI-3 signalling in EHEC can be substituted by the hormones adrenaline and NA, which suggests that AI-3 might also be involved in inter-kingdom signalling (Sperandio et al., 2003). As the host hormones adrenaline and NA signal to EHEC, it would be expected that AI-3 can signal to eukaryotic cells. In the human intestine, enterocytes express the α2-adrenergic receptor. This receptor is expressed preferentially in the basolateral compartment of the polarized intestinal cells, but is also found in the brush border of these cells. It is expressed at higher levels in the proximal and transverse colon of the human intestine, which are, coincidently, the sites of microbial flora and EHEC colonization (Valet et al., 1993). A general pathway ofα2-adrenergic-signal transduction is the depression of intracellular cyclic AMP levels by the inhibition of adenylate cyclase. The α2-adrenergic receptor is coupled to both the Gi2 and Gi3 signalling proteins, and the activation of Gi2 is predominantly responsible for the inhibition of adenylate cyclase by α2-agonists and natural ligands (adrenaline and NA) (Remaury et al., 1993). Future studies will investigate whether AI-3 can inhibit adenylate cyclase through α2-adrenergic receptors in enterocytes. Such an inhibition would suggest that AI-3 functions in the human GI tract as a naturalα-agonist that is produced by the resident microbial flora. Given that α-adrenergic agonists have been used extensively as inhibitors of chronic diarrhoea (Buchman et al., 2006), such an activity could suggest an important role for AI-3 in the maintenance of intestinal homeostasis.
The Stress Response in Inter-Kingdom Signalling.
Adaptations to environmental, psychosocial or physical insults in mammals are referred to as stress responses—also termed “fight or flight” responses. The short-term activation of the stress response involves the synchronized interaction of all aspects of the neuroendocrine system, and ensures that energy substrates are available to meet the increasing energy demands of the body. Adrenaline and NA are classic stress hormones that have a pivotal role in the stress response (Molina, 2006). Although they increase a mammal’s ability to respond to the environment, it seems that they can be sensed by bacteria, which allows these organisms to gauge the metabolic state of the host and exploit a weakened immune system. In addition to adrenaline and NA, the host releases endogenous opiods, such as dynorphin, during stress. A recent study suggested that the opportunistic pathogen P. aeruginosa uses host dynorphin to enhance the expression of its virulence traits; it was also shown that this mammalian stress hormone cross-signals with
the P. aeruginosa QS signalling system (Zaborina et al., 2007). Taken together, these studies have shown that there is an intricate connection between host stress signalling, bacterial QS and pathogenesis, which suggests that stress responses, some of the most basic physiological functions in prokaryotic and eukaryotic cells, are central to inter-kingdom communication.
Communicating through Intracellular Receptors
AHLs and AI-1 are fatty-acid-based signalling molecules (Figure A19-1; Table A19-1) that are synthesized by Gram-negative bacteria to coordinate the cell-density-based gene regulation that is known as QS. AHLs mediate bacterial processes by interacting with inducible transcriptional regulators. This process was first characterized in the bioluminescent bacterium Vibrio fischeri as a mechanism that regulates light production (Nealson et al., 1970). The role of AHLs as bacterial signalling molecules has since evolved to include many regulatory functions, including multiple mechanisms of bacterial pathogenesis64. These mechanisms are most extensively characterized in P. aeruginosa, in which AHLs are required to regulate colonization and persistence during infection (Yoon et al., 2002; Singh et al., 2000).
Lipidic-based or fatty-acid-based signalling mechanisms have also been extensively characterized in eukaryotes. Dozens of lipid-based hormones have been shownto facilitate hundreds of biological functions. These lipid-based molecules include members of the eicosanoid family84 as well as lipidic and steroid hormones. Lipid-based hormones diffuse freely across the cell membrane and interact with members of the nuclear hormone receptor family to modify transcriptional regulation (Downward, 2001).
Bacterial AHLs and eukaryotic lipidic signaling molecules are chemically analogous and have comparable modes of action (Figure A19-4). This observation led to the hypothesis that bacterial AIs enter the host cell and mediate the regulation of transcription (Shiner et al., 2005). A bona fide mammalian AHL receptor has not yet been found, but recent studies have shown that the AHL N-(3- oxododecanoyl)-l-homoserine lactone (also known as OdDHL) can enter, and function in, mammalian cells (Williams et al., 2004). It has been known for more than a decade that AHLs can elicit responses in mammalian cells. This phenomenon was first observed using respiratory epithelial cells, in which there was a dose-dependent increase in interleukin (IL)-8 in response to purified AHL (DiMango et al., 1995). Subsequent reports indicated that AHLs have a pleiotropic effect on host cells that depends on cell type, AHL concentration and assay condition. However, several groups have consistently demonstrated what seems to be a biphasic role for AHLs in immunomodulation—low AHL concentrations
___________
84 Eicosanoid family: A lipid-based signalling molecule that is best known for its control of the immune response. Prostaglandins are part of the eicosanoid family.
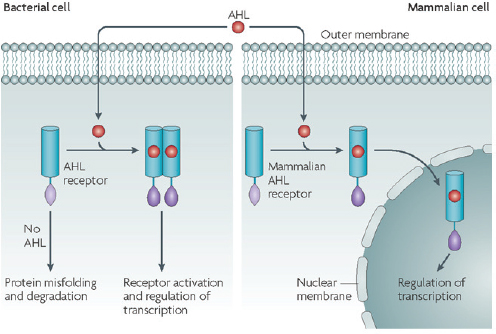
FIGURE A19-4 AHL inter-kingdom signalling. In bacteria, acyl homoserine lactones (AHLs) cross the cell membrane and interact with cytoplasmic receptors of the LuxR family. Binding the AHL to the LuxR-type receptor allows proper folding of this protein, which allows the receptor to dimerize and bind to its target sequence on DNA to regulate gene expression. In the absence of signal, LuxR-type proteins misfold and are targeted for degradation. In mammalian cells, AHLs also gain access to the cytoplasm by crossing the plasma membrane. The identity of the mammalian receptor (or receptors) for AHLs in mammalian cells is unknown. However, if there are intracellular receptors, it is proposed that the interaction with the AHL ligand activates these receptors and thereby allows their transportation into the nucleus, where they could control gene expression.
impair the immune response, whereas high concentrations exacerbate immune function.
Inhibition of the Host Immune Response by AHLs.
AHLs were first shown to act as inhibitors of the host immune response in 1998 (Telford et al., 1998). In this study, it was reported that OdDHL inhibits lymphocyte proliferation and tumour necrosis factor-α production, and downregulates IL-12 production, in lipopolysaccharide-stimulated macrophages. This assay was used to establish the structural requirements of AHL for immune inhibition. Acylated l-homoserine lactones that have an 11–13 carbon side chain that contains either a 3-oxo or a 3-hydroxy group have optimal immune suppressive activity (Chahabra et al., 2003). Subsequent studies indicated that OdDHL inhibits cytokine production in vitro and INF-γ tends to be inhibited more than
IL-4. However, in vivo experiments were suggestive of nonspecific immune inactivation rather than a T helper 1 (TH1) response85 (Ritchie et al., 2003), which supports the finding that OdDHL inhibits the differentiation and proliferation of both TH1 and TH2 cells (Ritchie et al., 2003; Pritchard et al., 2005).
AHLs Promote Apoptosis
Gram-negative bacteria, such as EHEC, enteropathogenic E. coli and Salmonella spp., secrete effectors to initiate apoptosis and abrogate the innate immune response (Mota et al., 2005). Several recent reports indicate that OdDHL also initiates apoptosis, which suggests an additional mechanism of bacteria-mediated apoptosis. OdDHL causes apoptosis in various mammalian cell types, including neutrophils, macrophages, fibroblasts, human vascular endothelial cells and breast carcinoma cells (Tateda et al., 2003; Horikawa et al., 2006; Shiner et al., 2006; Li et al., 2004).
The induction of apoptosis by OdDHL was first observed by Tateda and colleagues (Tateda et al., 2003), who observed a dose-dependent and incubation-time-dependent increase in apoptosis in neutrophils and macrophages upon the addition of OdDHL. Interestingly, this effect was not observed upon the addition of N-butanoyl-l-homoserine lactone (also known as C4-HSL), another QS molecule (Tateda et al., 2003) Structure–activity studies correlated the hydrophobicity of the side chain of OdDHL with its apoptotic activity. Several synthetic AHL analogues that had polar and non-polar additions to the distal end of the side chain were tested in these correlation studies; the addition of polar groups abolished apoptotic activity, whereas the addition of bulky hydrophobic groups increased apoptotic activity (Horikawa et al., 2006).
In 2004, the first clue towards understanding the mechanism that underlies AHL-induced apoptosis was provided (Li et al., 2004). In a breast carcinoma cell line, OdDHL diminished signal transduction and activator of transcription 3 (STAT3) activity, but had no effect on MAPK activity, and the pharmacological inhibition of the STAT3 pathway led to the same phenotype as the addition of OdDHL. Furthermore, the expression of a constitutively active STAT3 protein abolished the apoptotic activity of OdDHL (Li et al., 2004).
More recently, calcium signalling was established as a mechanism for OdDHL apoptotic activity (Shiner et al., 2006). OdDHL increases cytosolic calcium levels in murine fibroblasts and human vascular endothelial cells. Interestingly, the pharmacological inhibition of calcium signalling pathways abolishes the apoptotic effect of OdDHL, but the immunomodulatory effects of OdDHL remain intact (Shiner et al., 2006).
___________
85 T helper 1 (TH1) response: The actions of CD4 helper T lymphocytes can be summarized by two pathways, TH1 and TH2, on the basis of the cytokines that they produce and their effector functions. During the TH1 response, T helper lymphocytes principally secrete interferon– γ to activate phagocyte-mediated defence, which typically involves intracellular microorganisms.
AHLs Elicit Proinflammatory Effects
Following the discovery that IL-8 levels increase in respiratory epithelial cells upon the addition of OdDHL, a series of studies that documented numerous proinflammatory pathways that are affected by OdDHLs were published (Zimmermann et al., 2006). The first of these studies characterized the potential mechanism by which OdDHL could increase the production of IL-8. The transcription factors nuclear factor (NF)-κB and AP-2 are required for maximal induction of IL-8 by OdDHL80. Furthermore, if the MAPK pathway is inhibited, OdDHL stimulation of both IL-8 and NF-κB is subdued (Smith et al., 2001). However, OdDHL also induces neutrophil chemotaxis in an IL-8-independent manner (Zimmermann et al., 2006).
Subsequent studies examined the effect of OdDHL injection into the skin of mice. Injection resulted in increased mRNAs for the cytokines IL-1α and IL-6 as well as for the chemokines macrophage inflammatory protein 2 (MIP2), MIP1β, interferon-γ inducible protein 10 and T-cell activation gene 3 (Smith et al., 2002). OdDHL also activated T-cells to produce INF-γ (Smith et al., 2002).
Acting through the NF-κB pathway, OdDHL increases the expression of cyclooxygenase 2 (COX2); an enzyme that is responsible for the synthesis of prostaglandin (an eicosanoid) (Smith et al., 2002). Increased levels of membrane-associated prostaglandin E (PGE) synthase, as well as its product, PGE2, indicate that OdDHLs can act as potent activators of the lipid-mediated immune response. Prostaglandin metabolites, which are similar to OdDHL in structure and their chemical characteristics, have the same COX2 activation phenotype as OdDHLs; this indicates functionality through a common receptor (Smith et al., 2002).
On the Forefront: Novel Roles for AHLs
Rumbaugh (2007) has recently undertaken an unbiased approach to understanding the role of AHLs in mammalian cells. In this study, a microarray analysis of mouse fibroblasts treated with OdDHL or C4-HSL was performed. Treatment with OdDHL and C4-HSL using Affymetrix GeneChips elicited significant changes in murine genes of 10% and 8%, respectively. Most of these differentially regulated genes exhibited AI specificity (regulated by either OdDHL or C4-HSL). Intriguingly, whereas several of these differentially regulated genes were from categories of previously discovered AHL targets, such as immune modulation and apoptosis, most of the differentially regulated genes were new AHL targets. Therefore, AHLs probably act on multiple mammalian pathways, and these interactions are probably not pathogenic in nature.
Mammals Fight Back: Destroying AHLs
Recent studies have found cytoplasmic factors that degrade OdDHL, called paraoxonases (PONs), in mammalian cells (Yang et al., 2005; Chun et al., 2004).
PONs are involved in the detoxification of many organophosphates and act as lactonases (Yang et al., 2005; Chun et al., 2004). Although it is possible that these functions evolved only to subvert the QS capabilities of an invading bacterium, this seems unlikely given that QS typically occurs outside the cell. It is more likely that these molecules evolved to prevent OdDHLs, which can infiltrate mammalian cells, from interfering with cellular functions.
In 2004, Chun and colleagues (2004) discovered that human airway epithelia inactivate OdDHL through an unknown mechanism, and activity is cell associated (that is, it is not a secreted factor). The likely candidates for the factor were subsequently reduced to the paraoxonase family86 proteins PON1, PON2 and PON3 (Khersonsky and Tawfik, 2005; Draganov et al., 2005). Although serum PON1 subverted P. aeruginosa QS and biofilm formation in vitro, Pon1-knockout mice were protected in a P. aeruginosa infection model. PON2 was eventually determined to be the most likely candidate for OdDHL degradation in mammals (Ozer et al., 2005). Tracheal epithelial-cell lysates from a Pon2-knockout mouse had impaired OdDHL-degrading activity, whereas overexpression of Pon2 enhanced OdDHL degradation (Stoltz et al., 2007). Lysates from Pon1- and Pon3-knockout mice did not have impaired OdDHL-degrading activity (Stoltz et al., 2007).
AHL-Binding Domains Share Similarities with PAS and GAF Domains
Recent studies into the physical nature of AHL-binding domains have revealed structural similarities to PAS and GAF domains.87 The crystallization of TraR, an Agrobacterium tumefaciens QS protein, facilitated the first structural insights into the AHLbinding domain. The three-dimensional structure of TraR indicated that if bound to its ligand (N-(3-oxooctanoyl)-l-homoserine lactone) it shared structural similarities with the evolutionarily conserved PAS and GAF domains (Stoltz et al., 2007; Zhang et al., 2002). The recently solved structures of two other bacterial proteins that contain AHLbinding domains, LasR and SdiA, also showed that they share structural similarities with PAS and GAF domains (Yao et al., 2006; Bottomley et al., 2007; Ho et al., 2000; Harper et al., 2003).
The PAS and GAF domains are also found in the mammalian aryl hydrocarbon receptor (AhR), which shares functional similarities with bacterial AHLinduced transcription factors. AhR is a ligand-induced transcription factor that enters the nucleus and acts as a transcriptional regulator upon engagement by a hydrophobic molecule (Gu et al., 2000). Other examples of mammalian PAS- and GAF-domain-containing proteins include the neuronal carbon monoxide sensor
___________
86 Paraoxonase family: A three-member gene family that consists of PON1, PON2 and PON3. Mammalian biological functions of paraoxonases remain elusive. However, possible functions include: protection from organophosphate poisoning; a protective role in vascular disease through lipoprotein lipid oxidation; and the limitation of bacterial infection through potential lactonase activity.
87 PAS and GAF domain: A ubiquitous protein motif that is conserved in prokaryotes and eukaryotes.
NPAS2 (neuronal PAS domain protein 2), which regulates the mammalian circadian clock98, and HIF1 (hypoxia-inducible factor 1), which regulates the hypoxic response (Gu et al., 2000).
Pathogens Sense the Host Immune System
The host immune system can use bacterial signals to gauge, and respond to, bacterial infections, but bacteria have also evolved the ability to sense and manipulate the host immune system. The P. aeruginosa OprF surface protein binds host interferon-γ and initiates a signalling cascade in the bacterial cell that reprogrammes gene expression. It has been proposed that by this mechanism pathogens can detect if they have triggered the host innate immune response (Wu et al., 2005). In S. typhimurium, the PhoQ sensor kinase directly binds, and is activated by, host antimicrobial peptides. PhoQ then promotes the expression of virulence genes through a phosphorelay cascade (Bader et al., 2005). These findings represent yet another molecular mechanism by which bacteria can sense small innate immune molecules and modulate virulence-gene expression.
Bacteria–Plant Communications
Many plant-specific pathogenic bacteria require QS to successfully mediate host infection101. However, plants and algae have evolved multiple mechanisms to interpret these QS signals and initiate defensive responses (Bauer and Mathesius, 2004). Nanomolar concentrations of AHLs cause substantial changes in protein expression in Medicago truncatula (alfalfa). Peptide-mass fingerprinting of 100 root proteins that were affected by AHLs revealed that 25% of these proteins had functions in host defence, whereas the remainder had roles in primary metabolism, plant-hormone responses, transcriptional regulation, protein processing and cytoskeletal activity (mathesius et al., 2003). Additionally, plants can respond differently to unique AHLs in a tissue-specific manner (Mathesius et al., 2003). For example, during microarray analysis, the treatment of tomato plant shoots with AHL resulted in the upregulation of multiple defence mechanisms (Lugtenberg et al., 2004).
As a defence against pathogenic bacteria, plants and algae have mastered the art of AHL mimicry; they secrete hormones that mimic bacterial QS signals, which leads to confusion among the signalling bacteria. Interestingly, the secretion of these mimic compounds seems to be regulated by bacterial AHLs. For example, M. truncatula secretes more AHL mimics after bacterial AHL treatment (Mathesius et al., 2003). Several groups have isolated and identified individual inhibitory mimic compounds. The most extensively studied are the halogenated furanones that are produced by the marine alga Delisea pulchra. D. pulchra furanones are structurally similar to bacterial AHLs. Furanones have been found to specifically inhibit AHL-regulated mechanisms in multiple bacterial species.
In their natural marine environment, D. pulchra uses halogenated furanones to control the structure of the natural bacterial communities that are on the algal surface. The exact mechanism of action is unknown, but it is thought to increase the turnover of bacterial AHL-induced transcription factors (Manefield et al., 2002).
A detailed inhibitory mechanism has also been described in higher plants that have been infected with A. tumefaciens, the bacterium that causes crown gall tumours. Formation of these tumours requires plant-tissue injury. In the event of an injury, the plant facilitates the accumulation of γ-amino butyric acid (GABA; also an animal neurotransmitter) near the wound. GABA activates A. tumefaciens AttM lactonase, which causes the bacterium to destroy its own QS signal (Chevrot et al., 2006). In addition, l-canavanine, produced by alfalfa, inhibits QS in the plant symbiont Sinorhizobium meliloti (Keshavan et al., 2005). Furthermore, two compounds that were isolated from garlic inhibited QS in a LuxR reporter assay (Persson et al., 2005).
However, bacteria–plant communication is not only necessary as a defence mechanism. One of the best-studied inter-kingdom signalling mechanisms is found in communications between Rhizobium spp. soil bacteria and their symbiotic legume hosts. In this system, legumes produce flavanoids, which are ligands for the bacterial NodD protein. Once activated, NodD activates the expression of other bacterial genes that encode Nod factors, which, in turn, activate plant root receptors and thereby initiate nodulation (Perret et al., 2000).
Evolution of Cell–Cell Signalling
Recently, an intriguing opinion was written by Iyer and colleagues (2004) that examined the evolution of low-molecular-mass first-messenger metabolic pathways, including the synthesis of amino acids, amino-acid derivatives (NA, adrenaline, dopamine, serotonin and melatonin), nucleosides, histamine, lipid- and fatty-acid derivatives (acetylcholine) and inorganic molecules, such as carbon monoxide and nitric oxide (Iyer et al., 2004). They proposed that the evolution of cell–cell signalling in mammals relies more on late horizontal gene transfer from bacteria to animals than on vertical inheritance. This hypothesis was driven by the observation that the enzyme that regulates vertebrate melatonin biosynthesis, arylalkylamine N-acetyl-transferase, is encoded in bacteria, yeast and vertebrates, but not in plants, worms or flies (Coon et al., 1995). They suggested that this pattern is consistent with an evolutionary mechanism that involves horizontal gene transfer and multiple gene losses. Of 17 major enzymes that are dedicated to messenger metabolism, only 2 are present in the 3 major crown-group lineages of eukaryotes (animals, plants and fungi) and in bacteria. Sixteen of these enzymes are present in animals and bacteria, and none of these enzymes is present in archaea, which share multiple vertically inherited core-gene sets with Eukaryotes (Iyer et al., 2004). Additionally, the scattered distribution of these enzymes does not follow the distribution pattern of central metabolic genes, which generally are
BOX A19-1
Questions for Future Research
- Do bacteria peptide hormones influence host signalling, and do host peptide hormones influence bacterial quorum sensing?
- Does autoinducer-3 signal to host cells, and if so, is this signalling adrenergic dependent?
- Are there more bacterial adrenergic receptors?
- What are the receptors for acyl-homoserine lactones in mammalian cells?
- Do bacterial cells sense steroid and lipidic mammalian hormones?
represented in all eukarya, bacteria and archaea. Interestingly, another enzyme that is involved in melatonin production, hydroxyindole O-methyltransferase, is found only in bacteria and vertebrates. Horizontal gene transfer indicates that bacteria and mammals have the same intrinsic ability to produce multiple mammalian signalling compounds. This argument substantiates a growing body of evidence (Rumbaugh, 2007) that bacteria produce small molecules for bacteria–bacteria communication that also function directly in bacteria–host communication.
Conclusion
The inter-kingdom signalling field is in its infancy, but a growing body of work has demonstrated that inter-kingdom signalling has broad implications to evolution and for mammalian and plant health. Cross-signalling between bacterial AIs and host hormones are at the core of microbial–host communication. However, there are several questions to be answered (Box A19-1), including whether bacterial peptide hormones and AI-3 also induce host signalling, and whether lipidic and/or steroid host hormones signal to bacteria. Most of the receptors for these inter-kingdom signals in bacteria and their host also remain to be identified. Future studies in this field will enhance our understanding of the signalling networks that have driven the co-evolution of prokaryotes and eukaryotes. Furthermore, future studies may help us to exploit these communication systems for the design of novel therapeutics to combat bacterial infections and enhance host immune defences.
Acknowledgements
Work in the laboratory of V.S. is supported by the National Institutes of Health, The Ellison Medical Foundation and Burroughs Wellcome Fund. The authors thank M. Lyte for comments on this manuscript. They also apologize to
the numerous investigators whose manuscripts could not be cited owing to space constraints.
DATABASES
Entrez Genome Project: http://www.ncbi.nlm.nih.gov/entrez/query.fcgi?db= genomeprj
Agrobacterium tumefaciens | Borrelia burgdorferi | Escherichia coli | Francisella tularensis | Medicago truncatula | Providencia stuartii | Pseudomonas aeruginosa | Salmonella typhi | Salmonella typhimurium | Sinorhizobium meliloti | Vibrio fischeri | Vibrio parahaemolyticus
FURTHER INFORMATION
Vanessa Sperandio’s homepage: http://www.utsouthwestern.edu/utsw/cda/dept131456/files/159676.html
All links are active in the online pdf.
References
- Hooper, L. V. & Gordon, J. I. Commensal host–bacterial relationships in the gut. Science 292, 1115–1118 (2001). Excellent review of the microbial regulation of host intestinal immune defence.
- Nealson, K. H., Platt, T. & Hastings, J. W. Cellular control of the synthesis and activity of the bacterial luminescent system. J. Bacteriol. 104, 313–322 (1970).
- Fuqua, C., Winans, S. C. & Greenberg, E. P. Census and consensus in bacterial ecosystems: the LuxR–LuxI family of quorum-sensing transcriptional regulators. Annu. Rev. Microbiol. 50, 727–751 (1996).
- Telford, G. et al. The Pseudomonas aeruginosa quorum-sensing signal molecule N-(3oxododecanoyl)-l-homoserine lactone has immunomodulatory activity. Infect. Immun. 66, 36–42 (1998).
- Sperandio, V., Torres, A. G., Jarvis, B., Nataro, J. P. & Kaper, J. B. Bacteria–host communication: the language of hormones. Proc. Natl Acad. Sci. USA 100, 8951–8956 (2003). First description of adrenaline and NA regulation of the T3SS, and of motility and cross-talk with bacterial QS molecules.
- Molina, P. E. Endocrine Physiology (The McGraw Hill Companies, New York, 2006).
- Moghal, N. & Sternberg, P. W. Multiple positive and negative regulators of signaling by the EGF-receptor. Curr. Opin. Cell Biol. 11, 190–196 (1999).
- Gallio, M., Sturgill, G., Rather, P. & Kylsten, P. A conserved mechanism for extracellular signaling in eukaryotes and prokaryotes. Proc. Natl Acad. Sci. USA 99, 12208–12213 (2002).
- Stevenson, L. G. et al. Rhomboid protease AarA mediates quorum-sensing in Providencia stuartii by activating TatA of the twin-arginine translocase. Proc. Natl Acad. Sci. USA 104, 1003–1008 (2007).
- Rather, P. N., Parojcic, M. M. & Paradise, M. R. An extracellular factor regulating expression of the chromosomal aminoglycoside 2′-N-acetyltransferase of Providencia stuartii. Antimicrob. Agents Chemother. 41, 1749–1754 (1997).
- Rather, P. N., Ding, X., Baca-DeLancey, R. R. & Siddiqui, S. Providencia stuartii genes activated by cell-to-cell signaling and identification of a gene required for production or activity of an extracellular factor. J. Bacteriol. 181, 7185–7191 (1999).
- Lyte, M. The role of catecholamines in Gramnegative sepsis. Med. Hypotheses 37, 255–258 (1992). First description of NA-inducing bacterial growth.
- Lyte, M. & Ernst, S. Catecholamine induced growth of Gram negative bacteria. Life Sci. 50, 203–212 (1992).
- Lyte, M., Arulanandam, B. P. & Frank, C. D. Production of Shiga-like toxins by Escherichia coli O157:H7 can be influenced by the neuroendocrine hormone norepinephrine. J. Lab. Clin. Med. 128, 392–398 (1996).
- Lyte, M. et al. Norepinephrine-induced expression of the K99 pilus adhesin of enterotoxigenic Escherichia coli. Biochem. Biophys. Res. Commun. 232, 682–686 (1997).
- Freestone, P. P., Haigh, R. D., Williams, P. H. & Lyte, M. Involvement of enterobactin in norepinephrinemediated iron supply from transferrin to enterohaemorrhagic Escherichia coli. FEMS Microbiol. Lett. 222, 39–43 (2003).
- Freestone, P. P. et al. The mammalian neuroendocrine hormone norepinephrine supplies iron for bacterial growth in the presence of transferrin or lactoferrin. J. Bacteriol. 182, 6091–6098 (2000).
- Burton, C. L. et al. The growth response of Escherichia coli to neurotransmitters and related catecholamine drugs requires a functional enterobactin biosynthesis and uptake system. Infect. Immun. 70, 5913–5923 (2002).
- Clarke, M. B. & Sperandio, V. Transcriptional autoregulation by quorum sensing E. coli regulators B and C (QseBC) in enterohemorrhagic E. coli (EHEC). Mol. Microbiol. 58, 441–455 (2005).
- Clarke, M. B. & Sperandio, V. Transcriptional regulation of flhDC by QseBC and σ28 (FliA) in enterohaemorrhagic Escherichia coli. Mol. Microbiol. 57, 1734–1749 (2005). First description of a bacterial adrenergic receptor.
- Reading, N. C. et al. A novel two-component signaling system that activates transcription of an enterohemorrhagic Escherichia coli effector involved in remodeling of host actin. J. Bacteriol. 189, 2468–2476 (2007).
- Kendall, M. M., Rasko, D. A. & Sperandio, V. Global effects of the cell-to-cell signaling molecules autoinducer-2, autoinducer-3, and epinephrine in a luxS mutant of enterohemorrhagic Escherichia coli. Infect. Immun. 75, 4875–4884 (2007).
- Clarke, M. B., Hughes, D. T., Zhu, C., Boedeker, E. C. & Sperandio, V. The QseC sensor kinase: a bacterial adrenergic receptor. Proc. Natl Acad. Sci. USA 10420–10425 (2006).
- Walters, M. & Sperandio, V. A Autoinducer 3 and epinephrine signaling in the kinetics of locus of enterocyte effacement gene expression in enterohemorrhagic Escherichia coli. Infect. Immun. 74, 5445–5455 (2006).
- Walters, M., Sircili, M. P. & Sperandio, V. AI-3 synthesis is not dependent on luxS in Escherichia coli. J. Bacteriol. 188, 5668–5681 (2006).
- Nakano, M., Takahashi, A., Sakai, Y. & Nakaya, Y. Modulation of pathogenicity with norepinephrine related to the type III secretion system of Vibrio parahaemolyticus. J. Infect. Dis. 195, 1353–1360 (2007).
- Furness, J. B. Types of neurons in the enteric nervous system. J. Auton. Nerv. Syst. 81, 87–96 (2000).
- Purves, D. et al. Neuroscience (Sinauer Associates, New York, 2001).
- Horger, S., Schultheiss, G. & Diener, M. Segmentspecific effects of epinephrine on ion transport in the colon of the rat. Am. J. Physiol. 275, G1367–G1376 (1998).
- Freddolino, P. L. et al. Predicted 3D structure for the human β2 adrenergic receptor and its binding site for agonists and antagonists. Proc. Natl Acad. Sci. USA 101, 2736–2741 (2004).
- Eldrup, E. & Richter, E. A. DOPA, dopamine, and DOPAC concentrations in the rat gastrointestinal tract decrease during fasting. Am. J. Physiol. Endocrinol. Metab. 279, E815–E822 (2000).
- Kinney, K. S., Austin, C. E., Morton, D. S. & Sonnenfeld, G. Norepinephrine as a growth stimulating factor in bacteria — mechanistic studies. Life Sci. 67, 3075–3085 (2000).
- Lamont, I. L., Beare, P. A., Ochsner, U., Vasil, A. I. & Vasil, M. L. Siderophore-mediated signaling regulates virulence factor production in Pseudomonas aeruginosa. Proc. Natl Acad. Sci. USA 99, 7072–7077 (2002).
- Alverdy, J. et al. Gut-derived sepsis occurs when the right pathogen with the right virulence genes meets the right host: evidence for in vivo virulence expression in Pseudomonas aeruginosa. Ann. Surg. 232, 480–489 (2000).
- Kaper, J. B. & O’Brien, A. D. Escherichia coli O157:H7 and other Shiga toxin-producing E. coli strains (ASM, Washington DC, 1998).
- Moon, H. W., Whipp, S. C., Argenzio, R. A., Levine, M. M. & Giannella, R. A. Attaching and effacing activities of rabbit and human enteropathogenic Escherichia coli in pig and rabbit intestines. Infect. Immun. 41, 1340–1351 (1983).
- Knutton, S., Baldini, M. M., Kaper, J. B. & McNeish, A. S. Role of plasmid-encoded adherence factors in adhesion of enteropathogenic Escherichia coli to HEp-2 cells. Infect. Immun. 55, 78–85 (1987).
- Tzipori, S. et al. The pathogenesis of hemorrhagic colitis caused by Escherichia coli O157:H7 in gnotobiotic piglets. J. Infect. Dis. 154, 712–716 (1986).
- McDaniel, T. K., Jarvis, K. G., Donnenberg, M. S. & Kaper, J. B. A genetic locus of enterocyte effacement conserved among diverse enterobacterial pathogens. Proc. Natl Acad. Sci. USA 92, 1664–1668 (1995).
- Jarvis, K. G. et al. Enteropathogenic Escherichia coli contains a putative type III secretion system necessary for the export of proteins involved in attaching and effacing lesion formation. Proc. Natl Acad. Sci. USA 92, 7996–8000 (1995).
- Jerse, A. E., Yu, J., Tall, B. D. & Kaper, J. B. A genetic locus of enteropathogenic Escherichia coli necessary for the production of attaching and effacing lesions on tissue culture cells. Proc. Natl Acad. Sci. USA 87, 7839–7843 (1990).
- Kenny, B. et al. Enteropathogenic E. coli (EPEC) transfers its receptor for intimate adherence into mammalian cells. Cell 91, 511–520 (1997).
- McNamara, B. P. & Donnenberg, M. S. A novel proline-rich protein, EspF, is secreted from enteropathogenic Escherichia coli via the type III export pathway. FEMS Microbiol. Lett. 166, 71–78 (1998).
- Kenny, B. & Jepson, M. Targeting of an enteropathogenic Escherichia coli (EPEC) effector protein to host mitochondria. Cell. Microbiol. 2, 579–590 (2000).
- Elliott, S. J. et al. EspG, a novel type III systemsecreted protein from enteropathogenic Escherichia coli with similarities to VirA of Shigella flexneri. Infect. Immun. 69, 4027–4033 (2001).
- Tu, X., Nisan, I., Yona, C., Hanski, E. & Rosenshine, I. EspH, a new cytoskeleton-modulating effector of enterohaemorrhagic and enteropathogenic Escherichia coli. Mol. Microbiol. 47, 595–606 (2003).
- Kanack, K. J., Crawford, J. A., Tatsuno, I., Karmali, M. A. & Kaper, J. B. SepZ/EspZ is secreted and translocated into HeLa cells by the enteropathogenic Escherichia coli type III secretion system. Infect. Immun. 73, 4327–4337 (2005).
- Karmali, M. A., Petric, M., Lim, C., Fleming, P. C. & Steele, B. T. Escherichia coli cytotoxin, haemolyticuraemic syndrome, and haemorrhagic colitis. Lancet 2, 1299–1300 (1983).
- Tannock, G. W. et al. Ecological behavior of Lactobacillus reuteri 100-23 is affected by mutation of the luxS gene. Appl. Environ. Microbiol. 71, 8419–8425 (2005).
- Vlisidou, I. et al. The neuroendocrine stress hormone norepinephrine augments Escherichia coli O157:H7- induced enteritis and adherence in a bovine ligated ileal loop model of infection. Infect. Immun. 72, 5446–5451 (2004).
- Sperandio, V., Torres, A. G., Giron, J. A. & Kaper, J. B. Quorum sensing is a global regulatory mechanism in enterohemorrhagic Escherichia coli O157:H7. J. Bacteriol. 183, 5187–5197 (2001).
- Igo, M. M., Ninfa, A. J., Stock, J. B. & Silhavy, T. J. Phosphorylation and dephosphorylation of a bacterial transcriptional activator by a transmembrane receptor. Genes Dev. 3, 1725–1734 (1989).
- Lyon, G. J. & Muir, T. W. Chemical signaling among bacteria and its inhibition. Chem. Biol. 10, 1007–1021 (2003).
- Roychoudhury, S. et al. Inhibitors of two-component signal transduction systems: inhibition of alginate gene activation in Pseudomonas aeruginosa. Proc. Natl Acad. Sci. USA 90, 965–969 (1993).
- Merighi, M., Carroll-Portillo, A., Septer, A. N., Bhatiya, A. & Gunn, J. S. Role of Salmonella enterica serovar Typhimurium two-component system PreA/PreB in modulating PmrA-regulated gene transcription. J. Bacteriol. 188, 141–149 (2006).
- Bearson, B. L. & Bearson, S. M. The role of the QseC quorum-sensing sensor kinase in colonization and norepinephrine-enhanced motility of Salmonella enterica serovar Typhimurium. Microb. Pathog. 12 Oct 2007 (doi:10.1016/j.micpath.2007.10.001).
- Callaway, T. R. et al. Social stress increases fecal shedding of Salmonella typhimurium by early weaned piglets. Curr. Issues Intest. Microbiol. 7, 65–71(2006).
- Weiss, D. S. et al. In vivo negative selection screen identifies genes required for Francisella virulence. Proc. Natl Acad. Sci. USA 104, 6037–6042 (2007).
- Scheckelhoff, M. R., Telford, S. R., Wesley, M. & Hu, L. T. Borrelia burgdorferi intercepts host hormonal signals to regulate expression of outer surface protein A. Proc. Natl Acad. Sci. USA 104, 7247–7252 (2007).
- Valet, P. et al. Characterization and distribution of α2-adrenergic receptors in the human intestinal mucosa. J. Clin. Invest. 91, 2049–2057 (1993).
- Remaury, A., Larrouy, D., Daviaud, D., Rouot, B. & Paris, H. Coupling of the α2-adrenergic receptor to the inhibitory G-protein Gi and adenylate cyclase in HT29 cells. Biochem. J. 292, 283–288 (1993).
- Buchman, A. L. et al. Clonidine reduces diarrhea and sodium loss in patients with proximal jejunostomy: a controlled study. J. Parenter. Enteral. Nutr. 30, 487–491 (2006).
- Zaborina, O. et al. Dynorphin activates quorum sensing quinolone signaling in Pseudomonasaeruginosa. PLoS Pathog. 3, e35 (2007). First report of the dynorphin regulation of bacterial pathogenesis and cross-signalling with QS.
- Reading, N. C. & Sperandio, V. Quorum sensing: the many languages of bacteria. FEMS Microbiol. Lett. 254, 1–11 (2006).
- Yoon, S. S. et al. Pseudomonas aeruginosa anaerobic respiration in biofilms: relationships to cystic fibrosis pathogenesis. Dev. Cell 3, 593–603 (2002).
- Singh, P. K. et al. Quorum-sensing signals indicate that cystic fibrosis lungs are infected with bacterial biofilms. Nature 407, 762–764 (2000).
- Downward, J. The ins and outs of signalling. Nature 411, 759–762 (2001).
- Shiner, E. K., Rumbaugh, K. P. & Williams, S. C. Interkingdom signaling: deciphering the language of acyl homoserine lactones. FEMS Microbiol. Rev. 29, 935–947 (2005).
- Williams, S. C. et al. Pseudomonas aeruginosa autoinducer enters and functions in mammalian cells. J. Bacteriol. 186, 2281–2287 (2004).
- DiMango, E., Zar, H. J., Bryan, R. & Prince, A. Diverse Pseudomonas aeruginosa gene products stimulate respiratory epithelial cells to produce interleukin-8. J. Clin. Invest. 96, 2204–2210 (1995).
- Chhabra, S. R. et al. Synthetic analogues of the bacterial signal (quorum sensing) molecule N-(3-oxododecanoyl)-l-homoserine lactone as immune modulators. J. Med. Chem. 46, 97–104 (2003).
- Ritchie, A. J., Yam, A. O., Tanabe, K. M., Rice, S. A. & Cooley, M. A. Modification of in vivo and in vitro T- and B-cell-mediated immune responses by the Pseudomonas aeruginosa quorumsensing molecule N-(3-oxododecanoyl)-l-homoserine lactone. Infect.Immun. 71, 4421–4431 (2003).
- Ritchie, A. J. et al. The Pseudomonas aeruginosa quorum-sensing molecule N-3-(oxododecanoyl)l-homoserine lactone inhibits T-cell differentiation and cytokine production by a mechanism involving an early step in T-cell activation. Infect. Immun. 73, 1648–1655 (2005).
- Pritchard, D. I. et al. Alleviation of insulitis and moderation of diabetes in NOD mice following treatment with a synthetic Pseudomonas aeruginosasignal molecule, N-(3-oxododecanoyl)-l-homoserine lactone. Acta Diabetol. 42, 119–122 (2005).
- Mota, L. J. & Cornelis, G. R. The bacterial injection kit: type III secretion systems. Ann. Med. 37, 234–249 (2005).
- Tateda, K. et al. The Pseudomonas aeruginosa autoinducer N-3-oxododecanoyl homoserine lactone accelerates apoptosis in macrophages and neutrophils. Infect. Immun. 71, 5785–5793 (2003).
- Horikawa, M. et al. Synthesis of Pseudomonas quorum-sensing autoinducer analogs and structural entities required for induction of apoptosis in macrophages. Bioorg. Med. Chem. Lett. 16, 2130–2133 (2006).
- Shiner, E. K. et al. Pseudomonas aeruginosa autoinducer modulates host cell responses through calcium signalling. Cell. Microbiol. 8, 1601–1610 (2006).
- Li, L., Hooi, D., Chhabra, S. R., Pritchard, D. & Shaw, P. E. Bacterial N-acylhomoserine lactone-induced apoptosis in breast carcinoma cells correlated with down-modulation of STAT3. Oncogene 23, 4894–4902 (2004).
- Zimmermann, S. et al. Induction of neutrophil chemotaxis by the quorum-sensing molecule N-(3-oxododecanoyl)-l-homoserine lactone. Infect. Immun. 74, 5687–5692 (2006).
- Smith, R. S. et al. IL-8 production in human lung fibroblasts and epithelial cells activated by the Pseudomonas autoinducer N-3-oxododecanoyl homoserine lactone is transcriptionally regulated by NF-κB and activator protein-2. J. Immunol. 167, 366–374 (2001).
- Smith, R. S., Harris, S. G., Phipps, R. & Iglewski, B. The Pseudomonas aeruginosa quorumsensing molecule N-(3-oxododecanoyl) homoserine lactone contributes to virulence and induces inflammation in vivo. J. Bacteriol. 184, 1132–1139 (2002).
- Smith, R. S., Kelly, R., Iglewski, B. H. & Phipps, R. P. The Pseudomonas autoinducer N-(3oxododecanoyl) homoserine lactone induces cyclooxygenase-2 and prostaglandin E2 production in human lung fibroblasts: implications for inflammation. J. Immunol. 169, 2636–2642 (2002).
- Rumbaugh, K. P. Convergence of hormones and autoinducers at the host/pathogen interface. Anal. Bioanal. Chem. 387, 425–435 (2007).
- Yang, F. et al. Quorum quenching enzyme activity is widely conserved in the sera of mammalian species. FEBS Lett. 579, 3713–3717 (2005).
- Chun, C. K., Ozer, E. A., Welsh, M. J., Zabner, J. & Greenberg, E. P. Inactivation of a Pseudomonas aeruginosa quorum-sensing signal by human airway epithelia. Proc. Natl Acad. Sci. USA 101, 3587–3590 (2004). First report of mammalian cell inactivation of bacterial AHLs.
- Khersonsky, O. & Tawfik, D. S. Structure-reactivity studies of serum paraoxonase PON1 suggest that its native activity is lactonase. Biochemistry 44, 6371–6382 (2005).
- Draganov, D. I. et al. Human paraoxonases (PON1, PON2, and PON3) are lactonases with overlapping and distinct substrate specificities. J. Lipid Res. 46, 1239–1247 (2005). First report that PONs are responsible for AHL inactivation.
- Ozer, E. A. et al. Human and murine paraoxonase 1 are host modulators of Pseudomonas aeruginosa quorum-sensing. FEMS Microbiol. Lett. 253, 29–37 (2005).
- Stoltz, D. A. et al. Paraoxonase-2 deficiency enhances Pseudomonas aeruginosa quorum sensing in murine tracheal epithelia. Am. J. Physiol. Lung Cell. Mol. Physiol. 292, L852–L860 (2007).
- Zhang, R. G. et al. Structure of a bacterial quorum-sensing transcription factor complexed with pheromone and DNA. Nature 417, 971–974 (2002). First crystal structure of the bacterial AHL receptor TraR.
- Vannini, A. et al. The crystal structure of the quorum sensing protein TraR bound to its autoinducer and target DNA. EMBO J. 21, 4393–4401 (2002).
- Yao, Y. et al. Structure of the Escherichia coli quorum sensing protein SdiA: activation of the folding switch by acyl homoserine lactones. J. Mol. Biol. 355, 262–273 (2006).
- Bottomley, M. J., Muraglia, E., Bazzo, R. & Carfi, A. Molecular insights into quorum sensing in the human pathogen Pseudomonas aeruginosa from the structure of the virulence regulator LasR bound to its autoinducer. J. Biol. Chem. 282, 13592–13600 (2007).
- Ho, Y. S., Burden, L. M. & Hurley, J. H. Structure of the GAF domain, a ubiquitous signaling motif and a new class of cyclic GMP receptor. EMBO J. 19, 5288–5299 (2000).
- Harper, S. M., Neil, L. C. & Gardner, K. H. Structural basis of a phototropin light switch. Science 301, 1541–1544 (2003).
- Gu, Y. Z., Hogenesch, J. B. & Bradfield, C. A. The PAS superfamily: sensors of environmental and developmental signals. Annu. Rev. Pharmacol. Toxicol. 40, 519–561 (2000).
- Dioum, E. M. et al. NPAS2: a gas-responsive transcription factor. Science 298, 2385–2387 (2002).
- Wu, L. et al. Recognition of host immune activation by Pseudomonas aeruginosa. Science 309, 774–777 (2005).
- Bader, M. W. et al. Recognition of antimicrobial peptides by a bacterial sensor kinase. Cell 122, 461–472 (2005).
- Bauer, W. D. & Mathesius, U. Plant responses to bacterial quorum sensing signals. Curr. Opin. Plant Biol. 7, 429–433 (2004).
- Mathesius, U. et al. Extensive and specific responses of a eukaryote to bacterial quorum-sensing signals. Proc. Natl Acad. Sci. USA 100, 1444–1449 (2003). Extensive report of bacteria–plant cross-hormonal signalling.
- Lugtenberg, B., Tikhonovich, I. & Provorov, N. (eds) Biology of Molecular Plant–Microbe Interactions Vol. 4 (IS-MPMI, Minnesota, 2004).
- Manefield, M. et al. Halogenated furanones inhibit quorum sensing through accelerated LuxR turnover. Microbiology 148, 1119–1127 (2002).
- Chevrot, R. et al. GABA controls the level of quorum-sensing signal in Agrobacterium tumefaciens. Proc. Natl Acad. Sci. USA 103, 7460–7464 (2006).
- Keshavan, N. D., Chowdhary, P. K., Haines, D. C. & Gonzalez, J. E. l-Canavanine made by Medicago sativa interferes with quorum sensing in Sinorhizobium meliloti. J. Bacteriol. 187, 8427–8436 (2005).
- Persson, T. et al. Rational design and synthesis of new quorum-sensing inhibitors derived from acylated homoserine lactones and natural products from garlic. Org. Biomol. Chem. 3, 253–262 (2005).
- Perret, X., Staehelin, C. & Broughton, W. J. Molecular basis of symbiotic promiscuity. Microbiol. Mol. Biol. Rev. 64, 180–201 (2000).
- Iyer, L. M., Aravind, L., Coon, S. L., Klein, D. C. & Koonin, E. V. Evolution of cell–cell signaling in animals: did late horizontal gene transfer from bacteria have a role? Trends Genet. 20, 292–299 (2004).
- Coon, S. L. et al. Pineal serotonin N-acetyltransferase: expression cloning and molecular analysis. Science 270, 1681–1683 (1995).
EVOLUTION OF COOPERATION AND CONTROL OF CHEATING IN A SOCIAL MICROBE88
Joan E. Strassmann89,90and David C. Queller90
Abstract
Much of what we know about the evolution of altruism comes from animals. Here, we show that studying a microbe has yielded unique insights, particularly in understanding how social cheaters are controlled. The social stage of Dictylostelium discoideum occurs when the amoebae run out of their bacterial prey and aggregate into a multicellular, motile slug. This slug forms a fruiting body in which about a fifth of cells die to form a stalk that supports the remaining cells as they form hardy dispersal-ready spores. Because this social stage forms from aggregation, it is analogous to a social group, or a chimeric multicellular organism, and is vulnerable to internal conflict. Advances in cell labeling, microscopy, single-gene knockouts, and genomics, as well as the results of decades of study of D. discoideum as a model for development, allow us to explore the genetic basis of social contests and control of cheaters in unprecedented detail. Cheaters are limited from exploiting other clones by high relatedness, kin discrimination, pleiotropy, noble resistance, and lottery-like role assignment. The active nature of these limits is reflected in the elevated rates of change in social genes compared with nonsocial genes. Despite control of cheaters, some conflict is still expressed in chimeras, with slower movement of slugs, slightly decreased investment in stalk compared with spore cells, and differential contributions to
___________
88 Reprinted with permission from PNAS. Edited by John C. Avise, University of California, Irvine, CA, and approved March 30, 2011 (received for review February 11, 2011).
89 Ecology and Evolutionary Biology, Rice University, Houston, TX 77005.
90 To whom correspondence should be addressed. E-mail: strassm@rice.edu.
Author contributions: J.E.S. and D.C.Q. designed research; performed research; and wrote the paper.
This paper results from the Arthur M. Sackler Colloquium of the National Academy of Sciences, “In the Light of Evolution V: Cooperation and Conflict,” held January 7–8, 2011, at the Arnold and Mabel Beckman Center of the National Academies of Sciences and Engineering in Irvine, CA. The complete program and audio files of most presentations are available on the NAS Web site at www.nasonline.org/SACKLER_cooperation.
The authors declare no conflict of interest.
This article is a PNAS Direct Submission.
stalk and spores. D. discoideum is rapidly becoming a model system of choice for molecular studies of social evolution.
Natural selection favors cooperation when genes underlying it increase in frequency compared with their non-cooperative counterparts (Frank, 1998; Hamilton, 1964; West et al., 2007). Evolutionary studies of cooperative interactions have focused on the selective advantages of cooperating, how cooperation is organized, whether cheating a cooperative system can occur, and how cheaters are controlled (Beekman and Ratnieks, 2003; Griffin et al., 2004; Ratnieks, 1990; Ratnieks et al., 2006; Sachs et al., 2004; Tavisano and Velicer, 2004; Wenseleers and Tatnieks, 2006; West et al., 2002). These studies generally, but not always, focus on within-species interactions and have been behaviorally oriented. Social insects have been a major focus (Bourke and Franks, 1995; Robinson, 2002; Strassmann and Queller, 2007), with cooperative birds and mammals also getting considerable attention (Clutton-Brock et al., 2001; Cockburn, 1998; Cornwallis et al., 2010). The past few decades have seen phenomenal progress in understanding cooperation in these organisms by applying the powerful logic of kin selection (Frank, 1998; Queller, 1992; West et al., 2007).
Our advances in understanding the evolution of social behavior through kin selection have been very satisfying, but they have been isolated in some respects. This is because most organisms have not been seen to be particularly cooperative. They may come together briefly for mating but, otherwise, go about the business of securing nutrients, avoiding disease and predation, and producing progeny largely on their own.
Cooperation Is Widespread
Behavioral ecologists have begun to study a wider selection of organisms and are finding cooperative interactions to be much more pervasive than previously appreciated. This is particularly true for microbes, wherein the structured environments necessary for cooperation have been discovered to be pervasive (Griffin et al., 2004; Kerr et al., 2002; Vos and Velicer, 2009). Microbes are particularly affected by the actions of their neighbors, because many functions that are internal in multicellular organisms are external in single-celled organisms. Secreted compounds involved in processes like iron sequestration or food digestion are vulnerable to exploitation by neighboring individuals (Buckling et al., 2007; Travisano and Velicer, 2004; West et al., 2007). Microorganisms evaluate their numbers with quorum sensing, kill nonclonemates with bacteriocins, hunt in groups, and cooperatively swarm through their environment, to name just a few examples of their social attributes (Crespi, 2001; Diggle et al., 2007; Maynard and Szathmáry, 1995; Riley and Wertz, 2002; West et al., 2007). Sociality in nontraditional study organisms is only beginning to be understood, however.
Cooperation, Organismality, and Major Transitions in Evolution
The second reason for expanded interest in cooperation is a growing appreciation that it is important for how organisms came to be. Cooperative major transitions in life alter the raw material for natural selection in fundamental ways (Buss, 1987; Maynard and Szathmáry, 1995). One of the earliest transitions brought molecules together into cells in which the fates of all were intertwined in a cooperative network. Eukaryotes themselves represent a major transition resulting from the capture of a bacterium that becomes the mitochondrion (Margulis, 1970). The level of cooperation between these partners is profound but not complete. Mitochondria are maternally inherited and do not go through meiosis, and thus will favor daughter production and have no interest in son production.
Another major transition resulted in multicellularity (Herron and Michod, 2008; Gossberg and Strathmann, 1998; Queller, 1997, 2000; Strassmann and Queller, 2010). Multicellularity has evolved multiple times in both bacterial and eukaryote lineages. Animals and plants have elaborated multicellularity into a plethora of diverse types. There are also a number of comparatively simple multicellular forms, like some single-species biofilms, the algal group Volvocales, or Dictyostelium (Herron and Michod, 2008; Strassmann and Queller, 2010). The transition to multicellularity is different from the transition to eukaryotes because the former involves an aggregate of like entities, whereas the latter binds different elements. The major transitions can thus be categorized as fraternal, with like cooperating with like, or egalitarian, where the cooperating units bring different things to the collaboration (Queller, 1997). Either kind of collaborative organism will usually retain conflicts, but these conflicts must be controlled if the partnership is to survive. How these controls operate is a major research topic under this view of life.
The selective factors that favored a past transition are not easy to study because they have already completed their work. There are living systems that could be considered to be more representative of transitional stages, however. These, we believe, may be the most productive for investigation into the advantages of cooperation and how conflict is controlled. We have argued elsewhere that organisms themselves can be defined as adapted bundles of cooperative elements, wherein actual conflict is at a minimum (Queller and Strassmann, 2009; Strassmann and Queller, 2010). In a 2D space, with one axis being cooperation and the other being conflict, organisms are those collaborative living units at the high end of cooperation and the low end of conflict. There is variation in the level of organismality, however, and those lacking complete cooperation and retaining conflict represent the best choices for studying the origins of cooperation.
Laboratory-Friendly, Social Model Organism
Kin selection has been very successful for generating predictions on the impact of queen number, mate number, and caste on sociality in social insects (Bourke, 2011; Bourke and Franks, 1995). Nevertheless, one would have to say
that social insects fall short as an ideal model for studies of social evolution. They are long-lived, often do poorly in the laboratory (except ants), are not amenable to genetic experimentation, and have mostly already crossed the threshold to obligate sociality. Thus, social evolution research has not found its Drosophila here.
Another problem with the organisms currently favored for studies of cooperation is that the actual genes underlying cooperative behavior are elusive. This is particularly true for long-lived social insects and vertebrates, although the advances of genomics are slowly mitigating this (Robinson, 2002; Weinstock et al., 2006). Still, the twin powers of experimental evolution and single-gene knockouts are beyond the reach of most currently studied social organisms.
A social evolution Drosophila would need to address these issues; thus, it would probably be single-celled. In addition to being amenable for experimental evolution and single-gene knockouts, it should have full altruism, with some individuals dying to help others. This makes it easier to interpret the actions of different partners. Other attributes of the ideal social Drosophila include feasibility of study in a fairly natural environment, placement in a rich phylogeny with related species that vary in social traits, a sequenced set of genomes, and a collegial community of fellow investigators. Here, we make the case that the ideal model organism for social evolution has been found and is the social amoeba Dictyostelium discoideum. This choice is supported by the enormous progress in understanding social evolution that has been made with this organism in the past decade. In addition to D. discoideum, Volvox and its relatives are great for studying the origins of multicellularity in a clonal organism (Herron and Michod, 2008). Myxococcus xanthus offers all the advantages of a bacterial system (Velicer and Stredwick, 2002). There are also others, but we focus here on D. discoideum (Figure A20-1).
Dictyostelium discoideum as a Model System for Cooperation
What Is a Social Amoeba?
Social amoebae are in the eukaryote kingdom Amoebozoa, sister to the Opisthokonts, or animals plus fungi (Baldauf et al., 2000). This kingdom is composed of solitary amoebae like Entamoeba and Acathamoeba, the acellular slime molds like Physarum, and the Dictyostelidae. There are over 100 species of Dictyostelium, divided into four major taxonomic groups (Raper, 1984; Schaap et al., 2006). D. discoideum is in group four and is the focal species here.
Individual amoebae of D. discoideum live in the upper layers of soil and leaf litter in the eastern Northern Hemisphere and in eastern Asia. The most intensely studied clone, NC4, and its derivatives like A194, come from a temperate forest near Mount Mitchell in western North Carolina (Raper, 1984). D. discoideum amoebae are solitary predators on bacteria, which they consume by engulfment (Bonner, 1967). Although this is usually viewed as a solitary stage,

FIGURE A20-1 D. discoideum fruiting bodies on an agar plate.
they are always able to sense the density of nearby amoebae with a molecule called prestarvation factor (Kessin, 2001). Response to this factor is inhibited when bacteria are present (Kessin, 2001). When bacteria get scarce, and amoeba density is sufficient, they enter one of two stages, a sexual one, discussed later, or a social one (Figure A20-2).
Social Cycle
The social stage, often called the developmental stage, occurs when D. discoideum amoebae begin to starve (Figure A20-2). Amoebae have a quorumsensing mechanism; if there are enough other amoebae in the area, they begin to release cAMP and to make receptors to it, products of the CAR genes (Alvarez-Curto et al., 2005; Kessin, 2001). A signal relay system causes the amoebae to move up the cAMP gradient and form a mound of hundreds of thousands of cells. Differentiation begins in the mound stage, wherein some cells sort out toward the tip and express prestalk genes. The tip becomes the anterior of the slug and organizes forward movement. During movement, cells are lost from the slug posterior. At least some of these are capable of dedifferentiating and consuming any bacteria encountered (Kuzdzal-Fick et al., 2007). The slug itself will not fall apart
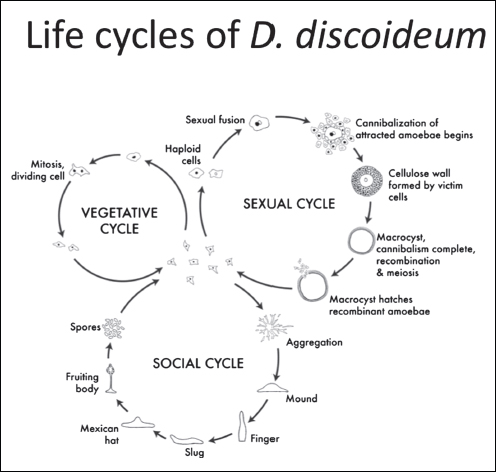
FIGURE A20-2 Colony cycles of D. discoideum. This study focuses on the social cycle, but the sexual cycle is a promising area for future study.
on encountering bacteria. Some shed cells are former sentinel cells, full of toxins and bacteria mopped up as they traversed through the slug (Chen et al., 2007).
The multicellular slug moves toward heat and light and away from ammonia (Bonner, 2006; Kessin, 2001). The cells at the tip then migrate down through the center of the aggregate and initiate stalk formation in a process called culmination. The stalk cells vacuolate and die, forming sturdy cellulose walls in the process that give them the strength to hold up the spherical ball of spores. The final fruiting body consists of about 20% stalk cells and 80% spore cells. Thus, the social stage is triggered by starvation and involves altruism, because the stalk cells die to support the spore cells (Kessin, 2001).
D. discoideum arrives at multicellularity not through development from a single cell but through aggregation of dispersed cells. Therefore, the social stage of D. discoideum is vulnerable to cheaters. This makes it fundamentally different
from a metazoan that has gone through a single-cell bottleneck and had the interests of all cells in the organism reset to complete cooperation every generation (Maynard Smith, 1989). This conflict, its control, and the resulting cooperation are what make D. discoideum such a great model for social evolution.
Why Have a Social Stage?
During the social process, three things happen, and we predict that all three are adaptive. First, spores are made. The adaptive value of a hardy spore is clear and has been demonstrated; it is not easily digested by predators and can withstand long periods of cold, heat, or drought (Raper, 1984). Second, the spores are only made atop a relatively long stalk composed of dead cells. These stalks can be anywhere from 1 to about 4 mm long, and their construction is the most vital part of the altruism story of D. discoideum. Why are spores made only atop stalks? It could be that cells are vulnerable during the transformation to spore, and doing so atop a stalk protects them from hazards in the soil. Another possibility is that dispersal is facilitated when the spores are lifted above the soil and that this is the main purpose of the stalk. In D. discoideum, spores are likely to be actively transported on small invertebrates, although the guts of vertebrates and stalks could increase the chance that they are contacted. The third advantage to grouping is slug movement; slugs move farther than amoebae, which could position them into a better place for dispersal. The complex orchestration of fruiting body formation could only have arisen through natural selection, but more work on the actual advantages is needed. In this review, we focus on the interactions of genetically different clones in this social process and not on the reasons why it is adaptive.
Chimerism and Cheating the Social Contract
Mixing of two or more genetically distinct clones is likely for social groups that form by aggregation. To see if this actually occurs, we collected tiny soil samples of 0.2 g at Mountain Lake Biological Station (Fortunato et al., 2003). We reasoned that this was a reasonable scale over which social aggregation might occur. We found that our 0.2-g samples contained zero to five clones and that relatedness within the samples was about 0.52. These data support the view that chimerism is possible, at least in this population.
Later, we were able to find and genotype individual wild-fruiting bodies collected from the very rich resource of deer dung and nearby soil. This approach gave much higher relatednesses, between 0.86 and 0.98 depending on the sample and technique (Gilbert et al., 2007). Thus, relatedness is clearly high enough for kin selection under reasonable values of costs and benefits, and chimerism is common enough for social competition to be favored evolutionarily. Nevertheless, for cooperation to occur, there must be control of cheating. Here, we discuss what cheating is and then move on to evidence for it and its control in D. discoideum.
Complications with Defining Cheating
Cheating can only happen when one organism takes advantage of another; however, it is more than that. We would not say the lion cheated the gazelle out of its life with the lion’s pounce and suffocating bite. This is because there is no expectation that the lion would behave in any other way. So, for an exploitative behavior to be considered cheating, there must be some expectation of cooperation that is not met. Cheating, therefore, is a fundamentally social action that takes place in the context of ordinarily cooperative acts, which the cheater somehow violates.
In D. discoideum, we talk of cheating in the context of cell allocation to the somatic, dead stalk and the living spores. The expected social contract is that the frequency of each clone among the spores will be the same as it was in the original mixture of aggregated cells. The same should be true in the stalk tissue. If this is not the case, we can say that the dominant clone cheated the minority clone by getting more than its fair share into spores, and cooperation can be put at risk when cheaters gain an advantage.
In many kinds of interactions, the starting and ending frequency may be viewed as enough information to determine if one partner is cheating the other. The formation of a fruiting body from an initial population of spores is a process that could vary for reasons other than social competition, however. Some clones may make longer or more robust stalks than others when they are entirely on their own. Some clones may migrate farther than others, losing cells in the process. Some clones may lose more cells from the slug than others even if they migrate the same distance. Variation is particularly expected in the highly variable environment of the soil. For example, a loose-grained soil may favor longer stalks for a given number of cells than a tighter grained soil if the adapted trait is to rise above the surface. Selection on these traits can occur independent of cheating but then have consequences in chimeras. If one clone in isolation allocates more to spore and continues to do so in the chimera with another clone that allocates less to spore, the first clone may then be viewed as a cheater, although it has behaved no differently in the chimera.
We will argue that even this case should be called cheating, because one clone does take advantage of the other. It might even have evolved for that purpose: Selection in chimeras could have favored variants that do suboptimal things on their own. We call this type of cheating “fixed,” following Buttery et al. (2009). Cheating that results from behavior different from what they would do when clonal, in recognition that there is a partner to cheat, we then call “facultative” (Figure A20-3). If the only information we have is how they behave in a chimera compared with starting frequencies, we cannot distinguish between these two and just call it “cheating.”
It is probably worth pointing out that we are not implying any sort of conscious awareness to cheating in D. discoideum. In humans, cheating is value-based
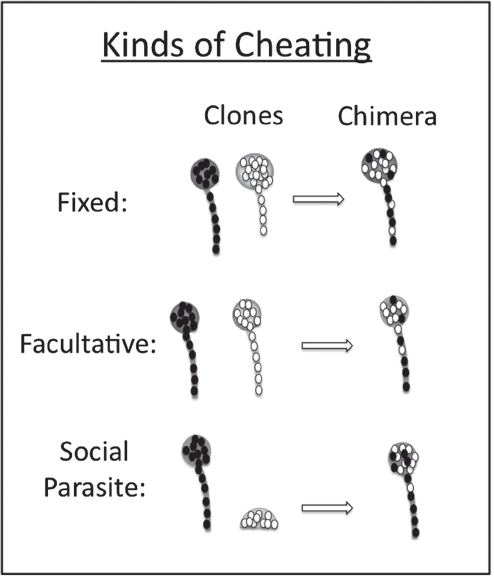
FIGURE A20-3 In the social stage, clones may take advantage of their partner in three different ways. They may allocate cells to spore and stalk in the same proportions as alone but allocate less to stalk than their partner, fixed cheating. They may modify their behavior in chimera to take advantage of their partner, facultative cheating. Third, a social parasite can only make fruiting bodies in chimera with a victim.
and assumes a certain awareness of the moral grounds of an act. This, of course, is impossible in an organism lacking a nervous system.
Evidence for Cheating in D. discoideum
Do Wild Clones Cheat?
When wild clones are mixed together, one clone often prevails over the other (Strassmann et al., 2000). Furthermore, there is a transitive hierarchy of cheaters (Buttery et al., 2009; Fortunato et al., 2003). In all these cases, the clones are perfectly able to produce fruiting bodies with normal, although variable, spore/stalk ratios as pure clones. Buttery et al. (Buttery et al., 2009) found both fixed and facultative cheating among the clones.
Other evidence for social conflict among wild clones in the social stage comes from comparing chimeras with pure clones in their ability to migrate as slugs and to form tall fruiting bodies (Figure A20-4). Chimeric slugs move less far than clonal slugs when cell number is controlled (Foster et al., 2002). This
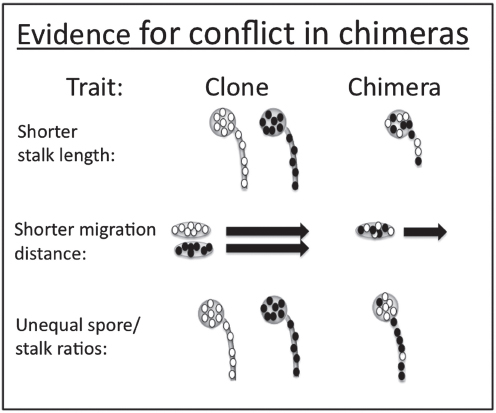
may be the result of increased competition to stay out of the front control region that becomes the sterile stalk. The other effect is that there are more spore cells in chimeric mixtures, presumably because there is less selective benefit to becoming a stalk to lift nonrelatives (Buttery et al., 2009).
Cheating by Single-Gene Knockouts
Nearly all the research by cell, developmental, and molecular biologists on D. discoideum has used a single clone, or descendants of that clone. This means that these studies could not reveal cheating even if it were common. The exception is that they could reveal circumstances under which a clone with a single gene that was knocked out cheated its immediate ancestor. Kessin and colleagues (Ennis et al., 2000) did just such a study. They made a large random collection of clones that each had a single gene disrupted by restriction enzyme-mediated integration (REMI), a process that randomly inserts a known sequence containing both restriction cut sites, and an antibiotic resistance gene (Kuspa and Loomis, 1992). Kessin and colleagues (Ennis et al., 2000) put a pool of REMI knockouts through 20 generations of selection in a well-mixed (low-relatedness) environment. At each round, they harvested the spores and began the next round from them; thus, any clone that cheated the others increased in frequency over these rounds. They then characterized one mutant, fbxA. The fbxA knockout cheats its ancestor but cannot make spores on its own.
Pools of REMI mutants can also be screened to obtain cheaters that are able to make normal fruiting bodies on their own but cheat their ancestor in a chimera. A large study of this type used pools of REMI mutants and required that every mutant be able to fruit on its own (Santorelli et al., 2008). This approach identified over 100 different knockout mutants that cheated their ancestor. If knockout cheaters are so easy to generate and cheating is advantageous, one has to ask why these genes have not lost function in the wild. We discuss the answer to this question below in the section on the control of cheating.
Control of Cheating
When wild clones come together in the social stage, cheating occurs between pairs of co-occurring wild clones. This could be the result of genetic or environmental factors. The work on single-gene knockouts suggests that at least some of the differences are genetic. Why are genes underlying victim status not eliminated from the population? We think the answer lies in the ways cheating is controlled. It can be controlled by high relatedness within social groups, which could result from kin discrimination. It can be controlled by positive pleiotropy, wherein a cooperation gene also has another essential function. Cheating can also be controlled if spore vs. stalk fate is the result of environmental rather than genetic factors. For example, spore fate could be the result of position in the
mitotic cell cycle or it could be dependent on who starved first. Here, we take up these issues (Figure A20-5).
Control of Cheating by High Relatedness
Cheaters can be controlled if relatedness within social groups is high enough. This is because the benefits of the sacrifice that stalk cells make will mostly go to relatives, and thus could be favored under kin selection. The importance of high relatedness can be seen in an experiment that used the knockout cheater fbxA (Gilbert et al., 2007). In this study, we showed that at low relatedness, the fbxA cheater knockout wins within groups at all mixture frequencies. This means that it should increase in frequency in the population. There is a tradeoff, however. The higher the frequency of the cheater in a group, the lower the spore production becomes, hurting the fbxA knockout and WT alike within that group. This means that the cheater knockout can only flourish at low relatedness because at high relatedness, it is selected against by its own compromised spore production.
We expect social parasites like this one to fail in nature because of the high relatedness within fruiting bodies found in the wild. If this is true, we should not find any clones within wild fruiting bodies that are unable to form fruiting bodies on their own. We tested this by plating cells from wild fruiting bodies clonally. Of 3,316 clonal isolates from 95 wild fruiting bodies, all were able to make completely normal fruiting bodies on their own. There was not a single social parasite like fbxA. Clearly, high relatedness within fruiting bodies is a powerful evolutionary deterrent to cheating. This does not mean cheater mutants that are competent on their own are equally controlled, however (Santorelli et al., 2008).
Control of Cheating by Kin Discrimination
One way of achieving high relatedness is to exclude nonkin from the group. This behavior could explain the difference in relatedness between small soil samples and fruiting bodies. Different clones might aggregate together to cAMP and then sort into genetically homogeneous slugs. Even different species coaggregate to cAMP and then separate (Jack et al., 2008); thus, it is not unreasonable to postulate a similar process within species.
Studies of chimerism between two clones of D. discoideum have generally found fairly homogeneous mixing, however (Butter et al., 2009; Fortunato et al., 2003; Strassmann et al., 2000). A couple of studies found some evidence for sorting, particularly between clones collected far apart (Ostrowski et al., 2008) or, in another study, particularly between clones found close together (Flowers et al., 2010). Neither approached the levels of sorting found in another species, Dictylostelium purpureum (Mehdilabadi et al., 2006).
At this point, we have a puzzle. Tiny soil samples have multiple clones of D. discoideum, but fruiting bodies are nearly clonal. Kin discrimination is weak
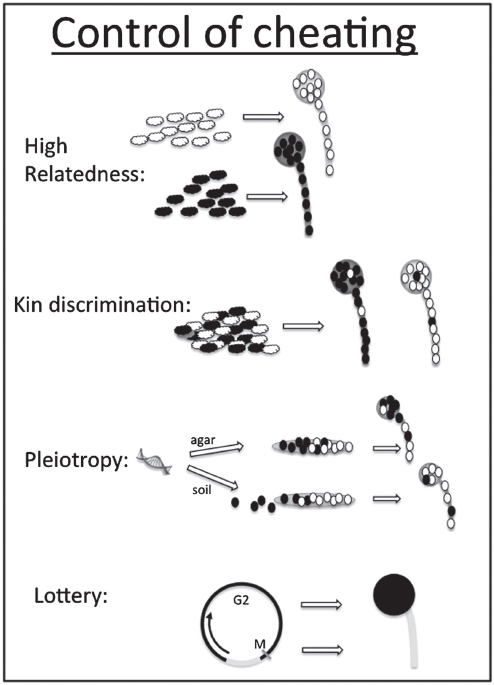
FIGURE A20-5 Cheating can be controlled in the social stage if fruiting bodies are clonal, as might happen if they arise from different patches. They may mix but then sort into nearly clonal fruiting bodies through kin discrimination. Pleiotropic effects may prevent cheating genes from spreading. Caste fate may be determined through a lottery, with cells in the M or S stage of the cell cycle becoming stalk and those in the G2 stage becoming spore. D. discoideum apparently has no G1 stage, although this is controversial.
as far as we can tell in laboratory mixtures of equal numbers of cells from two clones. The finding of an apparently selected molecular mechanism for sorting deepens the puzzle. Our supposition that sorting will occur in the aggregation stage or later means that cells are likely to discriminate when they are in direct contact with each other. This suggests that adhesion genes are likely candidates for recognition. To function as recognition genes, adhesion genes would have to be highly variable. The variability would provide an opportunity for discrimination that favors others carrying the same adhesion protein variant over others carrying different forms of the molecule. They should recognize self, with a homophilic binding site, or they should recognize a highly variable receptor.
There is excellent evidence that two cell adhesion genes, initially called lagC and lagB but now called tgrC and tgrB, are the kin discrimination genes in D. discoideum (Benabentos et al., 2009). These two genes are extremely variable and are part of a large gene family of generally much less variable genes. The protein produced by tgrC is hypothesized to adhere to the protein produced by tgrB. If one is knocked out, it causes development to fail at the aggregation stage. In that case, the amoebae aggregate begins to make a mound but then falls apart, as if a crucial component of recognition necessary for the subsequent altruistic steps were missing. The temporal coexpression, knockout behavior, high variability, and impact on sorting make these likely kin recognition genes. More work is clearly needed on this system to see if there are consequences of recognition other than sorting. It could be that it is advantageous to remain in the group but that the chimeric nature is recognized and responded to, causing reduced migration distances and shorter stalks, for example.
Control of Cheating by Pleiotropy
Pleiotropy means that a single gene has an impact on multiple phenotypic traits. It is therefore usually viewed as something that impedes selection on a specific trait, because any changes in the underlying genes will affect other traits as well. This conservative force in pleiotropic genes can have interesting consequences for social genes. If an altruistic trait is piggy-backed on an essential gene, a mutation that causes selfish behavior is unlikely to proliferate, because the essential function would also be lost.
Exactly how important this might be in social traits is unknown, because we know the genetic underpinnings for comparatively few traits. There are a couple of genes having an impact on altruism in D. discoideum that could be maintained through pleiotropy, however. They are from very different parts of the genetic landscape underlying altruism in D. discoideum. One is a cell adhesion gene, and the other is involved in the differentiation-inducing factor (DIF-1) signaling system.
Cell adhesion is an essential part of the social process because it is how the multicellular group stays together (Kessin, 2001). Variation in adhesion can have
an impact on cell fate, because the cells at the front of the slug become stalk and the cells in the back three-quarters or so become spore (Bracco et al., 2000). One way of increasing the likelihood of becoming spore could therefore be to have reduced adhesion to the other cells and to slip back in the slug (Ponte et al., 1998; Queller et al., 2003). The knockout of the cell adhesion gene csaA has just this effect. When csaA is knocked out, adhesion is reduced. On agar, this has the impact of increasing the knockout’s frequency in the spores, presumably because reduced adhesion allows it to slip out of the stalk-forming tip (Ponte et al., 1998; Queller et al., 2003). On the more natural substrate of soil, however, csaA knockouts apparently do not hold together enough to get into aggregations. It is therefore no surprise that the csaA gene continues to be expressed normally and that cheater knockouts have not prospered.
Another gene that could be a cheater were it not for pleiotropic effects is dimA (Foster et al., 2004). This gene was isolated in a screen of REMI mutants that are unresponsive to DIF-1, a small molecule that forces some cells to become stalk (more on this later). In chimeras with WT, dimA knockouts predominate in the prespore zone, presumably because they are insensitive to DIF (Thompson et al., 2004). Ultimately, however, they are in a minority in the actual spores. This could be true if they transdifferentiate from prespore cells to prestalk cells later in development, and this was shown to be the case (Foster et al., 2004). We interpreted this to be the result of another unknown function of dimA, an essential function that made the knockouts worse spore cells. This is another case in which pleiotropy inhibits the spread of a cheater.
Control of Cheating by Lottery
When two or more individuals take unequal roles in a social interaction, with one being the recipient and the other being the beneficiary, conflict can result. One way of controlling this conflict is if the partners do not know which role they will assume on entering the interaction. A human equivalent is called the veil of ignorance (Rawls et al., 1971), and it calls for resource allocation between partners by someone who does not know which lot he or she will get. A familiar example is the common family situation of dividing up a cake. If the child cutting the pieces does not get to decide which piece he or she gets, under the veil of ignorance model, he or she will be more likely to make the pieces equally sized. Cheating could be controlled in D. discoideum if there were a lottery to become spore based on the cell cycle.
The D. discoideum cell cycle has a very short G1 phase; thus, immediately after the mitosis (M) phase, cells enter the synthesis (S) phase and cytokinesis occurs during the S phase (Weijer et al., 1984). Therefore, in a population, the cells in S and early growth after synthesis (G2) phases tend to be the smallest cells with the fewest nutrient reserves. An experiment on a thin layer of cells not touching other cells, followed with videography, indicated that stalk cells were
most likely to arise from cells that happened to be in the S or early G2 phase of the cell cycle at the time of starvation, whereas cells that happened to be in the late G2 phase became prespore (Gomer and Firtel, 1987). A variety of other experiments have also shown this (Araki et al., 1994; Azhar et al., 2001). If weaker cells are more likely to become stalk, this makes sense, because recently divided cells would have fewer nutrients. This cell cycle lottery system fits the veil of ignorance model. As cells encounter less and less food, however, it could be that those dividing earlier than others are selected against because these cells will be in the stage that sends them to stalk.
Another interesting result of this paper (Gomer and Firtel, 1987) suggests that delaying cell division may not be necessary for a cell to avoid becoming a stalk cell. This result was derived from careful observation of the fate of sister cells through videography. Every time a cell divided, one sister cell became prestalk or prespore according to the above musical chairs lottery mechanism, whereas the sister cell became a null cell, a third cell type that stained with neither prespore nor prestalk markers (Gomer and Firtel, 1987). The fate of these null cells is unclear. These null cells could become pstO, because that region of the slug also did not stain with prespore or prestalk markers. This region can be viewed as the most flexible area, with cells in that region remaining pstO on exposure to DIF, and perhaps becoming prespore otherwise. These interesting results remain controversial, however, and should be followed up on carefully (Jang and Gomer, 2011; Shauslsky and Loomis, 1993).
If a recently divided cell becomes stalk because it is smaller and weaker, cell division could be disfavored as starvation approached for this social reason. Under normal circumstances, however, amoebae will be selected to eat and proliferate as rapidly as possible. These two counterforces might achieve a compromise that could support altruism under a wide variety of conditions in D. discoideum, if one of two recently divided cells becomes stalk and the other becomes spore. This scenario is consistent with the data.
Control of Conflict by Power
We began the section on control of cheating with a discussion of social contracts and defined cheating as the violation of those contracts. In this case, we mean evolved contracts that favor the evolution of cooperation. One form of contract may be that the stronger individuals take the best roles. Here, we explore the evidence for this idea in D. discoideum.
First-Strike Power
One of the most common determinants of whether an individual in a social interaction becomes the altruist or the beneficiary is that individual’s relative strength, or ability to prevail in a contest. Such contests under social and
cooperative circumstances may look very similar to contests between nonsocial organisms for scarce resources like good territories. The difference is that if the contest is between relatives, or mutually dependent individuals, after the contest is decided, the loser may acquiesce and go to work for the winner. Such contests can be valuable for all concerned, particularly if weaker individuals that lose contests are more effective in taking on the helping role than they would be with the winning, reproductive role.
How do we evaluate power in D. discoideum interactions? In some ways, all predictors of fate also involve power. The lottery system has a power element, because cells that recently divided may be weaker and go to stalk. If becoming a spore cell is competitive, the first amoebae to depart from growth and binary fission and enter the social stage may get a head start on preparing their weapons. Under this hypothesis, the first to starve would become spore. That this is the case has been very nicely demonstrated in both an experiment that manipulates timing of starvation in genetically identical cells and an experiment that uses an aggregation-initiation knockout. In the first experiment, cells were put into nutrient-free medium 4 h apart. Those with the 4-h head-start in the social stage preferentially became spores (Kuzdzal-Fick et al., 2010). The other experiment used a knockout that was incapable of initiating aggregation but was capable of responding to the initial signal from others and relaying it (Huang et al., 1997). In this case, the single cell initiating aggregation became a spore.
Glucose Feeding, Condition, and Power
Power based on condition has also been studied directly by making chimeras of cells that were well-fed with cells that were poorly fed. This was done by varying the amount of glucose in the medium of axenically grown cells. The cells fed with glucose were more likely to become spore than the glucose-starved cells (Leache et al., 1974). This effect holds with other metabolizable sugars and is absent with other sugars (Takeuchi et al., 1986). This is strong support for the hypothesis, but there could be something special about sugars; thus, we repeated this experiment with a glucose treatment and added another treatment to separate cells. In this treatment, we stressed the cells by growing them in a more acid pH than usual (Castillo et al., 2011). We affirmed the weakening effects of both treatments by documenting that they increased doubling times in the solitary stage. As expected, both acid-stressed and glucose-starved cells ended up preferentially in the stalk. Both treatments also made fewer spores when grown alone, however; thus, the chimera results are not attributable to competition alone (Castillo et al., 2011).
DIF-1 and Power
One of the delights in working with a microbial system is the accessibility of mechanisms. Whether a cell becomes spore or stalk is mediated by DIF-1, a
small, secreted, chlorinated alkyl phenone (Kay, 1988). Stronger cells that are immune to its effects at biological levels produce DIF-1. Weaker cells can break it down but become stalk cells from its impact, mostly ending up in the lower cup or the basal disk, both of which are dead parts of the stalk (Thompson and Kay 2000a, 2000b). DIF-1 is unlikely simply to be a signal rather than a mediator of competition for several reasons. Signals are unlikely to include chlorine, something that is common for poisons. Levels of DIF-1 in the slug are about 62 nm (Kay, 1998), which is high, given that it can be lethal at concentrations as low as 200 nm (Masento, et al., 1988). Signals have receptors and poisons do not, and no receptor has ever been found for DIF-1. Its small, toxic nature is just what might be expected of a poison (Atzmony et al., 1997). Unlike most morphogens, it is distributed evenly through the social stage and varies on its cell-specific impact (Chattwood and Thompson, 2009; Kay and Thompson, 2009; Parkinson et al., 2011). In some respects, it is a tame poison, incorporated into social life to mediate condition in a homogeneous mixture into different cell fates.
The condition variants resulting from position in the cell cycle or glucose feeding are tied to DIF-1 levels with weaker, more recently divided cells more vulnerable to DIF-1. There are single-gene knockouts with an impact on cell cycle and nutritional responses that further support the involvement of DIF-1, in a story nicely summarized by Chattwood and Thompson (Chattwood and Thompson, 2011). Cells that have rtoA knocked out lose the specificity toward stalk of the M and/or S cell cycle phase, producing fruiting bodies that are mostly stalk with tiny spore heads (Wood et al., 1996). This has been shown to be the result of high intracellular calcium, which has independently been shown to bias cell fate toward stalk (Azhar et al., 2001; Baskar et al., 2000; Chattwood and Thompson, 2011). Cells with high intracellular calcium are far more sensitive to DIF-1 (Baskar et al., 2000; Schaap et al., 1996). A similar story can be told with a gene that links nutritional status to cell fate, a D. discoideum homolog of the human retinoblastoma gene, rblA (Chattwood and Thompson, 2011; MacWilliams et al., 2006). Knockouts of rblA are hypersensitive to DIF-1 and preferentially become stalk.
Other work by Thompson and colleagues (Parkinson et al., 2011) has shown that the patterns linking DIF-1, or more generally stalk-inducing factors (StIFs), are also important in spore-stalk hierarchies of natural clones. These hierarchies are based on whether clones become spore or stalk when mixed pairwise with other clones (Buttery et al., 2009; Fortunato et al., 2003). They separately evaluated response to and production of StIFs and found a threefold difference in production and a 15-fold difference in response; the latter was most powerful in explaining the hierarchy observed in natural clones (Parkinson et al., 2011). Thus, we know a satisfying amount about how power affects cell fate through DIF-1. There is more to learn, however, particularly because cheating can result from knocking out so many different genes (Santorelli et al., 2008). This led to another general approach to identifying resistance genes.
Genetic Control of Cheating by Noble Resistors
The evolution of resistance to cheater genes may limit their spread. To test this idea, we selected for resistors of cheater genes. We took one cheater, chtC, and exposed a pool of REMI mutants to it over successive rounds (Khare et al., 2009). We allowed selection of the REMI pool but not of the chtC knockout. We did this by removing the G418 resistance from the chtC clone so that we could kill it at each round, leaving the mutants we were selecting intact. We then simply added back in the naive chtC clone for the next round. This process resulted in a number of mutants that were resistant to chtC knockouts and could not be cheated by it. Interestingly, they were not cheaters of their ancestor; thus, we called them noble resistors (Khare et al., 2009).
Social Genes, Arms Races, and the Red Queen
Cheating and countering cheating are social processes that we predict will result in rapid evolution in the underlying genes. Our test of this hypothesis used the newly sequenced species D. purpureum and compared it with D. discoideum (Sucgang et al., 2011). Unfortunately, this is not an ideal pair of species because their proteins are as diverged as those of humans and fish. This means that silent amino acid changes (ds) are saturated, and thus are not useful in comparisons. Instead, we compared homologs; rates of amino acid change; and conservation scores, a measure of similarity that includes indels. We used two sets of social genes for comparisons. The first set was the 100 or so REMI mutants that cheated their ancestors when mixed equally with them (Santorelli et al., 2008). These genes did not show more rapid evolution, and thus failed to support our hypothesis that social genes evolve more rapidly.
The second set of genes we used was based on a social index, which was higher when a gene was more expressed in the social stage compared with the nonsocial stage. In this analysis, the more social genes had a lower probability of having homologs, an elevated rate of amino acid change, and a lower conservation score, supporting our hypothesis (Sucgang et al., 2011). The result could also be attributable to weaker purifying selection on social genes, however, and a better analysis would be between more closely related species.
Other Arenas for Cooperation: Mutualisms and Sex
No review of social behavior of D. discoideum would be complete without mentioning two very exciting areas for future study. The sexual cycle is also a social cycle but has been studied very little. The other area is the discovery of a farming mutualism between D. discoideum and bacteria. This opens up the opportunity for studies of between-species symbioses.
Sexual Cycle Has Social Elements That Involve the Ultimate Sacrifice
The sexual cycle is triggered by starvation in the presence of sufficient numbers of other amoebae under wet, phosphate-poor conditions and begins with aggregation to cAMP (Bonner, 1967; Kessin, 2001). Two cells of different mating types fuse, forming a diploid zygote. The amoeba stage is ordinarily haploid and divides by mitosis; thus, no reduction division is necessary before sexual fusion. Aggregation does not cease with the formation of a diploid zygote (Ishida et al., 2005; Urushilhara, 1992). Other amoebae continue to swarm in by the thousands, up the cAMP gradient. The zygote proceeds to consume the other cells by phagocytosis. The pace of consumption is slowed to a level that allows the waiting victim amoebae to construct an envelope around the aggregation, and this slowing is also regulated by cAMP. After a time, there is a firm wall around the zygote and its victims, and the latter are consumed and digested. Recombination and crossing over then happen, the zygote undergoes meiosis, and many recombinants are formed.
In a major recent advance, the sex-determining locus was identified and the presence of three mating types was confirmed, clearly establishing the genetic basis of sex (Bloomfield et al., 2010). The sexual cycle is somewhat of an enigma because it rarely leads to recombinant progeny under laboratory conditions (Kessin, 2001), but estimates of recombination rates of natural clones indicate they are very high, with a population r of 37.75 and baseline linkage disequilibrium achieved between 10 and 25 kb (Flowers et al., 2010). Getting the system to work in the laboratory would open up many interesting social questions to investigation. For example, we could select for social traits in sexually recombined pools and look for quantitative trait loci associated with social traits.
D. discoideum Farms Bacteria
There is another reason why D. discoideum is particularly good for studies of cooperation: mutualism. The standard view of the social stage of development is that all bacteria are purged from the aggregate (Kessin, 2001). There are known mechanisms for this that function at different stages, from mound, to slug, to final fruiting body. The sorus is considered to be sterile apart from the D. discoideum spores. Very recently, we discovered that this is not the case for about one-third of all clones (Brock et al., 2011). These clones carry bacteria with them through the social stage like a farmer might bring a flock of sheep to a different pasture. These bacteria are found within the fruiting body. When the spores hatch after favorable growing conditions have been encountered, they can feed on the proliferating population of the bacteria they brought. These farmed bacteria are better food than most wild bacteria. This farming mutualism is highly amenable for study, because all partners are microbial, advantages are clear, and the relationship is not obligate, at least at the species level. This discovery adds between-species cooperation to the things that can be studied about D. discoideum.
Conclusion
The ultimate advantage to an ideal model organism is what you can learn from it. In D. discoideum, we have shown that conflict exists in the form of shorter stalk lengths, reduced migration distances, and cheating to avoid the sterile caste. We have delineated cheating into fixed, facultative, and social parasite forms. We have shown that cheating can be controlled by high relatedness, kin discrimination, pleiotropy, or lotteries. We have shown that conflict can be controlled by conventions and power. The first cells to starve become spore, as do stronger cells. A small, toxic molecule called DIF-1 mediates social interactions. We and others have backed up much of this work with specific genes and knockouts. Further whole-genome outcomes are on the horizon, as is a much more detailed understanding of kin discrimination. Frontiers include the farming symbiosis and exploration of the sexual cycle. Clearly, this is a system that has yielded many important secrets about the cooperative side of major transitions.
Acknowledgments
We thank John Avise and Francisco Ayala for inviting us to help organize the Arthur M. Sackler Colloquium on Cooperation. We thank many colleagues for helpful discussions of these points, especially Sandie Baldauf, Koos Boomsma, Kevin Foster, Richard Gomer, Ashleigh Griffin, Rob Kay, Richard Kessin, Adam Kuspa, Gene Robinson, Gadi Shaulsky, Chris Thompson, Greg Velicer, and Stuart West as well as our own laboratory group. Our research is supported by the US National Science Foundation under Grants DEB 0816690 and DEB 0918931.
References
Alvarez-Curto E, et al. (2005) Evolutionary origin of cAMP-based chemoattraction in the social amoebae. Proc Natl Acad Sci USA 102:6385–6390.
Araki T, Nakao H, Takeuchi I, Maeda Y (1994) Cell-cycle-dependent sorting in the development of Dictyostelium cells. Dev Biol 162:221–228.
Atzmony D, Zahavi A, Nanjundiah V (1997) Altruistic behaviour in Dictyostelium discoideum explained on the basis of individual selection. Curr Sci 72:142–145.
Azhar M, et al. (2001) Cell cycle phase, cellular Ca2+ and development in Dictyostelium discoideum. Int J Dev Biol 45:405–414.
Baldauf SL, Roger AJ, Wenk-Siefert I, Doolittle WF (2000) A kingdom-level phylogeny of eukaryotes based on combined protein data. Science 290:972–977.
Baskar R, Chhabra P, Mascarenhas P, Nanjundiah V (2000) A cell type-specific effect of calcium on pattern formation and differentiation in dictyostelium discoideum. Int J Dev Biol 44:491–498.
Beekman M, Ratnieks FLW (2003) Power over reproduction in social hymenoptera. Philos Trans R Soc Lond B Biol Sci 358:1741–1753.
Benabentos R, et al. (2009) Polymorphic members of the lag gene family mediate kin discrimination in Dictyostelium. Curr Biol 19:567–572.
Bloomfield G, Skelton J, Ivens A, Tanaka Y, Kay RR (2010) Sex determination in the social amoeba Dictyostelium discoideum. Science 330:1533–1536.
Bonner JT (1967) The Cellular Slime Molds (Princeton Univ Press, Princeton).
Bonner JT (2006) Migration in Dictyostelium polycephalum. Mycologia 98:260–264.
Bourke AFG (2011) Principles of Social Evolution (Oxford Univ Press, Oxford), p 288.
Bourke AFG, Franks NR (1995) Social Evolution in Ants (Princeton Univ Press, Princeton).
Bracco E, et al. (2000) Cell-cell signaling and adhesion in phagocytosis and early development of Dictyostelium. Int J Dev Biol 44:733–742.
Brock DA, Douglas TE, Queller DC, Strassmann JE (2011) Primitive agriculture in a social amoeba. Nature 469:393–396.
Buckling A, et al. (2007) Siderophore-mediated cooperation and virulence in Pseudomonas aeruginosa. FEMS Microbiol Ecol 62:135–141.
Buss LW (1987) The Evolution of Individuality (Princeton Univ Press, Princeton).
Buttery NJ, Rozen DE, Wolf JB, Thompson CRL (2009) Quantification of social behavior in D. discoideum reveals complex fixed and facultative strategies. Curr Biol 19:1373–1377.
Castillo DI, Queller DC, Strassmann JE (2011) Cell condition, competition, and chimerism in the social amoeba Dictyostelium discoideum. Ethol Ecol Evol, in press.
Chattwood A, Thompson CRL (2011) Non-genetic heterogeneity and cell fate choice in D. discoideum. Dev Growth Differ, in press.
Chen G, Zhuchenko O, Kuspa A (2007) Immune-like phagocyte activity in the social amoeba. Science 317:678–681.
Clutton-Brock TH, et al. (2001) Cooperation, control, and concession in meerkat groups. Science 291:478–481.
Cockburn A (1998) Evolution of helping behavior in cooperatively breeding birds. Annu Rev Ecol Syst 29:141–177.
Cornwallis CK, West SA, Davis KE, Griffin AS (2010) Promiscuity and the evolutionary transition to complex societies. Nature 466:969–972.
Crespi BJ (2001) The evolution of social behavior in microorganisms. Trends Ecol Evol 16:178–183.
Diggle SP, Gardner A, West SA, Griffin AS (2007) Evolutionary theory of bacterial quorum sensing: When is a signal not a signal? Philos Trans R Soc Lond B Biol Sci 362:1241–1249.
Ennis HL, Dao DN, Pukatzki SU, Kessin RH (2000) Dictyostelium amoebae lacking an F-box protein form spores rather than stalk in chimeras with wild type. Proc Natl Acad Sci USA 97:3292–3297.
Flowers JM, et al. (2010) Variation, sex, and social cooperation: Molecular population genetics of the social amoeba Dictyostelium discoideum. PLoS Genet 6:e1001013.
Fortunato A, Queller DC, Strassmann JE (2003) A linear dominance hierarchy among clones in chimeras of the social amoeba Dictyostelium discoideum. J Evol Biol 16:438–445.
Fortunato A, Strassmann JE, Santorelli LA, Queller DC (2003) Co-occurrence in nature of different clones of the social amoeba, Dictyostelium discoideum. Mol Ecol 12:1031–1038.
Foster KR, Fortunato A, Strassmann JE, Queller DC (2002) The costs and benefits of being a chimera. Proc Biol Sci 269:2357–2362.
Foster KR, Shaulsky G, Strassmann JE, Queller DC, Thompson CRL (2004) Pleiotropy as a mechanism to stabilize cooperation. Nature 431:693–696.
Frank SA (1998) Foundations of Social Evolution (Princeton Univ Press, Princeton).
Gilbert OM, Foster KR, Mehdiabadi NJ, Strassmann JE, Queller DC (2007) High relatedness maintains multicellular cooperation in a social amoeba by controlling cheater mutants. Proc Natl Acad Sci USA 104:8913–8917.
Gomer RH, Firtel RA (1987) Cell-autonomous determination of cell-type choice in Dictyostelium development by cell-cycle phase. Science 237:758–762.
Griffin AS, West SA, Buckling A (2004) Cooperation and competition in pathogenic bacteria. Nature 430:1024–1027.
Grosberg RK, Strathmann RR (1998) One cell, two cell, red cell, blue cell: The persistence of a unicellular stage in multicellular life histories. Trends Ecol Evol 13:112–116.
Hamilton WD (1964) The genetical evolution of social behaviour. I. J Theor Biol 7:1–16.
Herron MD, Michod RE (2008) Evolution of complexity in the volvocine algae: Transitions in individuality through Darwin’s eye. Evolution 62:436–451.
Huang HJ, Takagawa D, Weeks G, Pears C (1997) Cells at the center of Dictyostelium aggregates become spores. Dev Biol 192:564–571.
Ishida K, Hata T, Urushihara H (2005) Gamete fusion and cytokinesis preceding zygote establishment in the sexual process of Dictyostelium discoideum. Dev Growth Differ 47:25–35.
Jack CN, et al. (2008) Segregate or cooperate—A study of the interaction between two species of Dictyostelium. BMC Evol Biol 8:8.
Jang W, Gomer RH (2011) Initial cell type choice in Dictyostelium. Eukaryot Cell 10:150–155.
Kay RR (1998) The biosynthesis of differentiation-inducing factor, a chlorinated signal molecule regulating Dictyostelium development. J Biol Chem 273:2669–2675.
Kay RR, Thompson CRL (2009) Forming patterns in development without morphogen gradients: Scattered differentiation and sorting out. Cold Spring Harb Perspect Biol 1:a001503.
Kerr B, Riley MA, Feldman MW, Bohannan BJM (2002) Local dispersal promotes biodiversity in a real-life game of rock-paper-scissors. Nature 418:171–174.
Kessin RH (2001) Dictyostelium: Evolution, Cell Biology, and the Development of Multicellularity (Cambridge Univ Press, Cambridge, UK), p 308.
Khare A, et al. (2009) Cheater-resistance is not futile. Nature 461:980–982. Sucgang R, et al. (2011) Comparative genomics of the social amoebae Dictyostelium discoideum and Dictyostelium purpureum. Genome Biol 12:R20.
Kuspa A, Loomis WF (1992) Tagging developmental genes in Dictyostelium by restriction enzyme-mediated integration of plasmid DNA. Proc Natl Acad Sci USA 89:8803–8807.
Kuzdzal-Fick J, Foster K, Queller D, Strassmann J (2007) Exploiting new terrain: An advantage to sociality in the slime mold Dictyostelium discoideum. Behav Ecol 18:433–437.
Kuzdzal-Fick JJ, Queller DC, Strassmann JE (2010) An invitation to die: Initiators of sociality in a social amoeba become selfish spores. Biol Lett 6:800–802.
Leach CK, Ashworth JM, Garrod DR (1973) Cell sorting out during the differentiation of mixtures of metabolically distinct populations of Dictyostelium discoideum. J Embryol Exp Morphol 29:647–661.
MacWilliams H, et al. (2006) A retinoblastoma ortholog controls stalk/spore preference in Dictyostelium. Development 133:1287–1297.
Margulis L (1970) Origin of Eukaryotic Cells (Yale Univ Press, New Haven, CT).
Masento MS, et al. (1988) Differentiation-inducing factor from the slime mould Dictyostelium discoideum and its analogues. Synthesis, structure and biological activity. Biochem J 256:23–28.
Maynard Smith J (1989) in Evolutionary Progress, Evolutionary progress and the levels of selection, ed Nitecki MH (Univ of Chicago Press, Chicago), pp 219–230.
Maynard Smith J, Szathmáry E (1995) The Major Transitions in Evolution (Oxford University Press, Oxford).
Mehdiabadi NJ, et al. (2006) Kin preference in a social microorganism. Nature 442:881–882.
Ostrowski EA, Katoh M, Shaulsky G, Queller DC, Strassmann JE (2008) Kin discrimination increases with genetic distance in a social amoeba. PLoS Biol 6:e287.
Parkinson K, Buttery NJ, Wolf JB, Thompson CRL (2011) A simple mechanism for complex behavior. PLoS Biol, 9:e1001039.
Ponte E, Bracco E, Faix J, Bozzaro S (1998) Detection of subtle phenotypes: The case of the cell adhesion molecule csA in Dictyostelium. Proc Natl Acad Sci USA 95:9360–9365.
Queller DC (1992) A general model for kin selection. Evolution 46:376–380.
Queller DC (1997) Cooperators since life began. Q Rev Biol 72:184–188, book review.
Queller DC (2000) Relatedness and the fraternal major transitions. Philos Trans R Soc Lond B Biol Sci 355:1647–1655.
Queller DC, Ponte E, Bozzaro S, Strassmann JE (2003) Single-gene greenbeard effects in the social amoeba Dictyostelium discoideum. Science 299:105–106.
Queller DC, Strassmann JE (2009) Beyond society: The evolution of organismality. Philos Trans R Soc Lond B Biol Sci 364:3143–3155.
Raper KB (1984) The Dictyostelids (Princeton Univ Press, Princeton).
Ratnieks FL, Foster KR, Wenseleers T (2006) Conflict resolution in insect societies. Annu Rev Entomol 51:581–608.
Ratnieks FLW (1990) in Social Insects and the Environment: Proceedings of the Eleventh International Congress of the International Union for the Study of Social Insects, Worker policing in social insects, eds Veeresh GK, Mallik B, Viraktamath CA (Oxford& IBH, New Delhi), pp 365–366.
Rawls J (1971) A Theory of Justice (Harvard Univ Press, Cambridge, MA).
Riley MA, Wertz JE (2002) Bacteriocins: Evolution, ecology, and application. Annu Rev Microbiol 56:117–137.
Robinson GE (2002) Genomics and integrative analyses of division of labor in honeybee colonies. Am Nat 160(Suppl 6):S160–S172.
Sachs JL, Mueller UG, Wilcox TP, Bull JJ (2004) The evolution of cooperation. Q Rev Biol 79: 135–160.
Santorelli LA, et al. (2008) Facultative cheater mutants reveal the genetic complexity of cooperation in social amoebae. Nature 451:1107–1110.
Schaap P, et al. (2006) Molecular phylogeny and evolution of morphology in the social amoebas. Science 314:661–663.
Schaap P, Nebl T, Fisher PR (1996) A slow sustained increase in cytosolic Ca2+ levels mediates stalk gene induction by differentiation inducing factor in Dictyostelium. EMBO J 15:5177–5183.
Shaulsky G, Loomis WF (1993) Cell type regulation in response to expression of ricin A in Dictyostelium. Dev Biol 160:85–98.
Strassmann JE, Queller DC (2007) Insect societies as divided organisms: The complexities of purpose and cross-purpose. Proc Natl Acad Sci USA 104(Suppl 1):8619–8626.
Strassmann JE, Queller DC (2010) The social organism: Congresses, parties, and committees. Evolution 64:605–616.
Strassmann JE, Zhu Y, Queller DC (2000) Altruism and social cheating in the social amoeba Dictyostelium discoideum. Nature 408:965–967.
Takeuchi I, Noce T, Tasaka M (1986) Prestalk and prespore differentiation during development of Dictyostelium discoideum. Curr Top Dev Biol 20:243–256.
Thompson CRL, Fu Q, Buhay C, Kay RR, Shaulsky G (2004) A bZIP/bRLZ transcription factor required for DIF signaling in Dictyostelium. Development 131:513–523.
Thompson CRL, Kay RR (2000) Cell-fate choice in Dictyostelium: Intrinsic biases modulate sensitivity to DIF signaling. Dev Biol 227:56–64.
Thompson CRL, Kay RR (2000) The role of DIF-1 signaling in Dictyostelium development. Mol Cell 6:1509–1514.
Travisano M, Velicer GJ (2004) Strategies of microbial cheater control. Trends Microbiol 12:72–78. Urushihara H (1992) Sexual development of cellular slime molds. Dev Growth Differ 34:1–17.
Velicer GJ, Stredwick KL (2002) Experimental social evolution with Myxococcus xanthus. Antonie van Leeuwenhoek 81:155–164.
Vos M, Velicer GJ (2009) Social conflict in centimeter- and global-scale populations of the bacterium Myxococcus xanthus. Curr Biol 19:1763–1767.
Weijer CJ, Duschl G, David CN (1984) A revision of the Dictyostelium discoideum cell cycle. J Cell Sci 70:111–131.
Weinstock GM, et al., Honeybee Genome Sequencing Consortium (2006) Insights into social insects from the genome of the honeybee Apis mellifera. Nature 443:931–949.
Wenseleers T, Ratnieks FLW (2006) Enforced altruism in insect societies. Nature 444:50.
West SA, Diggle SP, Buckling A, Gardner A, Griffins AS (2007) The social lives of microbes. Annu Rev Ecol Evol Syst 38:53–77.
West SA, Griffin AS, Gardner A (2007) Evolutionary explanations for cooperation. Curr Biol 17: R661–R672.
West SA, Pen I, Griffin AS (2002) Cooperation and competition between relatives. Science 296: 72–75.
Wood SA, et al. (1996) RtoA links initial cell type choice to the cell cycle in Dictyostelium. Development 122:3677–3685.
GLOWING CORPSES AND RADIANT EXCREMENT: THE ROLE OF BIOLUMINESCENCE IN MICROBIAL COMMUNITIES
Edith A. Widder91
Abstract
Why microbes glow has been long debated. The effect produces bizarre phenomena, such as glowing corpses and radiant excrement, the evolutionary advantages of which have been sufficiently elusive as to lead to suggestions that it serves no function. However, the energetic costs of producing light are sufficiently great that this seems unlikely. Here I provide a brief overview of microbial bioluminescence, including recent findings that shed light on the evolutionary origins of bioluminescence in bacteria. Theories for the selective advantages of radiant excrement and glowing corpses are discussed, including recent experimental evidence related to the former and my own hypothesis as to the possible selective advantage of the latter.
The Difference Between Bioluminescence and Other Types of Light
Bioluminescence is visible light emitted by living organisms. In bioluminescence the electron excitation that precedes light emission is the result of a highly efficient chemical reaction and is therefore a form of chemiluminescence. Bioluminescence is occasionally confused with phosphorescence or fluorescence, but in both of these processes the electronically excited state is generated by light absorption rather than by a chemical reaction. In the case of phosphorescence light emission persists for a limited period of time after removal of the excitation source—as in glow-in-the-dark toys—while fluorescence does not persist
___________
91 Ocean Research & Conservation Association, 1420 Seaway Drive, Fort Pierce, FL 34949.
once the excitation source is removed—as in black light posters. Although some bioluminescence systems include fluorescent emitters, this is not a universal attribute (Widder, 1999).
The light-producing chemicals synthesized by living organisms are called luciferins and luciferases, named for Lucifer the lightbearer. This terminology originated with the French physiologist Raphael Dubois, who carried out an experiment in 1887 on the luminous bivalve Pholas dactylus, from which he made hot-water and cold-water extracts. He presumed that the hot-water extract contained the heat-stable substrate, which he named luciferin, and that the cold-water extract contained the heat-labile enzyme, which he named luciferase (Dubois, 1887). These are generic terms that require a taxon prefix to distinguish different chemical systems (Figure A21-1). Given the remarkable variety of light-producing systems it is evident that bioluminescence has evolved independently many times with current estimates indicating at least 40 separate evolutionary origins (Haddock et al., 2010).
In bacteria there are two substrates, a reduced flavin mononucleotide (FMNH2) and a long-chain aliphatic aldehyde (RCHO), that are oxidized by luciferase, resulting in light emission and the reduction of molecular oxygen (Figure A21-2). Both substrates needed for the reaction are provided continuously, with the reduced flavin coming from the electron transport chain and the aldehyde being resynthesized by fatty acid reductase, resulting in continuous light emission (Dunlap, 2009). Persistence of emission is unusual among bioluminescent organisms, which more typically have light-emitting systems that produce flashes or discontinuous glows and are under neural or hormonal control (Widder, 1999).
Evolutionary Origins of Microbial Bioluminescence
The extreme evolutionary convergence associated with bioluminescence is a clear indication of the survival value of the trait, which serves in dim-light environments to aid animals in finding food, attracting mates, and avoiding predation. There are many well-described instances of symbioses where host organisms use the adopted illumination of bacteria to serve these various functions. For example, in the pinecone fish Monocentris japonicas a pair of light organs on the lower jaw harbor the luminous bacterial symbiont Vibrio fischeri, which provides light that the fish uses to locate prey (Figure A21-3) (Ruby and Nealson, 1976). In flashlight fishes of the family Anomalopidae, large suborbital light organs filled with an unidentified bioluminescent symbiont provide the fish with light that serves all three functions: to locate prey, to attract mates, and to evade predators using a zigzag blink-and-run defense (Morin et al., 1975). In deep-sea angler fish, specialized bacterial light organs known as escas function as lures to attract prey and are also believed to serve as a species-specific visual cue in some fish with parasitic males that visually locate conspecific females (Pietsch, 2005) (Figure A21-4). In squid, such as the aptly named fire shooter Heteroteuthis dispar
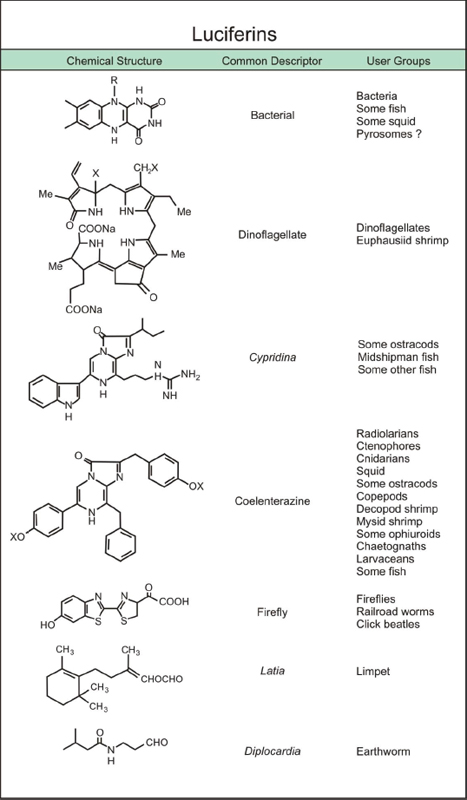
FIGURE A21-1 The chemical structures of known luciferins. Molecular structures of known luciferins, common descriptor, and the taxonomic groups known to use them.
SOURCE: Adapted from Haddock et al. (2010); Shimomura (2006).
FIGURE A21-2 The bacterial bioluminescence reaction. Bacterial luciferase catalyzes the oxidation of reduced flavin mononucleotide (FMNH2), molecular oxygen, and a long-chain fatty aldehyde resulting in the emission of blue green light.
SOURCE: Adapted from Lin and Meighen (2009, Figure 8).
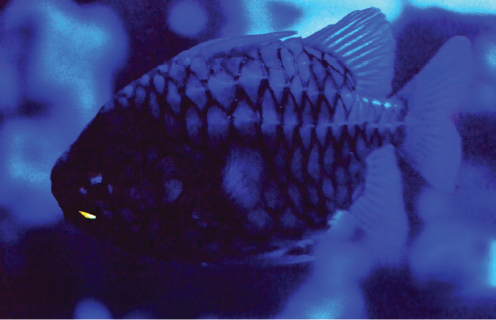
FIGURE A21-3 Pinecone fish. The pinecone fish Monocentris japonicas hosts the symbiotic luminous bacterium Vibrio fischeri.
SOURCE: Photo courtesy of David C. Smith, provided by Edith A. Widder.
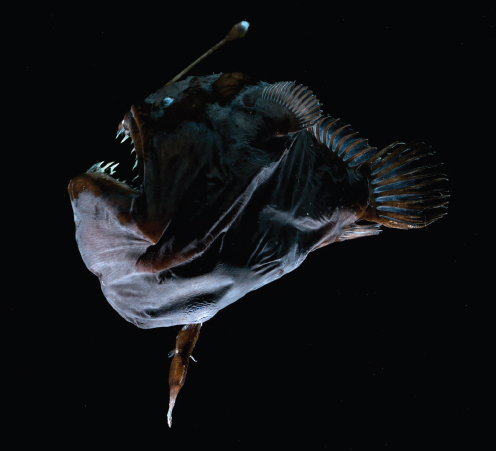
FIGURE A21-4 Female anglerfish with attached male. The anglerfish Melanocetus johnsonii, with dwarf male attached.
SOURCE: Photo courtesy of Edith A. Widder (1999).
(Figure A21-5), bacterial bioluminescence functions defensively in two different ways, either being expelled to distract or temporarily blind a predator or being retained internally and emitted ventrally to serve as camouflage, matching the color and intensity of downwelling sunlight and thereby concealing its silhouette from the upward-looking eyes of visual predators (Young et al., 2008).
In these symbiotic systems the host provides the bacteria with all that they need to thrive and, in many cases, also aggressively selects against nonluminous species and strains. Therefore, the selective advantage of microbial bioluminescence in these symbiotic pairings is evident. However, because bioluminescence in individual bacteria is too dim to be visible to any visual system, this does not explain how microbial bioluminescence first arose. The origins of microbial bioluminescence have long been a contentious issue that has contributed to the oft-changing taxonomy of light-emitting bacteria, which have been frequently reclassified in
FIGURE A21-5 Fire shooter squid. The fire shooter squid Heteroteuthis dispar.
SOURCE: Photo courtesy of Edith A. Widder (1999).
efforts to better define evolutionary origins and relationships. At present there are four luminescent genera. These are the terrestrial genus Photorhabdus, in which all species are luminescent, and three marine genera, Photobacterium, Shewanella, and Vibrio (recently reclassified back from a short fling as Aliivibrio), which include both luminous and nonluminous species (Widder, 2010).
Comparative genomics have revealed that all light-emitting bacteria share a common gene sequence known as the lux operon that encodes for the biosynthesis of luciferase and its substrates (Dunlap, 2009). The fact that this gene sequence is so highly conserved in bacteria from very dissimilar ecological niches suggests a strong selective advantage. But how could the first bacterium that emitted light be selected for if the light of an individual bacterium is too dim to be seen? This conundrum is all the more perplexing because the energetic costs associated with light production (Makemson, 1986) actually put luminous strains of bacteria at a selective disadvantage, as demonstrated in mixed cultures of luminescent and dark mutants of Vibrio harveyi where the dark mutants rapidly overrun the culture (Czyż et al., 2003). A possible solution to this puzzle came in the form of an elegant experiment in which a mixture of luminescent and dark mutants of Vibrio harveyi were irradiated with ultraviolet (UV) light with sufficient energy to damage the microbial DNA. Although, in the control experiment without UV irradiation the dark mutants overran the colony, under UV irradiation the bioluminescent
strain prevailed. In this case the selective advantage of bioluminescence is that it stimulates DNA repair by means of an enzyme called photolyase, which requires blue light of a wavelength equivalent to that emitted by bioluminescent bacteria (Czyż et al., 2003). Selection for light-emitting bacteria was therefore apparently based on its ability to stimulate DNA repair. As bacteria evolved more efficient DNA repair systems, the lux operon may have been lost except in those bacteria where bioluminescence resulted in a selective advantage.
Radiant Excrement
A selective advantage for free-living bioluminescent bacteria in the ocean relates to fecal pellets, which are a primary food source in the deep ocean. The bacteria that decompose fecal pellets play a major role in the cycling of organic matter in the water column (Andrews et al., 1984). If these bacteria are bioluminescent and accumulate in sufficient numbers to be visible, then the pellets become easy targets for visual consumers and the bacteria are ingested along with the pellet, thereby gaining access to the food-rich environment of the consumer’s gut. However, if the decomposers are nonluminescent then the pellets along with their associated bacteria are more likely to sink into depths where carbon sources are scarce (Robison et al., 1977). It is a testament to the significance of this adaptation that angler fish escas are believed to function as lures because they mimic these morsels of glowing excrement (Young, 1983).
As fecal pellets sink into the depths, exposure to mutagenic UV radiation rapidly diminishes, leading to the loss of the selective advantage of bioluminescence-stimulated DNA repair. That this was likely the case is supported by laboratory studies using mixed cultures of Vibrio harveyi (Czyż et al., 2003): As long as the cultures were exposed to UV radiation the bioluminescent strain prevailed, but once the radiation stopped, the dark strain rapidly overran the culture. For bioluminescence to remain selectively advantageous in the absence of UV radiation the bacteria need to be present in sufficient numbers to be visible. Below this threshold concentration, they would be at a selective disadvantage and presumably susceptible to being overrun by less energy-demanding dark strains. This is a clear selective advantage for quorum sensing, which conserves energy by ensuring that luminescent bacteria do not synthesize their light-producing chemicals unless a sufficient concentration are present to be visible (Nealson et al., 1970).
That bacterial bioluminescence is in fact sufficiently bright to cue visual predators was recently demonstrated in a laboratory experiment where nocturnal fish presented with zooplankton coated with bioluminescent bacteria readily located and consumed these glowing prey, while being largely unsuccessful with their nonglowing counterparts. This study also demonstrated that bioluminescent bacteria survive gut passage in both zooplankton and fish, thereby gaining access to a nutritious environment and a means of wide dispersal (Zarubin et al., 2012).
Glowing Corpses
Glowing corpses have appeared to startled observers throughout history and have engendered all manner of supernatural accounts (Harvey, 1957). During the American Civil War there were several well-documented examples, as a consequence of the enormous number of casualties in this conflict that resulted in bodies lying too long on the battlefield and mass burials in shallow graves, covered with a thin layer of dirt. Light emanating from these gravesites led to much consternation about hauntings and ghosts (Jenkins, 2003; Taylor, 1906). The light probably originated from bioluminescent bacteria, of the genus Photorhabdus, a terrestrial bacterium known to thrive in cadavers, albeit more commonly in larval insect cadavers. Photorhabdus luminescens is a Gram-negative bacterium with a complex life cycle that alternates between a mutualistic association with a nematode host, Heterorhabditis bacteriophora, and a pathogenic phase that is highly virulent to insect larvae. The bacterium gains access to the insect larva when its nematode host either bores into the larva or enters through the mouth or anus and then regurgitates its bacterial symbionts into the hemolymph (i.e., the insect blood). The bacteria then grow and multiply, secreting toxins that kill the host within 24 to 48 h. The nematodes feed on the bacterial biomass and reproduce through several generations over a period of 10 to 20 days until they burst forth en masse and begin the cycle again (Ciche et al., 2008) (Figure A21-6).
As P. luminescens grows and multiplies it produces a wide range of toxins, hydrolytic enzymes, antibiotics, and bioluminescence. The toxins kill the insect and disable its immune system, the enzymes convert the host tissues into a nutrient broth, and the antibiotics preserve the cadaver by limiting competition with other bacteria (Ciche, 2008; Dunlap, 2009). The obvious question therefore arises as to what purpose the bioluminescence serves. Suggestions range from its serving as an attractant to potential prey insects that aid in dissemination (Dunlap, 2009; Frackman et al., 1990) to its having no benefit and that “it may not have had sufficient time, evolutionarily speaking, to have been completely lost, and as such light is still emitted without providing any real advantage to the organism” (Peat and Adams, 2008). Given the energetic costs associated with light production this explanation seems unlikely, and I would therefore like to offer an alternative hypothesis, which is that bioluminescence in Photorhabdus luminescens is selectively advantageous because it warns away potential predators from the insect cadaver, wherein an elaborate life cycle is in progress.
According to this hypothesis the bioluminescence of P. luminescens serves as aposematic coloration in a dark environment. Aposematism (from apo-, “away,” and sematic, “sign”), also known as warning coloration, is an antipredator defense that depends upon predators recognizing certain prey as unprofitable because they are unpalatable or dangerous (Cott, 1957; Ruxton et al., 2004). Because early recognition benefits both predator and prey, selection favors conspicuous signals such as the brightly colored wings of the Monarch butterfly, which advertise its toxicity. Because aposematism is such an effective defense, mimicry is common.
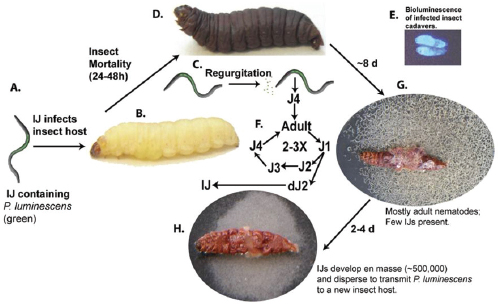
FIGURE A21-6 The life cycle of the nematode host of the bioluminescent bacterium Photorhabdus luminescens. The bioluminescent bacterium Photorhabdus luminescens switches from being a symbiont in its nematode host, Heterorhabditis bacteriophora, to a pathogen in the insect larva into which it is introduced by the nematode.
SOURCE: Figure and photos courtesy of Todd Ciche, provided by Edith A. Widder.
A palatable prey species may evolve coloration that mimics the appearance of an unpalatable species, in which case they are referred to as Batesian mimics (Bates, 1861), or unpalatable prey may evolve markings that mimic those of similarly unpalatable prey, in which case they are described as Müllerian mimics (Müller, 1879). Although Batesian mimics gain an advantage by not drawing on energy stores to synthesize a defensive arsenal, they risk predators learning to recognize them as impostors if they become so successful that they outnumber the aversive prey. By contrast, Müllerian mimics reinforce predator avoidance of a particular signal such as the yellow and black stripes of honeybees and yellowjacket wasps that broadcast the same message: “Don’t eat me or I’ll sting you.”
Warning coloration is ineffective against nocturnal predators unless that coloration is visible. Bioluminescence has been shown to function as an effective aposematic warning against nocturnal visual predators in firefly larvae (De Cock and Matthysen, 1999, 2001; Underwood et al., 1997), nocturnal millipedes (Marek et al., 2001), and the brittle-star Ophiopsila riisei (Grober, 1988a,b). In firefly larvae, for example, it was shown that larvae were rejected by birds (De Cock and Matthysen, 2001; Tyler, 2001a), wood ants (Tyler, 2001b), and laboratory mice (Underwood et al., 1997) and that wild-caught toads avoided attacking glowing artificial prey (de Cock and Matthysen, 2003), indicating that
the visual signal functioned aversively in the absence of the noxious signal. In millipedes, which defend themselves with cyanide, diurnal species warn off predators with vivid aposematic color patterns in yellow, orange, or red, while the nocturnal genus, Motyxia, exhibits drab coloration when seen under white light. However, at night Motyxia emits a blue-green bioluminescence that intensifies when the millipede is disturbed. Because these millipedes are blind, the luminescence does not serve an intraspecies communication function but, instead, is thought to be directed at nocturnal predators. In the first field study in any organism to demonstrate that bioluminescence can function as an aposematic warning, Marek et al. (2001) used live millipedes, half of which were painted to obscure their bioluminescence, and clay model millipedes, half of which were painted with phosphorescent paint. When these clay and live millipedes were left in the field overnight, significantly more of the nonluminescent millipedes (both clay and live) were attacked than their luminescent counterparts.
These studies clearly demonstrate that bioluminescence can repel predators. Whether this is the function of bioluminescence of Photorhabdus luminescens remains to be demonstrated. Nevertheless, it is well established that P. luminescens produces an impressive array of secondary metabolites that function to protect the nematode-killed insect cadaver from scavengers. These include antibacterial, antifungal, and nematicidal compounds (Webster, 2002) as well as insecticidal deterrents such as ant-deterrent factor (Zhou et al., 2002). P. luminescens also produces toxins that are active against a wide range of insects including Lepidoptera, Coleoptera, and Dictyoptera (Bowen et al., 1998) and although these likely evolved initially to kill the host they may also deter insect scavengers. In this regard, it may be noteworthy that some of these toxins are orally active, demonstrating equal lethality whether they are fed to, or injected into the hemolymph of, the host (Bowen and Ensign, 1998). Also in support of the aposematic warning hypothesis is the fact that at the same time that the cadaver becomes bioluminescent it also becomes red in color as a consequence of the synthesis of an anthraquinone pigment (Lango and Clarke, 2010). Red is a common aposematic warning color and may serve to warn off diurnal scavengers just as the bioluminescence warns off their nocturnal counterparts.
In a fascinating example of convergent evolution, a different bacteria-nematode partnership between the bacterium Xenorhabdus and the nematode Steinernema shares a very similar life cycle to that of Photorhabdus and Heterorhabditis, but without bioluminescence or any other apparent form of aposematic coloration (Goodrich-Blair and Clarke, 2007). One notable difference in these partnerships is the foraging strategies of the nematodes. Whereas many Steinernema species are ambush predators that attack passing insects at the soil surface, Heterorhabditis is a cruise forager that actively searches for prey in the soil (Campbell and Gaugler, 1997). If the insect prey are buried then once again the question arises—why glow? However, there are many nocturnal predators that
dig for grubs in the soil including raccoons, rodents, badgers, skunks, opossums, foxes, armadillos, and black bears (Yadav, 2003). It may be these scavengers that the light emitted by P. luminescens has evolved to deter. Different nematode species clearly demonstrate preferences for different insect prey; therefore, it may be instructive to examine differences between common host insects and their likely predators to assess in what circumstances bioluminescence is selectively advantageous. Any such study might also benefit from looking for the co-occurrence of aposematic glowworm larvae, which might indicate that the bioluminescence could be a form of either Batesian or Müllerian mimicry.
According to the aposematic hypothesis presented here, selection is based on the fact that once the insect is killed and the elaborate nematode life cycle begins, scavengers feeding on the insect carcass would interrupt the life cycle and therefore be highly deleterious to the nematodes. Because P. luminescens depends on its nematode host to locate and infect suitable prey, it is selectively advantageous for the bacterium to ward off scavengers with an extensive arsenal of deterrents, including aposematic warnings.
Conclusions
That, in many cases, microbial bioluminescence appeared to serve no obvious function has been a significant paradox. However, recent experimental evidence demonstrating that bacterial bioluminescence stimulates DNA repair provides a critical piece of the puzzle. In addition, the clear experimental demonstration that, in the absence of any external selective pressures, light production is selectively disadvantageous should bring into question any suggestions that the light emission is nonfunctional. One such is the example presented here involving glowing insect cadavers. An explanation for the phenomenon is that the bioluminescence serves as an aposematic warning to scavengers and is selectively advantageous to the microbial symbiont because it prevents interference with the complex life cycle of its host.
References
Andrews, C. C., D. M. Karl, L. F. Small, and S. W. Fowler. 1984. Metabolic activity and bioluminescence of oceanic faecal pellets and sediment trap particles. Nature 307:539-541.
Bates, H. W. 1861. Contributions to an insect fauna of the Amazon valley (Lepidoptera: Haliconidae). Transactions of the Linnean Society 23:495-566.
Bowen, D. J., and J. C. Ensign. 1998. Purification and characterization of a high-molecular-weight insecticidal protein complex produced by the entomopathogenic bacterium Photorhabdus luminescens. Applied and Environmental Microbiology 64(8):3029-3035.
Bowen, D., T. A. Rocheleau, M. Blackburn, O. Andreev, E. Golubeva, R. Bhartia, and R. H. French-Constant. 1998. Insecticidal toxins from the bacterium Photorhabdus luminescens. Science 280(5372):2129-2132.
Campbell, J. F., and R. R.Gaugler. 1997. Inter-specific variation in entomopathogenic nematode foraging strategy: Dichotomy or variation along a continuum? Fundamental and Applied Nematology 20(4):393-398.
Ciche, T. A., K.-S. Kim, B. Kaufmann-Daszczuk, K. C. Q. Nguyen, and D. H. Hall. 2008. Cell invasion and matricide during Photorhabdus luminescens transmission by Heterorhabditis bacteriophora nematodes. Applied and Environmental Microbiology 74(8):2275-2287.
Cott, H. B. 1957. Adaptive Coloration in Animals. London: Methuen & Co.
Czyż, A., K. Plata, and G. Węgrzyn. 2003. Stimulation of DNA repair as an evolutionary drive for bacterial luminescence. Luminescence 18:140-144.
De Cock, R., and E. Matthysen. 1999. Aposematism and bioluminescence: Experimental evidence from glow-worm larvae (Coleoptera: Lampyridae). Evolutionary Ecology 13:619-639.
De Cock, R., and E. Matthysen. 2001. Do glow-worm larvae (Coleoptera: Lampyridae) use warning coloration? Ethology 107:1019-1033.
De Cock, R., and E. Matthysen. 2003. Glow-worm larvae bioluminescence (Coleoptera: Lampyridae) operates as an aposematic signal upon toads (Bufo bufo). Behavioral Ecology 14(1):103-108.
Dubois, R. 1887. Fonction photogenique chez le Pholas dactylus. Comptes Rendus des Seances de la Societe de Biologie 4(8):564-565.
Dunlap, P. V. 2009. Bioluminescence, microbial. In Encyclopedia of microbiology, edited by M. Schaechter. Oxford: Elsevier. Pp. 45-61.
Frackman, S., M. Anhalt, and K. H. Nealson. 1990. Cloning, organization, and expression of the bioluminescence genes of Xenorhabdus luminescens. Journal of Bacteriology 172(10):5767-5773.
Goodrich-Blair, H., and D. J. Clarke. 2007. Mutualism and pathogenesis in Xenorhabdus and Photorhabdus: Two roads to the same destination. Molecular Microbiology 64(2):260-268.
Grober, M. S. 1988a. Brittle-star bioluminescence functions as an aposematic signal to deter crustacean predators. Animal Behavior 36:493-501.
Grober, M. S. 1988b. Responses of tropical reef fauna to brittle-star luminescence. Journal of Experimental Marine Biology and Ecology 115:157-168.
Harvey, E. N. 1957. A history of luminescence from the earliest times until 1900. Mineola, New York: Dover.
Haddock, S. H. D., M. A. Moline, and J. F. Case. 2010. Bioluminescence in the sea. Annual Review of Marine Science 2:443-493.
Jenkins, M. 2003. Gettysburg: From battlefield to Civil War shrine. National Geographic News, July 14. http://news.nationalgeographic.com/news/2003/07/0714_030714_gettysburg.html.
Lango, L., and D. Clarke. 2010. A metabolic switch is involved in life-style decisions in Photorhabdus luminescens. Molecular Microbiology 77(6):1394-1405.
Lin, L. Y-C., and E. A. Meighen. 2009. Bacterial bioluminescence: Biochemistry and molecular biology. http://www.photobiology.info/Lin.html.
Makemson, J. C. 1986. Luciferase-dependent oxygen consumption by bioluminescent Vibrio. Journal of Bacteriology 165:461-466.
Marek, P., D. Papaj, J. Yeager, S. Molina, and W. Moore. 2001. Bioluminescent aposematism in millipedes. Current Biology 21(18):R680-R681.
Morin, J. G., A. Harrington, K. Nealson, N. Krieger, T. O. Baldwin, and J. W. Hastings. 1975. Light for all reasons: Versatility in the behavioral repertoire of the flashlight fish. Science 190:74-76.
Müller, F. 1879. Ituna and Thyridia; a remarkable case of mimicry in butterflies (R. Meldola translation). Proclamations of the Entomological Society of London 1879:20-29.
Nealson, K., T. Platt, and J. W. Hastings. 1970. The cellular control of the synthesis and activity of the bacterial luminescent system. Journal of Bacteriology 104(1):313-322.
Peat, S. M., and B. J. Adams. 2008. Natural selection on the luxA gene of bioluminescent bacteria. Symbiosis 46:101-108.
Pietsch, T. W. 2005. Dimorphism, parasitism, and sex revisited: Modes of reproduction among deep-sea ceratioid angerfishes (Teleostei: Lophiiformes). Ichthyological Research 52:207-236.
Robison, B. H., E. G. Ruby, and J. G. Morin. 1977. Luminous bacteria associated with the gut contents of midwater fishes. Western Society of Naturalists 58:55.
Ruby, E. G., and K. H. Nealson. 1976. Symbiotic association of Photobacterium fischeri with the marine luminous fish Monocentris juponica: A model of symbiosis based on bacterial studies. Biological Bulletin 151:574-586.
Ruxton, G. D., T. N. Sherratt, and M. P. Speed. 2004. Avoiding attack: The evolutionary ecology of crypsis, warning signals and mimicry. New York: Oxford University Press.
Shimomura, O. 2006. Bioluminescence: Chemical principles and methods. Singapore: World Scientific.
Taylor, W. H. 1906. Some experiences of a Confederate assistant surgeon. Surgeon De Jure, Assistant Surgeon De facto, Nineteenth Regiment of Virginia Infantry, C.S.A. Read May 2, 1906, to the Society of Civil War Surgeons. http://www.civilwarsurgeons.org/articles/written_by_participants/experiences.pdf.
Tyler, J. 2001a. Are glow-worms Lampyris noctiluca (Linneaus) (Lampyridae) distasteful? The Coleopterist 9:148.
Tyler, J. 2001b. A previously undescribed defence mechanism in the larval glow-worm Lampyris noctiluca (Linneaus) (Lampyridae)? The Coleopterist 10:38.
Underwood, T. J., D. W. Tallamy, and J. D. Pesek. 1997. Bioluminescence in firefly larvae: A test of the aposeatic display hypothesis (Coleoptera: Lampyridae). Journal of Insect Behavior 10:365-370.
Webster, J. 2002. Bacterial metabolites. In Entomopathogenic nematology, edited by R. Gaugler. Wallingford, U.K.: CABI Publishing. Pp. 99-114.
Widder, E. A. 1999. Bioluminescence. In Adaptive mechanisms in the ecology of vision, edited by S. N. Archer, M. B. A. Djamgoz, E. Loew, J. C. Partridge, and S. Vallerga. Dordrecht, the Netherlands: Kluwer Academic Publishers. Pp. 555-581.
Widder, E. A. 2010. Bioluminescence in the ocean: Origins of biological, chemical and ecological diversity. Science 328(5979):704-708.
Yadav, M. 2003. Biology of insects. New Delhi: Discovery Publishing House.
Young, R. E., C. F. E. Roper, and K. M. Mangold (1922-2003). 2008. Heteroteuthis Gray, 1849. Version 04 April 2008 (under construction). http://tolweb.org/Heteroteuthis/20030/2008.04.04. The Tree of Life Web Project, http://tolweb.org.
Young, R. W. 1983. Oceanic bioluminescence: An overview of general functions. Bulletin of Marine Science 33(4):829-845.
Zarubin, M., S. Belkin, M. Ionescu, and A. Genin. 2012. Bacterial bioluminescence as a lure for marine zooplankton and fish. Proceedings of the National Academy of Sciences of the United States of America 109(3):853-857.
Zhou, X., H. K. Kaya, K. Heungens, and H. Goodrich-Blair. 2002. Response of ants to a deterrent factor(s) produced by the symbiotic bacteria of entomopathogenic nematodes. Applied and Environmental Microbiology 68(12):6202-6209.
SOCIAL INTERACTION, NOISE AND ANTIBIOTIC-MEDIATED SWITCHES IN THE INTESTINAL MICROBIOTA92
Vanni Bucci,93,94,95Serena Bradde,93,94,95Giulio Biroli,96Joao B. Xavier93,95
Abstract
The intestinal microbiota plays important roles in digestion and resistance against entero-pathogens. As with other ecosystems, its species composition is resilient against small disturbances but strong perturbations such as antibiotics can affect the consortium dramatically. Antibiotic cessation does not necessarily restore pre-treatment conditions and disturbed microbiota are often susceptible to pathogen invasion. Here we propose a mathematical model to explain how antibiotic-mediated switches in the microbiota composition can result from simple social interactions between antibiotic-tolerant and antibiotic-sensitive bacterial groups. We build a two-species (e.g. two functional-groups) model and identify regions of domination by antibiotic-sensitive or antibiotic-tolerant bacteria, as well as a region of multistability where domination by either group is possible. Using a new framework that we derived from statistical physics, we calculate the duration of each microbiota composition state. This is shown to depend on the balance between random fluctuations in the bacterial densities and the strength of microbial interactions. The singular value decomposition of recent metagenomic data confirms our assumption of grouping microbes as antibiotic-tolerant or antibiotic-sensitive in response to a single antibiotic. Our methodology can be extended to multiple bacterial groups and thus it provides an ecological formalism to help interpret the present surge in microbiome data.
Author Summary
Recent applications of metagenomics have led to a flood of novel studies and a renewed interest in the role of the gut microbiota in human health. We can now envision a time in the near future where analysis of microbiota composition can be used for diagnostics and the rational design of new therapeutics. However, most studies to date are exploratory and heavily data-driven, and therefore
___________
92 Reprinted from PLoS Computational Biology. © 2012 Bucci et al.
93 Program in Computational Biology, Memorial Sloan-Kettering Cancer Center, New York, U.S.A.
94 E-mail: bucciv@mskcc.org, serena.bradde@pasteur.fr, xavierj@mskcc.org.
95 Joint first authorship
96 Institut Physique Théorique (IPhT) CEA Saclay, and CNRS URA, Gif Sur Yvette, France.
lack mechanistic insights on the ecology governing these complex microbial ecosystems. In this study we propose a new model grounded on ecological and physical principles to explain intestinal microbiota dynamics in response to antibiotic treatment. Our model explains a hysteresis effect that results from the social interaction between two microbial groups, antibiotic-tolerant and antibiotic-sensitive bacteria, as well as the recovery allowed by stochastic fluctuations. We use singular value decomposition for the analysis of temporal metagenomic data, which supports the representation of the microbiota according to two main microbial groups. Our framework explains why microbiota composition can be difficult to recover after antibiotic treatment, thus solving a long-standing puzzle in microbiota biology with profound implications for human health. It therefore forms a conceptual bridge between experiments and theoretical works towards a mechanistic understanding of the gut microbiota.
Introduction
Recent advances in metagenomics provide an unprecedented opportunity to investigate the intestinal microbiota and its role in human health and disease (Dethlefsen et al., 2007; Neish, 2009). The analysis of microflora composition has a great potential in diagnostics (Jones, 2011) and may lead to the rational design of new therapeutics that restore healthy microbial balance in patients (Borody et al., 2004; Khoruts and Sadowsky, 2001; Ruder et al., 2011). Before the clinical translation of human microbiome biology is possible, we must seek to thoroughly understand the ecological processes governing microbiota composition dynamics and function.
The gastro-intestinal microbiota is a highly diverse bacterial community that performs an important digestive function and, at the same time, provides resistance against colonization by entero-pathogenic bacteria (Endt et al., 2010; Pultz et al., 2005; Stecher and Hardt, 2008). Commensal bacteria resist pathogens thanks to resources competition (Neish, 2009; Stecher and Hardt, 2008), growth inhibition due to short-chain fatty acid production (Fukuda et al., 2011), killing with bacteriocins (Corr et al., 2007; Dabard et al., 2001) and immune responses stimulation (Keeney and Finlay, 2011; Stecher and Hardt, 2011). However, external challenges such as antibiotic therapies can harm the microbiota stability and make the host susceptible to pathogen colonization (Bishara et al., 2008; Buffle et al., 2012; Dethlefsen et al., 2008; Pamer, 2007; Ubeda et al., 2010; Willing et al., 2011).
Despite its importance to human health, the basic ecology of the intestinal microbiota remains unclear. A recent large-scale cross-sectional study proposed that the intestinal microbiota variation in humans is stratified and fits into distinct enterotypes, which may determine how individuals respond to diet or drug intake (Arumugam et al., 2011). Although there is an ongoing debate over the existence of discrete microbiome enterotypes (Wu et al., 2011), they could be explained by
ecological theory as different states of an ecosystem (Scheffer, 2009). Ecological theory can also explain how external factors, such as antibiotics, may lead to strong shifts in the microbial composition. A recent study that analyzed healthy adults undergoing consecutive administrations of the antibiotic ciprofloxacin, showed that the gut microbiota changes dramatically by losing key species and can take weeks to recover (Dethlefsen and Relman, 2011). Longitudinal studies, such as this one, suggest that many microbial groups can have large and seemingly random density variations in the time-scale of weeks (Caporaso et al., 2011; Dethlefsen et al., 2006). The observation of multiple microbial states and the high temporal variability highlight the need for ecological frameworks that account for basic microbial interactions, as well as random fluctuations (dos Santos et al., 2010; Foster et al., 2008; Ley et al., 2006).
Here we propose a possible model to study how the intestinal microbiota responds to treatment with a single antibiotic. Our model expands on established ecological models and uses a minimal representation with two microbial groups (Mao-Jones et al., 2010) representing the antibiotic-sensitive and antibiotic-tolerant bacteria in the enteric consortium (Fig. A22-1). We propose a mechanism of direct interaction between the two bacterial groups that explains how domination by antibiotic-tolerants can persist even after antibiotic cessation. We then develop a new efficient framework that deals with non-conservative multi-stable field of forces and describes the role played by the noise in the process of recovery. We finally support our model by analyzing the temporal patterns of metagenomic data from the longitudinal study of Dethlefsen and Relman (Dethlefsen and Relman,
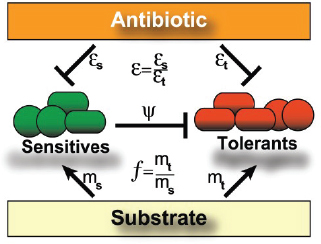
FIGURE A22-1 The two-group model of the intestinal microbiota with antibiotic-sensitive and antibiotic-tolerant bacteria. Antibiotic sensitives can inhibit the growth of tolerants and both groups compete for the same growth substrate. Model parameters εs and εt represent the antibiotic sensitivity of sensitive and tolerant bacteria (where εs < εt), ρs and ρt represent their affinities to substrate and represents the inhibition of tolerants by sensitives.
2011). We show that the dynamics of microbiota can be qualitatively captured by our model and that the two-group representation is suitable for microbiota challenged by a single antibiotic. Our model can be extended to include multiple bacterial groups, which is necessary for a more general description of intestinal microbiota dynamics in response to multiple perturbations.
Results
Mathematical Model
We model the microbiota as a homogeneous system where we neglect spatial variation of antibiotic-sensitive (s) and antibiotic-tolerant (t) bacterial densities. Their evolution is determined by growth on a substrate and death due to natural mortality, antibiotic killing and social pressure. With these assumptions, we introduce, as a mathematical model, two coupled stochastic differential equations for the density of sensitives and tolerants (ρs and ρt) normalized with respect to the maximum achievable microbial density:
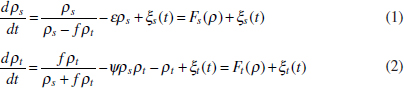
In the physics literature these types of equations represent stochastic motion in a non-conservative force field F. The first terms in F correspond to the saturation growth terms representing the indirect competition for substrate and depend on f, which is the ratio of the maximum specific growth rates between the two groups. If f >1 tolerants grow better than sensitives on the available substrate and the reverse is true for f <1 . They effectively describe a microbial system with a growth substrate modeled as a Monod kinetic (Monod, 1949) in the limit of quasi-steady state approximation for substrate and complete consumption from the microbes (see Methods for details). Both groups die with different susceptibility in response to the antibiotic treatment, which is assumed to be at steady-state. ε defines the ratio of the combined effect of antibiotic killing and natural mortality rates between the two groups (see Methods for details). While the system can be studied in its full generality for different choices of ε, we consider the case of ε>1 because it represents the more relevant case where sensitives are more susceptible to die than tolerants in the presence of the antibiotic. A possible ε(t) that mimics the antibiotic treatments is a pulse function. With this, we are able to reproduce realistic patterns of relative raise (fall) and fall (raise) of sensitives (tolerants) due to antibiotic treatment as we show in Fig. S4 in the Supporting Information Text (Text S1). Additionally, we introduce the social interaction term between the two groups, ψρt ρs, to implement competitive growth inhibition (Stecher and
Hardt, 2011; Xavier, 2011)]. In particular, we are interested in the case where the sensitives can inhibit the growth of the tolerants (ψ>0), which typically occurs through bacteriocin production (Bucci et al., 2011). Finally we add a stochastic term ξ that models the effect of random fluctuations (noise), such as random microbial exposure, which we assume to be additive and Gaussian. The analysis can be generalized to other forms of noise such as multiplicative and coloured.
Antibiotic Therapy Produces Multistability and Hysteresis
We first analyzed the model in the limit of zero noise, ξ = 0. In this case, we were interested in studying the steady state solutions that correspond to the fixed-points of equations (1,2) and are obtained imposing F = 0. We found three qualitatively-distinct biologically meaningful states corresponding to sensitive domination, tolerant domination and sensitive-tolerant coexistence (see Text A22-Supporting Information). We evaluated the stability of each fixed point (see Text A22-Supporting Information) and identified three regions within the parameter space (Fig. A22-2A). In the first region the effect of antibiotics on sensitive bacteria is very low (fε < 1) and domination by sensitives is the only stable state (sensitives monostability). In the second region the effect of the antibiotic on sensitives is stronger than their inhibition over tolerants (fε >1 + ψ/ε) and the only stable state is domination by tolerants (tolerants monostability). Finally, in the third region (1 < fε < 1 + ψ/ε) both sensitive and tolerant dominations are possible and stable, while the third coexistence fixed point is unstable (bistability) (see Text S1). This simple analysis shows that multistability can occur in a gut microbiota challenged by an antibiotic where one group directly inhibits the other (i.e. through the ψ term). Furthermore, it suggests that multistability is a general phenomenon since it requires only that antibiotic-sensitive and antibiotic-tolerant bacteria have similar affinities to nutrients. This is a realistic scenario because tolerants, such as vancomycin resistant Enterococcus (Ubeda et al., 2010), are often closely related to other commensal but antibiotic-sensitive strains and therefore should have similar affinity to nutrients. Finally, the solution of equations (1) and (2) reveals that hysteresis is present for values of fε and fψ leading to multistability (Fig. A22-2B). Similarly to magnetic tapes, such as cassette or video tapes, which remain magnetized even after the external magnetic field is removed (i.e. stopping the recording), a transient dose of antibiotics can cause a microbiota switch that persists for long time even after antibiotic cessation.
Noise Alters Stability Points
The previous analysis shows the existence of multistability in the absence of noise. However, the influx of microbes from the environment and/or the intra-population heterogeneity are expected in realistic scenarios and affect the bacterial density evolution in a non-deterministic fashion. This raises the question
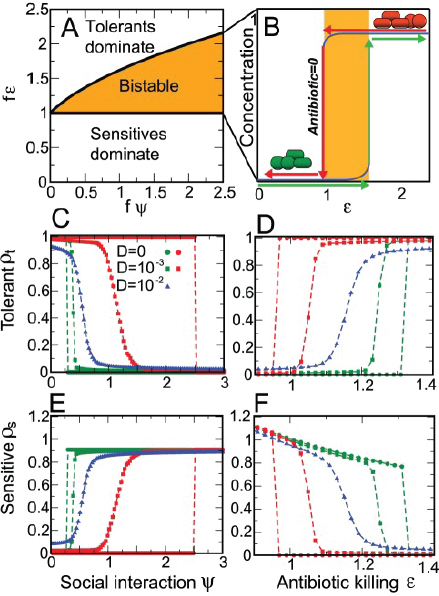
FIGURE A22-2 Multistability and hysteresis in a simple model of the intestinal microbiota. A: phase diagram showing the three possible stability regions. Antibiotic-sensitive bacteria dominate when fε < 1 and antibiotic-tolerant bacteria dominate when ![]() and therefore these are regions of monostability. There is a region of bistability between the two regions where domination by either sensitives or tolerants is possible. B: schematic display of the hysteresis phenomenon explaining cases where antibiotic treatment produces altered microbiota (i.e. tolerants domination) that persists long after antibiotic cessation. C-F: mean density values obtained simulating the Langevin dynamics for a maximum time T = 10000 after an instantaneous change of the parameter ψ (C and D) and ε (E and F). These averages are obtained over 1000 noise realizations. C, D and E, F show the antibiotic-tolerants or antibiotic-sensitives densities, respectively, as a function of the social interaction parameter (ψ) with fε = 1.21 or the antibiotic killing (ε) fψ with = 0.77.
and therefore these are regions of monostability. There is a region of bistability between the two regions where domination by either sensitives or tolerants is possible. B: schematic display of the hysteresis phenomenon explaining cases where antibiotic treatment produces altered microbiota (i.e. tolerants domination) that persists long after antibiotic cessation. C-F: mean density values obtained simulating the Langevin dynamics for a maximum time T = 10000 after an instantaneous change of the parameter ψ (C and D) and ε (E and F). These averages are obtained over 1000 noise realizations. C, D and E, F show the antibiotic-tolerants or antibiotic-sensitives densities, respectively, as a function of the social interaction parameter (ψ) with fε = 1.21 or the antibiotic killing (ε) fψ with = 0.77.
of how the noise alters the deterministic stable states and their stability criteria. We assume that the noise is a fraction of bacteria ξ(t) that can be added (or removed) at each time step, but on average has no effect since ![]() ξ
ξ![]() =0. This assumption is justified by the fact that a persistent net flux of non-culturable bacteria from the environment is unrealizable. We also assume that this random event at time t is not correlated to any previous time t′, which corresponds to
=0. This assumption is justified by the fact that a persistent net flux of non-culturable bacteria from the environment is unrealizable. We also assume that this random event at time t is not correlated to any previous time t′, which corresponds to ![]() ξk(t)ξk′ (t′)
ξk(t)ξk′ (t′)![]() = Dδ(t – t′) δkk′, where D characterizes the noise amplitude and δ is the Dirac delta function. We calculated the stationary probability of the microbiota being at a given state by solving the stationary Fokker-Planck Equation (FPE) (Gardiner, 1997) corresponding to the Langevin equations (1,2):
= Dδ(t – t′) δkk′, where D characterizes the noise amplitude and δ is the Dirac delta function. We calculated the stationary probability of the microbiota being at a given state by solving the stationary Fokker-Planck Equation (FPE) (Gardiner, 1997) corresponding to the Langevin equations (1,2):
![]()
By numerically solving equation (3) as described in (Galan et al., 2007), for increasing D, we find that for small values of D the most probable states coincide with the deterministic stable states given by F = 0 (Fig. A22-3A). However, by increasing D the distribution Ps spreads and the locations of the most probable states change and approach each other. As a consequence, the probability of an unstable coexistence, characterized by ρs > 0 and ρt > 0, increases thus avoiding extinction. This intuitively justifies how recovery to a sensitive-dominated state within a finite time after antibiotic cessation becomes possible with the addition of the noise. Without noise, the complete extinction of sensitive bacteria would have prevented any possible recolonization of the intestine. Beyond a critical noise level (Dc) bistability is entirely lost and the probability distribution becomes single-peaked with both bacterial groups coexisting. The microbiota composition at the coexistence state can be numerically determined from the solution of Ps(ρs,ρy), as shown in Fig. A22-3B and Video S1. Further investigations based on analytical expansion of the Langevin equations (see Methods) show that for small random fluctuations, D ![]() Dc, the first noise-induced corrections to the deterministic density are linearly dependent on D with a proportionality coefficient determined by the nature of the interactions (insets in Fig. A22-3B). These linear correction terms can be obtained as a function of the model parameters and, after substituting a particular set of values in the bistable region (f = 1.1, ε = 1.1 and ψ = 0.4), they are
Dc, the first noise-induced corrections to the deterministic density are linearly dependent on D with a proportionality coefficient determined by the nature of the interactions (insets in Fig. A22-3B). These linear correction terms can be obtained as a function of the model parameters and, after substituting a particular set of values in the bistable region (f = 1.1, ε = 1.1 and ψ = 0.4), they are ![]() ζs(1)
ζs(1)![]() =–4.3D for sensitives and
=–4.3D for sensitives and ![]() ζt(1)
ζt(1)![]() = –4.4D for tolerants. These numbers are different from those reported in the insets of Fig. A22-3B. However the discrepancy is due to the propagation of the boundary conditions when numerically solving the solution of the FPE using finite elements (see Text S1).
= –4.4D for tolerants. These numbers are different from those reported in the insets of Fig. A22-3B. However the discrepancy is due to the propagation of the boundary conditions when numerically solving the solution of the FPE using finite elements (see Text S1).
This has important biological implications since it suggests that extinction is prevented and, more importantly, that a minority of environmental microbes can settle in the gut at a rate that depends on the strength of their social interaction with the established microbiota.
The introduction of random perturbation affects the stability criteria of the stable states. In particular, we observe that the bistability region decreases when
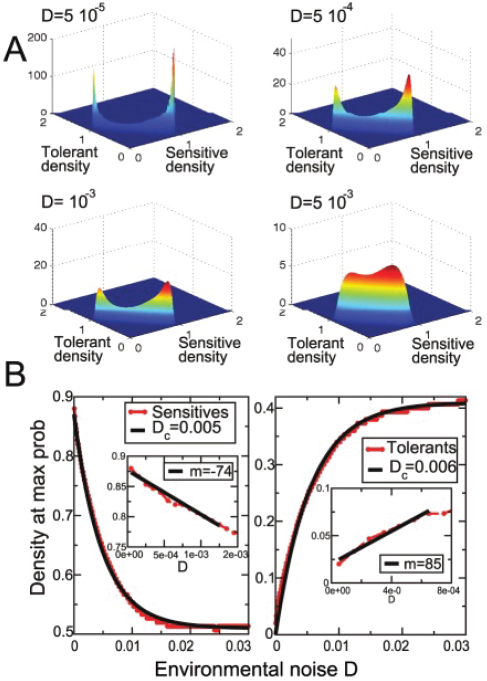
FIGURE A22-3 Most probable microbiota states change from bistable scenario to monostable coexistence with increasing noise. A: the bacterial density joint probability distribution determined by solving the Fokker-Planck equation (3) for four different values of the environmental noise. B: the bacterial densities at the peaks of P(ρs,ρt) as a function of the noise parameter D. Red symbols are data from the numeric solution of the Fokker-Planck equation and the black solid lines are the exponential t. Parameters used: f = 1.1; ε = 1.1 and ψ = 0.4. The insets detail the linear regime.
the noise amplitude D increases (Fig. A22-2C–F). At the limit, when D > Dc the bistability is entirely lost and the only stable state is the one where both groups coexist. This concept was previously hypothesized but not explicitly demonstrated in a model of microbial symbionts in corals (Mao-Jones et al., 2010).
Noise Affects the Recovery Time
Our model predicts that in absence of stochastic fluctuations the recovery time is larger than any observational time-scale so that it is impossible to revert to the conditions preceding antibiotic perturbation (see Fig. S4 in Text S1). In reality, data show that this time can be finite and depends on the microbiota composition and the degree of isolation of the individuals (Caporaso et al., 2011; Dethlefsen and Relman, 2011; Ubeda et al., 2010). Thus, we aim to quantitatively characterize how the relative contribution of social interaction and noise level affects the computation of the mean residence time.
In order to determine the relative time spent in each domination state, we compute the probability of residence πi(t) in each stable state i = 1, 2,…, N using master equations (Gardiner, 1997). This method is more efficient than simulating the system time evolution by direct integration of the Langevin equations because it boils down to solving a deterministic second-order differential equation. Furthermore, this approach scales up well when the number of microbial groups increases, in contrast to the numerical solution of the FPE which can become prohibitive when N > 3. In our model, the master equations for the probability πi(t) of residing in the tolerant i = 1 or sensitive i = 2 domination state are:
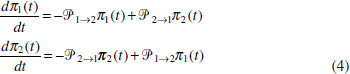
where ![]() i→j is the transition rate from state i to j, which can be obtained in terms of the sum over all the state space trajectories connecting i to j.
i→j is the transition rate from state i to j, which can be obtained in terms of the sum over all the state space trajectories connecting i to j.
By solving this system of equations at steady-state, we obtain the residence probabilities ![]() After computing the transition rate
After computing the transition rate ![]() as a function of the parameters, as reported in the Methods, we determine π2, which is our theoretical prediction for the mean relative residence time
as a function of the parameters, as reported in the Methods, we determine π2, which is our theoretical prediction for the mean relative residence time ![]() t2/(t1 +t2)
t2/(t1 +t2)![]() spent in the tolerant domination state (Fig. A22-4). The theoretical predictions are in good agreement with those obtained by simulating the dynamics multiple times and averaging over different realizations of the noise. A first consequence from this analysis is that the time needed to naturally revert from the altered state depends exponentially on the noise amplitude (1/D).
spent in the tolerant domination state (Fig. A22-4). The theoretical predictions are in good agreement with those obtained by simulating the dynamics multiple times and averaging over different realizations of the noise. A first consequence from this analysis is that the time needed to naturally revert from the altered state depends exponentially on the noise amplitude (1/D).
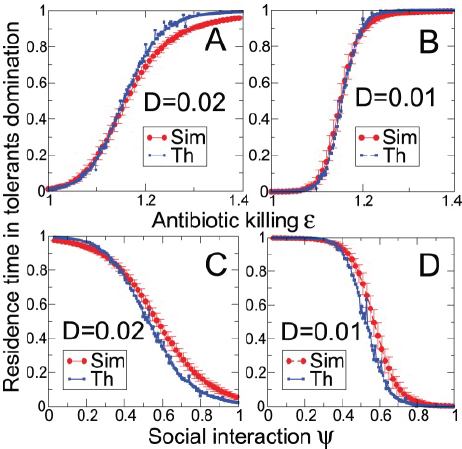
FIGURE A22-4 Microbiota resident time in antibiotic-tolerant domination as a function of the: A-B) antibiotic action (ε) and C-D) social interaction (ψ) parameters. Blue circles show the theoretical predictions obtained by determining the probability of the most probable path. Red circles are obtained by simulating the Langevin dynamics over 10,000 iterations and averaged for 1,000 noise realizations. Higher order-corrections can be included to increase the theoretical estimation accuracy.
As such, we predict that for the case of an isolated system (D ~ 0) the switching time is exponentially larger than any other microscopic scale and the return to a previous unperturbed state is very unlikely. On the contrary, as the level of random exposure D is increased, the time to recover to the pre-treated configuration decreases (see Fig. A22-S4 in Text S1). Additionally, this method can be considered as a way to indirectly determine the strength of the ecological interactions between microbes which can be achieved by measuring the amount of time that the microbial population spends in one of the particular microbiota states. Therefore, it can potentially be applied to validate proposed models of ecological interactions by comparing residence times measured experimentally with theoretical predictions.
Analysis of Metagenomic Data Reveals Antibiotic-Tolerant and Antibiotic-Sensitive Bacteria
We now focus on the dynamics of bacteria detected in the human intestine and test the suitability of our two-group representation by re-analyzing the time behaviour in the recently published metagenomic data of Dethlefsen and Relman (2011). The data consisted of three individuals monitored over a 10 month period who were subjected to two courses of the antibiotic ciprofloxacin. Since the data are noisy and complex, and the individual subjects’ responses to the antibiotic are distinct (Dethlefsen and Relman, 2004), identifying a time behaviour by manual screening is not a trivial task. We do it by using singular value decomposition (SVD) to classify each subject p phylotype-by-sample data matrix Xp into its principal components. Because of inter-individual variability we obtain, for each subject, the right and left eigenvectors associated to each eigenvalue. By ranking the phylotypes based on their correlation with the first two components we recover characteristic temporal patterns for each volunteer (Alter et al., 2000; Brauer et al., 2006).
In all three subjects, we observe that, in spite of the individualized antibiotic effect, the two dominant eigenvalues or principal components together capture about 70% of the variance observed in the data (Fig. A22-5A–C). Invariably, the first component shows a decrease in correspondence to antibiotic treatment and reflects the behaviour of antibiotic-sensitive bacteria (green line in Fig. A22-5D–F). Conversely, the second component increases with the antibiotic treatment and represents antibiotic-tolerants (red line in Fig. A22-5D–F). The observation that each subject’s microbiota can be decomposed into two groups of bacteria with opposite responses to antibiotics supports the validity of the two-group approach used in our model. Classification of each individual’s phylotypes as sensitive or tolerant can be obtained by determining their correlation with the two principal components (see Text S1) (information in the right-eigenarrays matrix from SVD). Bacteria correlated with component 1 are usually highly abundant before antibiotic treatment and drop strongly during treatment, often below detection. Vice-versa, bacteria correlated with component 2 are typically in low abundance before the antibiotic and increase with antibiotic administration (Fig. A22-5G–I). Interestingly, despite significant inter-individual differences in recovery time (Fig. A22-5G–I) and individualized response of each subject, the data show that in each individual the majority of bacteria are antibiotic-sensitive and only a small but significant fraction are tolerant to ciprofloxacin (see Text S1). The recognition of these time-patterns could be considered as a possible tool to indirectly determine the susceptibility of non-culturable commensal bacteria to FDA-approved antimicrobial compounds. However, the presence of strains in the same phylotypes that display both behaviors in response to the drug may constitute a significant challenge for the success of this method.
The time evolution of the phylotypes (Fig. A22-5G–I) qualitatively agrees with our theoretical prediction that after the antibiotic administration the system
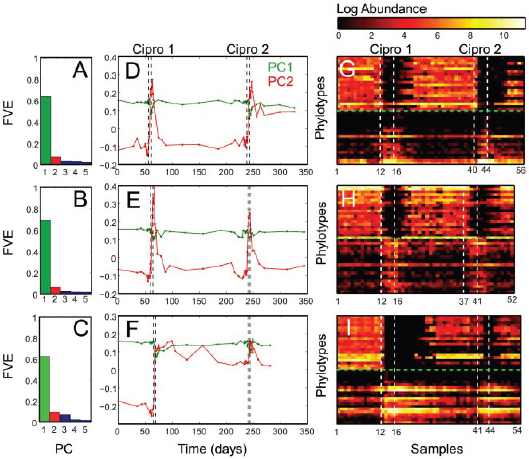
FIGURE A22-5 Analysis of microbiota response to the antibiotic ciprofloxacin from three subjects (Dethlefsen and Relman, 2011) using singular value decomposition identifies antibiotic-sensitive and antibiotic-tolerant bacteria. A-C: fraction of variance explained by the five most dominant components. D-F: plot of each sample component 1 (green) and 2 (red) coordinates versus sample time. G-I: sorting of the phylotypes log2-transformed abundance matrix based on the correlation within the two principal component. Above (below) the green dashed lines, we display the time series of the top 20 phylotypes strongly correlated (anti-correlated) with component 1 and anti-correlated (correlated) with 2 and dropping (increasing) during treatment, which we identify as sensitves (tolerants). Subject 3 (C, F, I) displays absence of sensitive bacteria for a prolonged period of about 50 days after the first antibiotic treatment. This confirms the fact that microbiota response to antibiotic can differ from subject to subject. Additionally, it also supports our model prediction of remaining locked in a tolerant-dominated state after antibiotic treatment cessation.
moves fast, meaning in a time smaller than any other observable time-scale, into a new stable state with less sensitives and more tolerants. Further, the data also suggest that the return to sensitive domination happens after a recovery-time scale that depends on the microbial composition.
Discussion
We present a model of inter-bacterial interactions that explains the effect of antibiotics and the counter-intuitive observation that an antibiotic-induced shift in microbiota composition can persist even after antibiotic cessation. Our analysis predicts a crucial dependence of the recovery time on the level of noise, as suggested by experiments with mice where the recovery depends on the exposure to mice with untreated microbiota (Ubeda et al., 2010). The simple model here introduced is inspired by classical ecological modeling such as competitive Lotka-Volterra models (Solé and Bascompte, 2006; Zhu and Yin, 2009), but relies on mechanistic rather than phenomenological assumptions, such as the logistic growth. Although more sophisticated multi-species models include explicit spatial structure to describe microbial consortia (Bucci et al., 2011; Mitri et al., 2011; Munoz-Tamayo et al., 2010, 2011), our model is a first attempt to quantitatively analyze the interplay between microbial social interactions (ψ) and stochastic fluctuations (D > 0) in the gut microbiota. We find that these two mechanisms are the key ingredients to reproduce the main features of the dynamics in response to antibiotic (sudden shifts and recovery). Our model can be easily generalized to include spatial variability and more complicated types of noise. Therefore we provide a theoretical framework to quantify microbiota resilience against disturbances, which is an importance feature in all ecosystems (Holling, 1973). By introducing a new stochastic formulation, we were able to characterize composition switches within the context of state transition theory (Langer, 1967, 1968), an important development over similar ecological models of microbial populations (Mao-Jones et al., 2010). We present a new method to calculate the rate of switching between states that identifies the most likely trajectory between two stable states and their relative residence time, which can be subjected to experimental validation. Finally, we apply SVD to previously published metagenomic data (Dethlefsen and Relman, 2011), which allows us to classify the bacteria of each subject in two groups according to their temporal response to a single antibiotic. The SVD method has been used before to find patterns in temporal high-throughput data, including transcription microarrays (Alter et al., 2000) and metabolomics (Yuan et al., 2009). Although our approach seems to capture well the main temporal microbiota patterns, we should note that the use of the Euclidean distance as a metric for microbiome analysis presents limitations and recent studies have proposed alternative choices (Gonzalez and Knight, 2011; Hamady et al., 2009; Kuczynski et al., 2010). We also opt for an indirect gradient analysis method (ter Braak and Prentice, 2004) because we are
interested in emergent patterns from the data regardless of the measurements of the external environmental variable (i.e. presence or absence of the antibiotic) (Kuczynski et al., 2010).
We propose a mechanism of interaction between two bacterial groups to explain the lack of recovery observed in the experiments that can be validated in the near future. Although training the model with the available data sets would be of great interest, this will not be useful in practice because we need more statistical power to be predictive. However, we anticipate that a properly validated mathematical model of the intestinal microbiota will be a valuable tool to assist in the rational design of antibiotic therapies. For example, we predict that the rate of antibiotic dosage will play a crucial role. In order to let the microbiota recover from antibiotic treatment, it is better to gradually decrease antibiotic dosage at the first sign of average microbiota composition change, which has to be larger than the threshold community change represented by the day-to-day variability (Caporaso et al., 2011), rather than waiting for tolerant-domination and then stopping antibiotic treatment.
We show here the application of our theory to a two-bacterial group scenario because we are interested in the microbiota response when challenged with a single antibiotic. However, in more realistic conditions the microbiota is subjected to different types of perturbations, which may drive it towards more alternative stable states. Our theory of the microbial-states switches characterization can be naturally extended to more than two states and consists of the solution of the linear system of equations πP = 0, where π is the array of probability of residing in each stable state and P is the matrix of transition rates among the states.
The ongoing efforts to characterize the microbial consortia of the human microbiome can yield tremendous benefits to human health (Ichinohe et al., 2011; Lee and Mazmanian, 2010; Turnbaugh et al., 2009; Veiga et al., 2010). Within the next few years, we are certain to witness important breakthroughs, including an increase in the number of microbiomes sequenced as well as in sequencing depth. Yet, without the proper ecological framework these complex ecosystems will remain poorly understood. Our study shows that, as in other complex microbial ecosystems, ecological models can be valuable tools to interpret the dynamics in the intestinal microbiota.
Methods
Full Model and Simplification
The model introduced in equations 1 and 2 is derived from the more detailed model described below. We model the bacterial competition in a well-mixed system in the presence of antibiotic treatment by means of the following stochastic differential equations:
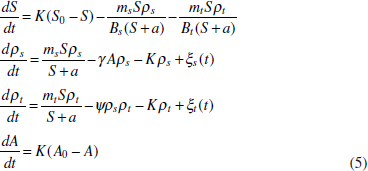
where we account for two bacterial groups; the intestinal resident sensitive flora ρs and an antibiotic tolerant one ρt. Additionally, we also consider the substrate S and the antibiotic A densities. The antibiotic time evolution is simply a balance between inflow and outflow (i.e. no decay due to microbial degradation) where K is the system’s dilution rate, which sets the characteristic microscopic timescale, and A0 is the constant density of the incoming antibiotic, which can be time dependent. Similarly the substrate concentration, S, results from a mass balance from influx and microbial consumption. As for the antibiotic, S0 is the constant density of the incoming nutrient (i.e. the concentration of resources coming from the small-intestine). The second and third terms in the right-hand side of the second equation in (5) describe the amount of substrate consumed by bacterial growth assuming Monod kinetics where ms (mt) is the maximum growth rate for sensitives (tolerants), a is the half-saturation constant for growth, which parametrizes the bacterial affinity to the nutrient, and Bs (Bt) is the yield for growth for sensitives (tolerants). The last two equations describe how sensitives and tolerants grow on the substrate available and are diluted with the factor K. We mimic the effect of the antibiotic on the sensitives adding a term proportional to the sensitive density where the constant of proportionality γ A is the antibiotic-killing rate. We also introduce a direct inhibition term ψρs, which mimics the inhibition of sensitive bacteria on the tolerants (social interaction). Finally the Gaussian random variables ξsξt, are the additive random patterns of exposure and represent the random microbial inflows (outflows) from (to) the external environment.
It is convenient to scale the variables and set the dilution rate to unity (K = 1). Therefore, all the rates have to be compared with respect to the system characteristic dilution rate. Introducing ![]()
![]()
![]()
![]()
![]() dropping the tilde symbols, we obtain the following dimensionless model:
dropping the tilde symbols, we obtain the following dimensionless model:
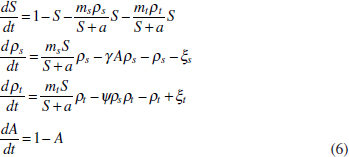
If we assume that the antibiotic is a fast variable compared to the microbial densities (ρs ρt) (i.e. the time-scale at which the antibiotic reaches stationary state is smaller than that of the bacteria), we can solve ![]() for and obtain A = 1. If we also assume that the incoming substrate is all consumed in microbial growth, therefore maintaining the population in a stationary state with respect to the available resources, and that, similarly to the antibiotic, the resources equilibrate much faster than the bacterial densities (quasi-steady state assumption,
for and obtain A = 1. If we also assume that the incoming substrate is all consumed in microbial growth, therefore maintaining the population in a stationary state with respect to the available resources, and that, similarly to the antibiotic, the resources equilibrate much faster than the bacterial densities (quasi-steady state assumption, ![]() ), we obtain that:
), we obtain that:
![]()
If we now define a new parameter ε = (γ +1) describing the relative ratio of the combination of antibiotic killing and natural mortality (i.e. wash-out) between sensitives and tolerants, the model reduces to the two variables model in r reported in equations (1–2).
Effective Potential and Location of Long-Term States
The introduction of random noise has the important consequence of changing the composition of the stable states (Fig. A22-3A). In order to characterize this phenomenon, we expand the solution of the Langevin equations (1–2) around one of the stable states obtaining the following set of equations for the variable ζ = ρ – ρi:
![]()
where to simplify the notation we drop the explicit time-dependence. We can easily recognize the first derivative of the force on the right-hand side as the Jacobian matrix computed in one of the minima ![]() This equation can be solved order by order by defining the expansion ζ = ζ(0) + ζ(1) + … and writing the equations for each order as:
This equation can be solved order by order by defining the expansion ζ = ζ(0) + ζ(1) + … and writing the equations for each order as:
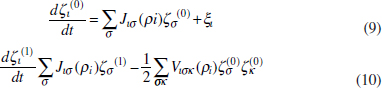
Assuming that the initial condition at time zero is ζ1(0) = 0, which can always be neglected for long-term behaviour, the solution of equation (9) is
![]()
This means that the average location of the minima at zero order is not modified by the noise since ![]() ζ(0)
ζ(0)![]() ∝
∝ ![]() ξ
ξ![]() =0. By computing the solution of the equation (10) we similarly find that:
=0. By computing the solution of the equation (10) we similarly find that:
![]()
The long-time average value of the first order correction now reads:
![]()
The time integral can be easily computed assuming that the eigenvalues of J are negative, or at least their real part is, as it should be for stable fixed points; therefore we obtain that:
![]()
Thus, we find that the effect of random fluctuations is to correct the value of the stable points as if an external field, proportional to strength of the fluctuations, was present. This field is equal to the mean square displacement at large time opportunely weighted by the inverse of the curvature of the bare potential around the stable points, J(ρi). The correlation can be now computed using equation (11) and reads:
![]()
Since ![]() ξσ(t′)ξσ′ (t″)
ξσ(t′)ξσ′ (t″)![]() = Dδσσ′δ(t′–t″) the previous equation simplifies to
= Dδσσ′δ(t′–t″) the previous equation simplifies to
![]()
which results in ![]() ζ(1)
ζ(1)![]() ∝ D.
∝ D.
Theoretical Estimate of the Mean Residence Time
The mean residence time in each state is proportional to the residence probability pi(t) defined in equation (4). To obtain it, we need to compute the transition rate Pi→j as a function of the model parameters as:
![]()
where ti and tf are the initial and final time and ![]() ρ is the functional integral over the trajectory ρ(t). Each time trajectory, solution of equations (1–2), has an associated weight P(ρ), defined as:
ρ is the functional integral over the trajectory ρ(t). Each time trajectory, solution of equations (1–2), has an associated weight P(ρ), defined as:
![]()
By discretizing the time so that t = ![]() τ with
τ with ![]() = 1,…, M and τ the microscopic time step, we obtain that the Langevin equations can be written using the Ito prescription (ter Braak and Prentice, 2004) as:
= 1,…, M and τ the microscopic time step, we obtain that the Langevin equations can be written using the Ito prescription (ter Braak and Prentice, 2004) as:
![]()
where we use the short notation ρ(![]() τ) = ρ
τ) = ρ![]() and the initial value is ρ0 = ρi. The time discretization allows us to interpret the functional integral in equation (18) as:
and the initial value is ρ0 = ρi. The time discretization allows us to interpret the functional integral in equation (18) as:
![]()
Since the noise is Gaussian and white, its distribution now reads:
![]()
This can be justified using the property of the delta-function ∫ d(t – t′)dt = 1 and its discrete time version ![]() so that ƒ(τ) = ε–1 follows and d(t – t′) → dij /τ.
so that ƒ(τ) = ε–1 follows and d(t – t′) → dij /τ.
Using the properties of the delta function, and integrating out all ξ![]() s, the continuous limit expression of equation (21) is
s, the continuous limit expression of equation (21) is
![]()
where ![]() has an intuitive interpretation in thermodynamics and it is related to the entropy production rate (Seifert, 2008). By using stationary-phase approximation, it turns out that in the computation of the rate defined in (17) only one path matters, ρ*, which is the most probable path. Higher
has an intuitive interpretation in thermodynamics and it is related to the entropy production rate (Seifert, 2008). By using stationary-phase approximation, it turns out that in the computation of the rate defined in (17) only one path matters, ρ*, which is the most probable path. Higher
order factors are proportional to the term ΔT = tf – ti (Langer, 1967, 1968), and therefore simplify with the denominator in equation (21). This comes from the fact that several almost optimal paths can be constructed starting from r*. In the optimal path, the system stays in a stable state for a very long time, then it rapidly switches to the other stable state where it persists until tf. By shifting the switching time one obtains sub-optimal paths that, at the leading order in D, give the same contribution of the optimal one and their number is directly proportional to ΔT. This leads to
![]()
The functional Gaussian integral can be computed (Langer, 1967, 1968) and only provides a sub-leading correction to the saddle-point contribution resulting in the transition rate formula ![]() which is reported in the Results D section.
which is reported in the Results D section.
We now need to determine the optimal path and its associated action S (ρ*). This path is defined as the one where the functional derivative of S is set to zero such that the initial and final states are fixed. This produces a set of second-order differential equations
![]()
which can be solved imposing the initial conditions on ρi and ![]() (ti).
(ti).
It is easy to verify that the downhill solution is ![]() = F. and it is associated with null action. Meanwhile, the ascending trajectory, which is the one leading to a non-zero action and hence gives the transition rate value, is not given by
= F. and it is associated with null action. Meanwhile, the ascending trajectory, which is the one leading to a non-zero action and hence gives the transition rate value, is not given by ![]() = −F, as it would be for conservative field of forces. This means that in presence of a dissipative term the reverse optimal path from the minimum to the maximum is different with respect to the one connecting the maximum from the minimum of the landscape.
= −F, as it would be for conservative field of forces. This means that in presence of a dissipative term the reverse optimal path from the minimum to the maximum is different with respect to the one connecting the maximum from the minimum of the landscape.
As the last point, we want to show that the action associated to the optimal path can be further simplified by noticing that
![]()
We can easily prove this condition by showing that the time derivative ![]() vanishes when equation (24) is satisfied and remembering that the optimal path connects two stable states where F = 0 and
vanishes when equation (24) is satisfied and remembering that the optimal path connects two stable states where F = 0 and ![]() = 0 . This property allows us to rewrite the action as:
= 0 . This property allows us to rewrite the action as:
![]()
We solved numerically the equation (24) using a trial-and-error approach. We varied the first-derivative at initial time in order to arrive as close as possible to the final point within some numerical precision. In principle the ideal trajectory connecting two stable points should be computed in the limit of ![]() (ti) → 0 but this trajectory will take infinite time. We report three examples of most probable paths connecting the points i to j and reverse for a chosen set of
(ti) → 0 but this trajectory will take infinite time. We report three examples of most probable paths connecting the points i to j and reverse for a chosen set of ![]() (ti) in Fig. S6 of the Text S1.
(ti) in Fig. S6 of the Text S1.
Singular Value Decomposition
We first rarefy the raw phylotypes counts matrix as in (Dethlefsen and Relman, 2011). We then normalize the logarithm of the counts according to the following procedure: 1) we add one to all the phylotypes counts to take into account also for the non-detected phylotypes in each sample, 2) we log-transform the data and 3) we normalize the resulting matrix with respect to the samples averages. In formulae, the count associated to phylotype i in sample j for each subject p is
![]()
where ![]() (Rawijp +1) / N is the average value of the counts in each sample and N is the total number of phylotypes. Among all possible normalization schemes, we decide to subtract the column averages because we aim at identifying patterns within samples based on their correlation in bacterial composition. Indeed, the covariance matrix of the samples is proportional to (Xp)TXp, where (Xp)T is the transpose matrix. SVD on the matrix Xp is thus equivalent to the principal component analysis (PCA) performed on the samples covariance matrix.
(Rawijp +1) / N is the average value of the counts in each sample and N is the total number of phylotypes. Among all possible normalization schemes, we decide to subtract the column averages because we aim at identifying patterns within samples based on their correlation in bacterial composition. Indeed, the covariance matrix of the samples is proportional to (Xp)TXp, where (Xp)T is the transpose matrix. SVD on the matrix Xp is thus equivalent to the principal component analysis (PCA) performed on the samples covariance matrix.
Acknowledgments
The authors acknowledge Chris Sander, Kevin Foster, Jonas Schluter, Carlos Carmona-Fontaine, Massimo Vergassola, Stefano Di Talia, Les Dethlefsen and Deb Bemis for their insightful comments and help. S.B. acknowledges the GDRE 224 GREFI-MEFI CNRS-INdAM.
References
Alter O, Brown PO, Botstein D. Singular value decomposition for genome-wide expression data processing and modeling. Proc Natl Acad Sci U S A. 2000;97:10101–10106.
Arumugam M, Raes J, Pelletier E, Le Paslier D, Yamada T, et al. Enterotypes of the human gut microbiome. Nature. 2011;473:174–180.
Bishara J, Peled N, Pitlik S, Samra Z. Mortality of patients with antibiotic-associated diarrhoea: the impact of clostridium diffcile. J Hosp Infect. 2008;68:308–314.
Borody TJ, Warren EF, Leis SM, Surace R, Ashman O, et al. Bacteriotherapy using fecal ora: Toying with human motions. J Clin Gastroenterol. 2004;38:475–483.
Brauer MJ, Yuan J, Bennett BD, Lu W, Kimball E, et al. Conservation of the metabolomic response to starvation across two divergent microbes. Proc Natl Acad Sci U S A. 2006;103:19302–19307.
Bucci V, Nadell CD, Xavier JB. The evolution of bacteriocin production in bacterial biofilms. Am Nat. 2011;178:E162–E173.
Buffe CG, Jarchum I, Equinda M, Lipuma L, Gobourne A, et al. Profound alterations of intestinal microbiota following a single dose of clindamycin results in sustained susceptibility to c. difficile-induced colitis. Infect Immun. 2012;80:63–73.
Caporaso J, Lauber C, Costello E, Berg-Lyons D, Gonzalez A, et al. Moving pictures of the human microbiome. Genome Biol. 2011;12:R50.
Corr SC, Li Y, Riedel CU, O’Toole PW, Hill C, et al. Bacteriocin production as a mechanism for the antiinfective activity of lactobacillus salivarius ucc118. Proc Natl Acad Sci U S A. 2007; 104:7617–7621.
Dabard J, Bridonneau C, Phillipe C, Anglade P, Molle D, et al. Ruminococcin A, a new lantibiotic produced by a Ruminococcus gnavus strain isolated from human feces. Appl Env Microbiol. 2001; 67:4111–4118.
Dethlefsen L, Eckburg PB, Bik EM, Relman DA. Assembly of the human intestinal microbiota. Trends Ecol Evol. 2006;21:517–523.
Dethlefsen L, Huse S, Sogin ML, Relman DA. The pervasive effects of an antibiotic on the human gut microbiota, as revealed by deep 16 s rrna sequencing. PLoS Biol. 2008;6:e280.
Dethlefsen L, McFall-Ngai M, Relman DA. An ecological and evolutionary perspective on human microbiome mutualism and disease. Nature. 2007;449:811–818.
Dethlefsen L, Relman DA. Incomplete recovery and individualized responses of the human distal gut microbiota to repeated antibiotic perturbation. Proc Natl Acad Sci U S A. 2011;108:4554–4561.
dos Santos VM, Mller M, de Vos WM. Systems biology of the gut: the interplay of food, microbiota and host at the mucosal interface. Curr Opin Biotechnol. 2010;21:539–550
Endt K, Stecher B, Chaffron S, Slack E, Tchitchek N, et al. The microbiota mediates pathogen clearance from the gut lumen after non-typhoidal salmonella diarrhea. PLoS Pathog. 2010;6:e1001097.
Foster JA, Krone SM, Forney LJ. Application of ecological network theory to the human microbiome. Interdiscip Perspect Infect Dis. 2008;2008:839501.
Fukuda S, Toh H, Hase K, Oshima K, Nakanishi Y, et al. Bifidobacteria can protect from enteropathogenic infection through production of acetate. Nature. 2011;469:543–547.
Galan RF, Ermentrout GB, Urban NN. Stochastic dynamics of uncoupled neural oscillators: Fokkerplanck studies with the finite element method. Phys Rev E. 2007;76:056110.
Gardiner C. Handbook of Stochastic Methods in Physics, Chemistry, and other Natural Sciences. Springer-Verlag; 1997. 442
Gardiner CW. The escape time in nonpotential systems. J Stat Phys. 1983;30:157–177.
Gonzalez A, Knight R. Advancing analytical algorithms and pipelines for billions of microbial sequences. Curr Opin Biotechnol. 2011;23:64–71.
Hamady M, Lozupone C, Knight R. Fast unifrac: facilitating high-throughput phylogenetic analyses of microbial communities including analysis of pyrosequencing and phylochip data. ISME J. 2009;4:17–27.
Holling C. Resilience and stability of ecological systems. Annu Rev Ecol Evol Syst. 1973;4:1–23.
Ichinohe T, Pang IK, Kumamoto Y, Peaper DR, Ho JH, et al. Microbiota regulates immune defense against respiratory tract inuenza a virus infection. Proc Natl Acad Sci U S A. 2011;108:5354–5359.
Jones N. Social network wants to sequence your gut. Nature. 2011 doi: 10.1038/news.2011.523.
Keeney KM, Finlay BB. Enteric pathogen exploitation of the microbiota-generated nutrient environment of the gut. Curr Opin Microbiol. 2011;14:92–98.
Khoruts A, Sadowsky MJ. Therapeutic transplantation of the distal gut microbiota. Mucosal Immunol. 2011;4:4–7.
Kuczynski J, Liu Z, Lozupone C, McDonald D, Fierer N, et al. Microbial community resemblance methods differ in their ability to detect biologically relevant patterns. Nat Meth. 2010;7:813–819.
Langer JS. Theory of the condensation point. Ann Phys. 1967;41:108–157.
Langer JS. Theory of nucleation rates. Phys Rev Lett. 1968;21:973–976.
Lee YK, Mazmanian SK. Has the microbiota played a critical role in the evolution of the adaptive immune system? Science. 2010;330:1768–1773.
Ley RE, Peterson DA, Gordon JI. Ecological and evolutionary forces shaping microbial diversity in the human intestine. Cell. 2006;124:837–848.
Littman D, Pamer E. Role of the commensal microbiota in normal and pathogenic host immune responses. Cell Host Microbe. 2011;10:311–323.
Mao-Jones J, Ritchie KB, Jones LE, Ellner SP. How microbial community composition regulates coral disease development. PLoS Biol. 2010;8:e1000345.
Mitri S, Xavier JB, Foster KR. Social evolution in multispecies biofilms. Proc Natl Acad Sci U S A.2011;108:10839–10846.
Monod J. The growth of bacterial cultures. Annu Rev Microbiol. 1949;3:371–394.
Munoz-Tamayo R, Laroche B, Walter, Dor J, Leclerc M. Mathematical modelling of carbohydrate degradation by human colonic microbiota. J Theor Biol. 2010;266:189–201.
Munoz-Tamayo R, Laroche B, Walter, Dor J, Duncan SH, et al. Kinetic modelling of lactate utilization and butyrate production by key human colonic bacterial species. FEMS Microbiol Ecol.2011;76:615–624.
Neish AS. Microbes in gastrointestinal health and disease. Gastroenterology. 2009;136:65–80
Pamer EG. Immune responses to commensal and environmental microbes. Nat Immunol.2007;8:1173–1178.
Pultz NJ, Stiefel U, Subramanyan S, Helfand MS, Donskey CJ. Mechanisms by which anaerobic microbiota inhibit the establishment in mice of intestinal colonization by vancomycin-resistant enterococcus. J Inf Dis. 2005;191:949–956.
Ruder WC, Lu T, Collins JJ. Synthetic biology moving into the clinic. Science. 2011;333:1248–1252.
Scheffer M. Alternative Stable States and Regime Shifts in Ecosystems. In: Simon ALevin., editor.2009, The Princeton guide to ecology. Princeton, New Jersey: Princeton University Press; 2009. pp. 359–406.
Seifert U. Stochastic thermodynamics: principles and perspectives. Eur Phys J B. 2008;64:423–431.
Solé R, Bascompte J. Self-organization in complex ecosystems, volume 42. Princeton, New Jersey: Princeton Univ Press; 2006. 392
Stecher B, Hardt WD. The role of microbiota in infectious disease. Trends Microbiol. 2008;16:107–114.
StecherB, Hardt WD. Mechanisms controlling pathogen colonization of the gut. Curr Opin Microbiol. 2011; 14:82–91.
ter Braak CJ, Prentice I. A theory of gradient analysis. In: Caswell H, editor. Advances in Ecological Research: Classic Papers, Vol 34. Boston: Academic Press; 2004. pp. 235–282.
Turnbaugh PJ, Hamady M, Yatsunenko T, Cantarel BL, Duncan A, et al. A core gut microbiome in obese and lean twins. Nature. 2009;457:480–484.
Ubeda C, Taur Y, Jenq RR, Equinda MJ, Son T, et al. Vancomycin-resistant enterococcus domination of intestinal microbiota is enabled by antibiotic treatment in mice and precedes bloodstream invasion in humans. J Clin Invest. 2010;120:4332–4341.
Veiga P, Gallini CA, Beal C, Michaud M, Delaney ML, et al. Bifidobacterium animalis subsp. lactis fermented milk product reduces inammation by altering a niche for colitogenic microbes. Proc Natl Acad Sci U S A. 2010;107:18132–18137.
Willing BP, Russell SL, Finlay BB. Shifting the balance: antibiotic effects on hostmicrobiota mutualism. Nat Rev Micro. 2011;9:233–243.
Wu GD, Chen J, Hoffmann C, Bittinger K, Chen YY, et al. Linking long-term dietary patterns with gut microbial enterotypes. Science. 2011;334:105–108.
Xavier JB. Social interaction in synthetic and natural microbial communities. Mol Syst Biol.2011;7:483.
Yuan J, Doucette CD, Fowler WU, Feng XJ, Piazza M, et al. Metabolomics-driven quantitative analysis of ammonia assimilation in E. coli. Mol Syst Biol. 2009;5:302.
Zhu C, Yin G. On competitive lotkavolterra model in random environments. J Math Anal Appl.2009; 357:154–170.
A22-SUPPORTING INFORMATION
A22-SI reports additional calculations, figures, and details, on: (1) model and relative stability analysis, (2) effect on random fluctuations and noise-induced dynamics and (3) Singular Value Decomposition.
SOCIAL INTERACTION, NOISE AND ANTIBIOTIC-MEDIATED SWITCHES IN THE INTESTINAL MICROBIOTA97
Vanni Bucci,98,99,100Serena Bradde,98,99,100Giulio Biroli,101Joao B. Xavier98,100
Model and Stability Analysis
Four-dimensional Model
We determine the expressions of four biologically meaningful rest points (ρ0, ρ1, ρ2, ρ3) by setting to zero the right-hand sides of eq. (6) in the main text. The first fixed point ρ0= (1, 0, 0, 1) is the one where both bacterial groups are extinct. The second fixed point ![]() represents the sensitive monoculture where
represents the sensitive monoculture where ![]() µt = a/(mt – 1) are the the break-even concentrations of ρs and ρt without antibiotic presence (Hsu and Waltam, 2000). ρ1 exists if i) ms > ε and ii) ms > αε. The third fixed point ρ2 = (μt, 0, 1 – μt, 1) represents the scenario of tolerant monoculture. This point exists if: i) mt > 1 and ii) mt > α. The last fixed point ρ3 = (μs, ρs3, ρt3, 1) corresponds to the coexistence and the relative bacterial density are:
µt = a/(mt – 1) are the the break-even concentrations of ρs and ρt without antibiotic presence (Hsu and Waltam, 2000). ρ1 exists if i) ms > ε and ii) ms > αε. The third fixed point ρ2 = (μt, 0, 1 – μt, 1) represents the scenario of tolerant monoculture. This point exists if: i) mt > 1 and ii) mt > α. The last fixed point ρ3 = (μs, ρs3, ρt3, 1) corresponds to the coexistence and the relative bacterial density are:
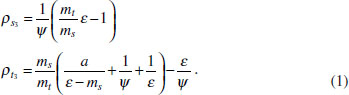
Three conditions are necessary for the positivity of ρ3: i) ms, ii) εmt > ms and iii) ![]() Since the parameters are positive, condition iii) gives the additional constrain of ms > εα.
Since the parameters are positive, condition iii) gives the additional constrain of ms > εα.
___________
97 Reprinted with permission from PLoS Computational Biology.
98 Program in Computational Biology, Memorial Sloan-Kettering Cancer Center, New York, U.S.A.
99 E-mail: bucciv@mskcc.org, serena.bradde@pasteur.fr, xavierj@mskcc.org.
100 Joint first authorship
101 Institut Physique Théorique (IPhT) CEA Saclay, and CNRS URA, Gif Sur Yvette, France.
The stability of the system is studied by linearising eq. (6) of the main text around each of the four fixed points and studying the sign of the eigenvalues of the relative Jacobian matrix, which is defined by:
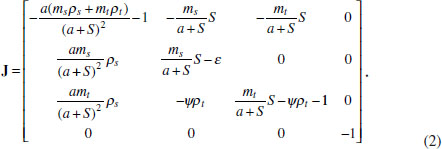
The eigenvalues relative to Jρ0 are ![]() –ε. ρ0 is stable if all eigenvalues λ0 are negative, which determines the following inequalities: i) mt < α and ii) ms < αε. It is worth noticing that the conditions ensuring the stability of ρ0 are the opposite of those for the existence of ρ1 and ρ2.
–ε. ρ0 is stable if all eigenvalues λ0 are negative, which determines the following inequalities: i) mt < α and ii) ms < αε. It is worth noticing that the conditions ensuring the stability of ρ0 are the opposite of those for the existence of ρ1 and ρ2.
The stability of ρ1 is determined by studying the sign of: ![]() = –1,
= –1, ![]()
![]() where
where ![]() The imposition of
The imposition of ![]() < 0 gives the following inequalities: i) ms > ε and ii)
< 0 gives the following inequalities: i) ms > ε and ii) ![]() The conditions for
The conditions for ![]() < 0 are equivalent to those for ρ1 existence. In summary, if ρ1 is well-defined, it is stable given the condition ii).
< 0 are equivalent to those for ρ1 existence. In summary, if ρ1 is well-defined, it is stable given the condition ii).
The eigenvalues associated to Jρ2 read: ![]()
![]() The conditions for stability of ρ2 are: i) mt > α and ii) ms/mt < ε.
The conditions for stability of ρ2 are: i) mt > α and ii) ms/mt < ε.
To study the stability of ρ3, we use the Routh-Hurwitz criteria (Otto and Day, 2007). Let p = r4 + c1r3 + c2r2 + c3r + c4 being the fourth-order characteristic polynomial for Jρ3, then the rest point ρ3 is stable given the necessary and sufficient conditions: i) c1 > 0, ii) c3 > 0, iii) c4 > 0 and iv) c1c2c3 > c32 + c12c4. It is easy to verify that conditions i) and ii) are always satisfied:
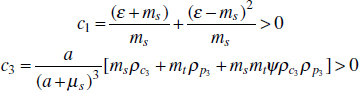
However, it is also fairly easy to see that condition iii) does not hold. Given the expression for c4
![]()
condition iii) requires that ms(1 + ψρc3) > mt (ε + ψρρ3). After some algebra we can see that this condition is false when the rest point is well-defined.
It is now possible to determine the criteria describing the system mono- or bistability in function of the model parameters. By assuming the existence of both fixed points and by comparing the conditions of stability obtained from the linearisation analysis we derive the following relationships:
- Monostability with only sensitives

- Monostability with only tolerants,
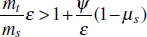
- Bistability with both mutually exclusive sensitivities and tolerants monocultures
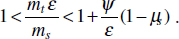
These criteria highlight two major concepts. First, it is necessary to have a negative feedback (i.e. ψ > 0) from sensitives to tolerants for bistability to arise. If no negative feedback is present the system can set only in one of the two monostable states. Second, the modulation effect of the antibiotic ε. It is clear that an increase in antibiotic-killing needs to be counteracted by an increase in selective pressure in order to maintain sensitives stability.
Two-dimensional Model
The two dimensional model of eqs. (1) and (2) in the main text is obtained by: 1) substituting eq. (7) of the main text into eq. (6), 2) simplifying the saturation terms by dividing numerator and denominator by ms and 3) introducing f = mt /ms.
We repeat the linear stability analysis and we determine three equivalent fixed points (Fig. A22-S1): ρ1 = (1/ε, 0), which represents the sensitive monoculture, ρ2 = (0, 1), which represents the tolerants monoculture and ρ3 = 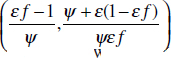 which represents a state where both groups coexist. ρ1 and ρ2 are always exist while state ρ3 exists if and only if
 ![]() The Jacobian matrix J(ρ) now reads:
The Jacobian matrix J(ρ) now reads:
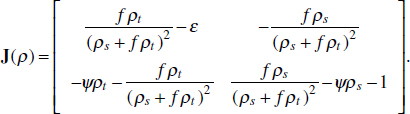
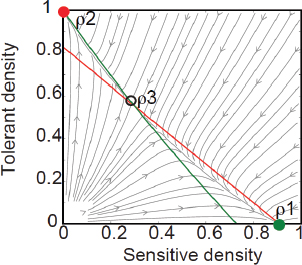
FIGURE A22-S1 Vectorial field of forces and the phase-plane analysis for bistable conditions, for the following parameter values: ratio between tolerant and sensitive maximum growth rate f = 1.1, antibiotic killing rate ε = 1.1 and social interaction rate ψ = 0.7. We draw the three rest points ρ1 (blue circle), ρ2 (red circle) and ρ3 (empty circle), where ρ = (ρs, ρt) is the vector having for components the sensitive s and tolerant t densities, and the system nullclines defined by dρs/dt = 0 (red line), dρt/dt = 0 (blue line) whose intersection individuate the saddle unstable rest point ρ3.
ρ1 has eigenvalues λ1 = −ρ and λ2 = εf − ψ/ε − 1. Thus, since ε is positive-defined, ρ1is stable if and only if εf < 1 + ψ/ε. Equivalently, eigenvalues in ρ2 are −1 and 1/f − ε. ρ2 is stable if and only if εf > 1. Since the characteristic polynomial of J is p = r2 + c1r + c2 the conditions for ρ3 stability are cλ = − λ1 − λ2 > 0 and c2 = λ1 − λ2 > 0. These conditions are equivalent to verifying that the real parts of λ1 and λ2 are strictly negative. The expression for c1 and c2 are the following:
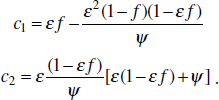
The first condition implies that ψ/ε > (1 – ef) (1− f)/f. The condition is true only in the particular case when f > 1, which by itself does not prove the instability of ρ3. However, in order to have c2 > 0, the argument inside the square bracket has to be negative (i.e. λ/ε < εf −1), which is the opposite of the one ensuring ρ3 existence. As a consequence, if ρ3 exists, it will be unstable analogously to the four-dimensional model of the previous section.
The system stability features can be visualized by drawing the system nullclines (i.e. the curves represented by ![]() in the phase-plane defined by tolerant ρt vs. sensitive ρs densities (Fig. A22-S2). Tolerants domination ρ2 is always obtained for parameter sets resulting in the tolerants nullcline
in the phase-plane defined by tolerant ρt vs. sensitive ρs densities (Fig. A22-S2). Tolerants domination ρ2 is always obtained for parameter sets resulting in the tolerants nullcline
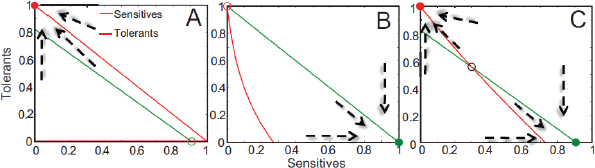
FIGURE A22-S2 Model nullclines analysis in the absence of noise. A: the tolerants nullcline lies above the sensitives nullcline leading to tolerants dominance and sensitive extinction. The corresponding parameter set is f = 1.1, ε = 1.1, ψ = 0.1. B: the sensitives nullcline lies above the tolerants nullcline leading to sensitives dominance and tolerants extinction. The corresponding parameter set is f = 1.0, ε = 1.0, ψ = 5. C: the tolerants nullcline is steeper than the sensitives nullcline and their intersection is a saddle and unstable point. The stable manifold of the saddle divides the interior of the quadrant into the sets of initial conditions leading to competitive dominance by one type of microbe and competitive exclusion of the other. The corresponding parameter set is f = 1.1, ε = 1.0, ψ = 0.7.
laying above the sensitives one (Fig. A22-S2A) and the reverse is true for sensitives dominance ρ1 (Fig. A22-S2B). Bistability is obtained when the nullclines intersect in the saddle unstable coexistence point ρ3 such that the stable manifold of the saddle divides the interior of the quadrant into the sets of initial conditions leading to competitive dominance by one type of microbes and competitive exclusion of the other. In absence of fluctuations, depending on the system initial conditions, a time-trajectory will be attracted in one of the two mutually exclusive stable states ρ1 or ρ2 where it will persist indefinitely (Fig. A22-S2C). The phase-plane is divided into two attracting basins, one around the tolerant mono-culture and the other around the sensitive mono-culture. Their size can be determined with a Monte Carlo search in the phase space (Fig. A22-S3).
Noise-Induced Dynamics
The integration of the Langevin dynamics in presence of bistability shows that the system time evolution in the presence of noise is non-trivial. The microbiota switches over-time between the antibiotic-tolerant and the antibiotic-sensitive dominations in a non-deterministic fashion that varies for different realizations of the noise. Additionally, in agreement with experimental observations on the level of isolation of individuals (Littman and Pamer, 2011; Ubeda et al., 2010), it appears that the time of recovery to sensitive-domination depends on the magnitude of the noise variance (Fig. A22-S4B-D).
We can think that the introduction of the noise leads to a diffusion process within the space of possible microbiota compositions such that the time of escape
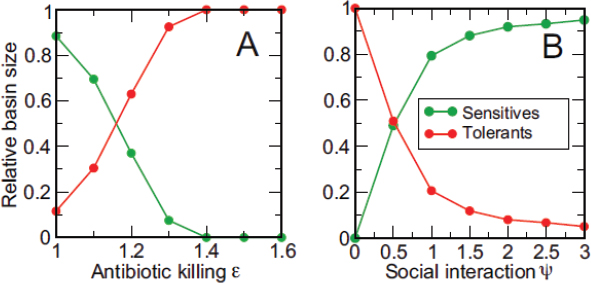
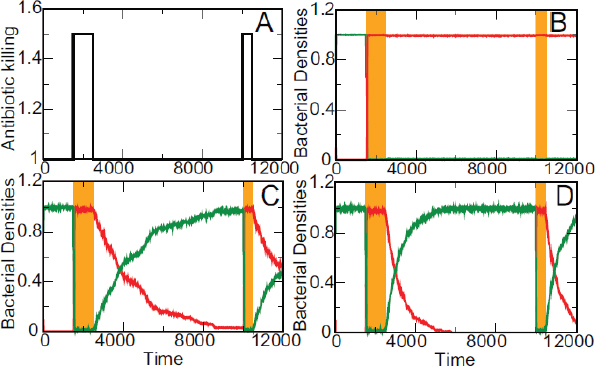
FIGURE A22-S4 Time evolution of the sensitive (green) and tolerant (red) densities obtained by solving the Langevin equations for f = 1.1, ψ = 0.7, e variable with time (see Panel A) and three different noise regimes. A: antibiotic treatment, B:D → 0, C: D = 0.00033 and D: D = 0.001. The densities are obtained averaging over 100 noise realizations and show the strong dependence of the return to sensitive domination after treatment on the noise level. Orange shaded region represents treatment conditions. The dynamics here shown qualitatively reproduces the behaviour observed in longitudinal microbiome data (see Fig. A22-5).
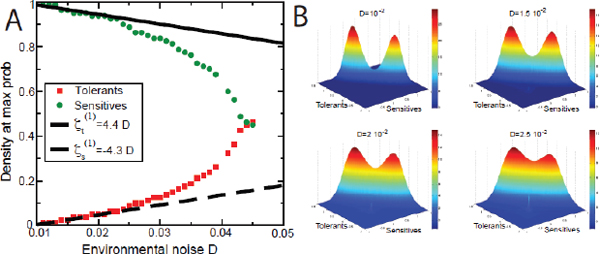
FIGURE A22-S5 A: most probable bacterial density ρ change with respect the noise parameter D when the boundary condition are fixed at negative values far enough from the location of the stable states. The set of parameters used is f = 1.1, ε = 1.1 and ψ = 0.4. This configuration is not physical since we allow negative values of the densities. However, we show that the theoretical prediction of the linear coefficients reported in the main text (see Results section) coincides with the numerical simulation here reported. B: plot of four different stationary distributions for f = 1.1, ε = 1.1, y = 0.4 and D = 0.01, 0.015, 0.02, 0.025 obtained solving numerically the FPE with the following boundary conditions: Ps(−1, ρt) = 0 and Ps(ρs, −1) = 0.
from each stable or meta-stable state becomes strictly finite. The strength of the diffusive motion is given by the size of the noise variance, D. Increasing D, the system spends a shorter time to wander far from the initial configuration which coincides with the increase of the probability of crossing the attracting basins separatrix in shorter time. Previous studies have characterized the mean residence time in each domination by computing the escape rate between the two stable states, in the limit of small D, in terms of stationary probability distribution (Borgis and Moreau, 1990; Gardiner, 1983). However, in our case this function is not known a priori since the system is non-conservative. Even though alternative numerical solutions (e.g. explicit integration of the Langevin equations or of the Fokker-Planck Equation) can be used to do so, these methods can be numerically very intensive and become prohibitive when the number of states increases (i.e. solving a partial differential equation in d >> 3 dimensions). As a consequence, in the main text we follow a new alternative theoretical framework based on transition state theory.
Numerical estimates of the mean residence time In order to characterize the stochastic dynamical behaviour of the bacterial concentrations we can numerically estimate the moments of their joint probability distribution (P(ρ)) by sampling different possible trajectories connecting the two stable states multiple times.
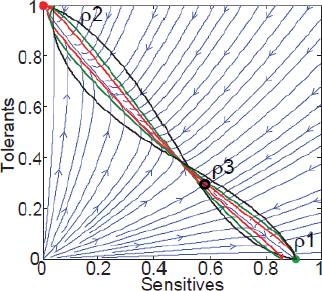
FIGURE A22-S6 Stationary path connecting the stable points 1 and 2. The red, green and black solid curves are the trajectories associated with different values of the initial velocity, 0.032 0.072 and 0.172 respectively showing that the most probable path for small noise is concentrated along the unstable manifold as obtained for different sampled trajectories (data not shown). It is worth emphasizing that for conservative fields of forces, meaning F = −∇U, it easy to verify that ![]() = ±F are both the uphill and downhill optimal path. The solution with the plus sign has null action S = 0 meaning that its probability is equal to unity for every value of the noise D. This means that the path is always deterministic: it describes a simple gradient descent that takes place even in absence of noise. On the contrary the
= ±F are both the uphill and downhill optimal path. The solution with the plus sign has null action S = 0 meaning that its probability is equal to unity for every value of the noise D. This means that the path is always deterministic: it describes a simple gradient descent that takes place even in absence of noise. On the contrary the ![]() = −F is associated to the reverse path and has a finite action S > 0 meaning it is activated only in presence of noise since its probability is suppressed and has strictly null value when D = 0. The optimal path connecting two stable states is formed by an ascending trajectory toward the unstable point, given by
= −F is associated to the reverse path and has a finite action S > 0 meaning it is activated only in presence of noise since its probability is suppressed and has strictly null value when D = 0. The optimal path connecting two stable states is formed by an ascending trajectory toward the unstable point, given by ![]() = −F, followed by a descending trajectory given by
= −F, followed by a descending trajectory given by ![]() = F. In presence of a non-conservative force, the scenario changes completely and the uphill and downhill trajectory are different since
= F. In presence of a non-conservative force, the scenario changes completely and the uphill and downhill trajectory are different since ![]() = −F is no longer a solution of the optimal path equation any longer.
= −F is no longer a solution of the optimal path equation any longer.
Each time-trajectory is obtained by solving the Langevin equations with different realizations of the noise (ξ) using a Milstein integration scheme (Higham, 2001). In the main text, we compare the estimate of the residence time in each domination state (ti with i = 1, 2) obtained with this sampling technique with that determined using the novel theoretical framework.
Supporting Figures for SVD
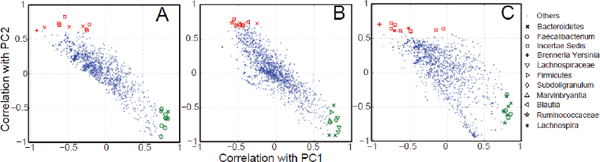
FIGURE A22-S7 Plot of the correlation with principal component 2 (PC2) versus correlation with principal component 1 (PC1) for all the phylotypes detected in each subjects (A-C) from (Dethlefsen and Relman, 2011). Green (red) are the top 10 most correlated phylotypes with PC1 (PC2) which significantly decrease (increase) in response to antibiotic treatment.
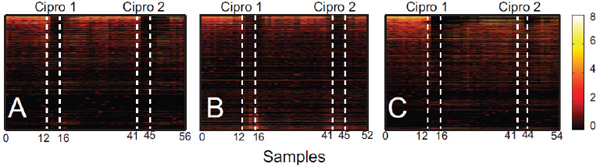
FIGURE A22-S8 Log2 abundance versus samples for all the phylotypes detected in each subject (A-C) from Dethlefsen and Relman (2011) sorted from the most to least correlated with PC1. At the top we individuate the most sensitive phylotypes to antibiotic (mostly decreasing in density) while at the bottom the most tolerant ones (mostly increasing in density). Differently from Fig. A22-5 in the main text, where only the top 20 sensitives and tolerants are shown, here we display all the detected phylotypes.
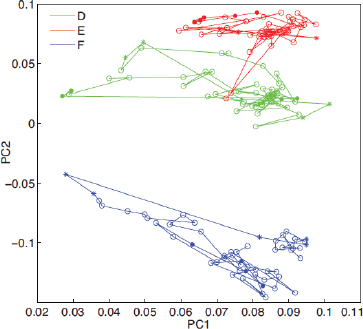
FIGURE A22-S9 Ordination plot of the time samples based on their first two principal components. We can easily recognize the time points belonging to the three individuals (inter-individual variability) and their evolution in response to treatment. Empty circles represent untreated samples, asterisks represent samples during treatment 1 and filled circles represent represent samples during treatment 2.
References
Alter O, Brown PO, Botstein D (2000) Singular value decomposition for genome-wide expression data processing and modeling. Proc Natl Acad Sci, 97(18):10101-10106.
Borgis D, Moreau M (1990) On the escape rate from a metastable state in a non-potential system. Physica A 163:877-894.
Dethlefsen L, Relman DA (2011) Incomplete recovery and individualized responses of the human distal gut microbiota to repeated antibiotic perturbation. Proc Natl Acad Sci U S A, 108 Suppl 1:4554-4561.
Fay TH, Joubert SV (2010) Separatrices, Inter. Journ. Math. Educ. Scie. Tech. 41(3):412-419.
Gardiner CW (1983) The escape time in nonpotential systems. J. Stat. Phys., 30(1):157-177.
Gardiner CW (1997) Handbook of stochastic methods, Third Edition, eds Springer series in Synergetics (Spinger Hedeilberg).
Higham DJ (2001) An algorithmic introduction to numerical simulation of stochastic differential equations. SIAM Rev., 43:525-546.
Hsu SB, Li YS, Waltam P (2000) Competition in the presence of a lethal external inhibitor. Math Biosc, 167:177-199.
Langer JS (1967) Theory of condensation point. Ann Phys 41:108-157 Langer JS (1968) Theory of nucleation rates. Phys Rev Lett, 21(14):973-976.
Littman DR, Pamer EG (2011) Role of the commensal microbiota in normal and pathogenic host immune responses. Cell Host & Microbe, 10(4):311-323.
Mao-Jones J, Ritchie KB, Jones LE, Ellner SP (2009) How microbial community development composition regulates coral disease development. Plos Bio.,8(3):e1000345. doi:10.1371/journal. pbio.1000345
Otto S, Day T (2007) A Biologist’s guide to mathematical modeling Princeton, NJ: Princeton University Press.
Seifert U (2008) Stochastic thermodynamics: principles and perspectives.EPJ B, 64(3-4):423-431.
Sidney Coleman (1988) Aspects of symmetry, eds Cambridge University Press.
Ubeda C et al (2010) Vancomycin-resistant enterococcus domination of intestinal microbiota is enabled by antibiotic treatment in mice and precedes bloodstream invasion in humans. J Clin Invest, 120(12):4332-4341.


