
Multiple challenges impede data-sharing efforts. Beyond differences in organizational culture and mission, simply establishing the processes that allow collection and sharing of data between organizations can be costly and time consuming. To overcome these challenges, managers of data-sharing systems must consider how the data are to be used and how to get the most impact from the data. Only by improving the impact of shared data can better incentive be created for broad and sustained participation in data sharing. In the third session of the workshop, three speakers provided examples of approaches to improve the impact of data sharing.
DATA INTEGRATION AND VISUALIZATION
New technologies have created the ability to gather, integrate, visualize, and disseminate data in ways that are qualitatively and quantitatively different from what has been possible before. Patrick Vinck, research scientist at the Harvard Humanitarian Initiative, described some of these new capabilities.
New Software
Thanks to new software, data collection and analysis are increasingly characterized by both precision and speed of acquisition. Advances in
software also enable rapid progression from data collection to analysis and dissemination, which can allow results to feed back into data collection. It is frequently possible to move from virtually no data to comprehensive data in a very short time. For example, an entire city can be mapped in just a couple of days using street mapping software and volunteers who are motivated to collect, assemble, and present information.
One risk of new methods of data collection is that the amount of data collected can be overwhelming. Data therefore need to be aggregated and summarized. “I say ‘summarize’ instead of ‘simplify,’” said Vinck, because data need to be made more consumable without decreasing their value.
An especially useful way to summarize data is through the use of maps. For example, the LRA Crisis Tracker is a real-time data collection and mapping platform that tracks the atrocities of the Lord’s Resistance Army in Africa.1 Vinck also cited the Satellite Sentinel Project, in which the Harvard Humanitarian Initiative is involved, that seeks to deter atrocities by focusing world attention on threats to civilians.2 This project uses what a few years ago would have been military-grade satellite data for the purposes of protection and warning.
Another project of the Har vard Humanitarian Initiative is PeacebuildingData.org, which seeks to give a voice to the people involved in peacebuilding and reconstruction processes. It features analyses and data from large-scale surveys in countries affected by mass violence and aims to bridge the gap between peacebuilding as intended by policymakers and its implementation and perception on the ground. Survey takers seek answers to questions such as: What have people experienced? How is the peacebuilding process affecting them? What do they think should be done? The information is collected digitally, which makes it faster to produce and results in better quality. Working in just a few countries, the project has sought to build a baseline of information that can be revisited every few years to gauge changes. It also can single out individual projects to determine whether they have been successful or not. An important application of such efforts is to help determine the extent to which the investments of the international community have led to peacebuilding.
_______________
1 See http://lracrisistracker.com.
2 See www.satsentinel.org.
Data Platforms and Network Architectures
Vinck emphasized the value of letting data speak for themselves rather than having researchers create a narrative. By presenting data through a technology platform, users can interact with the data. Vinck pointed to the PeacebuildingData.org project in Liberia (Figure 4-1), in which an online data set presented using Google Maps allows users to create indicators that are of interest to them. Similarly, for a project in Mindanao, Philippines, users can click on a list of indicators to access and visualize the information they want.
So far, the information in the databases has come from a single source, but Vinck discussed the possibility of layering information from multiple sources onto a single map. Major questions that must be answered for such a system are whether information can be integrated and whether it is useful to do so. In part, he said, the answers depend on the purpose of the project. For example, a project focused on conflict analysis may differ from one focused on communication. Similarly, one project may lend itself to the development of a composite indicator that provides a peacebuilding score, while such an indicator might not be appropriate for a different project.
Ideally, the data presented through interactive platforms would be completely open to users. But data can be expensive and time consuming to collect, and letting go of data can be difficult. Data may also need to be protected
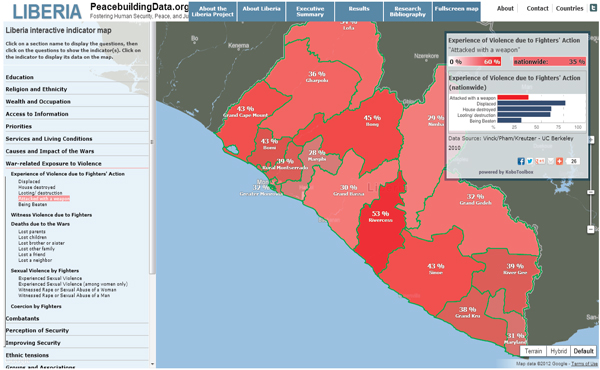
FIGURE 4-1 Survey-Based Conflict Indicators for Liberia SOURCE: PeacebuildingData.org.
if they are from a sensitive source. PeacebuildingData.org has decided to let each organization display its own data rather than collecting the data in a centralized system. That way, each organization retains control over its data and can even choose to withdraw the data. Such an approach has implications for updating data, Vinck acknowledged, as the information displayed can have different time frames and references. The development and use of metadata can help interactive platforms move toward networks of data sharing in which data have different sources but can be directly compared.
Ethical Implications
The collection, analysis, and sharing of data have important ethical implications, Vinck observed. For example, NGOs have various procedures for dealing with sensitive information, but those procedures typically are not shared with the public. How is information vetted? Are human subjects being protected? The lack of transparency makes it difficult to answer these questions for individual organizations. It also makes it difficult for organizations to learn from each other. Widely disseminated guidelines, along with training on how to access and share information, can help organizations deal with issues that arise.
ASSESSING VALUE IN DATA FOR DEVELOPMENT RESEARCH
For data sharing to be effective, the data must have value. Innovations for Policy Action (IPA) is an NGO dedicated to demonstrating the value of data by discovering what works to help the world’s poor. It designs and evaluates programs and provides hands-on assistance to bring successful programs to scale. It has more than 200 ongoing projects in about 40 (mostly developing) countries and offices in 14 countries.
Niall Keleher, IPA’s director of research methods and training, explained that the organization’s long-term mission is not only to identify innovative social programs but to conduct multiple evaluations of programs in order to identify their impact in various contexts and with diverse populations.
IPA begins by identifying not only the intervention to be used but the theory of change behind it. The organization then defines a representative sample for data collection, with particular attention to ensuring that the data accurately capture the populations about which statements are to be made. It does sample size and power calculations, applies valid randomization methods to the population, and develops indicators to accurately measure
the value of a program. Computer-assisted interviews provide access to data for prompt quality checks and offer the potential for more timely analysis.
Distinguishing between causality and correlation is a challenge, Keleher acknowledged, but IPA’s research design is carefully constructed to elicit “a true and unbiased estimate of the causal relationship between interventions and outcomes.”
The Approach in Practice
Keleher described two examples from IPA’s portfolio of projects. In northeastern India, the organization measured the success of an NGO seeking to achieve full immunization of children. It found that for an intervention organized around immunization camps where mothers brought their children for immunizations, the full immunization rate jumped from 6 percent for the control group to 18 percent for the group subject to the intervention. Furthermore, when the mothers received a one-kilogram bag of lentils as an incentive, the percentage jumped to 39 percent. “This kind of study is what we aim to produce—something that shows how effective a particular program was.”
A study in Malawi looked at the effect on repayment rates of tracking borrowers via fingerprint scanning technology. By having a photograph of a person and a fingerprint in a database, the highest-risk borrowers substantially increased their repayment rates, enabling others to obtain loans whereas before they might have been denied because of risk.
Access to some of the data collected by IPA is limited by confidentiality and intellectual property considerations. But in general IPA seeks to make its data available through publication in scientific journals. This transparency encourages others to try to replicate the evaluation technique, validate the published data, and build on previous results.
UNDERSTANDING FRAMES OF REFERENCE
Stephen Lowe, geospatial information officer in the Office of the Chief Information Officer at the US Department of Agriculture, discussed some of the issues that arise in interagency data sharing. First, he said, factors mentioned in the discussion of data sharing and peacebuilding occur across the federal government. Many government agencies and personnel have different frames of reference—agendas and ways of communicating—yet they face common issues involving data. Where should data sharing start
and stop? What are the scope and scale of data sharing needed for a given project? When should data sharing focus on interpretation, and when on discovery? Are the facts available but extremely complex, or are missing facts creating uncertainty? (As Lowe said, “Sometimes we don’t know what we don’t know.”) What is the appropriate tradeoff between data precision and speed of acquisition? Some data are more valuable when they are acquired quickly, as opposed to gathering more precise data over a longer time frame.
Lowe also mentioned a more fundamental difficulty with data sharing: the distinction between policy disagreements and policy controversies. Policy disagreements involve disputes in which the two parties are able to resolve the questions at the heart of the dispute by examining the facts of the situation. Policy controversies are disputes that are immune to resolution by appeal to facts, making them much more intractable. Furthermore, people can focus their attention on different facts or interpret the same facts in different ways, and they have a remarkable ability, when embroiled in a controversy, to dismiss the evidence cited by their antagonists.
Seeing Outside the Frame
People tend to interpret evidence based on the frames of reference they apply, Lowe explained. These frames incorporate beliefs, perceptions, and appreciations that underlie policy positions. They have normative implications that a certain type of solution is acceptable.
To overcome barriers created by different frames of reference, people need to seek agreement on the nature of the problem and the general character and content of a solution, said Lowe. The type of problem to be solved may involve diagnosis, classification, analysis, the detection of anomalies, the configuration or selection of data, monitoring, prediction, design, or planning. Understanding the type of problem leads to better alignment with different types of available solutions.
Lowe further explained that understanding the framing of a problem can create opportunities to operationalize solutions. Some problems lend themselves to customized one-of-a-kind solutions, while others may yield to highly standardized and routine solutions. By moving toward the latter, unit costs can be reduced and efficiencies realized. Understanding the framing correctly can enable the proper use of technology within the data acquisition workflow. For example, in certain contexts, data can be collected automatically by a sensor detecting activity in realtime in its vicinity or it
could be collected manually using a template available on a tablet computer. The framing helps identify the best mobility solution for data acquisition.
Lowe concluded by observing that maps are typically created for people who are already in power, who control the resources to create these documents. New technologies may make it possible to flip that equation around. For example, community mapping using volunteers can empower people in communities by identifying emergent issues, grounding conversations in context, and depicting local knowledge and values.
Kevin Brownawell, interagency professional in residence, US Institute of Peace (USIP), cited some of the difficulties that can arise in using new technological capabilities for data sharing. First, some of the most useful data that can be collected are subjective and designing survey instruments to collect this kind of information can be much more labor intensive than collecting objective data such as immunization rates. Similarly, data input can be very labor intensive. A large and well-trained staff is generally required to input large volumes of data, regardless of technological capabilities. At the same time, the quality of the data needs to be assessed, which requires an investment of time from well-trained personnel. Finally, interpretation of the data can be difficult and contentious. “Who is going to interpret the data? What type of framework do they have?” At USAID, he said, he and his colleagues often worried about passing controversial data up the chain of command, because senior officials had a tendency to interpret the data in ways that reflected their circumstances rather than the context in which the data were gathered.
Keleher agreed that subjective data are often the only data that can be collected given the focus of his organization’s work. However, these qualitative data can help interpret more quantitative measures. While he agreed that methods of collecting subjective data can be methodologically rigorous, he observed that new technologies can ease data-gathering demands. For example, when a delivery man makes a delivery, it is recorded using a simple hand-held device, and the information thus collected can be valuable in an organization’s decision making. Thus, a major component of an organization’s planning should be careful decisions about what are the important data to collect and how to collect those data.
In response to a question about data reliability, Vinck talked about some challenges in crowdsourcing. For example, in some parts of Liberia, cell phone ownership is much lower than in other parts. “In terms of reporting, that has a major impact,” he said. In such situations, there are substantial advantages to having trained people gather data, despite the greater effort required for training and sending them into the field.
He also advocated that peacebuilders learn more about how to maintain the quality of data collection and analysis. To check the data they collect, researchers can triangulate information from different sources. The technologies used to collect data also make it possible to check consistency and the reliability of interviewers and the information they gather. Research protocols have strict standards concerning how to select interviews, how to conduct them, and how to get consent. Peacebuilders also need to understand research design and the problems with flawed research approaches. “Training needs to be done on how to use and access data and also how to judge and understand data.”
Richard Boly, the director of e-diplomacy at the State Department, agreed that a centralized database under the control of a single entity is not feasible, and added that citizen-generated data can both validate data generated by the government and result in data generated independently from the government. This open model of data sharing can support not only decentralized data gathering but also decentralized analysis.
Lowe emphasized the importance of the metadata description of an information asset so that it is searchable and accessible from a variety of interpretive stances. Good metadata allow data to have a much longer life cycle and greater usefulness. He also cited the importance of multiple interpretations of data, which require that the data be capable of being pulled apart and being used in a different way. This may not mesh well with current business models, but new technologies allow this kind of open-source data gathering and analysis, which create great promise for the future.
Susanna Campbell, research fellow at the Saltzman Institute for War and Peace Studies, Columbia University, noted that the uses to which data are put may constrain the selection of data collected and analyzed. She pointed to four kinds of uses of data for peacebuilding. The first is to improve the effectiveness of programming, generally through the monitoring of ongoing programs. These data are generally not shared, because people are less likely to provide full assessments if they know that what they say will be freely available. The second is to categorize peacebuilding successes and failures. These data are more likely to be shared because they are more likely to be
part of an academic study than an effort to improve programming. The third is to improve coordination, which often relies on open data from the community. The fourth is to improve the targeting of programming, which requires data on the context in which programming occurs. These data can be particularly useful in demonstrating the interrelationships among systems and how systems work together.
Anne Ralte, senior advisor in the Office of the Director of Human Resources for USAID, mentioned the Standardized Monitoring and Assessment of Relief and Transitions (SMART) system, a USAID initiative.3 As indicators for humanitarian systems, the system uses the overall mortality rate, which is a crude and somewhat controversial indicator, and the nutritional status of children under age six. Many organizations have bought into the effort, and the data are now housed in the Center for Research on the Epidemiology of Disasters in Brussels. Data are gathered by NGOs and validated by a group of independent epidemiologists, with a simple-to-use and standardized data-gathering tool. Graphical presentations of the data have been developed to improve interpretation and dissemination.
Vinck mentioned another project called Food and Nutrition Technical Assistance (FANTA), which uses standardized indicators of food security and nutrition.4 He noted that even something as straightforward as perceptions of security measured every three years can be a very useful measure, providing a baseline against which to gauge progress (or lack of it).
Hartwell observed that maps can be highly incendiary—for example, by drawing attention to disputed boundaries. Chip Hauss, director of the Alliance for Peacebuilding, responded that maps in and of themselves are not dangerous: it is how they are used that can create disruption. Maps can be very efficient and effective tools, but, like statistics, maps can also lie.
Andrew Robertson, senior program officer at USIP, pointed out that in the workshop’s morning discussions, trust was described as coming from dialogue, whereas in the current session, trust comes from method and structure. Method and structure point to the need for planning and the ability to predict relevant questions, but adaptability, flexibility, and learning are also crucial to successful peacebuilding. This shift is happening in the commercial world, from a structured to a more flexible and adaptive approach. Tools therefore need to be quickly adaptable to adapt to changes in what stakeholders think they need. This is where the morning and afternoon discussions could fit together, he said.
_______________
3 More information about the system is available at www.smartindicators.org/index.html.
4 For more information, see www.fantaproject.org.
Andrew Blum, director of learning and evaluation at USIP, observed that even domestic data-gathering projects may have lessons for peacebuilding. For example, efforts to gain information on immigrants or families with at-risk children have many commonalities with peacebuilding data-gathering efforts. Collaborations among organizations doing different kinds of data sharing and dissemination would enable the sharing of lessons learned and best practices.
At the end of the session, Roman stressed the importance of incentives for different parties to share information. New capabilities depend critically on improving the information flow among .org, .gov, and .com information domains. Thus, collaboration in a decentralized framework will be essential to the creation of data-sharing mechanisms for peacebuilding.


