
This final chapter is based on the information and analysis in previous chapters of the report. It describes three potential prototypes to consider in redesigning the Consumer Expenditure Surveys (CE) and offers recommendations to the Bureau of Labor Statistics (BLS) from the Panel on Redesigning the BLS Consumer Expenditure Surveys on research and other inputs needed in redesigning the CE.
The CE has many purposes and a diverse set of data users. This is both the strength of the program and the foundation of its problems. The CE program tries to be “all things to all users.” The current design creates an undesirable level of burden on households and quality issues with its data. The Interview survey asks respondents for a very high level of detail collected over an entire year, with potentially counterproductive effects on their motivation and/or ability to report accurately. Because the Interview survey had been deemed not to satisfy all user needs, the program also includes the Diary survey. The Diary survey supplies much of the same information but at an even higher level of detail over a shorter period of time by using a different collection mode and a different set of respondents. However, Diary respondents appear to lack motivation to report consistently throughout the two-week collection period. Unfortunately, these two surveys are designed independently so the resulting data are not statistically consolidated to achieve their potential precision and usefulness.
The Consumer Price Index (CPI) drives the level of detail asked in the
current CE surveys. The CPI is a Principal Economic Indicator of the United States and a crucial user of the CE. The CPI currently uses CE data for over 800 different expenditure items to create the budget shares required for those indexes. Most, but not all, budget shares come from the CE. In theory, a number of survey designs can provide the information required by the CPI, collecting a significant level of expenditure data without inflicting the level of burden on households that the current CE does. These designs, including a number of “matrix type” sample designs, involve asking each household only a portion of the total detail required while using weighting and more sophisticated modeling to produce the needed estimates. The data from these types of designs can provide the needed level of detail with appropriate precision needed by the CPI but with less burden on each household (Eltinge and Gonzalez, 2007; Gonzales and Eltinge, 2008, 2009). This family of designs would also meet most of the needs of government agencies in program administration and would allow BLS to continue to publish standard expenditure data tables. However, these types of designs are not optimal for other uses of the CE.
Researchers and policy analysts use the CE microdata to examine the impact of policy changes on different groups of households and to study consumers’ spending habits and trends. Many such uses are described in Chapter 2. These data users generally do not need the same level of item level detail required by the CPI. To them, the value of the CE lies in the “complete picture” of demographics, expenditures, income, and assets all collected for the same household. A comprehensive set of data at the household level allows microdata users to look at the multivariate relationships between spending and income in different types of situations for different groups of households. These data users also use the “panel” component of the CE, which provides the same information for a given household over multiple quarters. Parker, Souleles, and Carroll (2011) and Chapter 4 (“Feedback from Data Users”) further describe the usefulness of panel data in this type of analysis.
The multiple and divergent CE data uses are difficult to satisfy efficiently within a single design. Survey designs always involve compromise, and the current CE design tries to provide the breadth and detail of data to meet the needs of all users and then compromises by accepting the heavy burden and unsatisfactory data quality that emerges. The panel recommends that BLS redesign the CE only after rethinking what those compromises should be so that the trade-offs associated with redesign possibilities can be articulated and assessed within a well-developed priority structure. Determining these types of priorities for the CE is ultimately the responsibility of BLS, and is beyond what would be appropriate or realistic for the panel to undertake. Therefore, the panel makes the following recommendation:
Recommendation 6-1: It is critical that BLS prioritize the many uses of the CE data so that it can make appropriate trade-offs as it considers redesign options. Improved data quality for data users and a reduction in burden for data providers should be very high on its priority list.
The panel recommends a major redesign of the CE once the priorities for a redesign are established. In its work, the panel concluded that many response and nonresponse issues in both the Diary and Interview surveys create burden and lead to quality problems with the expenditure data. The panel has concluded that less invasive cognitive and motivational corrections that might be made to improve recall and the reporting of specific expenditures would most likely increase overall burden. Since burden is inextricably connected with much of the survey’s problems, increasing it would be counterproductive.
Recommendation 6-2: The panel recommends that BLS implement a major redesign of the CE. The cognitive and motivational issues associated with the current Diary and Interview surveys cannot be fixed through a series of minor changes.
The charge to this panel was to provide a “menu of comprehensive design options with the highest potential, not one specific all-or-nothing design” (see Appendix B). Before BLS sets prioritized objectives for the CE, the panel’s most effective course of action is to suggest alternative design prototypes, each of which has a higher potential for success when enlisted to achieve a different prioritized set of objectives.
With that said, these prototypes share much common ground. The statistical independence of the current interview and diary samples is eliminated. The prototypes orient data collection methods toward an increasingly computer-literate society in which new tools can make the reporting tasks easier for respondents while providing more accurate data. The new prototypes are geared to increase the use of records and decrease the effects of proxy reporting. There is an increased emphasis on self-administration of survey components, while creating tools and an infrastructure that will monitor and support the respondent in these endeavors. The field representatives’ role will still be important in directly collecting data, but their role will grow to also provide support in additional ways. The panel proposes incentives that will increase a respondent’s motivation to comply and report accurately.
Finally and most importantly, all three prototypes propose new procedures and techniques that have not been researched, designed, and tested. The prototypes that the panel offers are contingent upon new research undertakings
and rigorous assessment. There is a lot of relevant background theory and research available, and the BLS research program and Gemini Project deserve praise for much of that work. However, the panel wishes to state clearly that the empirical evidence on how well each of the proposed prototypes would work is missing. As with the current CE surveys, the new prototypes include some diary-type data collection and some recall-type data collection. They include some self-administered data collection and some interviewer-assisted data collection. Notwithstanding, the new prototypes are sufficiently different from the current CE surveys that BLS cannot and should not use the current CE to extrapolate how well these prototypes will work in regard to response, accuracy, and underreporting. Considerable investment must be made in researching elements of the proposed designs, to find specific procedures that not only are workable but also are most effective. Some ideas will ultimately be successful, while others will be shown to have serious flaws. The critical point is that these prototypes are not operationally ready, and the process of selecting a prototype or components of a prototype for implementation should be based not only on BLS’ prioritization of goals of the CE, but also on empirical evidence that the proposed procedures can meet those goals.
Recommendation 6-3: After a preliminary prioritization of goals of the new CE, the panel recommends that BLS fund two or three major feasibility studies to thoroughly investigate the performance of key aspects of the proposed designs. These studies will help provide the empirical basis for final decision making.
Issues related to nonexpenditure items on the CE were discussed in detail in Chapter 5. These issues include such things as synchronization of expenditure and nonexpenditure items over similar reference periods, and collecting changes in employment status and other life events. These types of issues are important to the research uses of the CE. The panel offers the following recommendation that should be viewed within the context of BLS prioritization of the goals of the CE.
Recommendation 6-4: A broader set of nonexpenditure items on the CE that are synchronized with expenditures will greatly improve the quality of data for research purposes, as well as the range of important issues that can be investigated with the data. The BLS should pay close attention to these issues in the redesign of the survey.
With a new design, some existing uses of data may fall by the wayside. New and important uses will emerge. BLS has a talented and knowledgeable staff of statisticians and researchers who have worked with the CE
for many years. They understand the survey well, and the cognitive issues described by the panel are not a surprise to that staff. Using the framework that the panel has put forward, BLS statisticians will be able to pull together and test the specific details of a redesign that is appropriate for BLS’ collective priorities, budget, and time frame.
The rest of this chapter describes the three different prototypes, with many commonalities but each with its own focus. A more detailed discussion of those commonalities comes first, and then the report describes and compares the three prototypes. The final sections of the chapter begin a roadmap for moving toward a new design, including a discussion of important research issues.
PANEL’S APPROACH TO DESIGN AND THE COMMONALITIES THAT EMERGED
The panel considered many approaches to a redesign of the CE, and sorted through those numerous options by focusing on the following fundamentals:
- Improve data quality.
- Be mindful that the resources (both out-of-pocket and staff) available to support this survey are constrained.
- Be mindful that the survey processes have to be workable across the entire population of U.S. households—the more distinct processes that need to be designed for different population groups, the more resources will be required.
- Keep it simple—to the extent possible.
- Provide respondents with relief from the current burden level of the CE.
- Provide respondents with sufficient motivation to participate.
- Support the use of records and receipts.
- Support the current uses of the CE to the extent possible, and provide options in support of the prioritization of those uses in the future.
- Utilize newer data collection methodology and external data sources when supportive of the above fundamentals.
It is not reasonable for the panel to discuss all of the options that they considered and laid aside, but this section of the report is intended to illuminate the concepts and strategies that emerged with broad consensus during discussion of some of the major decision points in the panel’s deliberations. These commonalities can be seen in the design of the three prototypes.
Implement a Major Integrated Redesign
The panel came to an early conclusion that the cognitive issues with the existing surveys cannot be fixed with minor corrections, and it would be a mistake to focus independently on the various cognitive issues addressed in this report. The best approach is an overall redesign of the CE, with component pieces being shaped to minimize these cognitive problems at each phase of data collection.
The sample design for the new CE should be developed with a view toward integrating sample panels and data collection periods on a panel via statistical modeling in the estimation process, rather than generating independent estimates for each panel and data collection period. This method ensures that all data collected within the design can be fully utilized to minimize variance of estimates by capitalizing on the temporal components of the design or by integrating sample panels that collect different, but related variables from respondents. It may be possible that sophisticated sample designs along with appropriate modeling can provide needed data products with reduced burden on respondents. In investigating this possibility, it will be important to avoid creating household-level data with such a complicated structure of measurement error or statistical dependencies that it makes research use very difficult. At least, any reductions in possible use of the data need to be consistent with newly clarified BLS priorities.
Reduce Burden
The extreme detail associated with the current CE, and the amount of time and effort it takes to report those details, are major causes of underreporting of expenditures. These need to be significantly reduced for most respondents. The panel identified a number of ways to reduce burden, and more than one burden-reducing concept is included in each redesign prototype. Burden-reducing opportunities include (1) reducing the overall detail that is collected on expenditures, income, and/or assets; (2) asking details (or certain sets of details) to only a subsample of respondents, providing burden relief for the remaining sample; (3) reducing the number of times a household is interviewed or the number of tasks they are asked to do; (4) reducing the overall sample size and using more sophisticated estimation and modeling to maintain levels of precision; and (5) making response cognitively and physically easier. The panel spent considerable time identifying ways to reduce burden. It realizes that several of these options may be at odds with collecting a complete picture of income and expenses from each individual household over longer reporting periods. This is why it is essential for BLS to further clarify its priorities for data uses, recognizing that one survey cannot satisfy all of the possible data users.
Use Incentives to Increase and Focus Motivation
The CE surveys are very complex and burdensome, and even with the burden-reducing changes, the CE will remain a difficult challenge for households. Respondents currently have little motivation to respond, or more precisely to respond accurately, on the CE. The panel anticipates that respondents will have additional responsibility under a redesign to keep and record expenditures. The panel collectively agreed that respondents needed greater motivation to carry out these tasks and proposed that an incentive structure composed of monetary and nonmonetary incentives should be developed and implemented. The structure should be based on the amount of effort asked of a respondent and used to effectively encourage recordkeeping and reporting from those records. The panel speculated that the incentive payments would need to be fairly large to effect the needed motivation to report accurately. Components of an effective incentive program are discussed in more detail later in this chapter.
Support Accurate Use of Records
The panel envisions a redesign that will increase the respondents’ use of records in reporting expenses. This can be accomplished in a variety of ways. In the three prototypes, incentives are offered. There is an increased emphasis in each prototype to incorporate supported self-administration in a way that provides a structure to promote accurate reporting and increased use of records. This means incorporating flexibility to allow respondents to provide data at a time and in a way that is most convenient for them, and to answer questions in the order that they prefer. It means redesign of data collection instruments (whether self-reports and interviewer-driven, paper or electronic), technology tools, training, reinforcement, and incentives to facilitate recordkeeping. Minimizing proxy reporting in the reporting of detailed information is another improvement that can lead to more accurate reporting and use of records and receipts.
Redesign Survey Instruments
The new CE will need to redesign data collection instruments so that they simplify the respondent’s task. The panel sees a movement toward self-administered data collection with the field representative acting in a support role. However, the prototypes also incorporate interviewing by field representatives. Even though the panel envisions a wide acceptance of tablet-based interfaces, paper instruments will be needed for the foreseeable future. The current instruments may not suffice for this purpose.
Increase Use of Self-Administration
The panel discussed the advantages and disadvantages of various collection modes, and considered changes from the current CE surveys. The panel expressed concern about the shift in the current CE toward telephone data collection (primarily due to constrained resources), and felt this was not the best shift for data quality. The panel’s final recommendations move toward self-administration of these complex surveys. There are several reasons for this shift. The first is to encourage the use of records as discussed in the paragraphs above. This mode allows respondents to provide data in a way and at a time that is most convenient for them. When paired with an appropriate incentive structure, it can encourage respondents to take the time needed to use those records and receipts. A second reason is to take advantage of newer technology that can allow consistent, remote monitoring of self-administered data collection without the cost of having an interviewer present.
Reduce Proxy Reporting
The current CE surveys use proxy reporting because of the additional cost associated with working separately with multiple survey respondents within a household. The panel looked for solutions that will allow (and encourage) individual members of a household to report their expenditures without the accompanying increase in cost. The solution is a shared household tablet that each member of the household can use to enter expenses, but there is still a “primary household respondent” who oversees the entire process. This solution does not provide confidential reporting, and thus does not solve the problem when household members are reluctant to share details of certain expenditures with other household members. However, it does have the potential to eliminate much of the current proxy report process with minimal added cost per household.
Utilize Newer Data Collection Technology
The time is right to emphasis new technological tools in data collection. This is an essential component of the panel’s concept of supported self-administration. The panel discussed many technological alternatives and found one tool that was particularly appealing to the panel across a variety of designs—the tablet computer. The panel proposes the use of tablets in each of its redesign prototypes as an effective data collection tool. Lightweight and easy-to-use tablets represent stable (robust) technology, are commonplace, feature more than sufficient computing power, and are economical in price. The panel envisions that the tablet would sit on the
kitchen counter and be used by multiple household members in a “shared” approach to recording expenditures.
The panel also considered such alternatives as Web-based data collection, smart phone apps, and portable scanners for receipts. All are interesting tools and potentially could be used together in a redesigned CE. However, the panel stuck with its fundamentals—keep it simple and be mindful that the survey processes have to be workable across the entire population of U.S. households and that each additional approach (tool) will require additional resources to build and support. The panel looked for the one tool with the most potential.
Web data collection is not that tool. The Bureau of the Census (2010) estimated that only 44 percent of all U.S. households had Internet access either within or outside the home. This percentage varied greatly by household demographics and income. So requiring Internet access to use the electronic instrument would relegate the majority of households to the “paper” option. Additionally, building high quality Web-based instruments that work on multiple platforms (different computers, different browsers, high-speed versus dial-up Internet access, smart phone browers) can be very resource intensive. By providing the tablet to the household, BLS would be developing for a single platform, and the panel hypothesizes that a substantially greater percentage of households will be able to use the tool than if BLS relied on Web collection.
The panel saw similar issues with using smart phone apps—lack of coverage of the population of households, and considerable variability in hardware and software platforms. These devices are growing in popularity, but BLS would have to develop and maintain multiple versions even for use within the same household.
Portable scanners would allow respondents to scan receipts and upload them to a waiting file. These devices could be used along with the tablet PC for use in recording receipts. However, the array of formats and abbreviations that are used on printed receipts would likely require considerable intervention after the scanning to properly record each expenditure. Adding these scanners to the household would also require additional training.
The use of technology tools, and the tablet PC in particular, is discussed in more detail later in this chapter. The panel will recommend that BLS begin using this one simple tool, knowing that its implementation will be challenge enough for the short run.
Use Administrative Data Appropriately but with Caution
The potential use of external records or alternative data sources as a replacement or adjunct to current survey data for the CE is often raised in discussions of a CE redesign. Whether at the aggregate or the micro level,
the appeal of “readily available” information appears, at first glance, to be low-hanging fruit. Although such information might hold great promise, upon closer inspection the panel also realized that use of these data is accompanied by increased risk and significant resource outlays. There is a cost/quality/risk trade-off that needs to be fully investigated and understood.
The panel discussed the potential use of these external data at the micro level and identified several concerns: Permission from household members to access such things as personal financial data, utility bills, and shopping data (loyalty card) would be difficult to obtain and thus replace only a small percentage of survey data; BLS would have to develop an in-house infrastructure to access and process data from each external source (this would be a significant drain on available resources); and BLS would have to continue to field a complete survey for the majority of households. That said, there are scenarios under which these data could be quite useful, particularly at a more macro level. However, caution is warranted. This subject is discussed in greater detail later in this chapter.
Create a Panel Component and Measure Life Event Changes
Economic analysts utilize the panel component of the current CE in much of their research. The report incorporates a panel component (with data collection from the same households at a minimum of two points in time) within each of the three prototypes. Each design also includes a re-measurement of income and “life events” (such as employment status, marital status, and disability) at each wave. However, the panel components differ considerably from design to design in the length of the response period, and this will significantly affect their relative usefulness in economic research. Of the three prototypes described, Design B has the most comprehensive panel component, with three waves and a response period of six months for each wave. Design C has two waves with a response period of three months for each wave. Design A has two waves, but with more variable response periods for each wave.
In this section, the panel presents three specific redesign prototypes. All three designs meet the basic requirements presented in Consumer Expenditure Survey (CE) Data Requirements (Henderson et al., 2011). All three prototypes strive for increased use of records, incorporate self-administration (supported by the field representative, a tablet computer, and a centralized support facility) as a mode of data collection, and use incentives to motivate respondents. All three prototypes continue to use field representatives for interviewing and other support, and they all feature
either a single sample or integrated samples. However, each prototype is different—a better fit for a specific use of the data. BLS needs to prioritize the various data requirements of the CE and move toward a redesign that is best for its carefully considered prioritization. In overview,
- Design A focuses on obtaining expenditure data at a detailed level. To do this, the panel proposes a design with concurrent collection of expenditures through a “supported journal”—diary-type self-administered data collection with tools that reduce the effort of recordkeeping while encouraging the entry of expenditures when memory is fresh and receipts available. It also features a self-administered recall survey to collect larger and recurring expenses that need a longer reporting period. This design collects a complete picture of household expenses but with reports over different reporting periods.
- Design B provides expenditure data for 96 expenditure categories, rather than the more detailed expenses provided by Design A, but provides a complete picture of household expenditures over an 18-month period. It builds a dataset that would be excellent for economic and policy analysis. This design makes use of a recall interview coupled with a short supported journal. Two subsequent contacts with the same households are made over 13 months, repeating the original data collection using supported self-administration to the extent possible. This design also recommends that a small subsample be subsequently interviewed intensively over the following two calendar years, with collation of records, the use of financial software, and emphasis on a budget balance. This is discussed separately at the end of the description of Design B.
- Design C incorporates elements of both Designs A and B. It collects the detail of expense items as in Design A, while providing a household profile for six months. To do both, it uses a more complex sample design, collects different information from different samples, and requires more extensive use of modeling to provide expenditure estimates and the household profile.
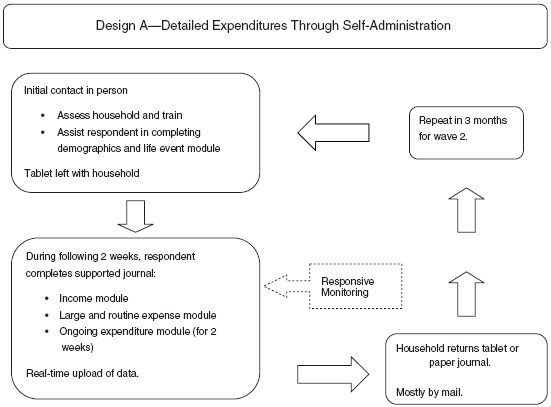
Design A—Detailed Expenditures Through Self-Administration
This prototype features a sample of households with two data collection waves, each of which features the concurrent reporting of expenditures over a two-week period using a supported journal. The design also incorporates a self-administered recall survey for larger, less frequent expenses. The design maximizes the use of supported self-administration and concurrent reporting of expenses. Figure 6-1 provides a flow outline of Design A.
The objective in Design A is to maximize the benefits that can be derived from self-administration in a new era of effective tablet computing and modular interface design. The idea is to simplify the respondent’s task, to allow respondents to provide data at a time and in a way that is most convenient for them, and to answer questions in the order that they prefer. In doing so, the panel believes that the survey can collect detailed expenditures accurately with reduced burden on respondents. The goals are to
- promote accurate reporting of detailed expenditure data by allowing sufficient time and space for careful enumeration of expenditures while using records and receipts;
- reduce the effort it takes to report those expenditures by providing support and technology tools; and
- reduce respondents’ tendencies (often implicitly encouraged in current methods) to estimate, guess, satisfice, or underreport.
Key Assumptions
Design A makes several key assumptions about the collection of consumer expenditure data:
- Detailed data for many items can best be obtained by supported concurrent self-administration, and a tablet-type device can assist in keeping the supported journal for most households.
- Interfaces for tablet-based applications (apps) will follow the best and newest principles of app design and testing, rather than simply importing or modifying current computer-assisted self-interview (CASI) technology and software.
- There will be a low refusal rate for use of the tablet given effective software and interface implementation.
- A two-week tablet-based reporting period for recording ongoing purchases is a plausible period. Households will be willing to participate in a second wave.
- For expenditures that must be recalled, different recall periods are appropriate for different categories of expenses.
- It is desirable to build alternative recall prompts or cues for different respondents who may have different ways of mentally organizing expenditures and/or different strategies for recalling them.
- The current set of income, asset, and demographic questions are reduced to only the essential items.
- Monetary incentives are available for respondents.
A single sample of households would be selected each quarter, with data collection initiated for a portion of the sample every two weeks within the quarter. A second wave of data collection for this same sample would take place in the subsequent quarter, with all responding households asked to participate for a second two-week collection period. Thus, for any given quarter, one independent sample would be initiated into wave 1 of the design, and a second sample would be brought forward from the previous quarter for wave 2 data collection.
Data Collection: Modes and Procedures
The predominant mode used in Design A is self-administered using a tablet PC. The data collection interface on the tablet would be modular, with flexibility on entering information in any desired order, with four modules:
- Demographics and Life Events Module: demographics and other information about the household. For wave 2, the questions would be modified to ask about key “life events” that might have transpired over the previous quarter.
- Ongoing Expenditures Module: for recording ongoing expenditures by household members during the two-week period.
- Large and Routine Expense Module: for reporting larger and routine expenses that may not be effectively measured during a two-week collection period.
- Income Module: household income, assets, and “labor force status” questions.
Navigation of the interface across and within the different modules would be streamlined and transparent for users of a wide range of backgrounds. The model for the interface would be “TurboTax” (commercially available tax preparation software) rather than the linear flow methodologies of today’s self-administered questionnaires. This means that the app would be built in modules and the user could choose to fill in the information in any order that is convenient. The user could also come back to any item and make a change at any time. Alternatively, the user (respondent) could choose to use a structured interview approach for moving step-by-step through the app.
During the initial in-person contact with the household, the field representative would identify the main “household respondent” and assist him or her with completing the Demographics and Life Events Module on the
tablet. The content of this first instrument would include standard demographics plus other items to assist in tailoring data collection instruments and estimation in the event that the household drops out of the panel, such as the number and age of household members, income bracket, purchasing habits, and use of online payments.
The first meeting also allows the field representative to assess whether the respondent (1) can be fully self-sufficient in using the tablet for later data collection, (2) will need additional support and monitoring during the next two weeks, or (3) would be likely to have severe difficulty with or refuse to use the tablet. The goal is to encourage the use of the tablet as much as possible while maintaining data quality.
Proxy reporting would be reduced by encouraging household members to record their own day-to-day expenditures in the Ongoing Expenditures Module during the two-week reporting period. The household respondent would guide the other household members in using this simple module. There would be no separate identification numbers to compartmentalize each member’s entries.
The household respondent would be asked to complete the Large and Routine Expense Module and the Income Module at his/her convenience during the two-week period. This allows the household respondent the time to review the questions and gather records. The Large and Routine Expense Module would ask about major purchases or periodic expenses such as automobiles, appliances, and college tuition. This module would also ask about routine expenses such as utility bills, mortgage payments, and health insurance payments. Respondents would be given alternative ways of entering the data that reflect reporting periods that correspond to their records. The Income Module would ask basic questions about household income and assets with a recall period that is most convenient for the respondent to report accurately. It would include information about changes in assets over the year.
At the end of the two-week period, respondents mail the tablet back. In some cases, a field representative visit may be needed to ensure the return of the tablet and capture key missing data. The Demographics and Life Events Module, the Large and Routine Expense Module, and the Income Module would be appropriately modified for a household’s second wave of data collection.
Frequency and Length of Measurement
Design A features two waves of data collection, each two weeks long, one quarter apart. All households are included in both waves of the panel. At a convenient time during the two-week reporting period, respondents
report larger and routine expenditures and income and assets via self-administered modules.
Recall Period
For the Ongoing Expenditures Module, household members enter purchases during the two-week period. Ideally respondents will enter data every day or almost every day. Different members of the household would be able to record their own expenditures. The centralized facility would be able to monitor and intervene if households do not enter data regularly or if there is evidence of poor data quality.
For the Large and Routine Expense Module, the recall period would vary between annual, quarterly, and monthly for different domains of expenditure, depending on which period has been shown to lead to the easiest and most accurate reporting. Within a single domain of expenditure, respondents may be given alternative ways of entering the data that reflect reporting periods that are easiest to provide based on the records to which they have access. In other words, the burden of recalculating amounts or recall periods for the needs of the survey is placed in the tablet software or centralized processing systems, and not the respondent.
The recall period for income and assets questions would be set to minimize measurement error and support estimation needs. This period is described as that which is most convenient for the respondent to report accurately while being close to the reporting period for expenditures.
Incentives
A guideline for incentive use is presented further in this chapter. In Design A, the panel estimates that $200 in incentives would be required per household ($100 for each two-week data collection period).
Role of Field Representative
The field representative’s role changes radically in Design A, from being the prime interviewer and data recorder to being the facilitator who encourages, trains, and monitors in support of the respondent’s thoughtful and accurate data entry. In this shift, the design attempts to change the burden and motivational structure of the current methods of collecting expenditure data. This entire process is described in more detail in “Using the Tablet PC for Self-Administered Data Collection” on p. 157. The role of the field representative will vary for households that use the paper-supported journal, and also across different tablet households depending
on their comfort with the technology, willingness to use records, and household composition.
Role or Expectations of the Respondent
From the respondent’s perspective, Design A makes it possible for the survey instrument to be tailored to his/her particular needs: expenditure context, comfort with technology, access to and format of records, preferences in reporting format, and preferred recall cues.
The design proposes a modern modular interface that has the simplicity, guidance, and intuitiveness of the TurboTax interface, rather than adhering to constrained traditional survey interfaces most often used today. This means that the app would be built in modules, and the user could choose to fill in the information in any order that is convenient. The user can also come back to any item and make a change at any time. Alternatively, the user (respondent) could choose to use a structured interview approach for moving step-by-step through the app.
The tailoring includes a paper alternative, with new forms of support for the respondent, if necessary. The design also gives respondents the opportunity to get 24/7 real-time support, exactly when they need it, as they record their expenditures and answer recall questions.
In this design, the respondent takes on the primary role of providing the most accurate data possible, supported by records to as great extent as possible. What differs from the respondent’s current role in the interview is that the respondent (after the initial meeting with the field representative) controls the time, pace, and order of data recording. In this sense, the design implicitly supports the idea that providing accurate data will take time and thoughtfulness. What differs from the respondent’s current role in the diary is that the respondent is provided an easy-to-use entry device augmented by ongoing interactive encouragement and support from both the interface and from remote support staff.
While in one sense, the respondent in the proposed design has greater responsibility (and support) than required in current expenditure surveys, in another sense the locus of responsibility is more distributed than before: among the respondent, field representative, and remote monitors (and, in a way, the interface designers and researchers). The respondent’s role thus includes being aware of and taking advantage of as much remote or in-person support as is needed to allow accurate data reporting.
Post–Data Collection Analysis
Data collected through the tablet (demographics, expenditures, and income/assets) would be complete and in an appropriate format for processing
by the end of the data collection period. Monitoring of the reported data allows for ongoing edit-checking during the two-week reporting period. The interface within the tablet converts data entered in the Large and Routine Expense Module and the Income Module to appropriate standardized reporting periods.
For paper households, data entry by the field representative or central staff would be required. Depending on the state of the paper materials, this could be very simple data entry or could include more complex decision-making from an envelope of saved receipts. Future efforts could create a smart data repository of the sort envisioned in the Westat proposal to reduce human effort of this sort, but the panel does not propose that here.
Infrastructure
This design would require
- purchase and inventory control/maintenance of tablet PCs for use in the field;
- new resources for app development and database management, not only for initial design efforts but also for ongoing continuing development and management. At least initially, BLS may want to consider outsourcing this function to organizations with experience in app development and management;
- new training to support field representatives in their new roles (and possibly new hiring practices to attract field representatives with different backgrounds or skills);
- new centralized survey management infrastructure for monitoring and support: case-flow management, tracking progress, managing interventions, providing positive reinforcements and managing incentives. This includes appropriate staff for technical support as well as staff who can support respondents remotely and staffing a 24/7 help desk that respondents could access by pushing a button on the tablet;
- fewer field visits requiring fewer field representatives in the field; and
- ongoing research to implement this prototype and to keep abreast of changes and future directions in technologies and technology adoption and of how these affect respondents’ recordkeeping and reporting proclivities.
The sample sizes and costs (data collection only) for Design A presented in this section are broad estimates for use only to compare across alternatives. More careful calculations were beyond the information and resources available to this panel. These calculations are based in part on a spreadsheet of 2010 CE costs provided to the panel. The panel used those costs to estimate for similar activities, and then calculated an estimated cost per sample case for the new prototype. Thus, these costs are for data collection only, and for data collection within a mature process. Estimates of sample size (net of 25% nonresponse) were then made that would keep to a neutral budget.
Assumptions:
- Cost per supported journal placement—$165.
- 85 percent of households would use tablet. Costs would go down with greater use of tablet.
- Cost of tablet—$200. It could be used 6 times, with an expected loss of 10 percent.
- Remote monitoring of responses—$100 per two-week supported journal.
- In-person monitoring—$150. Necessary for 10 percent of tablet households, and twice per each paper household.
- Incentives—$100 per two-week supported journal.
- Paper processing for paper households—$100.
Based on these assumptions, and remaining budget neutral ($16,000,000), the panel calculated the following projections for this prototype:
- Total cost = $16,000,000.
- Annual effective sample size (assuming 75% response) = 18,700.
- Average cost per sample = $853.
Meeting CE Requirements and Redesign Goals
This prototype meets the basic CE requirements laid out in Consumer Expenditure Survey (CE) Data Requirements (Henderson et al., 2011). Additionally, it is designed to reduce burden, reduce underreporting of expenditures, and utilize a proactive data collection mode with newer technology. Table 6-1 provides greater detail.
TABLE 6-1 Meeting the CE Requirements and Redesign Goals with Design A
| Goal | Design A—Detailed Expenditures Through Self-Administration |
| Produce quarterly and annual estimates of 96 categories of expense items | The design collects data at a more detailed level of expenditures than the 96 categories. Collectively, the 26 two-week data collections over the year will provide annual and quarterly estimates of expenditures at a fairly detailed level. |
| Income estimated over the same time period | Income is reported for a period most convenient for the respondent to report accurately while being close to the reporting period for expenditures. Income, like expenditure data, may be modeled for the entire year. Income, assets, and “labor force status” are requested during both waves. |
| Complete picture for household spending | A complete picture of each household is collected for two two-week periods, as well as information on larger items and routine expenditures over a longer recall period. By developing a process of seasonal adjustment for the four weeks of expense reporting, it would be possible to make quarterly or annual estimates of expenditures at the household level. The accuracy of those estimates will need to be researched. |
| Proactive data collection rather than change at the margins | The focus of this prototype is proactive self-reporting. Some larger expenditures are recalled, but in a setting to encourage the respondent to think about the expenditures and look up records. |
| Panel component with at least two contacts | There are two contacts for each household, in adjacent quarters. |
| Reduced burden | The proposed design redistributes burden in current Interview and Diary methods to a supported journal with a modern tablet interface. Burden is reduced by making the response tasks easier and more intuitive. This prototype reduces the number of contacts per household. Incentives are used to reduce perceived burden. |
| Reduced underreporting | Focus on detail, the increased use of records, allowing the respondent to record expenses at a time best suited and in a way best suited to him/her, reduced proxy responding, and incentives to perform the task are expected to lead to a reduction in underreporting of expenditures. |
| Budget neutral | Sample sizes are calculated to maintain approximately the current budget level. |
Targeted Research Required
Many of the research requirements for Design A are common to the other two prototypes, and are discussed in more detail in “Targeted Research Needed for Successful Implementation of Design Elements” on p. 178. Research specific to this prototype includes studies that would develop
models that would estimate quarterly and annual expenditures and income at the household level from the four weeks of reported detailed data from the Ongoing Expenditures Module plus the data reported on the Large and Routine Expense Module.
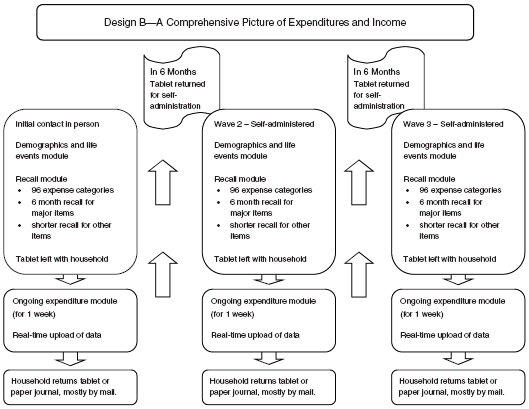
Design B—A Comprehensive Picture of Expenditures and Income
This prototype attempts to collect income and expenses at the individual household level over 18 months. It features household respondents “recalling” expenditure data aggregated for the 96 categories of expenditures (discussed in Henderson et al., 2011) for the previous six months. It is anticipated that a more focused questionnaire with less categorical and chronological detail may take less time to complete than the current Interview survey. Coupled with three contacts instead of five, there is an expected overall burden reduction compared to the current CE Interview survey. If an effective supported journal can be designed, the same households in the sample would also be asked to participate in a one-week supported journal to collect detail on smaller expenses used primarily to disaggregate some expenses reported in the recall survey.
The initial contact for Design B is an in-person visit by the field representative to the household. The field representative would assist the respondent in completing a recall survey of expenditures on a tablet computer. The tablet would be left with the household for use in a one-week supported-journal concurrent collection of expenditures and then mailed back, similar to that described in Design A. The tablet would be returned to the household by mail in six months and again in one year to repeat the recall and supported journal in a self-administered mode. Figure 6-2 provides a flow outline of Design B.
Objectives
Design B has the following primary objectives:
- Rely on a basic recall mode of reporting, which has provided aggregate expenditure estimates in the past that were more in line with the Personal Consumption Expenditures (PCE).
- Redesign the recall questionnaire to collect expenditures directly from the respondent at a broader level of aggregation, rather than collecting the current level of detail and then calculating aggregates.
- Provide specific instructions to help the respondent estimate expenditures that cannot be recalled.
- Utilize technology to assist and support the respondent in filling in this redesigned questionnaire through a self-administered process in waves 2 and 3.
- Build data files well designed for economic research and policy analysis by providing a comprehensive picture of expenditure, income, and assets for each household for 18 months.
- Use a component subsample linked to the main sample that could be used to explore the accuracy of the overall data collection and provide an opportunity to collect data for more demanding research needs. It would employ techniques such as the prior collation of records, the use of financial software, and budget balancing. This component is discussed separately at the end of the description of Design B.
Key Assumptions
Design B makes several key assumptions about the collection of consumer expenditure data:
- The collection of “bounding” data is unnecessary and inefficient for the collection of accurate expenditure data in a recall survey.
- The value of the micro dataset flows primarily from the construction of expenditure data for relatively broad aggregates—for instance, the 96 expenditure categories for which CE tables are currently published—rather than an extremely detailed breakdown of those expenditures.
- A household can accurately recall aggregated expenditures for periods up to six months for some categories of expenditures. For other expenditure categories, respondents can approximate averages (e.g., average monthly spending for gasoline) that can be used to construct a full set of microdata for the entire six-month period.
- Household respondents will agree to remain in the panel for 13 months, with three data collection events during that period.
- The use of supported self-administration with the tablet, a central support facility, and the field representative allows most respondents to complete the redesigned recall questionnaire without the need for an in-person interview during waves 2 and 3.
- Households selected for the intensive subsample would be willing to participate in this more intensive data collection and are able, with assistance, to budget balance their annual finances.
To the extent these assumptions are valid, detailed microdata suitable for socioeconomic analysis can be obtained at the same time that the aggregate data objectives of the survey are met.
Sample Design
In Design B, a large sample of households is surveyed three times, at six-month intervals. To smooth the operation of the survey, one-twelfth of the households would be initiated each month. Once fully implemented, the workload in each month would be the initiation of a new survey panel, administration of the second wave of the survey to the households that had been initiated six months earlier, and administration of the final wave of the survey to the households initiated one year earlier. The field representatives are used intensively in the initial wave. If self-administered collection methods are successful, the field representative is used in the two additional waves only for households who need in-person assistance in completing the questionnaire.
In addition to a recall of expenses, each household would be asked to keep a one-week supported journal for the upcoming week. Thus, both recall and supported journal surveys are conducted on the same households, and repeated at six-month intervals for three repetitions.
Data Collection: Modes and Procedures
Design B collects recalled expenditure data, as well as demographic information, income, and assets. The first wave of collection is interviewer assisted, with the subsequent two waves relying on supported self-administration to the extent reasonable. As with Design A, survey instruments are presented through an interface on a tablet computer. The tablet interface follows the guidelines described under Design A and in “Using the Tablet Computer for Self-Administered Data Collection” on p. 157. Thus, the details are not repeated here.
In this prototype, the tablet is set up with three modules all designed for self-administration:
- Demographics and Life Events Module: demographics and other information about the household;
- Recall Module: for reporting expenditure, income, and asset data recalled or estimated for the past six months; and
- Ongoing Expenditures Module: for recording detailed, ongoing expenditures by household members during the one-week period of supported journal collection.
During the initial in-person contact with the household, the field representative identifies the main “household respondent.” As with Design A, the field representative assists him or her with completing the Demographics and Life Events Module on the tablet. The first meeting also allows the field representative to assess whether the respondent can be fully self-sufficient in using the tablet for data collection. The goal is to encourage the use of the tablet as much as possible in subsequent waves while maintaining data quality.
The field representative would then assist the respondent in completing the Recall Module reporting expenditures and income for the previous six months. This process not only obtains the needed data for this wave, but also trains the respondent on using the tablet and the specific modules in preparation for waves 2 and 3.
Following the completion of these modules, the field representative would ask the respondent to keep a concurrent supported journal for the next week (Ongoing Expenditures Module). Following the supported journal week, the respondent returns the tablet by mail.
Wave 2 takes place in six months and wave 3 in one year following wave 1. Respondents would be contacted a month ahead of the recall data collection and reminded to gather records and receipts. The tablet with the same data collection modules is used. Household respondents who were successful in using the tablet during wave 1 would be mailed a tablet for waves 2 and 3 to be completed without interviewer assistance. The “interviewer assistance” during wave 1 prepares them to complete this task. They are asked to complete all three modules and return the tablet following the supported journal week. Households that were not successful using the tablet in wave 1 would be contacted in person or over the telephone to complete waves 2 and 3.
Demographics and Life Events Module: This module includes standard demographics plus other items to assist in tailoring estimation in the event that the household drops out of the panel. Examples include the number and age of household members, income bracket, purchasing habits, and use of online payments. In waves 2 and 3, the questions would be modified to ask about key “life events” that might have transpired over the previous six months.
Recall Module: This module collects data on expenditures at a relatively broad level of aggregation based on variable recall periods. The objective is to obtain six-month estimates for each expenditure category. The assumption in this prototype is that reporting certain expenses (such as major durable goods, rent, and utilities) for six months would be relatively easy and accurate. For other recurring expenses such as groceries and gasoline,
for which shorter recall periods are appropriate, the respondent could make estimates of monthly averages of sufficient accuracy to be expanded to estimate spending for six months. Ultimately, all reported data would be expanded to a six-month estimate by the tablet app. The instrument would also include special prompts for expenditure categories that have been historically underreported, such as clothing, food away from home, alcohol, and tobacco. These prompts would include the types of expenditures and the possible locations of potential purchases.
Compared to the current CE Interview survey, Design B significantly curtails the number of questions both in terms of the breadth of categories (as discussed above) and the detail required in reporting those expenditures. For instance, the instrument would not ask in which month purchases were made, or sales tax, or information about the individuals for whom the purchase was made. These details add significantly to the burden in the current CE Interview survey.
Income, assets, and “labor force status” would be collected for each household for the same six-month period. Again, some estimation may be necessary based on current pay stubs and prior tax records.
Ongoing Expenditures Module: After completing Design B’s recall survey, households would be asked to keep a one-week self-administered supported journal. The supported journal would collect information on expenditure categories for which recall collection is more problematic and would provide additional detail that can be used to disaggregate totals. Thus, the supported journal would focus on specific categories of expenses. (However, research might indicate that it is more efficient to collect a complete record.) A paper-supported journal would be available for use when necessary, but the tablet would be the preferred mode.
Frequency and Length of Measurement
There are three waves of data collection at six-month intervals in Design B. Each wave uses a tablet computer with three modules. Wave 1 requires an in-person visit by the field representative with an “assisted” interview using the tablet for the Demographics and Life Events Module and the Recall Module. The tablet is left with the household for a one-week supported journal. In subsequent waves, the tablet is mailed to the household for self-administration of two modules plus the one-week supported journal. A household is in the sample for 13 months and recalled expenditure data are collected for 18 months. All recall and supported journal instruments are the same for different waves. The demographics module would be modified for use in waves 2 and 3 to ask about key “life events” that might have transpired over the previous six months.
Completing the Demographics and Life Events Module and the Recall Module is expected to take 30–45 minutes regardless of mode. The Ongoing Expenditures Module (supported journal) is expected to take 20 minutes per day.
Recall Period
The recall period for Design B’s Recall Module is six months. If appropriate, the recall period for some items can be less than six months, and the expenditures reported for the shorter period used to estimate spending for the full six-month period. For the Ongoing Expenditures Module (supported journal), the collection period is one week. The supported journal collects data on a daily basis, with little or no recall required.
Incentives
The panel estimates that an incentive payment of $100 would be made to households for completing each of three waves of data collection in Design B. Households that were unable to use the tablet and require in-person enumeration for each wave would receive an incentive of $50 per wave instead of $100.
Role of the Field Representative
In Design B, the field representative establishes contact with each household and secures cooperation. The field representative conducts the first interview by assisting the respondent with wave 1 data including household composition, demographics, and the six-month recall categories. Simultaneously, the field representative trains the respondent on the use of the tablet and its modules in preparation for waves 2 and 3. The field representative recruits the household into the supported journal collection, emphasizing the tablet-supported journal collection in the vast majority of cases. The field representative trains the respondent on the use of the tablet for supported journal collection. The field representative explains the incentive for filling in the supported journal, leaves the tablet and a mailer at the household, and departs.
After the initial in-person visit, ideally the field representative never visits the household again. In principle, the household faithfully fills in the Ongoing Expenditures Module (supported journal) and mails the tablet back in a timely manner, and the household respondent successfully masters using the modules on the tablet and agrees to complete waves 2 and 3 in a self-administered mode. The field representative may be called upon by the central office to intervene with a household, for example, to encourage
reporting on the supported journal for the entire week, to answer questions about the instrument, to substitute a paper-supported journal for the tablet-supported journal, or to pick up the supported journal. The field representative does not monitor the cases in the first instance, but intervenes only at prompting from the central office.
The role for the central office includes monitoring the cases on a daily basis, phoning the household to intervene if the supported journal is not filled in, and prompting field representatives if their assistance is needed. The central office also fills the role of first-line support for respondent questions, forgotten passwords, and the like. The central office will also re-initiate contact with the household in six months, mailing the tablet and instructions.
Role or Expectations of the Respondent
The respondent provides data three times in Design B. The first time, the respondent is assisted by the field representative for the recall categories, but then records concurrent expenditures with the supported journal items for a week. The respondent may need to use a paper-supported journal rather than the tablet. Whether the supported journal is a tablet or paper, the respondent is expected to mail it back to the home office. The assumption of Design B is that most respondents are willing to use the tablet throughout all three waves. The tablet is expected to make the respondent’s job easier.
Post–Data Collection Analysis
The spending for some goods over the previous six months would have to be estimated based on the spending during a shorter recall period. This could be as simple as doubling the expenditures reported for a three-month recall period, as Statistics Canada does for their interview survey. It is expected that the tablet app will make these adjustments. This design makes it easier for analysis because any modeling required for a complete record is done within the household, not across households.
Infrastructure
Infrastructure needs for Design B are similar to those in Design A and not repeated here.
Sample Size and Cost for Basic Component
The sample sizes and costs (data collection only) presented in this section for Design B are broad estimates for use only to compare across alternatives. More careful calculations were beyond the information and resources available to this panel. These calculations are based in part on a spreadsheet of 2010 CE costs provided to the panel. The panel used those costs to estimate for similar activities, and then calculated an estimated cost per sample for the new prototype. Thus these costs are for data collection only, and for data collection within a mature process. Estimates of sample size (net of 25% nonresponse) were then made that would keep to a neutral budget. Sample size and costs for the subsampled component are provided separately.
Assumptions:
- Cost per in-person recall module or interview—$325.
- 85 percent of households would use tablet. Costs go down with greater use of tablet.
- Paper households are contacted in person on each wave.
- Cost of tablet—$200. It can be used six times, with an expected loss of 10 percent.
- Remote monitoring of responses—$100 per wave per tablet household.
- In-person monitoring—$150, or $325 for full interview. Necessary for 10 percent of tablet households, and once or twice per paper household per wave.
- Incentives—$100 per wave per tablet household and $50 per wave when interview is required. Households participating in the intensive study would receive $150 per wave.
- Paper processing for paper households—$100 per wave.
Based on these assumptions, and remaining budget neutral ($16,000,000), the panel calculated the following projections for this prototype: (Sample size and costs for the subsampled component are provided separately.)
- Total cost = $13,900,000.
- Annual effective sample size (assuming 75% response) = 12,200.
- Average cost per sample = $1,138.
Meeting CE Requirements and Redesign Goals
Design B meets the basic CE requirements laid out in Consumer Expenditure Survey (CE) Data Requirements (Henderson et al., 2011). Additionally it is designed to reduce burden and reducing underreporting of expenditures. Table 6-2 provides more detail.
TABLE 6-2 Meeting the CE Requirements and Redesign Goals with Design B
| Goal | Design B—A Comprehensive Picture of Expenditures and Income |
| Produce quarterly and annual estimates of 96 categories of expense items | All 96 categories of expense data are collected with three data points for each. |
| Income estimated over the same time period | Questions on income, assets, and “labor force status” are asked on each wave and for the same reporting period. |
| Complete picture for household spending | This prototype focuses on providing an improved picture at the household level over the current CE. Some items are collected in the recall module and some in the supported journal, but both are collected from the same households. Data adjustment (expansion) to the entire six-month period will be needed for items not collected or estimated for the entire six-month period. However, each household will have complete (or estimated) records for all 96 items. |
| Proactive data collection rather than change at the margins | The supported journal collection is proactive. The recall module is recall. |
| Panel component with at least two contacts | There are three contacts for each panel member. |
| Reduced burden | There are three administrations per household, instead of five for the current interview. The interview is less burdensome than the current CE in terms of length and in difficulty of task. However, the household is now expected to execute both the interview and the supported journal. Incentives are used to reduce perceived burden. |
| Reduced underreporting | This prototype makes the assumption that aggregating expenditures for recall over a six-month period will have less underreporting than an attempt to recall more detailed expenses over three months. Research is needed to evaluate this assumption. |
| Budget neutral | Sample sizes are calculated to maintain approximately the current budget level. |
Many of the research requirements for Design B are common to the other two prototypes, and are discussed in more detail in “Targeted Research Needed for Successful Implementation of Design Elements” on p. 178. Research specific to this prototype includes the following:
- investigate the assumption that a “bounding” interview is unnecessary to avoid telescoping and other issues;
- investigate the accuracy and completeness of aggregated expenditures for periods up to six months and for estimates of averages (e.g., average monthly spending for gasoline) used in this prototype to construct a full set of microdata for the entire six-month period;
- develop appropriate models to “disaggregate” aggregated expenses using data from the one-week supported journal; and
- develop successful methodology for a component that will use an intensive interview and process based on prior collation of records and financial software to achieve a budget balance for the year at the household level, as described below.
Intensive Subsample in Design B
Design Objectives: A relatively small subsample of households who have completed wave 3 of the basic component of Design B would be asked to participate in a more intensive process to provide a full picture of income and expenditures over two consecutive calendar years. The process uses paper and online records more intensively, encourages the use of financial planning software, and employs budget balancing to reduce discrepancies between expenditures and income net of savings.
As discussed in Chapter 5, the PCE is the primary but problematic benchmark for comparing the CE aggregate expenditures. This subsample would attempt to establish accurate measurements of expenditures, income, and assets at the household level for a year through a more intensive record– and budget balance–driven process. Besides establishing an improved benchmark for measuring the success of the data collection methodologies in the basic component, the subsample would inform how better to collect expenditures in the ongoing survey and measure the extent and organization of household recordkeeping.
Key Assumptions: Assumptions for Design B’s intensive subsample include the following:
- Households that have completed wave 3 of the basic component of this prototype are willing to participate in this more intensive process if selected for the subsample.
- Respondents, with the help of the field representative, can reach reasonable balance between expenditures and income less savings. Fricker, Kopp, and To (2011) found the actual balancing between income and expenses difficult in practice. However, Statistics Canada used this approach for a number of years before redesigning their survey in 2009, so there is likelihood that a workable prototype can be developed.
Sample Design: A relatively small subsample of households that have completed wave 3 of the basic component of this prototype would be selected for this component. Calculations in this report are based on a subsample of approximately 5 percent of the original sample.
Data Collection: Modes and Procedures: The initial wave of data collection would begin approximately two months following the wave 3 interview. A second wave of data collection would be one year later. Data collection is expected to be face-to-face. It may take multiple visits to achieve the required balance.
Expenditure and income data reported during waves 2 and 3 of the basic component would be available to the respondent and field representative to work together to bring things in balance. The goal of having a financial budget that balances would be explained up front to the household. The respondent would be encouraged to use financial software and supply records, and/or draw information from online financial sources, including credit card and bank accounts as is done by Mint.com (2011). Additionally, the respondent will be asked about loyalty card programs in which they participate, and will be asked to provide permission for BLS to obtain the household spending data captured within those programs. Categories of spending for which there are no records become the leftover or residual part of expenditures. The main survey instrument is then used to fill in the missing parts of expenditures over the year, keeping in mind the need for the budget to balance.
Frequency and Length of Measurement: This design features two waves of data collection, one year apart. All households in the subsample will be included in both waves. Income, savings, and expenditure data for one year are required for each wave.
Recall Period: This intensive process focuses on obtaining and using records of income and expenses. However, during the balancing process, respondents may be asked about expenses and income for the previous year.
Incentives: The panel understands that the effort required of a respondent to actively participate in the financial balancing activities is greater than for a recall interview. Therefore, it estimates that an incentive payment of $150 would be made to households for completing each of two waves of data collection, for a total of $300.
Role of the Field Representative: The field representative’s role in this component changes radically. He or she assists the respondent in sorting through available records of income and expenses over the year. The field representative would also work with the respondent to balance the household financial budget for the year, probing for additional income and/or expenses to bring the budget into balance.
Role or Expectations of the Respondent: The respondent is expected to be an active participant in this process to balance the components of the household’s financial budget for the year. This would include providing paper and electronic records, and giving permission to access credit card, banking, and tax records directly.
Post–Data Collection Analysis: N/A
Infrastructure: None specific for this component of Design B.
Sample Size and Cost: The sample size and costs (data collection only) presented here are broad estimates for use only to compare across alternatives. More careful calculations were beyond the information and resources available to this panel. These costs are in addition to the costs for the basic component of Design B.
Assumptions:
- Budget balancing process may take several interviews with the household and may require more experienced field representatives. Expected cost per household—$800 per wave, with $350 per refusal contact.
- Response rate—50 percent
- Incentives—$150 per household per wave.
Based on these assumptions, the panel calculated the following projections for this prototype.
- Total completed sample size per wave = 800.
- Average cost per household per wave = $1,300.
- Approximate total cost = $2,100,000.
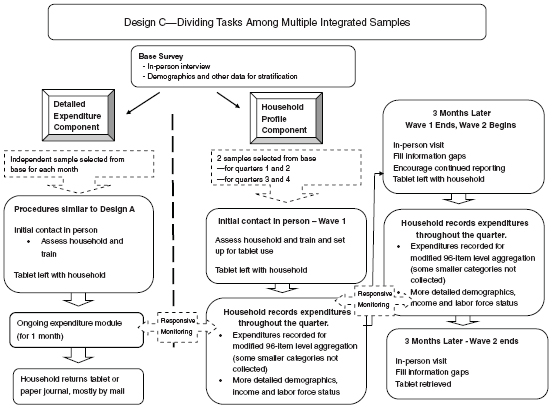
Design C—Dividing Tasks Among Multiple Integrated Samples
Design C utilizes a multiphase sampling design that empowers estimation and modeling to provide the needed data products with reduced burden on respondents. In doing so, it provides detailed expenditures similar to Design A. It provides a complete picture of household expenses and income as in Design B, but for six months (instead of 18) and only for a portion of households. It features supported self-administration using a tablet computer and data collection interfaces as described in the other two designs. Figure 6-3 provides a flow outline of Design C.
Design Objectives
The guiding principle behind Design C is to avoid asking every household in the sample to perform exactly the same tasks. By dividing up the tasks, the overall burden on an individual household is reduced. The totality of information is brought together through estimation and modeling. The power of this design relies on (1) achieving good correlation between the estimates from the base survey and the estimates from the later phases of data collection; (2) developing effective models involving covariates such as demographic characteristics to connect estimates from the different subsampled surveys; and (3) achieving improvements in the data quality and reporting rates in the supported self-administered procedures used with the subsamples. It also provides panel data and a complete picture of a household on a subset of the overall sample.
Key Assumptions
Design C makes several key assumptions about the collection of consumer expenditure data:
- All the key assumptions listed under Design A are present.
- Strong correlations exist for covariates measured in the base survey and later phases of data collection.
- Effective models involving covariates such as demographic characteristics can construct estimates using the different subsampled surveys.
- Collecting a complete picture of household expenses and income on a substantial component of the overall sample with modeling of
- smaller expenditure items from a different sample will be sufficient for economic and policy analysis.
- A one-month tablet-based reporting period for documenting ongoing purchases is plausible. This is an open research question.
Sample Design
Design C includes a base survey followed by surveys of more intensive and frequent measurements. The base survey would have a relatively large sample size, collecting information to use for stratification and modeling. From that base, two sets of independent samples would be drawn. Sampled units in the first component are asked to keep a supported journal for one month to proactively record detailed expenditures. Sampled units in the second component are contacted for quarterly recording of aggregate expenses for two quarters.
The Base Survey: The base sample is a large, address-based sample similar to the current CE Interview sample. This initial survey forms a stratification base for sampling later phases of more intensive data collection. Base survey data are also used in models, combining them with data from later phases to produce estimates. In order to keep the base sample “fresh,” it would be supplemented each quarter with new samples that would be interviewed. This allows base survey data collection to go on throughout the year, and the samples for more intensive data collection to be selected using an updated base.
Detailed Expenditure Component: Design C calls for selecting 12 independent samples (one for each month) from the base survey and asking households in those samples to keep a supported journal of expenditures for one month. The purpose of these surveys is to proactively collect detailed expenditure data in the same manner as described in Design A. These data would be used in national and regional estimates, with precision enhanced by modeling back to the base survey and combining with data collected from the household profile component.
Household Profile Component: Design C calls for a separate component of the overall sample to focus on providing a complete profile of household expenses and income over two consecutive three-month periods. Independent quarterly samples would be selected from the base survey for collection of data through a combined proactive/recall collection process.
Data Collection: Mode and Procedures
The Base Survey: The base survey would be conducted in person using a computer-assisted personal interviewing (CAPI) instrument, administered on a “rolling basis” to provide the samples of the component surveys for the upcoming quarter. The survey would collect household demographics and basic income and asset data as needed for stratification, modeling, and imputation. (Perhaps this is as simple as a “range” value for household income, along with presence or absence of various assets.) It would collect global expenditures, at the 96-item level, aggregated even more if the correlations allow, with a variable recall period based on expense item. There would also be a series of questions regarding the household’s basic expenditure habits and comfort level with various reporting technologies.
Detailed Expenditure Component: The detailed expenditure component of Design C is set up in the same way as the supported self-administered journal described in Design A. One difference is that, in this prototype, households are asked to maintain the supported journal for four consecutive weeks. In Design A, households were asked to maintain the supported journal for two weeks, and then asked again to complete the two-week supported journal the following quarter.
Another difference between Design C and Design A is that the household would be asked to complete only the Ongoing Expenditures Module. Demographics were collected in the base survey. Income/assets, and larger and routine expenses, for the most part, are estimated from the household profile component of the overall sample. This component focuses on the smaller expenditures of a household.
Household Profile Component: Households in this component would be asked to keep records of aggregated expenditures at a modified 96-item level over two periods of three months. Most of this recording of expenditures would be proactive, using supported self-administration. At the initial interview, the field representative trains the respondent on the use of the tablet and its interfaces. The field representative asks the household to proactively keep receipts and use a supplied tablet computer to record expenditures during the upcoming quarter.
Household respondents would enter expenditure amounts in the tablet, indicating the expense category for the item. For example, a respondent might click on the category men’s apparel and footware and then enter the amount spent for a pair of shorts or a pair of shoes. No further detail would be required. The level of entries is also reduced because expenses in some of the smaller and/or more frequently purchased categories (such as
food away from home, gasoline, nonprescription drugs, tobacco products, and personal care items) would not be collected in this component. Instead the household’s expenditures for these items would be modeled from “like households” in the detailed expenditure component. Additionally a trip to the grocery store would require only saving the receipt or entering the total spent in the tablet. The allocation of food items purchased to details (such as meat, fruits/vegetables, nonfood items) would also be modeled from the detailed expenditure component for similar households. Thus the requested level of expense detail would be much less than in the supported journal component, requiring considerably less effort per week. Ongoing monitoring and feedback would encourage recordkeeping throughout the quarter. The field representative returns at the end of the quarter and conducts an interview (using the tablet) to fill information gaps. The goal is to end with a complete profile of expense data for the quarter at the 96-item expenditure data level, which includes some modeled components. The profile would include expenditures for smaller items, as well as breakouts of some aggregated amounts modeled from data from the detailed expenditure component.
The field representative would leave the tablet with the household for one additional quarter, reemphasizing the need to keep receipts and record expenditures on the tablet. The field representative returns again at the end of the second quarter and conducts an interview using the tablet to fill information gaps. At this point, he or she removes the tablet, ending the contact with this household.
The household respondent would also be asked to complete the Income Module on the tablet (described under Design A) at some point during the second wave to provide information on income and assets.
This component is similar to Design B and is modeled, in part, after the Westat proposal described in Chapter 4. It is similar to Design B in that it collects many of the data items in the Recall Module of Design B. It differs by placing the tablet with the respondent at the beginning of the reporting period and encouraging the respondent to report throughout the quarter. In Design B, the tablet is provided at the end of the period to the respondent, who is asked to use records and receipts to recall or estimate for aggregated expense items. Design C also differs from Design B in that reporting is for two three-month periods, as opposed to three six-month periods. Income, asset, and “labor force status” questions are included in the recall module. In wave 2, there is a series of questions about major life changes during the previous six-month period.
In both Design B and in the household profile component of Design C, a separate supported journal for detailed information is part of the design. In Design B, both pieces are collected from the same sample of households. In Design C, the details come from a different sample of households.
Frequency and Length of Measurement
All households would be interviewed in person on the base survey. Households selected for the detailed expenditure component would receive an additional in-person visit to place the tablet and initiate the supported journal keeping. These households would be asked to maintain a detailed supported journal for one month and to return the tablet by mail at the end of that month. Households in the household profile component would be interviewed in person two or three additional times. The first would be to set up the first quarterly recordkeeping period and place the tablet. Field representatives would make subsequent in-person visits at the end of the first quarter and again at the end of the second quarter. These last contacts might be made by telephone if the respondent is regularly entering expenditures throughout the quarter into the supplied tablet. Households in this component would be asked to report aggregated expenses over two consecutive one-quarter reporting periods.
Recall Period
In the base survey, respondents are asked to recall aggregated expenses for a variable recall period depending on the category of expense. In the two component samples, respondents are asked to record ongoing expenditures. Some recall questions regarding the previous quarter might be required to fill data gaps at the end of that quarter.
Incentives
Incentives would be used in both components of follow-on samples but not for the base survey. The panel envisions using the following incentives:
- $150 per household for completing the detailed expenditure component, and
- $180 per household for completing the six-month household profile component.
Role of the Field Representative
The field representative’s role changes radically, from being the prime interviewer and data recorder to being the facilitator who encourages, trains, and monitors in support of the respondent’s data entry. Ideally this will be true for both components. On the household profile component, the field representative may have to do more traditional interviewing if the household has not successfully kept up with recording expenditures over
the quarter. The role of the field representative would vary for households that use the paper-supported journal, and also across different tablet households depending on their comfort with the technology, willingness to use records, and household composition.
Role or Expectation of the Respondent
In Design C, the respondent takes on the primary role of providing the most accurate data possible, supported by records to the extent possible. What differs from the respondent’s current role in the interview is that the respondent (after the initial meeting with the field representative) controls the time, pace, and order of data recording. In this sense, the design implicitly supports the idea that providing accurate data takes time and thoughtfulness. What differs from the respondent’s current role is that the respondent, in the supported journal, is provided with augmented ongoing interactive encouragement and support from both the interface and from remote support staff.
Post–Data Collection Analysis
Estimates made using Design C would combine the strength of the larger sample size of the base survey and the more accurate detailed data from the follow-on components. They would be based on models that depend on the correlations between the estimates from the various data collections within each household and the correlations across aggregates of households based on household attributes. It is not expected that any one sample would stand completely on its own. The information collected would be strengthened through more detail or more breadth collected in other samples.
The panel envisions that the estimates of expenditures for the 96-item level aggregates and the more detailed estimates needed by the CPI would be model-based using data from both components and the base survey. A complete profile of individual households for microlevel research would be based on data collected for six months on the household profile component, which would be supplemented with estimates of smaller categories of expenses and/or the breakdown of collected aggregates using data from the detailed expenditure component.
Infrastructure
Infrastructure needs are similar to those in Design A and not repeated here.
The Design C sample sizes and costs (data collection only) presented in this section are broad estimates for use only to compare across alternatives. More careful calculations were beyond the information and resources available to the panel. These calculations are based in part on a spreadsheet of 2010 CE costs provided to the panel. The panel used those costs to estimate for similar activities, and then calculated an estimated cost per sample for the new prototype. Thus, these costs are for data collection only, and for data collection within a mature process. Estimates of sample size (net of 25% nonresponse) were then made that would keep to a neutral budget.
Assumptions:
- Cost per household in the base survey—$324.
- Cost per tablet placement—$165.
- 85% of households would use tablet. Costs go down with greater use of tablet.
- Cost of tablet—$200. It can be used six times, with an expected loss of 10 percent.
- Remote monitoring of responses—$100 per tablet household, for both components.
- In-person monitoring—
o $150 for the detailed expenditure component. Necessary for 10 percent of tablet households and twice per paper household.
o $200 for the household profile component.
- Incentives—$150 per detailed expenditure component; $180 per household profile component.
- Paper processing for paper households—$100.
Based on these assumptions, the panel calculated the following projections for Design C:
- Total cost = $20,600,000—above the budget neutral point.
- Annual effective sample size (assuming 75% response) for base survey = 25,000.
- Annual effective sample size (assuming 75% response) for detailed expenditure component = 11,000.
- Annual effective sample size (assuming 75% response) for household profile component = 7,000.
This prototype is shown with a cost projection that is greater than budget neutral cost of $16,000,000. The base survey required considerable resources and the panel wanted to ensure that the quarterly panel
component had a sufficient sample size to be effectively used for economic research. The panel did not make projections on how high the correlations between the three components will be and estimated sample size without those assumptions. With relatively high correlations and modeling back to base, the precision of the estimates will increase. BLS should then be able to lower the sample sizes while maintaining the required precision, and thus bring costs back down. The extent of the increase in precision needs to be evaluated. The preliminary budget projections are
- Average cost per sample for base survey = $324.
- Average cost per sample for detailed expenditure component = $529.
- Average cost per sample for household profile component = $962.
Meeting CE Requirements and Redesign Goals
This prototype meets the basic CE requirements laid out in Consumer Expenditure Survey (CE) Data Requirements (Henderson et al., 2011). Additionally, the redesign seeks to reduce burden, reduce underreporting of expenditures, and utilize a proactive data collection mode with newer technology. Table 6-3 provides more detail.
Targeted Research Needs
Most of the research requirements for this prototype are discussed in “Targeted Research Needed for Successful Implementation of Design Elements” on p. 178. Additional research is needed specifically for this prototype to:
- research and develop models for estimation using the base survey and two waves of data collection; and
- research and develop models for imputing at the household level “smaller expense items” collected on the detailed expenditure component and not on the household profile component into the household-level dataset to complete the overall household expense profile.
Comparison of Designs A, B, and C
As described above, the panel developed three prototypes of a redesigned CE. Each prototype is different—a good fit for a specific use of the data and perhaps less adaptable for other uses. Each prototype is similar in several ways. They all meet the basic CE requirements, take steps to reduce burden
TABLE 6-3 Meeting the CE Requirements and Redesign Goals with Design C
| Goal | Design C—Dividing Tasks Among Multiple Integrated Samples |
| Produce quarterly and annual estimates of 96 categories of expense items | The design collects data at a more detailed level of expenditures than the 96 categories. Details are collected in the supported journal component. Larger and aggregated expenses are collected in the household profile component. Modeling data collected in both modules using correlations with base survey variables is expected to create estimates of detailed expenses with appropriate precision. |
| Income estimated over the same time period | Income is reported in the household profile component for each reporting period. |
| Complete picture for household spending | A complete picture of each household is collected for households sampled in the household profile component at the 96-category level. These estimates can be used independently or modeled along with data from the base survey and detailed expenditure component to enhance detail and precision. |
| Proactive data collection rather than change at the margins | The focus of this prototype is proactive self-reporting in both follow-on components. Expenditures are recalled in the base survey, but these data are not used for direct estimation. |
| Panel component with at least two contacts | There are two contacts in adjacent quarters for each household in the household profile component. |
| Reduced burden | This prototype reduces burden by dividing the overall tasks among multiple integrated samples, and not asking each household to perform each task. Some households are asked to provide detail over a relatively short period. Other households are asked to report over a longer period, but are asked for less detail. Incentives are available to reduced perceived burden. Burden is reduced by making the response tasks easier and more intuitive with the tablet interface and support. Incentives are used to reduce perceived burden. |
| Reduced underreporting | The detailed expenditure component focuses on detail, the increased use of records, allowing the respondent to record expenses at a time best suited and in a way best suited to him/her, reduced proxy responding, and incentives to perform the task. All are expected to lead to a reduction in underreporting detailed expenditures. The household profile component also focuses on use of records, asks for less detail, and allows the respondent to record expenses at a time best suited for him/her. The ability to model using data from all components will allow for better adjustment of underreporting when it is discovered. |
| Budget neutral | The sample sizes that are calculated exceed the budget neutral level. If the correlations between the base variables and the two components are sufficiently strong, these sample sizes could be reduced. |
and to incorporate technology, and use as part of their design an implementation of self-administration with support from the field representative, a tablet computer, and a centralized support facility.
To recap the main features of the three designs:
- Design A—Detailed Expenditures Through Self-Administration is designed to provide all of the detail that is needed currently for the CPI. It maximizes the use of self-administration through a supported journal for concurrent data reporting. It also features a self-administered recall component to collect larger and recurring expenses. It stresses that the recall period should be the one best suited for accurate reporting, which might vary by expense category. Cautions: Diary fatigue is an issue with the current Diary survey. The supported journal is designed to address this issue, but research is needed to develop and investigate this hypothesis. Additionally, Design A is not as adaptable for economic research as are the other two designs. It provides panel data with two waves of collection from the same household three months apart. The use of varying reference periods for different expense categories is likely to make the formation of a consistent household dataset for research more difficult.
- Design B—A Comprehensive Picture of Expenditures and Income focuses on providing a rich dataset that will meet the needs of economic research. It uses a recall survey to collect expenditure information over the previous six months. Incorporating three waves of data collection with the same household, it results in a panel dataset covering 18 months for each household. Waves 2 and 3 would be self-administered. The questionnaire would ask about aggregated (96-item level) expenditures, rather than at the more detailed level of the current Interview survey. It combines two collection methods: (1) asking respondents to recall specific expenditures for larger and recurring expenses and (2) asking respondents to estimate the “average or typical” amount spent on other types of expense items. This design also incorporates an intensive subsample in which households will be asked to work with the field representative to balance household income and expenses over two one-year periods. Cautions: A three-month recall period caused issues with the current Interview survey, and this design uses a recall period that is twice as long. Research is needed to see if the new approach (aggregated expense items, longer recall period, and increased use of respondent estimation of “typical or average” expenditures) will provide an acceptable level of accuracy. Design
- B does not provide expenditure estimates at the level of detail currently used by the CPI.
- Design C—Dividing Tasks Among Multiple Integrated Samples provides both the detailed expenditures required by the CPI plus a consistent and complete picture of household expenditures for economic research. It uses a base survey for stratification and sampling, followed by subsamples for a detailed expenditure component and a household profile component. Estimates of detailed expenditures would be made using data from all three components through modeling. The household profile component provides a consistent panel dataset for six months and is designed for use for economic research. A richer dataset for research could be developed through modeling with the other components. Cautions: Because of the base component, Design C may be more costly than the other two designs. If the correlation structure between the components is strong, sample sizes could be reduced and this might not be a problem. This design is complex and will take more resources to develop and test the required models. The panel data are provided for only six months rather than a full year.
The prototypes discussed above use a variety of methods for collecting expenditure data. Variations in the exact form of the collection methods and the relative emphasis across methods are what distinguish the prototypes from each other. The major collection modes are1
- a module to collect demographic and socioeconomic data, as well as information on life events. These modules reflect, inter alia, the need to classify households for all of the major purposes of the CE.
- a recall module. Design A includes a recall component to collect information on large and routine expenses. Designs B and C include recall components to collect spending for 96 expenditure categories. The recall periods are unspecified and variable for Design A and are used as needed to fill gaps in concurrent reporting in Design C. Design B has a six-month recall period, but it allows for a shorter period for some spending categories where spending is likely to be relatively stable over time. Design B explicitly accepts as (almost) inevitable that respondents will estimate spending patterns over the recall period.
- a supported journal. Designs A and B include supported journals
_____________________
1The intensive panel discussed under Design B is not discussed in this section, because none of the options requires that this approach be successful. Moreover, all of the options would benefit if it is found to be effective.
- to collect all expenditures over two- and one-week periods, respectively. The comparable supported journal for Design C would cover one month. Design C also includes a six-month supported journal to collect spending on the 96 expenditure categories covered by the recall modules in Designs A and B.
As emphasized above, the panel has no empirical evidence on how well these collection modes—and the variations within them across prototypes—will work. In the current CE, both the Diary and Interview surveys have serious shortcomings. Comprehensive and sophisticated—and, unfortunately, expensive—testing will be necessary to determine which, if any, of the collection modes in the prototypes can be successful. Among the key questions to be answered with respect to recall and the supported journal in the collection of expenditure data are the following.
Recall components:
- Can a recall survey be designed that could collect sufficiently accurate data on spending patterns for individual households at the level of 96 expenditure categories?
- How does the length of the recall period affect the efficacy of a recall survey?
- Is it necessary to accurately reconstruct actual spending or would it suffice for a household to estimate its spending patterns?
- How can new technology, including self-reporting on a tablet, be best used to improve a recall survey?
Supported journal:
- Can a supported journal overcome the diary fatigue and underreporting that has plagued the current diary instrument?
- For how long can households be asked to complete a supported journal?
- How would a supported journal that asks for spending aggregates, rather than individual purchases, work in practice?
- Can a structured journal be designed that will reduce respondent burden and increase and sustain the level of reporting?
- How critical a role would tablet reporting play in the design?
The answers to these (and other) questions will be critical to the CE reform effort and how the data from a new CE survey can meet the requirements specified by BLS. The implementation risks are significant:
- If it proves unworkable to collect expenditure data by recall, the
- spending data collected from each household—the number of expenditure weeks—will be seriously curtailed, increasing the variance of CPI weights and publication aggregates and making it impossible to construct annual spending patterns at the individual household level.
- If a supported journal cannot sufficiently mitigate the problems with the current diary, it will be impossible to get spending estimates at a fine level of category detail.
- The six-month supported journal in Design C is the most innovative of the collection methods in the three prototypes. It could be an alternative to a recall survey, albeit with compromises on the length of time covered. However, it requires modeling daily spending to 96 categories of expenses for six months; there is no experience on which to gauge how well an operational version can be designed and implemented.
The panel made an effort to compare data collection costs across prototypes. This proved very difficult to do, and the panel had to make many assumptions and guesses. Thus these cost estimates must be considered as very preliminary, and used only as a general comparison across prototypes. More precise costs would require considerably more information and resources than the panel had available for its deliberations. However, they are useful in comparing the three prototypes and in calculating the very approximate sample sizes that might be possible in the current budget environment.
BLS provided the panel with basic costs on data collection from the 2010 CE. It was difficult to extract the costs for initial screening for out-of-scope
BOX 6-1 Example: Calculation of Average Cost per Sample for Design A
Cost per household using a tablet:
Tablet placement (twice) + Prorated cost of tablet + Remote monitoring + In-person monitoring + Incentive
$330 + (($200 + $20) / 6) + $200 + ($150 * 0.1) + $200 = $782
Cost per household not using a tablet:
Paper diary placement and pickup (twice) + In-person monitoring + Paper processing + Incentive
$660 + $300 + $100 + $200 = $1,260
Average cost per household, assuming 85% use tablet:
($782 * .85) + ($1260 * .15) = $854
households and for contact with households that refused. Thus the panel focused on costs for completed interviews/diaries, making the assumption that the cost for screening and refusals would not vary greatly between prototypes. Following several conference calls with BLS and Census staff, the panel approximated the “budget neutral” amount for data collection for completed interviews/diaries as $16 million. This figure may not be very accurate, but it gives a base from which to make projections.
The panel used component costs provided by BLS for completed interviews and diary placements as a guide to provide very basic cost parameters (assumptions) for each prototype. The panel speculated on other costs. These cost parameters are provided in the report with the description of each prototype under Sample Size and Cost. The cost parameters were combined to create an estimated “average cost per sample” for each prototype. Box 6-1 provides the example of calculating this cost for Design A. This average cost was divided into the total cost to calculate an annual effective (completed) sample size. This number was rounded to avoid suggesting greater accuracy than this process could produce.
Table 6-4 provides a comparison of cost and possible sample size between the current CE and the three prototype designs. It is extremely important to note that these costs are for data collection only and for a mature data collection process. Any major redesign has many additional
| Design B by Components | ||||
| Design A | Base | Intensive Subsample | Total | |
| Sample size—Households (respondents) | 18,700 | 12,200 | 800 | 12,400 |
| Total collections across waves (respondents) | 37,400 | 36,600 | 1,600 | 38,200 |
| Weeks covered by direct reporting of expenditures | 448,800 | 878,400 | 0 | 878,400 |
| Incentives per household | $200 | $300 | $300 | $319 |
| Cost—Total (respondents only—75% response rate) | $16,000,000 | $13,900,000 | $2,100,000 | $16,000,000 |
| Cost—Per responding household | $853 | $1,138 | $2,625 | $1,311 |
costs that are not included here, including costs for development, research, testing, and retooling.
The sample sizes presented here are very general estimates of the effective sample sizes (net of a 25% nonresponse) that might be possible while remaining budget neutral.
To summarize, it is important to emphasize that extensive testing is necessary to determine which of the collection methods and their variants contained in the prototypes can be made operational. The prototypes embody the panel’s informed opinion about the best avenues to explore, not options from which to choose a survey design.
Using the Tablet PC for Self-Administered Data Collection
The panel proposes the use of tablet computers with wireless phone cards for supported self-administered data collection in all three prototypes as a way to solve some key problems with the CE. Lightweight and easy-to-use tablets represent stable (robust) technology, are commonplace, feature more than sufficient computing power, and are economical in price. In fact, their price continues to fall over time. This section provides more detail on the use and management of these tablets and the support system for their use.
For this data collection effort, a low-end tablet is likely to suffice. Their
| Design C by Components | Current CE by Components | |||||
| Base | Supported Journal | Household Profile | Total | Diary | Interview | Total |
| 25,000 | 11,000 | 7,000 | 25,000 | 7,100 | 7,100 | 14,200 |
| 25,000 | 11,000 | 21,000 | 57,000 | 14,200 | 35,500 | 49,700 |
| 0 | 44,000 | 168,000 | 212,000 | 14,200 | 340,800 | 355,000 |
| 0 | $150 | $180 | $108 | 0 | 0 | 0 |
| $8,100,000 | $5,800,000 | $6,700,000 | $20,600,000 | $2,833,822 | $13,086,524 | $15,920,345 |
| $324 | $529 | $962 | $824 | $399 | $1,843 | $1,121 |
use by respondents could reduce the number of field representative visits and associated field costs. The resultant savings could be used to fund worthwhile incentives to facilitate respondent participation. Through self-administration, interviewer effects would be minimized and data would be recorded on an ongoing basis, substantially reducing recall bias. Reliance on proxy reports could be reduced, as well. Since many people successfully use advanced self-administered applications on the Internet, adoption of a self-administered tablet data collection mode would not require large respondent training costs, especially if the data collection software were designed to be user-friendly.
These prototype designs would require an initial in-person visit from the field representative. The field representative would explain the survey, secure cooperation, deliver the tablet and demonstrate its use (i.e., train the respondent), explain the incentive structures, and answer questions. For some prototype designs, the field representative assists the respondent in self-administration of the initial survey module as a way of both collecting information and training on the tablet. The field representative would leave the tablet computer with the respondent, as well as a package in which to mail back the computer after data collection is completed. Self-administered data collection subsequent to the initial visit for the household would utilize the tablet to the greatest extent possible.
Technology Assumptions
This approach adopts established, relatively current technology. The only assumptions made about future technology are that (1) the wireless phone infrastructure will continue to expand and become faster, and (2) tablet computers are a viable platform for the foreseeable future (i.e., the next 10 years). Development software must be adaptable to future platform changes, but that is not expected to pose a problem.
The tablet can be situated in the respondent’s kitchen or on the dining room table, accessible to any of the household members charged with entering data. To be user-friendly, it will need to have a fast boot-up protocol, and all CE applications will have to execute very quickly with self-evident interfaces. Respondent training is expected to be short and to focus on the task completion (i.e., content and entry of data), rather than navigating the technology.
The tablet would house only necessary applications including logon, encryption, connection to the server, and the electronic instrument itself. As data are entered, they are sent to the server in real time. Such a system requires that the tablet be “locked down.” That is, it cannot be used for any other applications and non-CES applications cannot be loaded onto it. The sole exception would be if a limited number of popular free game
applications were installed as “incentives” to respondents to familiarize themselves with and use the tablet regularly.
The data collection application must have a simple, high-speed interface. For this reason, the application software is held on the tablet. Data are transferred immediately to the server. Data do not remain in storage on the tablet between activities with the respondent. Only secure data are communicated to the server, and not interface pages, routing information, or other application rules. A respondent can review the history of household entries at any time, and those data would be transmitted back to the tablet for review.
Respondents must be certain that their data are secure. Hardware, software, and procedures are built around secure protocols. Both the field representative and the technical support desk must be able to clearly explain how these data are held securely, in one place, on the data collection server. Respondents must also be aware that the use of these tablets represents better, more secure data collection than alternatives while reducing data collection costs.
Because relatively little consumer data are sent to the server at any point in time, wireless phone infrastructure is being proposed for communication. The coverage in the United States is extensive and ever increasing. Coverage for the CE target population is likely to be virtually 100 percent within several years. The use of this communication infrastructure means that a household’s Internet connectivity is irrelevant. Moreover, the link-up to the server would be immediate and transparent to the respondent.
Monitoring and Technical Support
Since data are received upon entry for tablet users, the respondent’s cooperation and compliance can be tracked by a centralized facility. For those who respond daily, it is possible to send positive reinforcement (e.g., a thank-you message) every time they log in. For those who lapse in their task, it is possible to intervene in a timely and effective manner with supporting reminders via phone, e-mail or text, or by mail. Ideally, a 24/7 in-house technical support team would be maintained throughout the data collection period to address respondent messages and phone calls very quickly.
The field representative remains involved with the household as needed. The representative may revisit some households to assist with or to perform the data collection. The representative may need to retrieve the tablet from some households after administration concludes, although this would be minimized by the distribution of the return-mail packages. However, these actions would take place only if requested by the central facility.
The tablet would be lightweight, have a large and bright enough screen
to be readable by even those with vision problems, and would be sturdy. It would withstand many mailings between the respondent and the home office. At every trip to the home office, the tablet would be inspected, cleaned, and recertified for continued data collection. Tablet software could be updated when it is in the home office.
Implementation Program
A rich implementation program will inform the many details associated with this kind of data collection. Any research taken as part of this program needs to be focused on optimal approaches, not on technical feasibility. Research will be needed on human interactions, including interface, incentives, training, protocols, and support. Development of the necessary in-house production infrastructure would include server development, communications, and sample management/tracking systems.
The implementation program would be iterative. Goals for key rates (e.g., rate of acceptance, rate of cooperation, and tablet longevity) would be set and monitored. Shortfalls would be quickly addressed via tailoring, using modified or new approaches. More details are provided in “Targeted Research Needed for Successful Implementation of Design Elements” on p. 178.
The Respondent
Under a successful implementation, most respondents would be able to execute the tasks via tablet within a few minutes. A well-designed interface would make long training sessions unnecessary. Field representatives would be able to assess respondents quickly to determine the most appropriate training or data collection approach.
Respondents are busy and do not have time to deal with slow interfaces and software awkwardness. The model for the interface would be similar to that of TurboTax rather than the linear flow methodologies of today’s self-administered questionnaires. This means that the app would be built in modules, and the user could choose to fill in the information in any order that is convenient. The user can also come back to any item and make a change at any time. Alternatively, the user (respondent) could choose to use a structured interview approach for moving step-by-step through the app.
The use of the tablet would be as simple as the following:
- Touch the on button.
- Log on.
- Observe the welcome and messages (can get past this easily).
- View the data collection module, which pops up fast, is easy to use, and is self-evident (visually coherent).
- Enter data, with computer response time being virtually instantaneous.
- When entry has been completed, hit the off button.
Delivery and Mail
The first time the tablet enters a household, it is brought by a field representative. The field representative leaves behind the tablet and a mailer package, and explains the incentives. After the recording period, the respondent slips the tablet into the mailer and sends it back. In subsequent waves, the tablet is mailed to the household and back to the home office. Since no data are held on the tablet, there is no security issue.
Under each of the three prototype designs, the panel estimates a loss rate of 10 percent per year for tablets. (This loss figure is stated as part of the sample size and cost assumptions under each of the three prototypes.) This estimate is relatively low because a tablet configured to allow only authorized survey activities would be of little later use to a household. However, in the next subsection, “Incentives and Cooperation,” the panel presents an option to allow some free game applications on the tablet as a way to encourage familiarity with the tablet. If this is done, then the tablet would become more valuable to the household and the loss rate could be higher. BLS should consider these issues and may want to hold final incentive payments to households until the tablet is returned. As an alternative, BLS could consider the tablet to be part of the incentive package and plan to leave it with the household. It is clear that the alternative of sending a field representative to pick up each tablet would add significantly to the survey cost.
Incentives and Cooperation
Incentives and monitoring are integrated. Respondent behavior is monitored constantly. Daily logging on is encouraged through the use of participation incentives and other forms of positive feedback. Longer-term engagement could also be enhanced through use of popular free game applications on the tablet. If the respondent fails to log on for a period of time, then an immediate automated intervention would be issued. This would start with the field representative making a call and offering assistance. If necessary, the field representative could revisit the household to encourage the use of the tablet, or to switch the respondent to an alternative mode of collection. The field representative would have access to respondent tracking reports so that intervention could be timely and effective.
From the perspective of the survey organization, these prototype designs shift activities to a more centralized basis, allowing more consistent, frequent, and responsive monitoring of data collection from a centralized facility. The role of the field representative is recast to one of gaining cooperation, training, modeling use of the tablet, and providing field-based support, rather than being solely an interviewer or supported journal-purveyor in a traditional sense. This change provides savings on field costs. Technical support staff would be available to respondents 24/7 (ideally) and would typically answer a call within a few rings. Possibly the support person can see the same screen as the respondent sees.
Tracking and assessment algorithms would run on the server in order to detect patterns of deception, respondents not cooperating, and so forth. Any issues would result in an intervention. Cooperation would be also quickly recognized with positive reinforcement. Incentives would be handled quickly, perhaps on an ongoing basis.
Incorporating Cognitive Changes to the Paper-Supported Journal
The panel recommends that a paper instrument be available for use by respondents who cannot or will not use a tablet computer to record and submit expenses. The current Diary booklet should not be used and the panel recommends a redesign (Recommendation 6-5). Considerable improvement can be made in the current Diary to ease comprehension and use. In addition, the structure of the tablet-supported journal and new paper-supported journal need to be aligned to the extent practical so as to minimize mode effects in data collection.
Recommendation 6-5: A tablet computer should be utilized as a tool in supported self-administration. However, a paper option should continue to be available for respondents who cannot or will not use a tablet computer. Visual design principles should be applied to redesigning the paper instrument in a way that improves the ease of self-administration and is aligned with the tablet modules.
With an eye to redesigning the paper version, the panel concludes that the current diary lacks a clear navigational path and linear flow that allow respondents to proceed page by page through the diary completion process. Currently the instructions are located throughout the booklet, where they seem to fit the page structure but force the respondent to search for information. The panel recommends eliminating “daily” report pages. The breaking apart of each category by day of the week and overflow pages
creates a larger diary booklet and makes it much harder for respondents to review the diary and see whether they have forgotten to add anything. With current content, it may be more effective to color code different sections of the booklet for each category of expenditure, and allow household members to keep a continuous listing of each expenditure category for the week. This structure would also work better for individuals who collect receipts and do not record expenditures each and every day, an occurrence that seems increasingly likely as alternative ways of purchasing and paying for items continues to grow.
The panel recognizes that the Diary has been revised in recent years, and the current format is considered a substantial improvement over previous versions. However, visual layout and design principles have continued to improve, and they need to be applied to producing a new paper-supported journal. This will require research aimed at testing to produce as much consistency as possible between how people respond to the tablet and paper forms of data collection.
The road to completing a redesign of the CE is difficult but has a very important destination. BLS began this journey in 2009 with the initiation of the Gemini Project. This report from the National Research Council provides some additional mapping for the future. The panel sees a number of steps ahead:
- Prioritize the uses of the CE.
- Conduct a feasibility study of relevant redesign protocols.
- Make redesign decisions based on the prioritization and assessment.
- Incorporate the use of newer technology as appropriate in the new design.
- Update the capabilities of BLS staff and outsource to find needed expertise.
- Conduct research that is targeted to successful final implementation of design elements.
This section provides some additional guidelines for these steps.
Timetable and Priorities
It is not the panel’s role to impose a specific timetable on BLS for investigation or implementation of the alternative designs discussed here. However, the panel believes that development of a targeted and tightly focused plan is necessary if BLS is to achieve a redesign within the next five years.
To that end, the panel suggests a prioritization of research and development activities and recommends that BLS adopt an ambitious timetable for working toward an alternative design.
A key initial step is to identify and prioritize the uses of the CE. A key finding of the panel is that many of the problems faced by the CE can be attributed to the multiple competing demands on the survey. In trying to be all things to all people, and to achieve maximum breadth and depth, the CE surveys have become unwieldy and increasingly unreliable. Without a prioritization of key purposes of the CE, and a corresponding acknowledgment that all purposes will not be equally well met, any redesign is unlikely to be a successful venture. Making the difficult decisions about what is to be sacrificed in order to improve the CE overall is a necessary first step on the redesign path. Without this, the remaining steps are unlikely to yield a successful outcome. The panel recommends that BLS undertake this process of the prioritization of key uses, with buy-in from stakeholders, as soon as possible, and believes that it can be done within six months.
Another key element of the panel’s recommendations is that some form of tablet-based instrument, used for both recordkeeping and reporting of expenditures, as well as for more traditional computerized question-and-answer process, is an essential ingredient in a new design. A number of key untested assumptions need to be addressed before proceeding with using this tool in alternative designs, including (1) whether the use of tablets will reduce burden and improve the quality of reporting over the paper-based diary and the interviewer-administered quarterly recall surveys; (2) what proportion of households will be willing to use tablets; and (3) if the introduction of tablets will reduce resistance to participation on the CE such that the overall field effort is reduced without negative effect on response rates. Answering these questions is critical in order to proceed with any of the alternative designs. A first priority is to design, build, and test a prototype tablet instrument. The panel believes this can be done within two to three years, but is likely to require outside help, especially from those with experience building tablet applications, and those familiar with the hardware and software issues related to deploying this technology.
If the tablet-based data collection approach proves feasible, other research and operational questions remain. They include questions such as whether varying the recall length for different expenditures would be effective to reduce burden and improve data quality; whether asking about broader categories of expenditures rather than the detailed items would similarly improve reporting; and how to structure incentives to maximize response. Some of these are described in more detail in the sections below. The panel views these as important, but contingent upon the successful implementation of a tablet-based approach.
Again, the panel is of the opinion that a precise timetable from them
(the panel) for implementation would not be helpful to BLS at this stage. Rather, it is recommended that BLS lay out a path to implement one of the three alternatives (or a different combination of the components of these three designs), with key decision points along the way. The feasibility studies outlined in Recommendation 6-3 would be a key component of this plan, and would be a key assessment on which to base further decisions.
These and other decision points need to be identified along with a clear understanding of the potential outcomes from research that will drive those critical decisions. Additionally, the alternative actions stemming from the decisions need to be clearly articulated. In other words, BLS should identify criteria for success (or continued research and development) at each critical juncture in the process. This will determine whether sufficient evidence exists to proceed to the next stage of development, or if alternative paths need to be followed. Some of the work can be done in parallel with work on the critical path, but it should not detract from the resources focused on addressing the key issues and reaching the key decision points within a reasonable time frame.
Recommendation 6-6: BLS should develop a preliminary roadmap for redesign of the CE within six months. This preliminary roadmap would include a prioritization of the uses of the CE, an articulation of the basic CE design alternative that is envisioned with the redesign, and a listing of decision points and highest priority research efforts that would inform those decisions.
Guidelines for the Use of Incentives
The purpose of incentives is to provide motivation to the respondent to complete a data collection activity and to take the time to provide accurate data. The CE in its current state and its future redesign will require considerable effort from respondents. It is the panel’s opinion that an appropriate incentive program will be needed as a part of this program. Monetary incentives are used in federal surveys but their use is not common. The Office of Management and Budget must approve each use of monetary incentives and look for strong justification based on criteria such as improved data quality, reduced burden, and/or improved coverage of specialized populations, and/or for surveys that are particularly complex (U.S. Office of Management and Budget, 2006). The panel believes that these criteria can be met by a carefully designed incentive structure for the CE.
This section provides a short background on incentive use in surveys and some guidelines for developing an incentive structure for the CE. The exact details of that structure, the exact kind and amount of incentive, and the
appropriate placement of incentives within the data collection window can only be determined with appropriate CE-specific research.
Overview and Basic Guidelines from Survey Research
The use of “incentives” is a standard and accepted component of many survey efforts in the United States. As Singer (2002, p. 3) appropriately described, “Incentives are an inducement offered by the survey designers to compensate for the absence of factors that might otherwise stimulate cooperation.” Interesting, however, there is less agreement within the research community regarding why incentives work, or at least no single theory describes when and why some incentives work and others do not. Some view an incentive as a “social exchange” between the researcher and the respondent. By providing something of value to the respondent, the respondent should, in turn, provide his or her cooperation. Others view it as an economic exchange, whereby the respondent views the offer to participate in terms of “costs” and “benefits,” and use of incentives can help to improve the perception of “benefits.” In reality, both factors are likely at work, with differential effects of each seen across different studies, populations, and contexts.
Typically, researchers use incentives to achieve one or more of the following goals: (1) improving overall response rates, (2) enhancing the characteristics of an unweighted set of survey respondents, (3) decreasing the likelihood of missing data or other factors that affect data quality, or (4) reducing the total costs of fielding a survey (Brehm, 1994; Church, 1993; Dillman, Smyth, and Christian, 2009; Singer et al., 1999).
In practice, incentives are sometimes used uniformly across all sampled units/respondents, or alternatively they may be used differentially across populations, contexts, modes, etc. In the first instance, all households/respondents receive exactly the same form, level, and timing of incentive. This is often done either for reasons of “fairness” (trying to treat all respondents identically) or for operational efficiency (simpler to execute and track). The downside is that incentives may be used where they are not really needed and/or the amount required to obtain participation from a particular subgroup or context may be insufficient. The use of differential incentives, in contrast, is based on the premise that incentives should be targeted to populations or points in the survey process where burden is highest or the likelihood of response is lowest (i.e., where task or burden may result in differential nonresponse) (Link and Burks, 2012; Martinez-Ebers, 1997). Use of differential incentives is often justified, therefore, based on effectiveness, efficiency, and “need” basis, but can be criticized for no longer treating all sampled units identically.
In terms of form and timing, incentives come in a variety of forms and
are most effective when targeted at the points in the process where they will be most effective. Numerous studies have examined the efficacy of different types of incentives, such as cash, checks, cash cards, sweepstakes, points and gifts, virtual rewards (e-badges, access to unique online content or functions), donations to charity, e-coupons, and so on (Antin and Churchill, 2011; Balakrishnan et al., 1992; Bristol et al., 2011; Trussell and Lavrakas, 2004; Warriner et al., 1996; Zichermann and Cunningham, 2011).
While cost is always an important factor, considerable care needs to be taken in matching the appropriate form of incentive to the specific population of interest to achieve the desired goal or outcome (i.e., cooperation, long-term compliance, higher data quality, etc.). There are also temporal aspects to the use of incentives. They may be paid upfront at the time of the survey request (“non-contingent incentives”) or paid upon completion of the task (“contingent incentives”) (Bensky et al., 2010). Incentives may be used at different points in the survey process—for recruitment, at the start of a survey, after the survey, or partial over time in the case of a panel or longitudinal effort. The value or form of incentive can also be different at these different junctures. Again, the researcher needs to consider carefully the form, amount, and timing of the incentives throughout the data collection process to achieve the desired study goals.
Cost is an important consideration in the use of incentives. Some researchers view incentives as an “additional cost” to their study design and will exclude them or cut them at the first sign of budget issues. In reality, if used effectively, incentives can help to reduce costs and become an essential component of the overall survey design (Brennan, Hoek, and Astridge, 1991). If used effectively, a modest incentive can often gain cooperation from a respondent far less expensively than having an interviewer try to convince a respondent to participate. Use of an effective incentive design can, therefore, reduce more costly interviewer time and/or achieve a higher rate of participation than when incentives are not used.
Guidance for the Consumer Expenditure Program
It is critical that some form of incentive structure be put in place in the redesigned CE regardless of what develops as the final data collection design. The reasons for this are cost-efficiency (e.g., using incentives to help reduce field time, labor costs, and other expenses) and as an offset of respondent burden. The exact form, amount, placement, and timing of the incentive structure for any given design will require pre-deployment research and testing. While lessons can be learned from a thorough review of prior published studies on incentives, the one truism in the use of incentives is that there is no single “magic bullet.” The effectiveness of a given incentive design is directly tied to the population of interest, nature of the
data collection request, modes of data collection, length of participation requested, and other factors. Prior studies do, however, provide a guide in terms of a starting point and most effective approaches:
- Cash is always the most effective motivator—monetary incentives, particularly when paid in terms of cash (as opposed to check, cash card, or e-payment), have a more positive effect than nonmonetary incentives even when the relative value is equal.
- Prepaid incentives work better than promised or post-paid incentives—an incentive provided to the respondent at the outset of the survey request appears to have a much greater impact on participation than does the promise of an incentive upon completion of a task, even if the value of the up-front incentive is somewhat smaller than the amount of the promised incentive.
- Incentives are most (and sometimes only) effective if utilized at the correct points in the survey process. For instance, if an incentive is offered for participation, it will be most effective if mentioned at the outset of the recruitment conversation as opposed to after the respondent has effectively agreed to participate.
- In panels or longitudinal efforts, incentives should be used throughout the process to maintain compliance, rather than provided entirely up front or at the completion of the panel. Ongoing rewards, both tangible and intrinsic, are important for maintaining long-term participation.
- Use of differential incentives (e.g., providing differing incentive forms, amounts, or timings to different sets of individuals based on varying degrees of burden or likelihood of cooperation) should be seriously considered for any incentive structure to optimize the efficient use of these funds.
- Larger incentives ($100+) should be considered in any instance where the data collection request is particularly intrusive or sustained.
- Intrinsic incentives (i.e., nonmonetary motivational approaches) should be a part of any panel or long-term data collection effort to help sustain respondent interest and motivation. These are a range of incentives of this type, including use of “e-badges” (electronic notices in the form of a badge) for completion of successful tasks or meeting milestones; status levels (i.e., silver, gold, platinum) for reaching critical milestones or longevity; and random notices congratulating or thanking the respondent for their participation (Antin and Churchill, 2011; Zichermann and Cunningham, 2011). These types of incentives are easily developed within a tablet environment; however, there is little research currently on the effectiveness of these types of strategies on data collection activities.
Incentives for the Three Prototype Designs
Each of the three prototype designs discussed in this chapter recommends the use of incentives. The type, amount, and placement of those incentives need to be researched and tested. The details proposed under each prototype give an overall sense of the likely size of the incentive and the need to incorporate incentives into the overall cost structures.
In developing the prototypes, three additional ideas surfaced and are included here to generate further discussion about potential motivation of respondents in the CE.
- Provide households with a financial profile, comparing their expenditures with other households in the same income bracket and demographics;
- Install a limited number of popular applications (for functional use or to play games) on the tablet as an “incentive” to respondents to familiarize themselves with and use the tablet more regularly; and
- Give the tablet to the household as the post-paid incentive at the end of the more intensive data collection panels.
Recommendation 6-7: A critical element of any CE redesign should be the use of incentives. The incentive structure should be developed, and tested, based on careful consideration of the form, value, and frequency of incentives. Serious consideration should be given to the use of differential incentives based on different levels of burden and/or differential response propensities.
Guidelines for Adopting Newer Technology and Incorporating External Data
The panel has proposed three prototype designs for the CE that make use of a tablet computer. Those prototypes do not include recommendations for use of any specific external datasets. However, the panel encourages BLS to explore other technology and administrative data sources as they move into the future. This section provides general guidelines on this topic.
It is important for the CE to pursue a research agenda that explores and adopts new technology and considers the utility of public and private administrative records. However, such an agenda requires discipline since neither technology nor administrative records ought to be pursued for their own sakes. It is important for the agenda to promote a strategic direction for continuous improvement, creating reductions in:
- Data collections and processing costs—respondents entering supported journal data via computer could reduce data collection and processing costs; similarly, the use of administrative data could reduce the amount of information that is needed from the respondent, further reducing data collection costs;
- Measurement error—reductions can be achieved by tailoring the technology to the user, whether the user is the respondent (completing a supported journal) or the interviewer (administering a questionnaire); coupling this with the collection of aggregated data (i.e., collecting less detail about purchases) will ease burden for both the interviewer and the respondent; and
- Statistical variance and complexity of the CPI estimate—the incorporation of administrative data in the CPI estimation process could in principle result in increased statistical precision and reduce data collection costs by requiring that fewer items be collected.
Two additional factors are important to be incorporated into an agenda that considers technology and administrative records for the CE. The first is robustness of technology. Releases of new technology (both hardware/firmware and software) have accelerated over the last decade, and this trend is expected to continue. Relatively old technology such as palm-pilot computers have been eclipsed by smart phones, and the speed and capabilities of smart phones are growing rapidly from year to year. And while laptops have found a place in society for over two decades, tablet-style computers (which are also relatively old technology but only about half as old as laptops) have begun enjoying a recent upsurge in development and use. These are but two examples of how quickly the landscape of technology is changing. The choices of equipment for CE data collection must be sensitive to such change. Because the pace of technological development is expected to continue to accelerate for the foreseeable future, the CE would not be served well by selecting a technology that would be unavailable or no longer supported by the time testing and piloting have been conducted. Instead, the CE needs to identify and test technology that is robust with respect to technological advancement.
The second factor lies in risks associated with the indeterminate availability of administrative data. While administrative data hold promise of creating great efficiency, their perpetual availability over time cannot be guaranteed. The biggest risk would be to identify a solution to the CPI that relies heavily on administrative (auxiliary) data, only to have that source of data become unavailable. There are real risks of this in the current volatile economic environment. Governmental budget cuts and/or private sector changes, such as business closings and release restrictions of sizeable magnitudes, are to be expected in the coming years. And societal change, including heightened concerns over privacy, could limit the availability of data that are currently accessible from other sources. There is also concern about potential liability risks for BLS to access and store individual financial data.
It is important for BLS to pursue the exploitation of administrative records. However, the panel believes that it would be problematic for BLS to convert irreversibly to full reliance on such solutions unless there is full confidence in the perpetual availability of those data. In the absence of such confidence, the prudent approach would be to maintain some level of primary data collection as a hedge against the risk of the loss of administrative records, as well as a checking mechanism to validate the quality of the administrative data.
The integration of technology and/or administrative records into the CE (and the CPI) is best accomplished as a natural part of continuous process improvement. A transition window of five to seven years could be utilized for new technology absorption into CE design and operations. Potentially advantageous technologies could be identified and prioritized on an annual basis, followed by a process of feasibility testing, assessment, planning, piloting, and adopting into CE operations. Such a process requires that the CE design maintain experimental panels integrated into the sample design specifically for the purpose of field-testing and evaluation.
Incorporating External Data
The panel developed recommendations regarding the use of extant administrative data for the CE. The potential use of external records or alternative data sources as a replacement or adjunct to current survey data for the CE is often raised in discussions of a CE redesign. Whether at the aggregate or the micro (respondent/household) level, the appeal of “readily available” information is that it appears, at first glance, simple to use. Although such information might hold great promise, we also realize that such use is accompanied by corresponding great risk, particularly from a cost/quality trade-off perspective. That said, there are scenarios under which these data could be quite useful, in particular as category-specific
quality assessment tools at the aggregate level and “memory joggers” at the household level.
Use of aggregate data. Aggregate retail data from scanner receipts can provide greater chronological and item detail, with potentially greater accuracy, than traditional data collection methods—offering opportunities for significant quality improvements for CPI budget shares and aggregate spending tables. The potential benefits include more data with less variance, as well as better data, leading to less bias. That said, use of aggregate data is not likely to yield sufficient coverage of all goods required by BLS; therefore, aggregate data cannot replace the current interview process in whole. Several areas need further exploration, including use of aggregate data in the CE process to (1) replace some of the detail (and hence burden) of the current CE interview process, (2) inform weighting controls, or (3) provide data quality checks for specific retail goods or sets of items (i.e., channels). Within specific channels or particular types of products, these data may be quite good and sufficient for weighting or assessment purposes. Retail data on item, price, and quantity could be obtained via two avenues: (1) directly from the retailers, with BLS serving as the data aggregator, or (2) via third-party companies that specialize in the aggregation of retail information.
Collection of these data by BLS directly from retailers has appeal in that the methods can be clear and well defined and the agency can exert direct control over the operation, ensuring suitable levels of quality and standardization. There are several downsides, however, to such an approach. First, it would require development of a considerable infrastructure, including retailer sampling, recruitment, regular data capture, considerable data cleaning/processing, and verification. The data requested from retailers would not be “plug-and-play” because retailers have their own (often unique) methods, units, formats, time frames, coding schemes, and standards of quality for the information they retain for business purposes. It is often the role of the data aggregator (in this case, BLS) to assume the responsibilities of translating collected data into a standardized useful form. The associated logistics and costs would likely be substantial. Undertaking such an endeavor not only would be expensive and time-consuming, but also would introduce an incremental data collection system with its own set of issues and problems, while not eliminating or even meaningfully reducing some of the current issues experienced with the CE survey approach.
Alternatively, several third-party vendors exist who specialize in the collection, cleaning, and distribution of retail information. These organizations could likely provide data on type, quantity, price, distribution channel, location, and other information at a far lower cost relative to that associated with BLS collecting the same data on its own. Unfortunately, these vendors vary considerably in the retail products and channels they
cover, as well as their geographic reach, methods for collecting information, and data completeness. Additionally, a number of potential problems can limit the utility of the data regardless of the vendor, including but not limited to:
- missing or inaccurate (often due to imputation) information;
- use of nonprobability samples, leaving in question the statistical properties of the data;
- questionable or undocumented collection and aggregation methodologies; and
- discrepancies between aggregated data and those collected by BLS, which can be attributed to a variety of sampling, collection, and aggregation differences.
An unexpected sudden change in methodology or wholesale cessation of data collection by the vendor could leave a critical gap in the CE estimation process.
Aggregate retail data are likely of best use for the CE, therefore, if information about specific products or channels is purchased from third-party vendors, not collected and aggregated directly by BLS. A thorough vetting process for such data before use is important so that the limitations of the data are well understood.
Use of alternative microdata. The previous section addressed administrative data sources from retailers. But microlevel data at the respondent level could play a role in reducing cost and/or increasing accuracy in the CES. New types of electronic data—financial records, budgeting software, store loyalty card information—may also be captured and utilized at the household or respondent level. Such data likely have the greatest utility in enhancing recall during the CE survey, but may also in some instances serve to replace survey elements, thereby reducing respondent burden, recall (measurement) error, and data collection costs.
These data may be used in one of two ways by the CE: (1) as memory cues, i.e., tools to aid respondents in their reporting of purchases that they may have otherwise forgotten and/or misreported; or (2) as data to be extracted and used in place of self-reported information.
As memory-jogging devices, microdata records could be printed or reviewed on a computer screen at the time the interview is conducted. Respondents would be encouraged to review their records to remind themselves of specifics of a purchase (date, place, item, and price). Utilizing records in this fashion would increase the time burden faced by respondents, but it could have a positive effect on data quality by reducing reporting error.
Extracting data directly from Internet banking, financial software, or loyalty card systems, on the other hand, generates a number of difficulties related to:
- permission from individuals to access their private records;
- accessibility if access is required through a third-party entity (such as a bank, credit card company, or loyalty card data repository);
- differential coverage because use of and access to such information is not universal and likely spread disproportionately within the population;
- process complexity by having to deal with multiple interfaces and backend data systems;
- data incompatibility when data elements from the source do not coincide with the categories and units required for the CE;
- incongruent reference periods that differ from CE requirements;
- data discrepancies, when internal illogical and/or missing microdata are encountered; and
- operational challenges with data extraction, cleaning, and verification. The extracted data would need to be processed along a separate path from the CE survey data, then integrated, leading to both time delays in reporting and additional infrastructure and resources.
Microdata from households or respondents may be of greatest utility to understanding the CE if these data are utilized as reminders and memory-jogging tools to enhance the survey process and reduce recall error. Some data elements may also be able to be gleaned from electronic sources and used to replace current survey items; however, this would introduce a significant new set of processes for the extraction, cleaning, verification, and integration of these data.
In sum, use of external data sources may be of some value in a redesigned CE process. The incremental benefits would need to be closely contrasted with the real costs of infrastructure, time, and resources required. If used in a targeted and judicious manner, both aggregate and microdata from such sources could be an effective means to improve overall data quality for the CE. With this section as context, the panel proffers the following suggestions and an overall recommendation (Recommendation 6-8):
- Identify from vendors and aggregate retail data sources appropriate for use in a five-year exploratory process that has key annual decision points based on experimentation and testing to establish the cost and measurement properties of adopting and incorporating the capture of such data in place of currently collected microdata items.
- Identify specific microdata items that could be obtained by consent from administrative records (e.g., mortgage records, bank statements, grocery store club cards) that could be incorporated as memory cues in the collection of retail purchase data, with a similar five-year adoption window (including associated annual decision milestones).
Recommendation 6-8: BLS should pursue a long-term research agenda that integrates new technology and administrative data sources as part of continuous process improvement. The introduction of these elements should create reductions in data collection and processing costs, measurement error, and/or the statistical variance and complexity of the CPI estimate. The agenda should address the robustness of new technology and a cost/quality/risk trade-off of using external data.
Updating Capabilities
The contextual landscape for conducting national surveys is changing at an increasingly rapid pace. Because of this, it is no longer possible for a survey to be conducted in the same way for decades or even for a single decade at a time. Successful survey vendors respond to this environment by building an adaptable staff with complex methodological and statistical skill sets, and by continuously investigating new sample designs, survey methods, and estimation strategies that anticipate future changes.
Updating Internal Staff Capabilities
In light of this reality, agencies that sponsor and conduct surveys, such as BLS, need to build and maintain flexible and capable organizations and staff. BLS has a very capable group of statisticians and researchers on staff. However, a substantial focus on staff skills and organizational function is required in order to effectively respond to these changes and maintain (or improve) the quality of survey data and estimates. Of particular importance is to facilitate ongoing development of novel survey and statistical methods, to build the capacity for more complex estimation strategies required for today’s best survey designs, and to build better bridges between researchers, operations staff, and experts in other organizations that face similar problems.
The panel offers the following suggestions, followed by Recommendation 6-9.
- Develop a proactive capacity to identify changes in the CE survey context and implement research into novel survey methods that address emerging conditions and behaviors in respondent populations.
The BLS organization and its staff must devote a greater share of resources to an active and responsive research program that focuses on emerging technologies and behavioral patterns, rather than today’s dominant survey modes. It is important to develop the capacity to study the effects of alternative methods within the context of the actual production survey, not only to evaluate which method is most effective, but also to be able to quantify the impact of a methodological change on key estimates from the survey.
For any project, the focus will be to contribute to the next generation of survey methods as they apply to BLS survey settings, rather than to pursue incremental changes from past methodologies. It is of paramount importance to conceptualize and evaluate methodologies in the context of total survey error and to quantify the impact of multiple sources of error (e.g., coverage, nonresponse, measurement, and processing errors).
To accomplish the above, BLS will have to hire new staff or train existing staff in a variety of areas. Several staff members will need to focus on identifying and acquiring administrative or commercial data to supplement data from the CE surveys. In the process, an evaluation of the quality and accuracy of the administrative records will need to be performed. Given that the CE redesign will involve both pilot and large-scale field tests, staff trained in experimental design will be needed to conduct and evaluate the results of this research. Both quantitative and qualitative methods must be used. The required quantitative skills are relatively well known, but the qualitative methods will go beyond conducting focus groups and cognitive testing. They include the ability to understand the effects of changes in methodology on survey operations and data collection personnel, such as how implementation of new procedures might differ across regional offices.
- Develop the ability to evaluate and implement more complex statistical methods for sampling, imputation, and model-assisted and model-based estimation to balance the demands of clients with minimizing survey burden and costs.
Given the complexity of BLS surveys and the way they will need to be altered to accommodate the current survey landscape, standard design-based estimators will not suffice. BLS statistical staff will need to develop more current methodological expertise for a range of modern statistical methods. For example, working knowledge is needed of imputation methods
that produce multiple values for planned or unplanned missing data from questionnaires, along with an understanding of how estimates and their standard errors can be generated by users. In addition, leveraging administrative and commercial data on expenditures will necessitate expertise in statistical methods for data linkage and integration. Estimation methods will require greater reliance on models and potentially the ability to create synthetic (fully imputed) datasets that can provide users with information to measure consumer behavior over time.
BLS staff must be hired or trained to carry out these activities. Knowledge of sampling techniques and weighting will not be enough. More expertise is needed in model-assisted and model-based estimation methods for sampling, imputation, estimation, data integration, and error modeling to generate data products, evaluate methodological research, and quantify error in estimates (including the impact of methodological changes).
- Develop a more fluid bridge between operations, research, and expertise in other organizations.
More flexibility will be gained if research and operations staffs have closer ties. Production staff can help think through the practical issues that might arise with a new method (e.g., what might work well, what problems could arise) and gain exposure to possible future changes in the survey well before they are called upon to implement them. Research staff may develop more effective experiments and gain an understanding of aspects of data collection they are not familiar with. However, it will be important for program staff and research staff to have the technical abilities necessary to communicate with one another. This means that the two staffs must have a basic understanding of what each will bring to the table for solving both the statistical and operational problems that are sure to arise in implementing any new CE survey design.
Other agencies have extensive expertise in areas that will be of interest to BLS as it redesigns the CES and other surveys. For example, the Census Bureau, which currently has responsibility for the CE data collection, has expertise in using administrative data to augment survey datasets and is devoting considerable energy to expanding its abilities in this area. Census staff have also conducted research in survey designs that administer partial questionnaires to each respondent. Joint research endeavors can be used to leverage expertise in these areas.
In addition, where institutional barriers prove detrimental to conducting responsive research, it may be wise to develop partnerships with survey vendors who are able to provide a quicker and more effective research service than is possible within BLS.
Recommendation 6-9: BLS should increase the size and capability of its research staff to be able to effectively respond to changes in the contextual landscape for conducting national surveys and maintain (or improve) the quality of survey data and estimates. Of particular importance is to facilitate ongoing development of novel survey and statistical methods, to build the capacity for newer model-assisted and model-based estimation strategies required for today’s more complex survey designs and nonsampling error problems, and to build better bridges between researchers, operations staff, and experts in other organizations that face similar problems.
Obtaining Necessary Expertise Through Others
The development of tablet-based applications requires technical expertise that is likely not available at BLS or the Census Bureau at present. Rather than take the time to develop that expertise in-house, the panel urges BLS to pursue outside expertise to speed up the development and evaluation of tablet-based applications. This will require detailed knowledge of the development environment (e.g., Android, Apple iOS) and familiarity with data collection tools such as those being envisioned for the CE. Access to design and usability expertise will also be critical for the successful development of such applications, which will likely require close collaboration with BLS subject-matter staff. But relying on in-house expertise to develop the apps would likely result in development delays and possibly suboptimal designs. If BLS decides to pursue the tablet path to redesign, developing requirements for such contract work and getting outside experts engaged as soon as possible will be critical to the success of the redesign.
Recommendation 6-10: BLS should seek to engage outside experts and organizations with experience in combining the development of tablet computer applications along with appropriate survey methods in developing such applications.
Targeted Research Needed for Successful Implementation of Design Elements
The panel views the CE redesign not as one major effort, but as an ongoing process to continually address changes in the population and in survey methods. However, it is important to set priorities for aspects of the design that need the most immediate attention to achieve basic change. The CE survey methods group at BLS has undertaken many important projects to better understand survey errors and identify design features that can help reduce these errors. The panel’s objective is to provide guidance on
important areas for further research and assist in their prioritization. Below, the pathways for further research are divided into those needed to inform improvements to the surveys and those needed to inform the general design that has been suggested.
Research Needed to Support the CE Redesign
The Bureau of Labor Statistics will need to conduct research to support and inform the redesign and its implementation. The panel recommends the use of tablet technology as an important new technology for collection of expenditure data, and there are numerous aspects of its implementation that require evaluation. The panel also recommends the collection of fewer, less detailed, expenditure categories in two of the prototypes, which requires evaluation of how this structure can be used to compute the CPI and how to best collect these data. The panel also recommends research on several other promising areas that may lead to further improvements of the survey to reduce burden and help obtain better quality data, presented in a separate subsection
This is by no means a comprehensive list of research areas, but an identification of several areas that need additional research, related to implementation of the proposed designs.
Use of a tablet device. All three of the proposed designs recommend the use of a tablet device. There are numerous potential benefits in using a tablet, yet they depend on how a device is selected and implemented. Even the overall advantage of a tablet over a paper instrument is an assertion that needs to be evaluated rather than taken for granted.
The highest priority research is an evaluation of the tablet technology. Criteria may include the utility, interface, robustness, data storage, transmission, and cost. Related to this is an evaluation of the optimum type of interface. The panel recommends one resembling the TurboTax model, which features separate modules that can be selected in any order and provides the respondent with an option to enter information directly into a form or to do so through a structured conversational guide. Other types of interfaces are possible, such as one that more closely aligns with a typical survey questionnaire or an interface that is more like an event history calendar. Conditional on a selected interface design, experimentation with different visual design elements that provide visually appealing and easy-to-understand features will also be beneficial. Whatever the interface design, it needs to have a self-evident navigation, as in mobile apps.
Experimentation with the structure of the instrument will also be needed. For example, the instrument can be modularized by type of expenditure (e.g., food, clothing), it can have a linear structure (e.g., reporting all
expenditures for the day), or offer both options. Each approach has unique advantages and disadvantages, yet an understanding of any measurement differences is needed first.
Experimentation will be needed in determining the best way for the technology to provide help in key entry of items. Possibilities include drop-down menus, automated “completion” of a word being entered, and other options. Experimentation is needed to develop prompts to encourage forgotten expenditures.
In addition to designing an intuitive interface, a critical aspect of the design of the application is to maintain respondent engagement and to effectively motivate respondents to report all expenditures. For example, since the respondents are provided with the tablet device, it is possible to include games and utilities that improve user engagement. The interface itself can use features of “gamification”—applying psychological and attitudinal factors underlying successful games to motivational strategies to improve user engagement, such as virtual badges, points, and status levels. Experiments will be needed in order to achieve a design that attains a high level of respondent engagement, which can in turn help to collect more accurate and complete data.
The choice of a tablet device, the design of the interface, and the addition of any motivation features are all prerequisites for the successful implementation of a tablet device to collect expenditure data. Yet there are fundamental questions about the cost feasibility and ubiquitous use of the tablet technology that need to be addressed. First among these questions is what proportion of the households (consumer units, or CUs) will have the motivation and ability to use a tablet, once an intuitive interface has been constructed. The answer to this question does not necessarily affect the use of a tablet device, but it can inform the overall design and resource allocation.
Several direct comparisons to the use of a paper-and-pencil instrument will be needed to determine the desirability of using a tablet device. Such a comparison will also allow for a better understanding of measurement differences between the two modes, as a likely final design will involve the use of both modes by different sample members. Comparisons between the two modes will be needed for both cost and quality outcomes, as a trade-off is likely. Finally, much of the objective in the CE redesign lies in reduction of respondent burden; the tablet and the paper-and-pencil administration need to be compared in terms of respondent burden.
How people keep financial records. A fruitful line of research may be to gain a better understanding of how different people and households keep financial and expenditure data. This could inform the methods used to collect the expenditure data and the design of the tablet interface, as well as
identify different subgroups for which the methods need to be different. For example, some households may have electronic records of nearly all expenditures, such as on credit card and bank account statements; others may keep paper receipts for expenditures; a third group may use a combination of methods; and yet a fourth group may not maintain sufficient records in any form. Among those who keep electronic records, some may even use specialized software that serves as a single repository of expenditure data, such as tax-related software packages.
Within a household, some may rely on a single person to be responsible for all expenditure records, while other households divide this responsibility by the type of expenditure or by the person who made the expenditure. These examples are certainly an oversimplification of what is invariably a complex and multifaceted recordkeeping phenomenon, but studies are needed to improve understanding of how households and individuals within those households keep expenditure records today.
Collecting data on a reduced set of 96 expenditure categories. Much of the burden in the CE surveys stems from the data requirements imposed on the surveys. It is imperative to conduct a study to investigate designs that minimize the number of questions and that reduce burden on respondents, in order to acquire accurate data. Both Design B and Design C require this research. The instrument can be reduced in a number of ways, but at a minimum, an evaluation is needed of the impact of collecting 96 categories of expenditures instead of the more detailed 211 expenditure categories now collected. A preliminary evaluation of the impact on the CPI, for example, can be conducted using extant data.
Use of incentives. The U.S. population has become more reluctant to participate in surveys (e.g., Groves and Couper, 1998; Stussman, Dahlhamer, and Simile, 2005), and incentives can help mitigate the effect on nonresponse. Key, however, is how incentives are incorporated into the survey design, if they are included. The panel did not venture to recommend a particular design, as this choice can only be informed through experimentation. Aspects that may warrant experimental manipulation include the structure (e.g., prepaid versus promised, household versus individual), timing (e.g., prior, during, or after completion of the supported journal), form (e.g., cash, and if cash, whether it is electronic transfer), criteria for payment (e.g., a certain level of supported journal completeness), amounts, and potential use of differential incentives (e.g., lower compliance groups, based on burden such as from the number of people in the household). More detail on this topic is covered earlier in this chapter under “Guidelines for the Use of Incentives.”
Instrument development. A substantial amount of research will be needed on the instrument development. For example, experiments are needed to (1) investigate the optimum period to ask households to keep a supported journal, (2) evaluate measurement error, nonresponse rates, and error, and (3) evaluate the stability of the estimates. Other important areas for study, especially pertinent to the proposed designs, are the optimum recall period for different types of expenditures and the optimum time between interviews.
All the proposed designs include a shift to greater reliance on self-reports, yet still involve interviewer administration to some degree. Thus, it would be beneficial to experiment with interviewer- and self-administration of different types of questions.
Privacy versus open access. Each household member can input his or her own expenses, but there is a design choice in whether to allow each respondent to see the expenditures from others in the household. The panel is recommending allowing all household members to view recorded expenditures of the household. Certainly, allowing such transparency in expenditures within the household can limit duplication of expenses, but raises a number of potential issues, ranging from potential problems related to unwanted disclosure of expenditures to other members of the household to intentional underreporting of expenditures due to the lack of privacy. Research is needed to compare providing household members with complete privacy (e.g., individual login for each member and no information sharing between accounts) versus being able to see and assess the completeness of total household expenditures.
Potential impact from reducing proxy reporting of expenditures. The use of proxy reporting invariably involves error trade-offs, which need to be evaluated. Understanding whether the additional measurement error overwhelms the reduction in nonresponse error compared to not using proxy reporting can inform the use or avoidance of proxy reporting in the redesigned survey. Schaeffer (2010) provided useful guidance to BLS for evaluating the use of proxy reporting, including separate comparisons by topic, reference period, and relationship to the sample member and the proxy respondent. As Mathiowetz (2010) pointed out, validation studies of the accuracy in reporting based on self versus proxy reports for objective measures are virtually nonexistent; further research on the CE is needed. A further complication in the direct comparison is cost; proxy reporting will likely reduce the data collection costs and will also need to be evaluated against the likely higher measurement error in the proxy reports. However, the designs proposed by the panel encourage multiple responders within the household with a minimum of additional cost.
Experiments with imputation methods and other statistical approaches. An important recommendation that is also reflected in all three alternative designs, and especially Design C, is a greater integration of statistical methods into the survey design. The designs vary along this dimension with increasing reliance on statistical methods, with two designs using subsamples with more intensive methods to calibrate the rest of the collected data to reduce measurement error and provide accurate estimates for detailed types of expenditures. At least two lines of research are needed to inform the proposed designs. All designs involve the collection of data for a small number of the weeks in a year. Weighting or imputation methods will be needed to garner annual expenditure estimates at the household level. Finally, whichever data need is addressed, different statistical methods will need to be evaluated.
Evaluation of the effectiveness of using more intensive methods. The proposed designs suggest the use of more intensive methods to improve the accuracy of the data collected on all sample members, or the use of more intensive methods on a subsample in statistical adjustments for measurement error. Whether such approaches are warranted and how they are implemented depend on the effectiveness of the more intensive methods to obtain more accurate data. The effectiveness of these methods, in turn, depends on what they entail. Therefore, experimentation is needed with different designs.
Additional Research
Although not necessitated by any of the proposed designs, several avenues for additional research can prove beneficial to the CE redesign, particularly in the long run.
Experiment with other technologies to record and extract data. Many technologies can be used to help record or extract available data on expenditures, such as scanners (including bar code scanners and receipt scanners), handheld devices and smart phones with cameras, and software that can facilitate importing of statements. These technologies are rapidly evolving and, therefore, involve the risk of being outdated in terms of hardware and software. Furthermore, the way expenditure data are stored is also changing, and a challenge for any of these technologies is to be relevant for the foreseeable future. Cautious investigation of technologies is recommended, but no single technology is likely to replace the collection of survey data.
Split questionnaire design. An area in which BLS has devoted considerable attention is the potential use of split questionnaire design—a form of matrix sampling of survey questions in which several distinct forms of the
survey are constructed (thus modules are sampled, rather than questions) and respondents randomly (although not necessarily with equal probability) assigned to one survey form.
Evaluate the utility and the ability to obtain data from additional sources. Attempts can be made to retrieve expenditure data either from other sources or directly from records that the respondents have retained. These may include credit card/bank account statements, utility statements, pay stubs, and tax records. Some guidance may be obtained from other surveys such as the Residential Energy Consumption Survey (RECS) in how to obtain permission to access these records. Most of this evaluation, however, may need to be tailored to the CE.
Augment sample with wealthy households. The wealthiest households tend to be nonrespondents at a higher rate, causing substantial problems for some uses of the CE data. A potential remedy is to augment the CE with additional samples of wealthy households, such as based on IRS records or income data linked to small geographic areas. BLS has possibilities to link the CE sample of households to existing administrative data sources, such as IRS records, that can provide some better information about nonrespondents. Design C has a base survey that would easily facilitate the selection of additional higher income households in its follow-on components.
Identify and evaluate sources of auxiliary data (e.g., retailer data). Replacement of some CE data with data from other sources, such as retailer data or data from other surveys such as the RECS, is a risky expectation, but certain survey or diary data elements may be replaced or augmented using other sources of data. More likely uses of auxiliary data, due to the different error properties and reasons for their collection, are as benchmarks that can help evaluate the CE estimates and changes in the CE estimates, and to aid in sampling, post-survey adjustments, and estimation. One example would be to leverage auxiliary data (such as income) obtainable on sampled households from the Census Bureau to estimate nonresponse bias and improve nonresponse adjustments. A broad range of auxiliary data can be considered, such as IRS data, for a multitude of uses. Permission may be needed from a household to access these data, and research could explore “opt-out” permission (rather than “opt-in”) for the CE surveys, which would allow access to a household’s data unless they receive a “no access” notification. Research by Pascale (2011) and Singer, Bates, and Hoewyk (2011) on the use of administrative records in other contexts provides useful background for conducting such research. Furthermore, these data sources change over time, and investigation of such sources needs to be ongoing rather than at one point in time.
Research Specific to a Single Prototype
These topics were listed earlier in the chapter under the descriptions of the panel’s three prototypes, but are repeated here so that research needs are together in one place in this report.
Design A—Detailed Expenditures Through Self Administration:
- Develop models that would estimate quarterly and annual expenditures and income at the household level from the four weeks of reported detailed data plus the data reported on larger and routine expenditures.
Design B—A Comprehensive Picture of Expenditures and Income:
- Investigate the assumption that a “bounding” interview is unnecessary to avoid telescoping and other issues.
- Investigate the accuracy and completeness of aggregated expenditures for periods up to six months and for estimates of averages (i.e., average monthly spending for gasoline) used in this prototype to construct a full set of microdata for the entire six-month period.
- Develop appropriate models to “disaggregate” aggregated expenses using data from the one-week supported journal.
- Develop methodology for a successful component that will use an intensive interview and process based on prior collation of records and financial software to achieve a budget balance for the year at the household level as described below. Extend existing research done by Fricker, Kopp, and To (2011) to fully evaluate its potential and limitations.
Design C—Dividing Tasks Among Multiple Integrated Samples:
- Research and develop models for estimation using the base survey and two waves of data collection.
- Research and develop models for imputing at the household level “smaller expense items” collected on the detailed expenditure component and not on the household profile component into the household-level dataset to complete the overall household expense profile.
Recommendation 6-11: BLS should engage in a program of targeted research on the topics listed in this report that will inform the specific redesign of the CE.
The redesign of the CE is not a static operation, and the panel anticipates a long-term need for BLS to continue to propose, test, and evaluate new data collection methods and technologies. Thus the panel recommends that BLS maintain a methods panel to allow such testing into the future.
Recommendation 6-12: BLS should fund a “methods panel” (a sample of at least 500 households) as part of the CE base, which can be used for continued testing of methods and technologies. Thus the CE would never again be in the position of maintaining a static design with evidence of decreasing quality for 40 years.
The current CE design has been in place since the late 1970s, and change is needed. The uses of the CE have grown over that time, and the current program tries to meet the needs of many users. The result is that the current surveys create an undesirable level of burden, and the data suffer from a number of quality issues. The panel believes that change should begin with BLS prioritizing the breadth and detail of data currently supporting the many uses of the CE so that a new design can most efficiently and effectively target those priorities.
The panel offers three prototype designs, each of which meets the basic requirements presented in Consumer Expenditure Survey (CE) Data Requirements (Henderson et al., 2011). A given prototype may be a better fit than others, depending on the revised objectives of the CE. The prototypes have considerable comparability as well. They all are designed to promote an increased use of records. They all incorporate self-administration (supported from the field representative, a tablet computer, and a centralized support facility) as a mode of data collection. They all use incentives to motivate respondents.
This report provides guidance to BLS in the next steps toward redesign. It recommends that BLS produce a roadmap for redesign within six months. The report provides guidance on how to incorporate new technology, particularly the tablet computer. The redesigned CE will still be a difficult survey for respondents, and the panel recommends developing an effective program of incentives to enhance motivation. It provides guidance in doing so.
The panel understands that a redesign of the CE will require significant targeted research to develop specific procedures that are workable and most effective. The report provides an outline of the research that is needed and the panel’s suggestions on the priority of those research endeavors. The panel recommends that BLS enhance the size and capability of its in-house research program in order to carry out the targeted research but also to
meet additional challenges in future years. Finally, the panel recommends that BLS reach out to other organizations for assistance in implementing the tablet-based data collection system and the apps that will make it work smoothly.
The panel has great confidence that BLS, with its dedicated and knowledgeable staff, will be able to move forward successfully toward a new CE. We trust that this report has helped in that process. It has been a challenging opportunity to consider these issues and make recommendations.


