
4
Examining Social and Ecological Costs and Benefits
Although the main focus of the workshop was on health and environmental costs, Anne Haddix stated in her introductory remarks that examining one outcome in isolation is practically impossible. The food system is inordinately complex, with multiple and intersecting inputs and outputs, costs and benefits, and units of analysis. Several speakers were invited to share their thoughts on some of the broader social and ecological costs and benefits of the food system. This chapter summarizes their presentations.
Scott Swinton, professor and associate chair in the Department of Agricultural, Food, and Resource Economics at Michigan State University, discussed the ecological costs and benefits of food production using an “ecosystem services” concept and framework that was developed as part of a United Nations multiyear study on the consequences of ecosystem change for human well-being. He also explored the challenges of valuing nonmarket ecological costs and benefits. Key among those challenges is that ecological costs and benefits are highly variable across place and time.
Steven Wing, professor of epidemiology at the University of North Carolina at Chapel Hill, urged workshop participants to think not just about cost, but cost to whom. In his opinion, many of the animal production costs discussed during the workshop are related to health inequalities. He reflected on how communities where concentrated animal feeding operations (CAFOs) are located—and the individuals who live in those communities—pay a disproportionate amount of the external cost for animal production in loss of health and quality of life (Donham et al., 2007; Horton et al., 2009; Lipscomb et al., 2005, 2007a,c, 2008; Mirabelli et al.,
2006; Schinasi et al., 2011; Tajik et al., 2008; Wing and Wolf, 2000; Wing et al., 2008). He commented on how animal consumption costs are related to health inequalities as well, with people who live in low-income areas having limited food choices.
Ricardo Salvador, director and senior scientist in the Food and Environment Program at the Union of Concerned Scientists, expanded on the theme of food choice. He discussed dynamics among poverty, food insecurity, and health and made the case that health is partly a reflection of one’s environment and that not everyone has access to the same food choices. He argued that accessibility to food is a social issue, not just an economic issue, and therefore that using an economic model as a framework for studying the cost of food limits what can be detected.
Finally, Jayson Lusk, professor and Willard Sparks Endowed Chair in the Department of Agricultural Economics at Oklahoma State University, described the costs and benefits of animal welfare legislation and methods used to value those costs and benefits. He emphasized the importance of trade-offs when analyzing the cost of food. With respect to animal welfare, the question is not the well-being of animals; the question is, what do we have to give up to attain that benefit?
AGRICULTURAL ECOSYSTEM SERVICES AND THE COSTS OF FOOD PRODUCTION1
Food production systems can be thought of as agricultural ecosystems that are managed to provide food. In other words, according to a framework laid out in the Millennium Ecosystem Assessment (MA),2 food production systems yield what are known as “provisioning” ecosystem services. Food production systems also generate a suite of other, nonprovisioning ecosystem services (e.g., some farms provide aesthetic services, others provide fiber and bioenergy); they also rely on various ecosystem services (i.e., services that allow crops to grow, soil to form, etc.) (Swinton et al., 2007). Of course, not all ecosystem inflows and outflows are desirable. Ecosystems also produce costs. For example, food production can
_________________
1 This section summarizes the presentation of Scott M. Swinton.
2 Called for by the United Nations Secretary-General Kofi Annan in 2000, the MA assessed the consequences of ecosystem change for human well-being and the scientific basis for action needed to enhance the conservation and sustainable use of those systems and their contribution to human well-being. Results of the assessment were published in a series of reports in 2005. The MA defined four basic types of ecosystem services: provisioning (i.e., provision of food, fiber, fuel), regulating (i.e., regulation of climate, water, and habitat), supporting (i.e., support of other ecosystem services through soil formation, nutrient cycling, primary productivity, etc.), and cultural (i.e., aesthetic, recreation, scientific knowledge, and other cultural services). For more information, visit http://www.maweb.org/en/Index.aspx.
negatively impact water (i.e., water pollution), health (i.e., increased health risks from hormones, agrochemicals, antibiotics), climate change (i.e., from greenhouse gas [GHG] emissions), habitat of desirable species (i.e., habitat loss), and aesthetics. Plus, food production itself can be negatively impacted by pests, disease, and other detrimental factors that reduce productivity or increase production costs (also referred to as ecosystem disservices). Swinton discussed methods for valuing ecosystem services and disservices associated with food production systems; and the challenges of nonmarket valuation (i.e., intrinsic value; see Box 4-1).
Nonmarket Valuation of Ecosystem Services and Disservices
Another way to think about a food production system, or an agricultural ecosystem more broadly, is as a transformation process, with both synthetic and ecosystem inputs feeding into the process and food and ecosystem outputs coming out the other end. External costs can accrue on either the input or output side. For example, costs occur on the input side when natural capital is depleted (i.e., the natural capital that is necessary for enabling the provisioning ecosystem services provided by animal production), such as overgrazing of rangeland. Costs occur on the output side when natural capital is contaminated, such as water pollution from animal feeding operations. Because markets are often absent from this transformation process, valuing these costs is challenging.
Attaching dollar values to ecosystem services linked to food production involves, first, measuring changes in quantity (i.e., measuring the baseline production process and then measuring changes associated with each alternative feasible process), and second, associating values with those changes. Estimating those values involves examining both the supply and demand sides. On the demand side, what would people who do not have something be willing to pay in order to get more of it? That is, what is the willingness to pay (WTP) for a change in ecosystem service? On the supply side, what
BOX 4-1
Economic Versus Intrinsic Value
Swinton emphasized that economic values resulting from the relation between supply and demand are not the same as intrinsic values. In his book Nature and the Marketplace, Geoffrey Heal (2000) uses water and diamonds to explain the difference. Water, which is essential to human life, has low economic value but high intrinsic value. On the other hand, diamonds, which are not essential to human life, have low intrinsic value but high economic value.
are suppliers willing to accept in order to change something? That is, what is the willingness to accept for a change in a production cost (e.g., reduction in profitability) associated with a modified practice?
Nonmarket valuation methods attempt to simulate supply and demand where markets do not actually exist. Without going into detail, Swinton said, many different nonmarket valuation methodologies are used, most of which are cost-based (cost of remediation, factor substitution, production function, travel cost/cost of illness), although some are based on stated preference (contingent valuation/ranking) (Freeman, 2003; MA, 2003). The methods are based on a core set of principles adapted from Bockstael et al. (2000) and Pearce (1998): (1) marginal changes from a baseline occur within a range that can be observed; (2) budget constraints limit the choices that can be made; and (3) decision makers select the best alternative, even if that alternative is very different from the original choice.
Challenges to Nonmarket Valuation
Nonmarket valuation is complicated by several factors. First, the same ecosystem service can have both external and internal effects, or costs. For example, erosion control can have effects off-farm, such as waterway and reservoir siltation, that occur unwillingly and without the involvement of others. Those are external costs. Erosion control can also have an internal cost if the farmer makes an erosion control management decision aimed at improving crop yield. Second, ecosystem services are experienced at varying scales. For example, erosion control off-farm is experienced at a watershed scale, whereas erosion control on-farm is experience at the farm scale. As another example, climate regulation services are experienced at a global scale, but pollination and genetic diversity services (e.g., pest control) are experienced at local or regional levels. Third, ecosystem services are often bundled together on the supply side through a production system, yet consumers experience those services individually. For example, consumers may experience improved drinking water (an individual event) that occurred as a combination of several agricultural practices and environmental changes (see Figure 4-1). So there is often a big gulf between valuation on the production side and what people experience on the consumer side. Changing one ecosystem service may require changing the entire production process, causing a whole set of intermediate environmental changes (e.g., reducing nitrogen fertilizer use in order to cut GHG emissions from nitrous oxide also reduces nitrate leaching). The consumers experience those changes differently (e.g., they experience less fertilizer input as improved drinking water quality) (Chen, 2010). Fourth, the value of ecosystem services varies across time and space, because supply and demand vary across time and space. This variation makes it very difficult to estimate values for widely
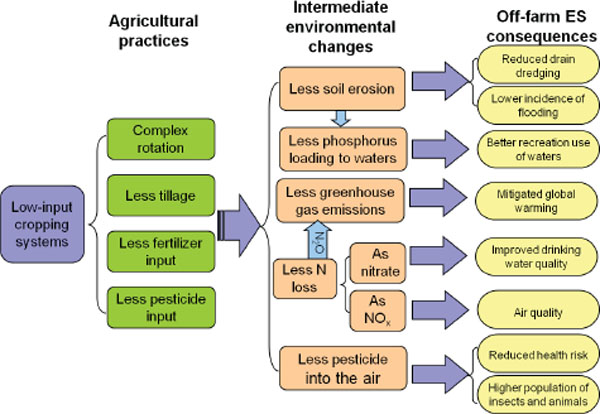
FIGURE 4-1 A schematic showing how farming practice changes link to environmental changes leading to outcomes experienced by consumers.
NOTE: ES = ecosystem services, N2O = nitrous oxide, NOx = nitrogen oxides.
SOURCE: Chen, 2010.
marketed foods. Finally, because ecosystem services vary in different settings and with different practices, they have to be measured separately in all of those different situations. That can be costly. While simulation models can help with some measurements, their validity has been tested only for a select range of applications.
IMPACT OF THE FOOD SYSTEM ON HEALTH INEQUALITIES3
“I think throughout this workshop, we should be saying not just ‘cost’ generically, but ‘cost to whom,’” said Steve Wing. In Wing’s opinion, many external costs to the food system are strongly related to health inequalities, which he defined as differences in morbidity, mortality, or health and well-being among people within a population or between populations. Wing described the various types of health inequalities that have been associated mostly with animal production, but also animal consumption; he argued that many external health costs associated with animal production are related to independence of the communities where CAFOs are located.
_________________
3 This section summarizes the presentation of Steve Wing.
Health inequalities are often discussed within the context of racial groups that have experienced systematic institutional discrimination. According to Wing, health inequalities are persistent around the world and have been observed and quantified for centuries. In the United States, some health inequalities existed before the current industrial agricultural system existed and are therefore obviously not dependent on that system. However, in Wing’s opinion, those inequalities are maintained in part by how the current food system operates. Many health inequalities related to food production stem from the fact that CAFOs tend to be located in low-income rural areas with disproportionate numbers of people of color who have experienced discrimination and already have poor health conditions for other reasons, including poverty.
Health Inequalities Associated with Animal Production
Wing identified three categories of health inequalities related to food production: (1) occupational or environmental health inequalities (i.e., the health and well-being of individuals); (2) built environment inequalities (i.e., aspects of the community that affect its functioning and the ability of a community to promote individual health and well-being); and (3) sociopolitical impact inequalities. Although he viewed the issue as mostly a rural (versus urban) issue now, he said it will increasingly become a global issue in the future. The CAFO production system is expanding globally and in places where communities may have even less capacity to push back against the negative impacts.
Occupational Health Inequalities
Occupational health inequalities arise from unsafe working conditions, low wages, and lack of supportive medical services (Lipscomb et al., 2005, 2006). Wing explained that many workers do not have access to medical services that are independent of the employer and often experience an unwillingness from employer-provided medical service personnel to assign a cause of injury or other medical condition to the working conditions because of implications for insurance and liability. Occupational health inequalities in the food system come from acute injuries, repetitive motion injuries, dermatological and respiratory conditions, psychosocial stress, infectious diseases, and other outcomes of exposures that occur in agriculture and food processing (Donham et al., 2000; Lipscomb et al., 2007a,b,c, 2008).
Contaminants that affect workers are also found in nearby communities. According to Wing, production-related pollutants (e.g., particulate matter, hydrogen sulfide) are present in neighborhoods located near
CAFOs and they are correlated with respiratory symptoms and lung function (Schinasi et al., 2011; Wing and Wolf, 2000), as well as quality of life, well-being, and mental health (Horton et al., 2009; Tajik et al., 2008; Wing and Wolf, 2000; Wing et al., 2008). Infectious diseases are another environmental health issue, due to water- and airborne pathogens. Furthermore, CAFO workers may serve as conduits for microbes—and antimicrobial resistance—to travel between the animal and human populations (Graham et al., 2008; Silbergeld et al., 2008). Wing said “good evidence” shows that workers act as conduits for the influenza virus to travel between animal and human populations (Gray and Baker, 2007; Gray et al., 2007; van Cleef et al., 2010). While human influenza pandemics emerging from animal populations are rare events, they have the potential to create extreme disruption and cost, not just to the animal industry but to the economy as a whole.
Built Environment Inequalities
Built environment inequalities relate mostly to housing value and well-being. For example, housing values may be impacted by the presence of offensive odors and the inability of residents to use their property (e.g., to garden, to recreate outside, to have family members visit). Not only do these effects impact the well-being of people who already live in the area, but they also make the built environment a less attractive place for others to live and discourage health-promoting and other community-building activity.
Sociopolitical Inequalities
Wing explained his view that sociopolitical inequalities are a consequence of animal production profits not being shared by local communities, which affects the ability of communities to promote their own health and well-being. Wing argued that many of the external costs of animal production are related to independence among the rural communities where CAFOs tend to be located. That is, a rural community does not always have self-determination to make its own decisions about land use, housing, and other community activities.
Health Inequalities Associated with Animal Consumption
Health inequalities are not just an animal production issue. They are also an animal consumption issue. Wing noted that many people who live in low-income areas have limited food choices, with some animal-based products being marketed to low-income people that are not being consumed by high-income people (see also the next section on accessibility to
food). So while there are increasingly healthy, high-end foods on the market that are being produced in ways, for example, that reduce the potential growth of antibiotic-resistant bacteria, those foods are available only to people who can pay high prices for them. The remainder of the population does not have that choice. “I think we should be talking about the bifurcation of the food system,” Wing said.
Accessibility to food is a social issue, claimed Ricardo Salvador. He described food insecurity on a global, national, and local (Washington, DC) level; explored the relationships among food insecurity, poverty, and health outcomes; and made the case that using economic analysis as a framework for addressing the full cost of food does not deal with the fundamental underlying issue of food accessibility.5
Food Insecurity
Consider food insecurity on a very macro scale, that is, a global scale, where 12.5 percent (870 million people) of the world population goes hungry. Then consider that the proportion of U.S. residents who are food insecure is greater than the global average, with 15.7 percent (48.8 million) in the United States going hungry. Then consider that, within Washington, DC, itself, the food insecurity rate is 13 percent (84,000 persons). Salvador noted there were six full-service, sit-down restaurants on the same block where the workshop was being held and another nine on contiguous blocks. “For those of us sitting here,” he said, when we think about food, our thoughts tend to focus on time (e.g., “How much time do we have to eat?”) and choice (e.g., “Do we want Thai or Mexican or … ?”), with the power of our income making food resources flow to us wherever we happen to be. “But that is not the reality for everyone on this planet,” he said. People who are food insecure do not have that same power.
For example, a Washington, DC, map of all 34 full-service grocery stores (24 national chains dominated by Safeway, but also Giant, Whole Foods, and Trader Joe’s, plus another 10 regional stores), shows that more than half are in the wealthiest part of the district, the Northwest section, and few are in what is primarily an African American area with a very high poverty rate (i.e., Wards 7 and 8). Salvador stated that the lack of full-service grocery stores in Wards 7 and 8 is not a function of the owners of
_________________
4 This section summarizes the presentation of Ricardo J. Salvador.
5 Salvador noted that although access to food can be categorized as either physical or economic, physical access is a subset of economic access.
those stores failing to notice that there is a population living on the east side of the Anacostia River. Rather, it is a function of the owners recognizing the lack of purchasing power in that population. People living in Wards 7 and 8 do not earn enough income to make it worthwhile for the owners to provide them with the same food system that serves “those of us sitting here.”
During the past several decades, Americans’ share of disposable personal income spent on food has decreased, from about 24 percent in 1930 to about 9.47 percent in 2010, based on U.S. Department of Agriculture data. The implication of this trend, Salvador observed, is that vast increases in productivity and efficiency have created a “very cheap” food supply. He pointed out, however, that the 9.47 percent figure is a ratio, with a numerator and a denominator. At least part of the decreasing trend in share of disposable income spent on food is a function of an increasing denominator and the fact that the average American income has increased tremendously over the past several decades. The absolute cost of food remains high. For those living in poverty, a much higher percentage of income is therefore spent on food. In a comparison across countries with variable average total household expenditures (e.g., $32,051 in the United States and $21,788 in the United Kingdom, compared to $620 in India and $541 in Kenya), the percentage of average total household expenditures spent on food increases as average household expenditures decrease (e.g., 6 percent in the United States and 9 percent in the United Kingdom, compared to 35 percent in India and 45 percent in Kenya).
The fact that food is not “very cheap” for people living in poverty has implications for food insecurity, Salvador implied. In the United States, a map of the percentage of people living in poverty areas overlays fairly well with a map of the percentage of households that are food insecure. For example, Mississippi is among those states with the highest percentage of its population living in poverty (i.e., 30 percent or more). It also has among the highest average rates of food insecurity.
In addition to food security implications, the fact that food is not very cheap for people living in poverty also has implications for health. Not only do U.S. poverty and food insecurity maps overlay, but both maps also overlay a map of adult obesity rates in the United States. This is because limited access to food limits the options available and the choices one can make. “The choices … are not going to be optimal,” Salvador said. This is especially true for children who are too young to make any conscious choices at all. Salvador showed a photograph of two obese children eating a meal at McDonald’s and observed, “They are simply a reflection of the food system that has been built up around them.”
Obesity rates are increasing among wealthier Americans as well, according to Salvador. As with lower income Americans, wealthier Americans also reflect the food environment around them and the choices they
can make. In that sense, Salvador suggested that merchants compete for their patronage by blending salt, sugar, and fat into textures and flavorings that make people want to eat at their restaurants. Extrapolated over one’s lifetime, the negative health effects of eating those combinations of salt, sugar, and fat accumulate. Self-reported data from both Americans and Canadians show that obesity rates increase as age increases, until about the mid-60s, and that obesity rates for all age groups has increased during the past several decades. “These are consequences of actual access to food,” Salvador said.
Implications of Food Insecurity for a Study on the Cost of Food
Salvador cautioned that the dominant global industrial food system that serves the wealthy excludes the reality of people who do not have access to that system. Discussions of the “hidden” costs of this food system, including the health and environmental impacts, excludes the reality of folks who do not participate in the system or who experience it in what Salvador described as “totally different ways.” He said, “I think the economic analysis that we have been discussing predominantly over the last day necessarily has to inform what it is that we do when we talk about the actual price of food. But I also want to make the case that it is a constrained window into the broader issue that we need to be aware of in order to really do justice to the topic.”
A Novel Approach to Addressing Lack of Access to Food
Salvador mentioned several programs and incentives that have attempted to address lack of access to food caused by poverty. Some of these programs and incentives have been publicly funded, others implemented through public-private partnerships. They include the Supplemental Nutrition Assistance Program (SNAP); School Breakfast Program (SBP); National School Lunch Program (NSLP); Special Supplemental Nutrition Program for Women, Infants, and Children (WIC) program; Farmers’ Market Promotion Program (FMPP); EBT (Electronic Benefits Transfer)/SNAP redemptions at farmer’s markets; Healthy Corner Stores Network (HCSN); fresh food financing; and food hubs.
Rather than creating systems such as these that provide ways for the poor to access the food system when hunger has become a reality, Salvador suggested shifting the food system so it can be accessed to prevent hunger and metabolic diseases from occurring. As an example of how this might be done, he mentioned healthy local food system models that acknowledge not only the key economic functions of a food system (e.g., production, processing, distribution, consumption) but also the values and social parameters
that define how the food system functions (e.g., fairness, economic balance [i.e., all citizens have easy access to a variety of foods], sustainability, transparency, health promotion).
Animal agriculture has gone through many changes in the past 30-40 years, resulting in about a doubling of meat production per sow—from about 2,000 pounds of pork per breeding sow in 1983, to nearly 4,000 in 2007. As a consequence of increased productivity, pork prices dropped 44 percent between 1973 and 2007. Beef and chicken prices dropped by 36 and 61 percent, respectively, over the same time period. But with these benefits come some concerns about the living conditions of the animals in the new meat production systems. Jayson Lusk discussed recently implemented animal welfare regulations; the potential costs and benefits of such regulations; and how to measure and value animal welfare.
Animal Welfare Legislation
Many animal welfare regulations are state level, mostly state ballot initiatives and, in some cases, state legislation. For example, several states have banned gestation crates7 or battery cages8 in agricultural production, including three of the top egg-producing states (California, Michigan, Ohio). According to Lusk, the increasing number of states that have banned battery cages has created a demand for more uniform, national legislation, with United Egg Producers and the Humane Society of the United States agreeing to push for a new national standard. In Lusk’s opinion, a similar national push has yet to be observed in the pork industry because only one of the top pork-producing states, Ohio, has been affected by state-level animal welfare legislation (Corbin et al., 2012).
The Costs of Animal Welfare Regulation
Lusk identified several costs of animal welfare regulation to both producers and consumers. For example, a nationwide ban on battery cages would cost producers an estimated $187 million per year and a nationwide ban on gestation crates an estimated $258 million per year. The costs include the capital costs of switching from one system to another. For consumers, a battery cage ban would cost an estimated $1.8 billion per year as
_________________
6 This section summarizes the presentation of Jayson Lusk.
7 A sow stall used in pig farming.
8 A cage used for egg-laying hens.
a result of a projected 21.18 percent price increase. A gestation crate ban would cost consumers an estimated $738 million per year as a result of a projected 1.72 percent price increase. Lusk speculated that price increases for eggs or pork would likely have a greater impact on poorer consumers. Just as previous speakers highlighted various inequalities, Lusk stressed concern about the burden on the poor if the cost of food is increased (i.e., the regressive nature of food taxation that attempts to curb food externalities). In addition to price changes, he identified less choice as another consumer cost. Right now, consumers have several egg options (e.g., cage-free eggs, organic eggs, omega-3 eggs). Changing the production process would remove some of the cheaper options. Another potential consumer cost is the likelihood of food shortages immediately after a ban, such as what occurred in the European Union following their ban on battery cages. The specific cost impact of such a ban may depend on the alternatives that remain after the ban has been enacted (i.e., a ban on all cages would have a different cost than a ban on a specific type of cage only).
In addition to producer and consumer costs, animal welfare legislation has environmental costs. According to Lusk, research indicates a somewhat lower feed efficiency in cage-free systems because animals exert more energy when they walk around, dust-bathe, etc. Additionally, often more land is required to produce the same volume of meat or eggs, which would increase the cost associated with the use of that land. While bans typically result in fewer animals being raised, Lusk said it is likely that both feed and land would increase on net.
Finally, in Lusk’s opinion, there could even be a cost to some animals if a cost could be attached to an animal that would otherwise be brought into existence if not brought into existence because of a ban.
Benefits of Animal Welfare Regulation
Lusk identified several potential benefits to consumers and animals. For consumers, animal welfare legislation could fix an “information problem,” that is, it could provide consumers with more knowledge about production conditions and would probably impact their purchasing choices among meat and egg products. Another potential benefit is the gain for individuals who do not approve of meat production and are impacted by other people’s consumption choices.
The largest benefit of animal welfare legislation, in Lusk’s opinion, is to the animals themselves. Most models indicate that animals experience a higher level of animal welfare in cage-free systems and exhibit more natural behaviors such as dust-bathing, flying on perches, and rooting. While there seems to be increased mortality in cage-free systems, there is controversy
over how to value differences in mortality rates among different types of systems.
Measuring Animal Welfare
There are many models for measuring animal welfare. Lusk mentioned two: the SOWEL model (SOw WELfare; Bracke et al., 2002a,b) and the FOWEL model (FOwl WELfare; De Mol et al., 2006). Both models consider all the inputs (e.g., space, stocking density, feed, water), weight those inputs according to their relative importance with respect to affecting animal behavior, and then calculate and rank animal welfare scores. For example, Bracke et al. (2002a,b) used the SOWEL model to score and rank different pork production housing systems and reported that the individual stall system, which is the primary system used in the United States, ranks relatively low compared to the family pen and other systems. In Lusk’s opinion, that does not mean that the U.S. pork industry should switch to the family pen or one of those other systems. There would be costs to doing so. But according to these models, the animals would be more comfortable in those other systems.
Valuing Animal Welfare
Lusk asked, “Can we value animal welfare?” He thinks the answer is “yes.” The question is, how? One way is to examine actual cost differences (Figure 4-2). For example, scanner data on average egg prices in the
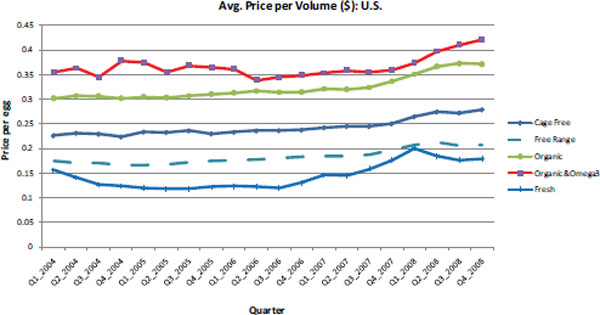
FIGURE 4-2 Cost differences across different types of eggs from 2004 to 2008.
SOURCE: Retail scanner data, IRI.
United States over a 4-year period show that, on average, organic eggs are about twice as expensive as “conventional” eggs. The higher price can be interpreted in two ways. Either it is costly to produce organic eggs, or people prefer organic eggs. Scanner data showing what people actually buy indicate that the market share for organic and other “specialty” eggs (e.g., cage free and organic, natural) increased over the same 4-year period, and the sum of all types of “specialty” eggs adds up to less than 5 percent of the market share. That very small market share suggests that most people are not willing to pay high prices for organic eggs (Figure 4-3).
A second way to value animal welfare is to conduct surveys and experiments. Most research suggests that consumers are willing to pay more for products produced in a certain way when they are informed of different production practices. However, it is unclear whether WTP for higher levels of animal welfare exceeds the cost of production.
In Lusk’s opinion, much of the value that people derive from animal welfare is a personal value. With respect to public policy, the question is, Do these personal values impose externalities? It is not clear whether WTP for greater animal welfare reduces external costs to other humans. A more compelling case, Lusk said, is that WTP for greater animal welfare reduces the external costs for the animals themselves. After all, they are the ones who suffer. Lusk referred workshop participants to a recent paper for a
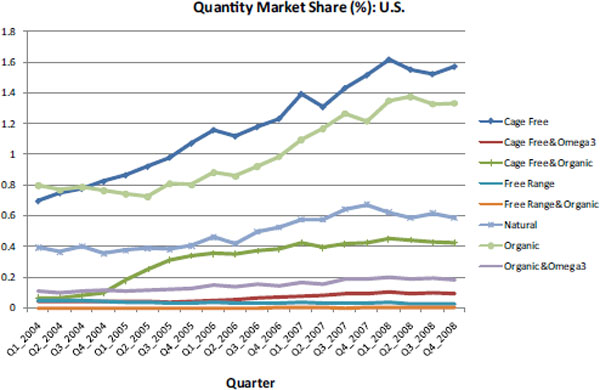
FIGURE 4-3 The percent market share of consumer egg purchases.
NOTE: The sum of all types is less than 5 percent.
SOURCE: Retail scanner data, IRI.
discussion of markets that allow for the buying and selling of improvements in animal welfare (Lusk, 2011).
The Importance of Trade-Offs
“Energy is indeed a scarce and valuable resource, but it is only one of many, and there is a good deal more to life than British thermal units.”
—Robert Dorfman (1977)
Lusk concluded by emphasizing the importance of keeping trade-offs in mind. The question, he said, is not the well-being of animals. The question is, what do we have to give up to get that benefit? For example, cages and other technological developments (e.g., feed additives) might decrease animal welfare, but they also improve some environmental outcomes. Beef cattle arguably experience the highest levels of animal welfare of any animal sources, yet beef production generates the largest negative environmental consequences (e.g., with respect to CO2 emissions). Reducing CO2 emissions would require a shift toward a system with greater animal welfare costs.
Another trade-off to consider, in Lusk’s opinion, is that “meat tastes good.” The costs associated with animal production reveal nothing about “how happy we are about that pound of meat we consumed.” Of greater interest to Lusk than the amount of energy required to produce a pound of meat is the marginal utility or “the extra happiness” derived from that one unit of energy consumption. He said, “To me, those are the questions I think that are really fundamental…. It is not the fact that we use energy, it is what do we get out of the energy we use?”
Bockstael, N., A. Freeman, R. Kopp, P. Portney, and V. K. Smith. 2000. On valuing nature. Journal of Environmental Science and Technology 34(8):1384-1389.
Bracke, M. B. M., B. M. Spruijt, J. H. M. Metz, and W. G. P. Schouten. 2002a. Decision support system for overall welfare assessment in pregnant sows. A: Model structure and weighting procedure. Journal of Animal Science 80:1819-1834.
Bracke, M. B. M., J. H. M. Metz, B. M. Spruijt, and W. G. P. Schouten. 2002b. Decision support system for overall welfare assessment in pregnant sows. B: Validation by expert opinion. Journal of Animal Science 80:1835-1845.
Chen, H. 2010. Ecosystem services from low input cropping systems and the public’s willingness to pay for them. M.S. thesis. Agricultural, Food and Resource Economics. East Lansing, MI: Michigan State University.
Corbin, M., J. L. Lusk, and F. B. Norwood. 2012. Nationwide stall ban likely? Feedstuffs FoodLink. http://www.feedstuffsfoodlink.com/ME2/dirmod.asp?sid=&nm=&type=news&mod=News&mid=9A02E3B96F2A415ABC72CB5F516B4C10&tier=3&nid=CE5DBF418DF84BFDAAA4C97DFCF71331 (accessed October 19, 2012).
De Mol, R. M., W. G. P. Schouten, E. Evers, and H. Drost. 2006. A computer model for welfare assessment of poultry production systems for laying hens. Netherlands Journal of Agricultural Science 54:157-168.
Donham, K., D. Cumro, S. Reynolds, and J. Merchant. 2000. Dose-response relationships between occupational aerosol exposures and cross-shift declines of lung function in poultry workers: Recommendations for exposure limits. Journal of Occupational and Environmental Medicine 42:260-269.
Donham, K. J., S. Wing, D. Osterberg, J. L. Flora, C. Hodne, K. M. Thu, and P. S. Thorne. 2007. Community health and socioeconomic issues surrounding concentrated animal feeding operations. Environmental Health Perspectives 115:317-320.
Freeman, A. M., III, 2003. The measurement of environmental and resource values: Theory and methods. 2nd ed. Washington, DC: Resources for the Future.
Graham, J. P., J. H. Leibler, L. B. Price, J. M. Otte, D. U. Pfeiffer, T. Tiensin, et al. 2008. The animal-human interface and infectious disease in industrial food animal production: Rethinking biosecurity and biocontainment. Public Health Reports 123:282-299.
Gray, G. C., and W. S. Baker. 2007. The importance of including swine and poultry workers in influenza vaccination programs. Clinical Pharmacology and Therapeutics 82:638-641.
Gray, G. C., T. McCarthy, A. W. Capuano, S. F. Setterquist, C. W. Olsen, and M. C. Alavanja. 2007. Swine workers and swine influenza virus infections. Emerging Infectious Diseases 13:1871-1878.
Heal, G. 2000. Nature and the marketplace: Capturing the value of the ecosystem. Washington, DC: Island Press.
Horton, R. A., S. Wing, S. W. Marshall, and K. A. Brownley. 2009. Malodor as a trigger of stress and negative mood in neighbors of industrial hog operations. American Journal of Public Health 99(Suppl 3):S610-S615.
Lipscomb, H. J., R. Argue, M. A. McDonald, J. M. Dement, C. A. Epling, T. James, et al. 2005. Exploration of work and health disparities among black women employed in poultry processing in the rural south. Environmental Health Perspectives 113:1833-1840.
Lipscomb, H. J., D. Loomis, M. A. McDonald, R. A. Argue, and S. Wing. 2006. A conceptual model of work and health disparities in the United States. International Journal of Health Services 36:25-50.
Lipscomb, H. J., J. M. Dement, C. A. Epling, B. N. Gaynes, M. A. McDonald, and A. L. Schoenfisch. 2007a. Depressive symptoms among working women in rural North Carolina: A comparison of women in poultry processing and other low-wage jobs. International Journal of Law and Psychiatry 30:284-298.
Lipscomb, H. J., J. M. Dement, C. A. Epling, M. A. McDonald, and A. L. Schoenfisch. 2007b. Are we failing vulnerable workers? The case of black women in poultry processing in rural North Carolina. New Solutions 17:17-40.
Lipscomb, H. J., C. A. Epling, L. A. Pompeii, and J. M. Dement. 2007c. Musculoskeletal symptoms among poultry processing workers and a community comparison group: Black women in low-wage jobs in the rural south. American Journal of Industrial Medicine 50:327-338.
Lipscomb, H., K. Kucera, C. Epling, and J. Dement. 2008. Upper extremity musculoskeletal symptoms and disorders among a cohort of women employed in poultry processing. American Journal of Industrial Medicine 51:24-36.
Lusk, J. L. 2011. The market for animal welfare. Agricultural and Human Values 28:561-575.
MA (Millennium Ecosystem Assessment). 2003. Ecosystems and well-being: A framework for assessment. Washington, DC: Island Press.
Mirabelli, M. C., S. Wing, S. W. Marshall, and T. C. Wilcosky. 2006. Asthma symptoms among adolescents who attend public schools that are located near confined swine feeding operations. Pediatrics 118:e66-e75.
Pearce, D. 1998. Auditing the earth. Environment 40(2):23-28.
Schinasi, L., R. A. Horton, V. T. Guidry, S. Wing, S. W. Marshall, and K. B. Morland. 2011. Air pollution, lung function, and physical symptoms in communities near concentrated swine feeding operations. Epidemiology 22:208-215.
Silbergeld, E. K., J. Graham, and L. B. Price. 2008. Industrial food animal production, antimicrobial resistance, and human health. Annual Review of Public Health 29:151-169.
Swinton, S. M., F. Lupi, G. P. Robertson, and S. K. Hamilton. 2007. Ecosystem services and agriculture: Cultivating agricultural ecosystems for diverse benefits. Ecological Economics 64(2):245-252.
Tajik, M., N. Muhammad, A. Lowman, K. Thu, S. Wing, and G. Grant. 2008. Impact of odor from industrial hog operations on daily living activities. New Solutions 18:193-205.
van Cleef, B. A., E. J. Verkade, M. W. Wulf, A. G. Buiting, A. Voss, and X. W. Huijsdens, et al. 2010. Prevalence of livestock-associated MRSA in communities with high pig-densities in the Netherlands. PLOS One 5:e9385.
Wing, S., and S. Wolf. 2000. Intensive livestock operations, health, and quality of life among eastern North Carolina residents. Environmental Health Perspectives 108:233-238.
Wing, S., R. A. Horton, S. W. Marshall, K. Thu, M. Tajik, and L. Schinasi, et al. 2008. Air pollution and odor in communities near industrial swine operations. Environmental Health Perspectives 116:1362-1368.
This page intentionally left blank.


