
5
Attaching Value to Costs and Benefits
Added to the challenges of identifying and then quantifying environmental, health, and other impacts of the food system is the challenge of attaching monetary value to those impacts. Two speakers were invited to share their thoughts on the methods and challenges of valuation. This chapter summarizes their presentations. (See also Chapter 3 for a summary of James Hammitt’s explanation of how economists attach value using either willingness to pay, or WTP, or another measure known as the quality-adjusted life year, and how both valuation methods are challenged by social aggregation problems.)
Based on his experience as a member of the National Research Council (NRC) committee that defined and evaluated the external costs and benefits associated with the production, distribution, and consumption of energy (NRC, 2010), James Hammitt discussed challenges to quantifying and monetizing external costs and benefits and issues to consider when conducting a similar study on the cost of food. Anna Alberini, associate professor of economics in the Department of Agricultural and Resource Economics at the University of Maryland, College Park, discussed how economists attach value to external costs and benefits using estimates of WTP and “value of a statistical life” (VSL), and identified several factors to consider before transferring estimates of monetary value from one context to another (e.g., using VSL estimates obtained in manufacturing or other nonfood contexts in a study on the cost of food). She cautioned that monetizing the costs and benefits of food will probably require multiple valuation exercises, with different effects considered separately.
LESSONS FROM THE HIDDEN COSTS OF ENERGY: UNPRICED CONSEQUENCES OF ENERGY PRODUCTION AND USE1
In 2010, the NRC released a report on the externalities of energy production and use (NRC, 2010). The study was requested by Congress in the Energy Policy Act of 2005, with funds appropriated to the U.S. Treasury in the Consolidated Appropriations Act of 2008. According to Hammitt, the study was conducted under a very tight time schedule, with the first of six committee meetings held on September 11, 2008, and a 473-page report released on October 19, 2009. Hammitt discussed major challenges to completing the statement of task for that report; described key results; and highlighted questions to consider for a study on the cost of food.
Statement of Task
Key components of the statement of the task were to (italics added by Hammitt for emphasis): “define and evaluate key external costs and benefits … associated with the production, distribution and consumption of energy from various selected sources that are not or may not be fully incorporated into the market price of such energy” and to “carry out its task from a U.S. perspective,” but also “consider broader geographic implications of externalities when warranted and feasible.” Among other activities, Congress requested that the committee “identify key externalities … in the categories of human health, environment, security (including quality, abundance, and reliability of energy sources), and infrastructure (such as transportation and waste disposal systems not sufficiently taken into account by producers or consumers)”; “consider externalities associated with … energy imported from foreign sources”; “develop an approach for estimating externalities related to greenhouse gas emissions and climate change”; and “present qualitative and, to the extent practicable, quantitative estimates of externalities and associated uncertainties.” (See Box 5-1 for the NRC, 2010, definition of externality.)
Major Challenges
Hammitt discussed three major challenges faced by the NRC (2010) committee: (1) identifying internalized externalities; (2) quantifying and monetizing all endpoints; and (3) exploring the disproportionate amount of effort focused on already well-understood externalities.
___________________
1 This section summarizes the second presentation of James K. Hammitt.
BOX 5-1
The NRC (2010) Definition of Externality
The NRC (2010) report defined externality as follows: “an externality, which can be positive or negative, is an activity of one agent (for example, an individual or an organization, such as a company) that affects the well-being of another agent and occurs outside the market mechanism.” Assuming that people respond to prices and nothing else, a logical extension of that definition is, as stated in the report, “In the absence of government interaction, externalities associated with energy production and use are generally not taken into account in decision making.”
SOURCE: NRC, 2010, p. 29.
Identifying Internalized Externalities
One key component of the statement of task was to evaluate key externalities “that are not or may not be fully incorporated into the market price … or into the federal tax or fee.” Without knowing whether an externality has been internalized or not, it is impossible to know whether a policy change could improve the situation. According to Hammitt, this component of the task was especially challenging because of the difficulty in determining, in some cases, whether an externality is internalized or not. It is not always clear.
For example, the following scenario was used in the report to illustrate the concept of externality: “A coal-fired electricity-generating plant, which is in compliance with current environmental regulations, releases various pollutants …. The damage from this pollution is … a ‘social cost.’ If these social costs were not adequately taken into account in selecting the plant’s site or the air pollution control technology that it uses, the true costs … have not been reflected in these decisions.” Hammitt observed that while damage from this pollution is clearly a social cost, whether that cost has been internalized is not clear. If the social cost was not considered during selection of the plant location or when deciding which air pollution control technology to use, then it has not been internalized. But how does one know if that cost was adequately taken into account at the time those decisions were made? That it is a very difficult phenomenon for a committee to judge. Compounding the challenge is the likelihood that science has evolved since that time, so knowledge about harm from pollution is different than it was when those decisions were made. So in that case, the committee was able to estimate both total damages (compared with zero emissions) and marginal damages (the damage that arises from the last unit of emission
or other type of burden). But without knowing whether those costs had been accounted for during the decision making about location, technology, etc., the committee was unable to judge whether the externalities had been internalized or not.
Quantifying and Monetizing All Endpoints
The scope of the study spanned across a range of major or rapidly growing energy sources and carriers, with major endpoints being human health, climate change, and infrastructure and security. Although environmental and ecological endpoints were part of the committee charge, the lack of data and good analytical frameworks for evaluating those endpoints made it impossible for the committee to quantify or monetize them.
Exploring All Externalities
Hammitt’s personal view on the scope of the study was that too much effort was focused on well-understood damages—that is, quantifying basic human health effects associated with fossil-fuel combustion—and too little effort focused on describing other externalities. He said, “We had the opportunity here to try and do something more innovative—less quantitative, but potentially pushing the field further along.” For example, in Hammitt’s opinion, there could have been more effort directed toward describing security and infrastructure, or unconventional power (wind, solar, etc.). There was also some inconsistency across sectors, with health damages from fossil fuels being quantified, but health damages from infrastructure and security not being quantified. Arguably, many of the external costs associated with infrastructure and security are either too difficult to quantify or already fully internalized. For example, many attack scenarios (i.e., attacks on facilities) are internalized through corporate liability and other measures. With respect to dependence on foreign oil, which was explicitly in the charge, there might be some costs associated with military activity in oil-producing regions of the world. But those constraints are difficult to estimate, and the marginal effects of U.S. oil consumption on those activities may be negligible.
Use of Graphics
Graphics used in the energy report included flow charts showing which elements of the system were examined; pie charts and bar graphs showing consumption by source and use by sectors; and tables showing which components of the system were examined using quantitative versus qualitative methodologies (see Figure 5-1a-d). Hammitt referred to Heller and
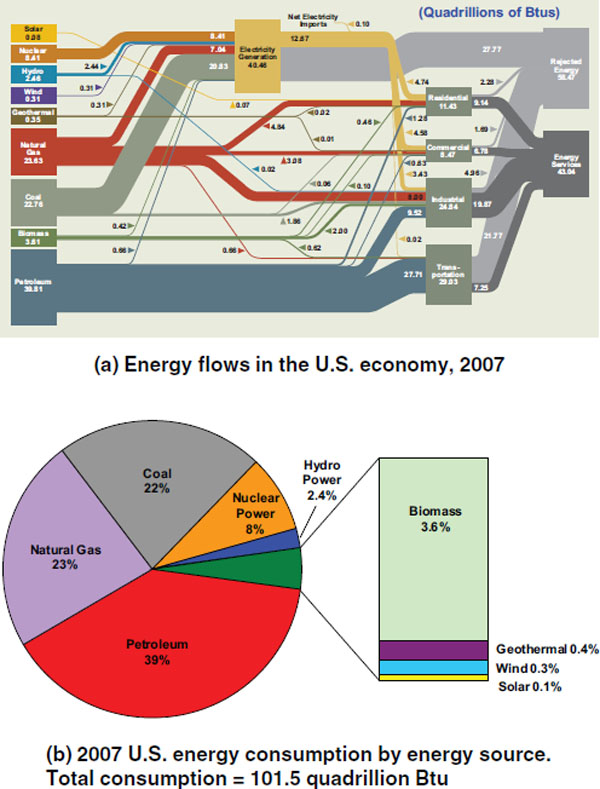
FIGURE 5-1 Examples of graphics used in The Hidden Costs of Energy: (a) the flow of major energy sources and uses; (b) energy consumption by energy source; (c) primary energy use by sector; (d) analytical methods used to examine various source/sector combinations.
NOTE: The focus of the energy report was on four major carriers or users of energy: electricity (Chapter 2), transportation (Chapter 3), industrial heat (Chapter 4), and
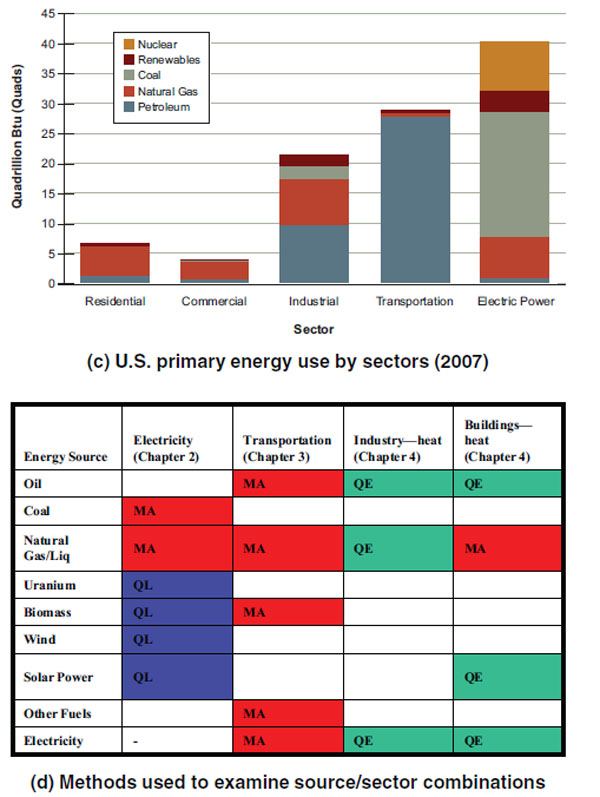
commercial/residential heat (Chapter 4). Even though climate change is associated with all of those carriers/users, it was treated separately (Chapter 5), as was infrastructure and security (Chapter 6). Btu = British thermal unit, MA = quantitative modeling analysis conducted by the committee, QE = qualitative evaluation, QL = quantitative information from the literature.
SOURCE: NRC, 2010.
Keoleian’s (2003) schematic of material flow of the U.S. food system as a similar kind of graphic that might be useful for communicating results of a study on the cost of food (see Figure 5-2).
Select Results of the NRC (2010) Analysis of the External Costs of Energy
Hammitt highlighted two key sets of findings from the NRC (2010) study. First, the committee’s analysis of electricity, which was based partly on a detailed modeling of air pollution mortality, revealed that the dominant outcome is particulate matter mortality associated with coal and natural gas plants, but with a great deal of heterogeneity among plants. Average damage among the 406 coal-fired electric plants across the United States is $160 million per plant, but with plants in the top decile causing an average $666 million per plant (in 2007). It was likewise with natural gas plants. Average damage among the 498 gas plants in the United States is $1.5 million per plant, but with plants in the top decile causing $9.73 million per plant on average (in 2007). The heterogeneity is not just per plant, but also geographic, with most of the higher decile coal plants (i.e., those causing the
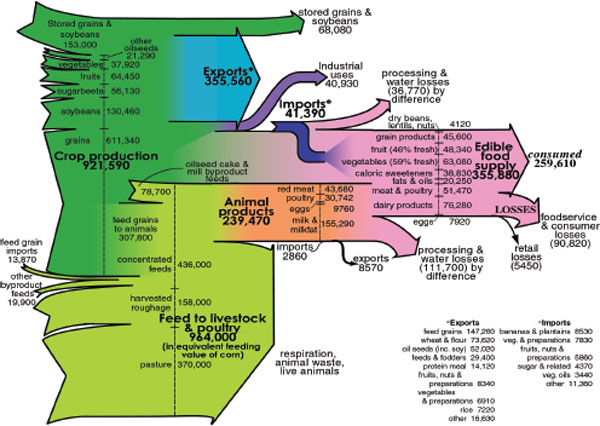
FIGURE 5-2 Material flow in the U.S. food system (1995).
NOTE: Flows in millions of pounds.
SOURCE: Heller and Keoleian, 2000.
most damage) in the Ohio Valley and most of the higher decile natural gas plants on the west coast, in Texas, and along the eastern seaboard.
Second, the committee’s analysis of on-road transportation, which involved using life cycle analysis to examine a wide range of fuels and engine technologies, revealed that total damages were remarkably similar across different fuel/engine technologies. For example, health damages caused by light-duty automobiles were nearly 1.5 cents per vehicle mile traveled for almost all fuel/engine technologies, with liquid hydrogen being the only outlier. It was likewise with greenhouse gas (GHG) emissions associated with light-duty automobiles. Again, there was not much difference among various types of fuel/engine technologies, except with biofuels (dry corn, wet corn, herbaceous, and corn stover), where some withdrawal of carbon from the atmosphere offsets emission. “This is pretty interesting,” Hammitt said, “to have these 20 different technologies and such small differences among them.”
A summary of the monetized health and climate effects for electricity and on-road transportation are shown in Table 5-1, along with the health and climate effects of heat. Hammitt highlighted the “big” effects: damages from coal-fired electricity, at $62 billion per year; damages from light-duty transportation, at $36 billion per year; and damages from heavy-duty transportation (i.e., trucks), at $20 billion per year.
TABLE 5-1 Monetized Health and Climate Effects Associated with Electricity, On-Road Transportation, and Health, Based on the 2010 (NRC) Report on the External Costs of Energy
| Source/Use of Energy | Total Damage per Year | Health Damage per Unit | Climate Damage per Unit |
| Coal-fired electricity | $62 billion | 3.2[<0.5-12] cents/kwh | 3[1-10]cents/kwh |
| Natural gas-generated electricity | $0.74 billion | 0.16[<0.05-1] cents/kwh | 1.5[0.5-5]cents/kwh |
| Light-duty on-road transportation | $36 billion | 1.2-1.7 cents/VMT | 0.5[0.05-5]cents/VMT |
| Heavy-duty on-road transportation (trucks) | $20 billion | ||
| Natural gas—generated heat | $1.4 billion | 11 cents/MCF | 0.7[0.07-7]cents/MCF |
NOTE: kwh = kilowatt hour; MCF = 1,000 cubic feet; VMT = vehicle mile traveled. The numbers in brackets are uncertainty ranges.
SOURCE: NRC, 2010.
Questions to Consider When Planning a Study on the Cost of Food
The NRC (2010) study on the external costs of energy raises several questions to consider when planning a study on the external costs of food:
- Is the goal to estimate total or marginal externalities? Hammitt suggested analyzing both total and marginal effects. Both are useful for different reasons.
- Will an effort be made to deal with the extent to which externalities have been internalized? Hammitt cautioned that determining the extent to which externalities have been internalized can be especially challenging and suggested avoiding the challenge altogether if possible.
- Should pecuniary externalities be included in the analysis? Pecuniary externalities are effects that are transfers of income, or costs, between different parties. They do not impact total welfare, but they do impact distribution.
- Should the analysis consider externalities associated with foods that are imported from foreign sources? A related question is, should the analysis incorporate externalities that occur elsewhere but that harm the United States, such as GHG emissions and habitat/biodiversity loss?
- To what extent should the analysis consider heterogeneity of effects by location and other factors?
VALUING AGRICULTURAL EXTERNALITIES AND PUBLIC HEALTH IMPACTS2
The notion of valuing the many different types of health effects associated with food production and consumption is “complex and complicated,” Anna Alberini stated. The notion is this: If something is important to you, then you should be willing to pay for it—either to obtain it or, if it is something that is causing a negative effect, to get rid of it. Alberini discussed how economists attach value using WTP assessments; how economists quantify WTP for a marginal change in mortality risk (i.e., VSL); and factors to consider before using VSL and other WTP estimates typically measured in nonfood contexts in a study on the costs of food.
Willingness to Pay
WTP is the maximum amount of money that an individual would voluntarily exchange to obtain an improvement or avoid an undesirable
_________________
2 This section summarizes the presentation of Anna Alberini.
outcome. When evaluating the benefits of a policy, economists consider the sum of all beneficiaries’ WTP for that benefit. Payment can be made in many ways, including via higher taxes, higher food prices, or by incurring costs or changing behaviors in order to protect oneself from the risk(s).
The simplest food-related example is the willingness to pay to reduce the risk of minor food poisoning or another acute illness. Economic theory indicates that the willingness to pay to avoid that risk is a function of several factors, including the medical expenditure to alleviate the symptoms that were actually experienced, any income that was lost to that illness (e.g., if a person did not have any sick days but was too sick to work), the cost of averting illness, and the value of avoiding the discomfort of being sick. According to Alberini, most public health and food safety policy is based on a cost-of-illness approach that considers only the first two factors, and it is unclear to what extent considering the additional two components would impact total WTP. She suspects that consideration of those two additional components could increase total WTP as much as twofold. “So we are talking about relatively large numbers,” she said, “even for relatively simple episodes.”
At the other extreme are mortality risks. When estimating WTP to reduce a mortality risk, economists typically use either the VSL or the value of a statistical life year (VOLY). VSL is the willingness to pay for a small change in the risk of dying. Alberini emphasized that the change is indeed small. VSL estimates are widely used by many U.S. agencies. For example, in 1999, the U.S. Environmental Protection Agency (EPA) calculated VSL as $6.2 million. Adjusted for the cost of inflation, that amounts to about $8 million today. The U.S. Department of Transportation uses a smaller figure within the $3.7-$5 million range.
VSL is estimated using any of a number of empirical methods (see “Estimating VSL” section below). VOLY is a derived estimate and is usually inferred from VSL. Alberini said she was aware of only two studies where researchers tried to estimate VOLY from empirical data (Chilton et al., 2002; NEEDS, 2006). In Alberini’s opinion, both of those studies were so problematic that the estimates are unreliable. The challenge with empirically estimating VOLY stems from the difficulty in asking people whether they would be willing to pay for a gain in life expectancy. It is unclear whether the question can be conveyed effectively and whether people really understand what they are valuing when they answer the question.
Estimating VSL
Estimates of VSL are based on empirical data, using any of a number of different approaches. Alberini listed four major types of approaches: (1) compensating wage studies (e.g., Viscusi, 1993; Viscusi and Aldy, 2003); (2)
consumer behavior studies where one measures expenditures on safety devices (e.g., a bicycle helmet that will reduce the risk of dying) (Jenkins et al., 2001) or observes the tradeoffs people make to reduce risks (Blomquist, 2004); (3) housing price hedonics (e.g., Gayer et al., 2000, 2002); and (4) stated preference methods (e.g., Alberini et al., 2007; Krupnick et al., 2002; Tsuge et al., 2005).
Compensating Wage Studies
Compensating wage studies involve collecting data on wage rates and everything that might be a determination of that compensation (e.g., age, experience, type of profession) plus the risk of a fatal accident and the risk of a nonfatal injury on the job. The assumption is that people are compensated for taking riskier jobs, that workers know the risks, and that the researchers are measuring those risks correctly. While many U.S. agencies use this approach to estimate VSL, Alberini opined that it is “hard to believe” that all of the assumptions are met. She referred to Steve Wing’s presentation on health inequalities and the unlikelihood that workers in certain types of animal processing facilities are actually compensated more for working in those high-risk conditions. In fact, Alberini argued that it is probably the opposite, that is, those workers are probably paid less for taking riskier jobs, partly because they are not aware of the risks. There are a number of examples where VSL calculated using this approach is actually negative or insignificant. Also, compensating wage studies are typically conducted for the manufacturing industry, not food, and many researchers would be uncomfortable using the approach to evaluate food system risks.
Housing Price Hedonics
Housing price hedonics is similar to the approach that real estate agents use when estimating the value of a home. It involves regressing the price of homes on structural characteristics (e.g., square footage, number of floors), neighborhood characteristics, and the risk of experiencing a negative outcome in the area (e.g., as a result of exposure to pollution). VSL estimates derived from housing price hedonics are typically comparable to those estimated using compensating wage values. But again, the assumption is that the risks are known and that the researcher is measuring them correctly. For example, many neighborhood characteristics impact risk but have no data.
As with compensative wage studies, housing price hedonics is an approach not typically used with food. The hedonic pricing approach, however, could be used for food. For example, one could regress the price of a certain type of egg on characteristics of the egg and the risks associated with the production and consumption of that type of egg (e.g., risk of mortality
from a foodborne infection, risk of cancer associated with something in the animal feed, climate change effects). However, again, one of the assumptions is that willingness to pay that price is based on people being aware of all the risks. Also, too many of the risks are correlated, making it difficult to disentangle the contribution of each. Alberini said, “It would be interesting if we could actually inform people about the different types of risks associated with the different types of eggs and let them choose the [type of egg] and indicate how much they are willing to pay for them.”
Stated Preferences
The stated preferences method involves asking people how much they would be willing to pay for a reduced risk of dying by asking them to choose between two alternative interventions for reducing risk. For example, in one of her studies, Alberini and colleagues asked respondents which of two interventions they preferred: (1) a nationwide public intervention that reduces the risk of death from road traffic accidents (by 3 in 10,000 over 5 years) and costs each household 300 euros; or (2) a private intervention that reduces the risk of death from cancer (by 2 in 10,000 over 5 years) and costs each household 200 euros (Alberini and Scasny, 2011). One of the concerns with conducting a study like this is making sure that respondents understand the magnitude of the risks. There are visual tools that can be used to educate respondents about risks (e.g., Corso et al., 2001).
The Challenge of Transferring Value
A key question to consider when planning a study that involves valuing the environmental or public health costs of food is whether VSL estimates from other (nonfood) contexts can be used. “I don’t have an answer for you,” Alberini said. Researchers have expressed concerns about such practice, but there is little empirical work documenting resons for doing or not doing such “transfers.”
To further elaborate, several factors affect the WTP for a mortality risk reduction and, therefore, whether estimates of VSL measured in one setting are appropriate for use in another setting. The same is true of WTP for less extreme health risks. First, are the beneficiaries comparable? Most work environments involve males ages 30 to 40. It is unclear whether VSL estimates based on that context can be extrapolated to the rest of the population. Second, is the nature of the risk comparable? For example, the risk of cancer is a risk that comes with much dread and with suffering attached to both the disease and the treatment. The mental anxiety associated with cancer could be such that a person is willing to pay much more to reduce their risk of dying from cancer compared to the risk of dying of something
else, such as an accidental death. Third, how does WTP for a reduced risk compare between a risk reduction experienced now versus later? Fourth, are there competing risks (e.g., Eeckhoudt and Hammitt, 2001; Evans and Smith, 2006)? If a person thinks that a particular risk is a very small portion of the overall risk of dying, they may not be willing to pay as much to reduce that risk. Or, if a person thinks that a particular risk is not within their control (e.g., cardiovascular disease associated with exposure to air pollution, as opposed to cardiovascular disease associated with diet), his or her WTP may be different to reduce that same risk. Fifth, are there public programs in place to make it easier for private behavior to reduce a risk, which has been shown in theory to influence WTP (Shogren, 1990)? Finally, when thinking about risk, most people don’t just think about the probability of the adverse event. They also think about a number of other attributes that can impact WTP for the same risk reduction (the immediacy of the effect, future generations, etc.) (Slovic, 1987).
Although the focus of her presentation was on health, Alberini said there are several approaches to valuing environmental effects. Economists favor what is known as the damage function approach, which involves quantifying the physical effects and then attaching a value to those effects. In addition to the methods discussed above, the monetary value of the effects can also be estimated using the travel cost method (a method that infers the value people place on visiting some site, generally for recreational purposes), the hedonic housing price method, and stated preference and other stated preference methods. Some of these methods are well suited to estimating the effects of food production practices on ecological systems, but do not lend themselves to valuing the human health effects of food production practices or safety levels.
In conclusion, Alberini encouraged valuation of the health and environmental effects of food production, but emphasized that a single valuation exercise is unlikely to be sufficient. Different effects will likely require different methods. “We are probably better off dividing up the chore into different tasks and facing them separately,” she explained.
In the question-and-answer period following her presentation, Alberini remarked that WTP includes ability to pay. That is, people are willing to pay only what they can pay. She also mentioned that altruism is another understudied topic, that is, the willingness to pay for other people. She mentioned current focus group research on altruism being conducted by the EPA and other scientists.
Alberini, A., and M. Šcasný. 2011. Context and the VSL: Evidence from a stated preference study in Italy and the Czech Republic. Environmental and Resource Economics 49(4):511-538.
Alberini, A., A. Longo, and M. Veronesi. 2007. Valuing environmental amenities using stated choice studies. In Basic statistical models for stated choice studies, Vol. 8, The economics of non-market goods and resources, edited by B. J. Kanninen. The Netherlands: Springer. Pp. 203-227.
Blomquist, G. 2004. Self-protection and averting behavior, values of statistical lives, and benefit cost analysis of environmental policy. Review of Economics of the Household 2(1):89-110.
Chilton, S., J. Covey, L. Hopkins, M. Jones-Lee, G. Loomes, N. Pidgeon, and A. Spencer. 2002. Public perceptions of risk and preference-based values of safety. Journal of Risk and Uncertainty 25(3):211-232.
Corso, P. S., J. K. Hammitt, and J. D. Graham. 2001. Valuing mortality-risk reduction: Using visual aids to improve the validity of contingent valuation. Journal of Risk and Uncertainty 23(2):165-184.
Eeckhoudt, L. R., and J. K. Hammitt. 2001. Background risks and the value of a statistical life. Journal of Risk and Uncertainty 23(3):261-279.
Evans, M. F., and V. K. Smith. 2006. Do we really understand that age-VSL relationship? Resource and Energy Economics 28(3):242-261.
Gayer, T., J. T. Hamilton, and W. K. Viscusi. 2000. Private values of risk tradeoffs at Superfund sites: Housing market evidence on learning about risk. Review of Economics and Statistics 82(3):439-451.
Gayer, T., J. T. Hamilton, and W. K. Viscusi. 2002. The market value of reducing cancer risk: Hedonic housing prices with changing information. Southern Economic Journal 69(2):266-289.
Heller, M., and G. Keolian. 2000. Life cycle-based sustainability indicators for assessment of the U.S. food system, Center for Sustainable System, Ann Arbor, MI. Report No. CSS00-04.
Heller, M., and G. Keoleian. 2003. Assessing the sustainability of the U.S. food system: A life cycle perspective. Agricultural Systems 76:1007-1041.
Jenkins, N. R., N. Owens, and E. Wiggins. 2001. Valuing reduced risks to children: The case of bicycle safety helmets. Contemporary Economic Policy 19(4):397-408
Krupnick, A., A. Alberini, M. Cropper, N. Simon, B. O’Brien, R. Goeree, and M. Heintzelman. 2002. Age, health and the willingness to pay for mortality risk reductions: A contingent valuation survey of Ontario residents. Journal of Risk and Uncertainty 24(2):161-186.
NEEDS (New Energy Externalities Developments for Sustainability). 2006. Final report on the monetary valuation of mortality and morbidity risks from air pollution.http://www.needs-project.org/RS1b/NEEDS_RS1b_D6.7.pdf (accessed October 19, 2012).
NRC (National Research Council). 2010. Hidden costs of energy: Unpriced consequences of energy production and use. Washington, DC: The National Academies Press.
Shogren, J. F. 1990. The impact of self-protection and self-insurance on individual response to risk. Journal of Risk and Uncertainty 3:191-204.
Slovic P. 1987. Perception of risk. Science 236:280-285.
Tsuge, T., A. Kishimoto, and K. Takeuchi. 2005. A choice experiment approach to the valuation of mortality. Journal of Risk and Uncertainty 31(1):73-95.
Viscusi, W. K. 1993. The value of risks to life and health. Journal of Economic Literature 31:1912-1946.
Viscusi, W. K., and J. E. Aldy. 2003. The value of a statistical life: A critical review of market estimates throughout the world. Journal of Risk and Uncertainty 27(1):5-76.


