
2
The Economics of Food Prices1
Americans spend about 9 percent of after-tax disposable personal income on food—less than anywhere else in the world. That is an “extraordinarily small amount,” in Katherine Smith’s opinion. Smith, vice president of programs and chief economist at the American Farmland Trust, provided some background on how U.S. market prices of foods are determined and an overview of the types of costs not included in market prices. She also offered some reminders when delving into a discussion on external costs because the average external costs mask a tremendous amount of variation in production methods and geography.
DETERMINING THE MARKET PRICE OF FOOD
What U.S. consumers spend on food is tracked through the Consumer Price Index (CPI), which measures changes in the price level of consumer goods and services purchased by households. Food usually makes up about one-seventh of the CPI (15.256 percent in December 2011), with a substantial change in food prices making a significant difference in the overall CPI. Because food prices are so volatile, with fluctuating food prices masking long-term trends in CPI, food is often removed from the CPI so that longer trends can be observed. The same is true of energy. For example, between January 2009 and January 2012, total CPI fluctuated considerably, falling and rising over time. But when food and energy prices are removed, those
_________________
1 This section summarizes the keynote presentation by Katherine Smith and the discussion following her presentation. For more information, please consider USDA/ERS, 2011a,b,c.
fluctuations disappear, and CPI appears relatively stable over the same time period.
Food prices were forecasted to increase by about 3.5-4.5 percent in 2012, which Smith said is within the high end of the normal range.2 Most of that increase was among animal products (meats, poultry, fish, and fats and oils), as well as cereals/bakery and fruits/vegetables; most of it was a result of increasing commodity and energy prices. Commodities serve as the basis for production, which itself accounts for about 10 percent of the U.S. “food dollar” (i.e., a breakdown of expenditures for a dollar of food) (Figure 2-1). Energy accounts for another 5 percent. Together, changes in production and energy costs “really move” food prices from year to year.
Commodity prices themselves are affected by many variables, including energy prices, stocks-to-use ratio, and weather. For example, between 2000 and 2011, fluctuations in the index price of food more or less paralleled fluctuations in the index price for crude oil. With respect to stocks-to-use ratio, which is a measure of how much of a particular commodity is stored in comparison to how much is being used, the lower the ratio, the less stable the prices of food and the more likely that a widespread unexpected event, such as a flood or a drought, impacts those prices. The stocks-to-use ratio for total world grain and oilseeds has been dropping every month since June 2010, exacerbating other factors affecting prices. Finally, weather is another major driver of commodity price fluctuation. For example, a 2010 drought in Russia damaged about 25 percent of the global supply of wheat, driving wheat prices up. Additionally, some longer term trends could affect commodity prices in the future. Prime among these factors are climate change and water scarcity.
In addition to commodity and energy prices impacting short-term fluctuations in food prices, there are other underlying factors impacting long-term trends in food prices. A key one is that the global population is not only growing, but it is also becoming more affluent, driving a greater demand for high-value foods, like meats. When demand goes up, prices go up. A second key trend is the growing demand for biofuels. In the United States, an increasingly larger proportion of the corn crop is being used to produce ethanol. In other countries, an increasingly larger proportion of sugar cane crops is being used for the same reasons. Ethanol production was expected to increase by 333 percent between 2005 and 2030. Likewise, production of biodiesel is rapidly increasing worldwide. In the United States, most biodiesel production uses soybean oil. Again, as demand goes up (i.e., the demand for corn, soybeans, etc.), so too does price (i.e., of corn, soybeans,
_________________
2 This number reflects the forecasted price inflation at the time of the workshop. Given the extreme drought that occurred between the time of the workshop and the publication of this report, a much higher increase in food prices is expected.
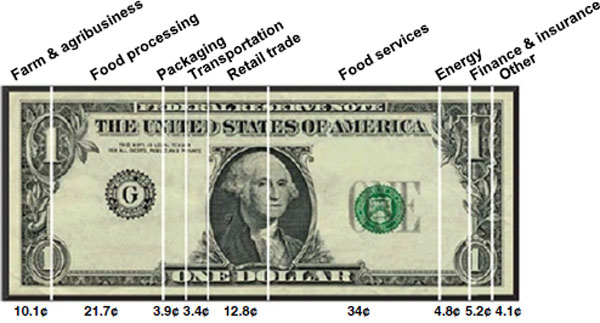
FIGURE 2-1 The industry group food dollar series illustrates the distribution of the food dollar among 10 food supply chain industry groups, demonstrating that the cost of food equals the sum of value added by all supply chain industry groups.
NOTE: “Other” includes two industry groups: advertising and legal & accounting.
SOURCE: USDA/ERS, 2010.
and other crops). Also underlying these longer term trends in food prices are stagnating investments in agricultural research and development, which slow growth in agricultural productivity.
THE CONCEPT OF EXTERNALITIES: COSTS AND BENEFITS NOT REFLECTED IN MARKET PRICES
Costs not included in the market price of food are called external costs, or externalities. The technical definition of an externality, according to Smith, is “a cost or benefit not transmitted through prices that is incurred by a party who did not agree to the action causing the cost or benefit.” General types of externalities associated with food include ecological effects, environmental quality, GHG emissions, animal welfare, social costs associated with labor, and public health effects.
These costs can occur anywhere in the food life cycle, from animal feed crop production through food waste disposal. For an example at the input stage, Smith mentioned potential ecological costs to using genetically engineered crop seeds for animal feed. They include the evolution of newer, more vigorous pests; harm to nontarget species (e.g., butterflies); disruption of biotic communities; and irreparable loss of species diversity or genetic diversity within a species (Snow et al., 2005). The actual crop and animal
production stages yield a variety of potential external environmental costs. These can include soil erosion and sedimentation; impaired water quality; overdrawn aquifers; loss of biodiversity; air pollution; and GHG emissions. In some cases, the production stage can include potential external health costs, including pesticide exposure, exposure to pathogens in water systems, inhalation of dust, consumption of chemical residues (e.g., antibiotics and growth hormones), and exposure to antibiotic resistant bacteria. According to Smith, however, this pales in comparison with the direct and indirect health costs associated with food consumption patterns later in the food life cycle.
Even though they have no market value, monetary estimates can be assigned for some of these costs. For example, sedimentation could be valued based on the cost of removing sedimentation from reservoirs and waterways. Or, the cost of pollination services could be used as a proxy for the cost of a loss of biodiversity. Some health costs can be assigned monetary value based on loss of lifespan, loss of work, or related measures.
THINGS TO KEEP IN MIND ABOUT THE EXTERNAL COSTS OF FOOD
Smith offered four “cautions” to the workshop audience—thoughts to keep in mind when discussing externalities of the food system:
- Everything is relative. Costs and benefits are relative. For example, one could argue that agriculture provides a benefit by filtering rainfall and cleaning water. But in comparison to what? That benefit is in comparison to development, not in comparison to a natural ecosystem. The same is true of costs. A cost is only a cost relative to something else.
- The average external cost masks variability among producers, consumers, and geography. For example, one farmer could be doing everything possible to minimize soil erosion, water contamination, and other environmental consequences of production, while his or her “bad actor” neighbor is doing the opposite. Geography plays a role as well. For example, Smith remarked that animal production in dry climates may result in fewer externalities than animal production next to the Chesapeake Bay.
- While not in the price of food, we could be paying through the price of other things. For example, while we may not be paying for sedimentation in the cost of food, we may be paying dredging costs through our water bill. “They can show up in other places,” Smith said.
- Food and agriculture also have positive externalities. While the focus of the workshop was on negative externalities, that is, costs, Smith thought it was important to keep in mind that food and agriculture also yield many benefits that are not reflected in the market price of food.
Smith fielded several questions on externalities. An audience member asked whether some of the externalities that she mentioned, such as the health costs associated with pesticide exposure, are in fact reflected in the price of food given that organic foods, for example, have higher prices. Smith explained that the higher price for organic foods typically reflects the cost to producers (e.g., the higher cost of allowable practices to control pests).
There was a question about whether the costs of diet-related diseases, such as obesity, can be considered externalities. Smith responded that while those costs are external costs to food, society might be paying for them through health insurance premiums, personal expenses for health and well-being, or other means. An audience member added that the Danish “fat tax” is one way to internalize the external cost of obesity. Smith agreed that taxes can be used to internalize external costs, but cautioned that a food tax typically has to be very high in order to change consumer behavior enough to affect the targeted health outcome.
Another question was about how energy costs should be factored into an analysis of the cost of food given that the actual cost of energy in the United States does not reflect the “true” cost of energy. Smith replied that the actual price of energy used during food production is in fact reflected in the cost of that food. While the discrepancy between the actual and true cost of energy may represent an externality, whether to include that externality in an analysis of the cost of food depends on how far back one wants to go in the life cycle and how many intersecting life cycles one wants to consider. Smith’s response led into some further discussion about where to draw the line when thinking about externalities. For example, another audience member wondered whether the profits that other people earn from obesity (e.g., profits from medications prescribed for obesity-related conditions) would be accounted for in an analysis of the external costs of food. Smith replied that it is more manageable to analyze only direct externalities. She said, “Because everything is related to everything else, there are indirect externalities. You can go as far as you want…. It gets harder and harder the farther out you go.”
Snow, A. A., D. A. Andow, P. Gepts, E. M. Hallerman, A. Power, J. M. Tiedje, and L. L. Wolfenbarger. 2005. Genetically engineered organisms and the environment: Current status and recommendations. Ecological Applications 15:377-404.
USDA/ERS (U.S. Department of Agriculture/Economic Research Service). 2010. Food Dollar Series.http://www.ers.usda.gov/data-products/food-dollar-series/food-dollar-application.aspx (accessed September 10, 2012).
———. 2011a. A revised and expanded food dollar series: A better understanding of our food costs, ERR-114. Washington, DC: USDA.
———. 2011b. Have food commodity prices risen again?, WRS 1103. Washington, DC: USDA.
———. 2011c. Impacts of higher energy prices on agriculture and rural economies, ERR-123. Washington, DC: USDA.


