
D
Verification and Analyses of the SMART Vaccines Computational Model
Kinpritma Sangha, M.P.H.
Institute of Medicine
The SMART Vaccines’ computational submodel has been used to evaluate ten different scenarios for the following vaccine candidates: influenza, group B streptococcus, human papillomavirus, rotavirus, tuberculosis, and pneumococcal infection for the 2009 U.S. population, and human papillomavirus, rotavirus, tuberculosis and pneumococcal infection for the 2009 South African population.
These baseline scenarios were developed to demonstrate application of the SMART Vaccines computational submodel and determine face validity for health and economic measures output. Sensitivity analysis is performed on two vaccine candidates (influenza in the United States and tuberculosis in South Africa) to verify model calculations and display how variability in inputs affects health and economic measures output. A by-product of these analyses is to provide users a more in-depth understanding of the computational model and highlight the function of population, disease, and candidate vaccine characteristics within the model. These analyses are limited to the computational submodel housed within the SMART Vaccines platform.
The overall SMART Scores rely on a combination of data input by the user including the selected attributes and their weights that define the multi-attribute utility model portion of SMART Vaccines, and the population, disease, and vaccine candidate input parameters that specify the computational submodel. SMART Scores are inherently sensitive to the
selected attributes and weighting input by each user. Therefore, the model evaluation and sensitivity analyses are designed to isolate computational submodel results independent of user preferences. As such, this appendix describes sensitivity analysis scenarios exclusively for attributes of health and economic considerations.
Table D-1 presents the calculated health and economic measures for six vaccine candidates in the United States using data available as accompanying datasets. All attributes included in the health and economic measures are calculated within the model using this baseline input data. The calculated health measures specify the following attributes: premature deaths averted per year, incident cases prevented per year, quality-adjusted life years (QALYs) gained per year, and disability-adjusted life years (DALYs) averted per year. The economic measures are the net direct costs (savings) of vaccine use per year, workforce productivity gained per year, one-time costs, cost-effectiveness in costs per QALY, and cost-effectiveness in costs per DALY.
The computational submodel calculates the health and economic burden due to a disease. Among the six vaccine candidates tested for the United States, influenza vaccine had the highest health impact. Compared to other hypothetical vaccine candidates, a seasonal influenza vaccine candidate with 1-year immunity was shown to potentially avert 11,233 deaths, prevent the incidence in 6,119,401 cases, and produce a gain of 115,665 QALYs per year. Because of its annual administration costs, the net direct costs for the influenza vaccine were considerably higher than the costs of a two- or three-dose vaccine conferring lifetime immunity, such as a human papillomavirus (HPV) vaccine. The model found that a vaccine candidate for HPV was most cost-effective of all the evaluated vaccines because preventing this infection in young women provides them with improved health for the remainder of their lifetimes. In particular, the calculation indicated a gain of 11,238 QALYs per year with minimal costs for administration. Consequently, in this example, vaccine for HPV is a beneficial investment in the long run because its effects are long lasting unlike a seasonal influenza vaccine that only confers health benefits for a year. For some women, the HPV vaccine can result in health gains for as long as their lifetimes, which has an added economic benefit of reduction in the amount of health services otherwise used to treat HPV-associated disease.
Similarly, the computational submodel was also tested for vaccine candidates in the context of South Africa. Table D-2 presents four vaccine candidates with calculated health and economic measures for human papillomavirus, rotavirus, tuberculosis, and pneumococcal vaccine candidates in the South African population using data available online. The
TABLE D-1
Computational Submodel Evaluation for U.S. Vaccine Candidates (2009)
| Health Measures | Group B Streptococcus |
Human Papillomavirus | Influenza | Pneumococcal Infection | Rotavirus | Tuberculosis |
| Premature deaths averted per year | 1,302 | 740 | 11,233 | 621 | 102 | 231 |
| Incident cases prevented per year | 16,201 | 2,340 | 6,119,401 | 6,562 | 237,800 | 6,580 |
| QALYs gained per year | 38,430 | 11,238 | 115,665 | 6,534 | 2,950 | 6,017 |
| DALYs averted per year | 45,960 | 12,998 | 100,145 | 6,323 | 3,771 | 6,871 |
| Economic Measures | ||||||
| Net direct costs (savings) of vaccine use per year (millions) | 390 | –42 | 1,801 | –8 | 118 | 256 |
| Workforce productivity gained per year (millions) | 101 | 14 | 3,345 | 15 | 95 | 31 |
| One-time costs | >1 billion | >1 billion | 100–500 million | <100 million | <100 million | >1 billion |
| Cost-effectiveness in costs per QALY | 22,103 | –3,903 | 12,821 | –1,222 | 53,857 | 134,992 |
| Cost-effectiveness in costs per DALY | 16,766 | –3,475 | 15,363 | –1,333 | 42,665 | 105,990 |
TABLE D-2
Computational Submodel Evaluation for South Africa (2009) Vaccine Candidates
| Health Measures | Human Papillomavirus | Pneumococcal Infection | Rotavirus | Tuberculosis |
| Premature deaths averted per year | 1,337 | 1,212 | 109 | 4,935 |
| Incident cases prevented per year | 2,531 | 45,662 | 6,083 | 33,575 |
| QALYs gained per year | 16,858 | 13,816 | 2,491 | 91,529 |
| DALYs averted per year | 26,197 | 19,628 | 3,888 | 151,336 |
| Economic Measures | ||||
| Net direct costs (savings) of vaccine use per year (millions) | 6 | –14 | 22 | –10 |
| Workforce productivity gained per year (millions) | 6 | 7 | 1 | 54 |
| One-time costs | <100 million | >1 billion | >1 billion | <100 million |
| Cost-effectiveness in costs per QALY | 2,435 | 2,659 | 11,329 | –734 |
| Cost-effectiveness in costs per DALY | 1,463 | 1,737 | 7,413 | –440 |
model shows that a new tuberculosis vaccine would result in about 4,935 premature deaths averted per year, and a pneumococcal vaccine candidate would prevent 45,662 incident cases per year. A tuberculosis vaccine, by preventing new incident cases, could provide the greatest benefit—151,336 DALYs averted per year—and would also be the most cost-effective among the four vaccine candidates.
Sensitivity Analysis
Sensitivity analysis was conducted using a hypothetical influenza vaccine for the United States and a hypothetical tuberculosis vaccine in South Africa, both using 2009 population data. Health and economic attributes were evaluated for each scenario. The health output measures examined include: premature deaths averted per year, incident cases prevented per year, QALYs gained per year and DALYs averted per year. The economic output measures examined include cost per QALY gained, cost per DALY averted, net direct costs of vaccine use per year and workforce productivity gained.
The specific input parameters tested include incidence of the disease, case fatality rate, coverage for a vaccine, vaccine effectiveness, administration costs per dose, health care costs and workforce costs. Each parameter is changed in 25 percent increments from the baseline scenario to observe the resulting trend in attribute under consideration. A –75% to +100% from baseline range was created to encompass the high variation in disease and vaccine characteristics that may be input for each scenario. This testing range also allows for full evaluation of the direction, magnitude, and functional relationship (e.g., linear versus non-linear) between inputs and health and economic measure outputs. That is, trends in economic and health attributes were obtained while altering associated parameters from the baseline scenarios. Lines for each input parameter analysis are purposefully offset such that the trends are clearly visible. Each tested example scenario and the sensitivity analyses tests are described in following sections.
A New Influenza Vaccine for the United States
Using seasonal flu vaccine as the baseline scenario, health considerations were examined for the following attributes: premature deaths averted per year, incident cases prevented per year, QALYs gained per year, and DALYs averted per year. Specific parameters that were tested for sensitivity were incidence of the disease, case fatality rate, coverage for a vaccine, vaccine
effectiveness, administration costs per dose, health care costs, and workforce costs. Each parameter is changed in 25 percent increments from the baseline in order to observe the directional sensitivity of the resulting trend among the attribute under consideration. Results relating to the health-related attributes are presented in Figure D-1.
Figure D-1(a) shows the test results for premature deaths averted per year. As incidence, case fatality rate, coverage, and effectiveness increase, so do the premature deaths prevented per year. An increase in the potential number of cases or an increase in the deadliness of the strain of influenza each provides greater opportunity for a vaccine to produce positive effects, while having a greater percentage of the population covered or having a more effective vaccine each improves the vaccine’s ability to take advan-
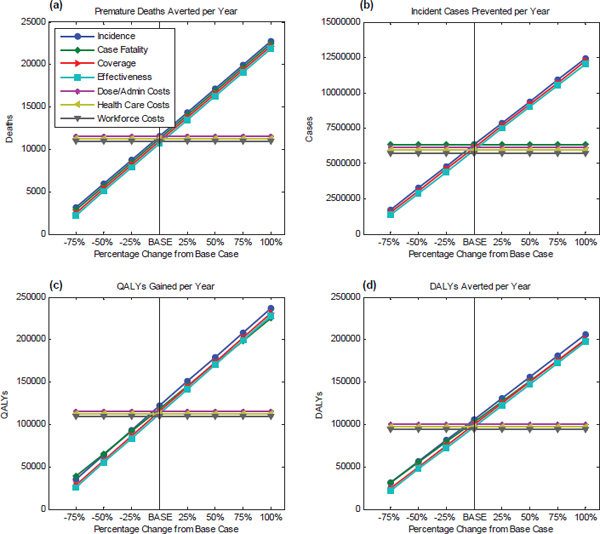
FIGURE D-1
Sensitivity analysis of the health-related attributes for a new influenza vaccine for the United States. The baseline scenarios from 2009 data were used to study the changes in 25 percent increments (–75% to 100%) for (a) premature deaths averted per year, (b) incident cases prevented per year, (c) QALYs gained per year, and (d) DALYs averted per year.
tage of that opportunity. The cost parameters do not influence the health parameters, that is, disease incidence, case fatality, coverage, and effectiveness are independent of the vaccine administration costs, health care costs, and workforce costs.
With regards to incident cases prevented per year, the resultant trend, illustrated in Figure D-1(b), shows that as vaccine coverage and effectiveness increase, there is an increase in the number of incident cases prevented per year. Case fatality rates do not affect incident cases. Although the number of deaths will decrease if the case fatality rate is reduced, the number of incident cases prevented appears to remain the same. Again, cost parameters are independent of the health parameters.
Figure D-1(c) and D-1(d) use 115,665 QALYs gained per year and 100,145 DALYs averted per year, respectively, as baselines, and they show that an increase in disease incidence, case fatality, vaccine coverage, and effectiveness leads to an increase in QALYs gained per year and also DALYs averted per year. A deadly strain of influenza causing a large number of disease cases and deaths for which an effective vaccine with high coverage can be attained, will result in greater gains in health in terms of QALYs gained and DALYs averted.
Further, Figures D-1(c) and D-1(d) show that the case fatality rate line has a slightly different slope than the other plotted parameters. This is because QALYs are comprised of life years lost from death, impairment, and morbidity. When case fatality rate (number of deaths caused by the disease/number of cases due to the disease) is increased, it implies that more cases that would have resulted in impairment or morbidity due to the disease now lead to death. The lines (QALYs and DALYs) have a different slope in panels D-1(c) and D-1(d) because the case fatality rate alters these outcomes only through reducing life-years lost for some of the people who acquire the disease, whereas changing the disease rate (either through changing the coverage or effectiveness of the vaccine) changes QALYs and DALYs in addition by improving the quality of life of all survivors.
Economic considerations were tested for sensitivity using cost-effectiveness and annual costs as measures. In regards to cost-effectiveness, using $12,821 per QALY gained, as shown in Figure D-2(a), and $15,363 per DALY averted as the baseline, as in Figure D-2(b), all parameters were changed in 25 percent increments from the base case in order to observe the resultant trend. The graphs show that an increase in disease incidence and case fatality rate improves the cost-effectiveness of a vaccine. A higher case fatality rate is associated with more deaths and higher health care costs, but net direct costs (delivery costs-health care costs) are shown to decrease because delivery costs are expected to be minimal. Because net
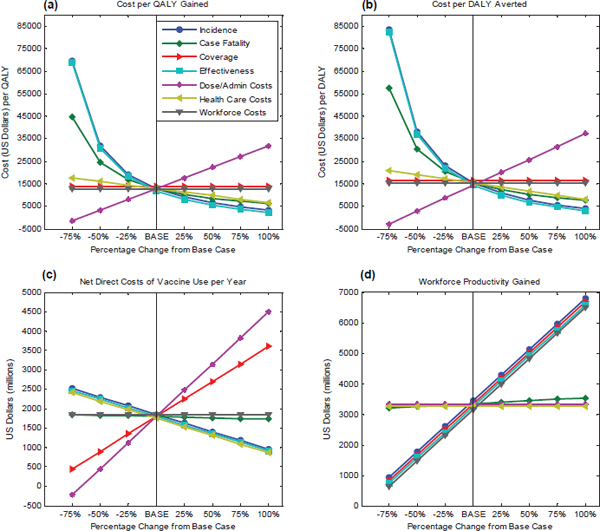
FIGURE D-2
Sensitivity analysis of the economic attributes for a new influenza vaccine for the United States. The baseline scenarios from 2009 data were used to study the changes in 25 percent increments (–75% to 100%) for cost-effectiveness using (a) QALYs and (b) DALYs, and for (c) annual net direct costs associated with the vaccine use and (d) workforce productivity gained per year.
direct costs are calculated by subtracting health care costs from delivery costs, low delivery costs and high health care costs would lead to negative net direct costs. As observed in Table D-1, both HPV and pneumococcal vaccines have negative net direct costs whereas a new influenza vaccine appears to have positive net direct costs that indicate higher delivery costs associated with a seasonal flu vaccine. The output also suggests that as the effectiveness of a vaccine increases, cost-effectiveness ratio for the hypothetical vaccine decreases because a more effective vaccine leads to higher gains in health for the same costs. Anticipated coverage does not seem to affect cost-effectiveness. As administration costs per dose increase, it costs more to produce the same improvement in quality of health; another way to say this is that the cost-effectiveness ratio ($/QALY, $/DALY)—the ratio of
the incremental costs of the vaccine divided by the incremental benefits of the vaccine—increases. Workforce productivity does not affect cost-effectiveness because it is not included in these calculations. As administration costs (i.e., numerator) increase, the cost effectiveness increases.
For evaluating the net direct costs of vaccine use per year, shown in Figure D-2(c), $1,801 is used as a baseline. The graph shows that an increase in incidence, vaccine effectiveness, or health care costs will each result in a decrease in the net direct costs, whereas an increase in coverage or administration costs per dose increases the net direct costs of vaccine use per year. Workforce costs have no effect because they are not included in this calculation. An increase in the case fatality rate will lead to a reduction in net direct costs because a higher case fatality rate will result in more deaths and higher health care costs. Finally, because the net direct costs are calculated by subtracting health care costs from delivery costs, low delivery costs for a vaccine will lead to a decrease in net direct costs.
Next, the net direct costs of vaccine use per year and administration costs (a component of net direct costs) per vaccine dose were examined in relation to the length of immunity for a new influenza vaccine (see Figure D-3). The baseline scenario is represented by the points corresponding to a 1-year immunity. Length of immunity only influences the economic measure of net direct costs—as the length of immunity increases, the net direct costs of vaccine use per year decrease because of the reduction in
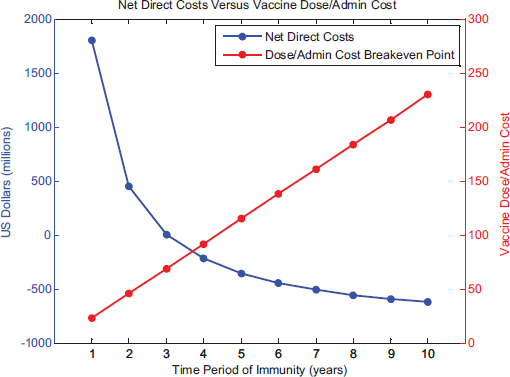
FIGURE D-3
Sensitivity analysis of the net direct costs and administration costs per dose of a vaccine with a given length of immunity for a new influenza vaccine for the United States.
vaccine delivery costs every year. This is because the model assumes that if the length of immunity is 5 years, one-fifth of the target population receives the vaccination each year so as to maintain constant rates of coverage and effectiveness. As a result, the breakeven cost of vaccine dosage and administration of a 5-year vaccine would be five times that of the 1-year baseline vaccine scenario.
A New Tuberculosis Vaccine for South Africa
Using a tuberculosis vaccine in South Africa as the baseline scenario, the health and economic attributes within the computational submodel were evaluated. Health-related attributes include premature deaths averted per year, incident cases prevented per year, QALYs gained per year, and DALYs averted per year. Specific parameters that were tested for sensitivity are the following: incidence of the disease, case fatality rate, coverage for a vaccine, vaccine effectiveness, administration costs per dose, health care costs and workforce costs. Each parameter is changed in 25 percent increments from the baseline in order to observe the resulting trend in attribute under consideration. Results on the health-related attributes are presented in Figure D-4.
Figure D-4(a) shows the test results for premature deaths averted per year. As incidence, case fatality rate, coverage, and effectiveness increase, there is a corresponding increase in premature deaths prevented per year. For the South African population, a new tuberculosis vaccine with high effectiveness and coverage, has the potential to avert more deaths per year.
Next, Figure D-4(b) shows the results of the sensitivity test on the number of incident cases prevented per year. The resultant trend shows that as vaccine coverage and effectiveness increase, the number of incident cases prevented per year increases as well. The case fatality rate does not affect the number of incident cases, although it is directly related to the number of deaths caused by tuberculosis.
Figures D-4(c) and D-4(d) use 91,529 QALYs gained per year and 151,336 DALYs averted per year, respectively, as baselines. It can be seen from the figures that the QALYs gained per year and DALYs averted per year are directly proportional to the disease incidence, case fatality rate, vaccine coverage, and effectiveness. Stated differently, an increase in the number of potential cases of tuberculosis, an increase in the deadliness of the disease, and an increase in the effectiveness or the coverage of the vaccine all result in greater vaccine-produced gains in health, measured either in terms of QALYs gained or in terms of DALYs averted.
To study the economic effects of the vaccine, sensitivity analysis was
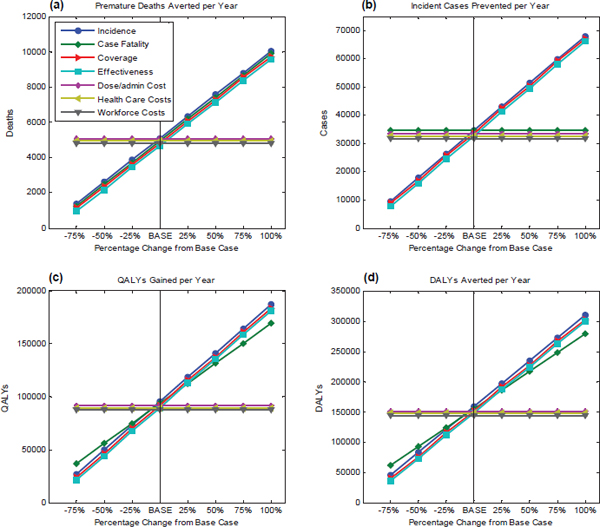
FIGURE D-4
Sensitivity analysis of the health-related attributes for a new tuberculosis vaccine for South Africa. The baseline scenarios from 2009 data were used to study the changes in 25 percent increments (–75% to 100%) for (a) premature deaths averted per year, (b) incident cases prevented per year, (c) QALYs gained per year, and (d) DALYs averted per year.
conducted using cost-effectiveness and annual costs as measures. Using –$734 per QALY gained (see Figure D-5[a]) and –$440 per DALY averted as the baseline (see Figure D-5[b]), all parameters were changed in 25 percent increments from the base case. As can be seen in the figure, as disease incidence increases, the cost-effectiveness ratio for a new tuberculosis vaccine decreases (that is, the value of the vaccine improves). However, an increase in the case fatality rate results in a higher cost-effectiveness ratio because the treatment for tuberculosis and anti-retroviral drug therapies are costly and those alive with long-term morbidities are more expensive to treat than those dying from tuberculosis. In calculating the cost-effectiveness ratio, one compares the overall health care costs with the vaccine (includ-
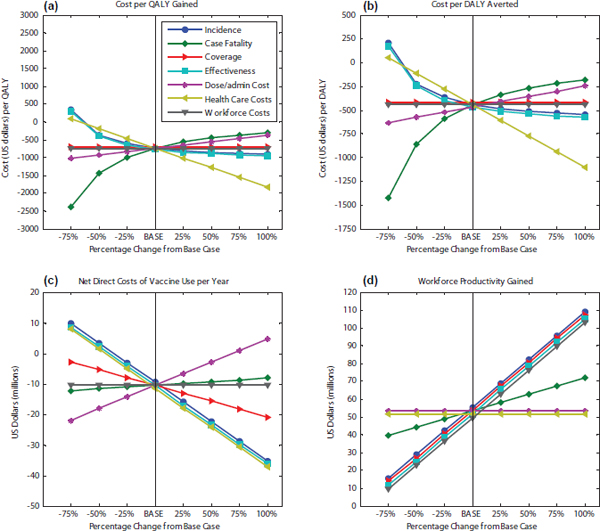
FIGURE D-5
Sensitivity analysis of the economic attributes for a new tuberculosis vaccine for South Africa. The baseline scenarios from 2009 data were used to study the changes in 25 percent increments (–75% to 100%) for cost-effectiveness using (a) QALYs and (b) DALYs, and for (c) annual net direct costs associated with the vaccine use and (d) workforce productivity gained per year.
ing the costs of vaccination) versus the health care costs without the vaccine, and when the case fatality rate is higher, the health care costs without the vaccine are lower, so that the difference between the cost with vaccine and cost without vaccine is greater, leading to a higher cost-effectiveness. That is the numerator of the cost-effectiveness ratio. The denominator—the increase in QALYs or DALYs resulting from the vaccine—will also increase with an increase in case-fatality rates, but not as quickly as the denominator increases. Thus, for a situation in which survivors of a disease impose a great long-term cost on the health care system, the cost-effectiveness ratio of the vaccine will increase when the case fatality rate is higher.
Conversely, the cost-effectiveness ratio decreases as the vaccine
effectiveness increases. Coverage does not affect cost-effectiveness. Nor do workforce costs because they are not included in this calculation.
For evaluating net direct costs of vaccine use per year (see Figure D-5[c]), –$10 is used as the baseline. One can see from the figure that an increase in incidence, vaccine effectiveness, or health care costs will result in a decrease in net direct costs. However, as the case fatality rate increases, the annual net direct costs of vaccine use also increase. The net direct costs (delivery costs-health care costs) rise because of the reduction in health care costs caused by people dying young. This is because a higher case fatality rate results not only in more deaths but also in a reduction in health care costs because, unlike the case in the United States, in South Africa the costs associated with death from tuberculosis are less than the health care costs for treatment of living tuberculosis patients.
This evaluation exercise revealed interesting insights. Calculated health attributes of cases and deaths prevented per year appear to be influenced predominantly by the incidence and case fatality rate caused by the disease, both of which are also included in computing QALYs and DALYs. Anticipated vaccine coverage and effectiveness affect the potential health impact of a vaccine, altering either or both of these parameters can provide users an insight into the ideal range for effectiveness and coverage necessary to achieve the desired health effects.
The sensitivity analysis shows that the health and economic impact of a vaccine is influenced by the anticipated effectiveness and coverage desired from the vaccine as well as the initial health and economic disease burden that can be averted by the candidate vaccine. Therefore, a hypothetical tuberculosis vaccine in South Africa capable of averting 4,935 premature deaths per year (see Table D-2) alludes to the high mortality caused by the TB virus. A potential new tuberculosis vaccine can also lead to a reduction in net direct costs of 10 million per year, this is so because hypothetically the TB vaccine would confer lifelong immunity thus reducing the number of people requiring a vaccine every year. Consequently, yearly vaccine delivery costs would dwindle while the vaccine would remain cost effective, the $/DALY ratio of –440 suggests a potential greater improvement in health (by averting DALYs) for lower costs.
The computational submodel performed as expected—absent user preferences (i.e. the value submodel), a vaccine is most desirable if it produces a large health gain for the least financial investment. A hypothetical human papillomavirus vaccine in the United States is most cost-effective with $/QALY ratio of –3,903 (see Table D-1), assuming an increase in QALYs, a negative number indicates lower costs in the long run. A potential new influenza vaccine has considerable direct costs, $1,801 million,
because the vaccine only confers immunity for one season, i.e. it needs to be administered every year (high delivery costs) and has high morbidity associated with the disease (high health care costs). However, despite the high direct costs, the hypothetical influenza vaccine can lead to large workforce productivity gains, $3,345 million, due to the large number of flu cases prevented each year.
Ideally, a vaccine candidate would reflect the least amount of net direct costs per year, which are calculated as delivery costs–health care costs. Correspondingly, in an ideal situation, the delivery costs for the vaccine would be low because the long length of conferred immunity would preclude many from receiving the vaccine each year while the health care costs associated with the targeted disease would decrease as the vaccine would reduce mortality and morbidity initially caused by the disease. Such a vaccine would also have a low cost effectiveness rate with larger gains in health (i.e., QALYs) and lower costs.
Lastly, because health and economic measures of a vaccine are quantifiable and are generally the important elements in decision making, users interested in these aspects of a vaccine will rank health and economic attributes highly, thus weighing health and economic measures highly within their SMART Score output. Hence, a detailed understanding of the quantifiable attributes will inform the user in selecting, ranking, and weighing attributes.


