3
Data Synthesis, Software Redesign, and Evaluation
The data collection and the software programming for SMART Vaccines proceeded simultaneously, and both were informed by feedback from various stakeholders. The committee chose to retain the United States and South Africa, the test countries selected for Phase I of the SMART Vaccines development, for use in Phase II. These two countries not only have different income, health, and demographic profiles, but they also have different social and economic priorities for developing and delivering new vaccines. South Africa was chosen, in part, because data were available from that country with which to test the vaccine candidates selected in both Phase I and Phase II. The early part of this chapter is devoted to describing the committee’s data synthesis efforts and the latter part toward describing the software prototyping efforts.
Selection of Vaccine Candidates
In Phase I the committee selected influenza, tuberculosis, and group B streptococcus as test vaccine candidates for the United States, and tuberculosis as a test vaccine candidate for South Africa. Supporting data for these candidates are presented in an appendix of the 2012 Institute of Medicine (IOM) report.
The committee was tasked to test three additional vaccine candidates in Phase II. The committee members began with a list of hypothetical vaccine candidates for seven infectious agents: cholera, dengue, human immunodeficiency virus, human papillomavirus, rotavirus, pneumococcal
infection, and malaria. The committee chose human papillomavirus, rotavirus, and pneumococcal infection as the test cases for evaluation; licensed vaccines currently exist for the causative agents of each of these three diseases.
The purpose of including these candidate vaccines in SMART Vaccines was to demonstrate the functionality of the software. Each vaccine candidate offers a scenario that may arise in the process of developing and delivering a new preventive vaccine. These scenarios may include decision points that arise in the development and distribution of a vaccine that is aimed at a particular disease and that has certain intended health and economic benefits.
Because vaccines for human papillomavirus, rotavirus, and pneumococcal infection currently exist, the committee considered their inclusion in the model as providing test examples of the process one goes through in developing improved vaccines by such methods as including adjuvants, increasing effectiveness, or reducing doses. Another reason for the selection of these three particular vaccines is that each targeted disease affects a different population and has different health implications: Human papillomavirus infects sexually active individuals and can lead to anal or cervical cancer over time; rotavirus affects children, and this burden is greater in low-income countries; pneumococcal disease is known to affect young children and the elderly population worldwide.
Disease profiles for these three diseases as well as for the diseases targeted by the vaccine candidates evaluated by the Phase I committee—influenza, tuberculosis, and group B streptococcus—are provided in Appendix B. A snapshot of the data needs for SMART Vaccines is presented in Table 3-1. Due to time constraints in the Phase I study, data for South Africa were collected only for tuberculosis; for the United States, data for influenza, tuberculosis, and group B streptococcus were collected.
In this study, the data for human papillomavirus, pneumococcal infection, and rotavirus were collected for both the United States and South Africa. Thus, a total of six datasets for the United States and four for South Africa are available as downloadable spreadsheets (along with the SMART Vaccines software package) on the Institute of Medicine and the National Academies Press websites. Data sources for the necessary parameters are provided in the spreadsheets along with explanatory notes and references. For ease of use, SMART Vaccines 1.0 contains these datasets pre-populated as defaults.
TABLE 3-1
A Snapshot of Data Required for SMART Vaccines 1.0
| Parameter | Data Available in the Public Domain | Data Requiring User Estimation |
| Demographics |
• Life Tablesa • Standard Life Expectancya |
• Health Utility Index 2 • Hourly Wage Rate |
| Disease Burden |
• Incidence • Case Fatality Rate |
|
| Disease Morbidity |
• Disutility (Tolls)b • Disability Weightsb • Durationb |
• Percent of Cases • Costs (Hospital, Outpatient, Medication)b |
| Vaccine Characteristics |
• Target Populationa • Coverage • Effectiveness • Length of Immunity • Doses Required per Person |
• Herd Immunity • Time to Adoption • Cost per Dose • Administration Cost • Research and Development Costs • Licensure Costs • One-Time (Start-Up) Costs |
a Standard data irrespective of the vaccine candidates.
b Requires case-by-case judgment and modification for specific vaccine complications or morbidity.
The data gathered by the committee are by no means the best or the most detailed estimates for each disease. They are neither precise projections nor comprehensive analyses. For example, there are data available on the burden of influenza and on the impact of seasonal influenza vaccines in the United States, but because there are no currently licensed vaccines for group B streptococcus, the only data available from the United States for that disease concern the disease burden, with nothing on the impact of a vaccine if it were licensed; thus, the vaccine information for group B streptococcus is largely hypothetical. In fact, much of the information required for SMART Vaccines, especially the information related to the use of the vaccines in low-income countries, was based on the opinions of the committee members.
A significant concern regarding the committee’s data analysis was the variability and the lack of standardization in surveillance methods. While data may be widely available for certain parameters, the committee thought it important to use only those data that had been collected using standard, comparable methodologies. To ensure the quality of the data, public sources such as peer-reviewed literature, the World Health Orga-
nization, the Centers for the Disease Control and Prevention, and publications of national health agencies were used as often as possible. Data sourcing and methodology are discussed in Appendix C.
Development of a Test Model to Inform Software Redesign
In Phase II, as part of the model enhancements, the committee developed a spreadsheet prototype to illustrate the possibilities of a dynamic weight-adjustment tool and to show how real-time graphical changes could facilitate the user’s prioritization process. Figure 3-1 shows an early prototype interface that allowed the user to rank selected values. This interface served as an evolving “test bench” prototype that the committee used to make changes and to incorporate stakeholder feedback obtained during the public presentations. In short, the spreadsheet in the screenshot is an experimental draft shown in order to illustrate the committee’s back-end work as SMART Vaccines 1.0 underwent interface redesign.
This prototype spreadsheet allowed the committee members to select up to 10 attributes, with pop-up boxes featuring quick definitions. In Figure 3-1, for example, nine attributes have been chosen (indicated by check marks in the left-hand column). Those nine attributes are ranked from 1 to 9 (in the second column). The most important attribute is ranked 1, and the least important is ranked 9. The fourth column (in yellow) shows the weights as calculated by the rank order centroid method. The slider bars in the third column (labeled “fine adjustment”) allow users to adjust the computed weights. This feature illustrates the committee’s early efforts to provide users with an option to carry out intuitive sensitivity analyses without needing to understand the details of the multi-attribute utility model.
The attributes shown in Column 5 are collected into groups, each with a colored heading—purple for “health considerations,” maroon for “economic considerations,” yellow for “demographic considerations,” dark blue for “intangible values,” and so on. These same colors appear in the bar graph at the lower right corner of the screen that shows the calculated SMART Scores for five hypothetical candidate vaccines: an influenza vaccine with 1-year efficacy, an influenza vaccine with 10-year efficacy, a group B streptococcus vaccine costing $100 per dose, a group B streptococcus vaccine priced at $50 per dose, and a tuberculosis vaccine that does not achieve any herd immunity. Each vaccine bar is divided into colored sections showing how much each of the nine attribute categories adds to the SMART Score for that vaccine.
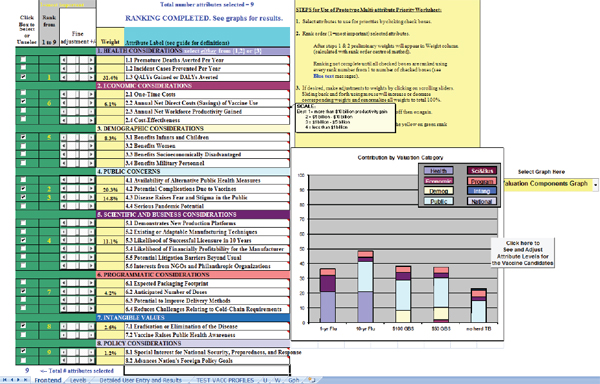
As users change the ranking and then fine tune the weights for each chosen attribute, the heights of the bars for each candidate vaccine adjust automatically. Thus, users can interactively see the effect of altering their weights immediately—by making changes to the rank order, or by fine tuning of the weights calculated by the rank order centroid method as part of the sensitivity analysis.
Interface Redesign for SMART Vaccines 1.0
In Phase I the blueprint of SMART Vaccines Beta was developed using three software tools: MATLAB for the algorithm, Java servlets for the middleware, and Axure for visual interface design, with Microsoft SQL Server used for preliminary database management. Stakeholder feedback made it clear that SMART Vaccines needed to be developed in a simpler, platform-independent fashion to aid the end users. Therefore, the committee elected to use MATLAB as the sole programming platform for developing, testing, and producing a downloadable and executable package for SMART Vaccines 1.0. This choice was made easier by enhancements to MATLAB that allowed it to be used both for implementation of the model and for the creation of a dynamic, cross-platform user interface. Data can be directly entered or imported from spreadsheets into SMART Vaccines for application and storage.
To illustrate the current operational features of SMART Vaccines 1.0, this section includes a step-by-step screenshot tour. SMART Vaccines 1.0 is substantially different from the SMART Vaccines Beta presented in the 2012 report (IOM, 2012). The committee appreciated how direct data entry using the previous software interface format could be burdensome to the user, and hence it spent substantial efforts to simplify data entry with the goal of making it more efficient and intuitive.
Figure 3-2 shows the welcome screen of SMART Vaccines 1.0. Here, users are presented with the disclaimer that stresses that SMART Vaccines is a decision-support system and not a decision making tool.
By clicking on the radio buttons (selectable circles) at the top, the user can select what to enter and how to use the program. Relevant screens appear when the user selects any of the “Specify” or “Evaluate” buttons. For instance, by selecting “Attributes” the user is taken to a screen where each vaccine candidate’s attributes are chosen; selecting “Weights” takes the user to a screen where attributes are ranked and weighted; and selecting “Priorities” allows the user to observe the priority rankings calculated by SMART Vaccines once all of the relevant data entry has been completed. The user has the option either to proceed linearly through the program
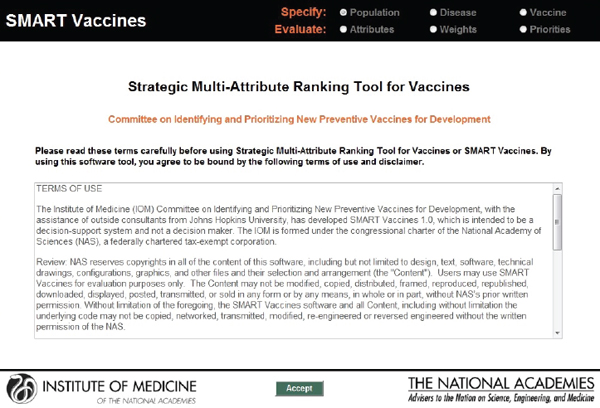
FIGURE 3-2
Welcome page presenting the terms of agreement and disclaimer. SMART Vaccines 1.0 was developed on a MATLAB platform with a redesigned user interface.
using the “Continue” buttons or to skip to certain sections, thereby making possible a division of labor among data collection, attribute selection, and weighting.
The next screenshot (see Figure 3-3) shows a typical data page—in this instance, demographic data for females in the United States that can be specified using a pull-down menu. As noted earlier, the basic population data can normally be taken directly from institutions that maintain various databases, such as the World Health Organization.
For infants, for children from 1 through 4 years of age, and then for each 5-year age group after that (5 through 9, 10 through 14, and so on), SMART Vaccines requires the number of persons in each age group, the number living at the end of the period, the life years that the group members are expected to have, their life expectancy, and a standard life expectancy used in calculating disability-adjusted life years (DALYs).
The health utilities index (HUI2) provides the quality adjustment for a typical person in each age category, which is used in calculating quality-adjusted life years (QALYs). Finally, the hourly wage rate (converted to U.S.
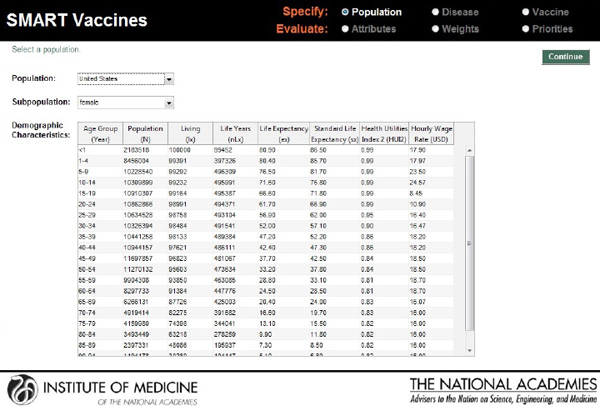
FIGURE 3-3
SMART Vaccines 1.0 screen where the user specifies the population information (by age and sex) to be used for ranking vaccines.
dollars) gives a simple estimate of the value of time lost to illness for this population.
In the screenshot shown in Figure 3-4, the user defines the characteristics of the disease for which candidate vaccines might be targeted. SMART Vaccines treats the disease characteristics separately from vaccine attributes, because the user may wish to consider a number of different vaccines that might apply against the same disease.
In the example shown in Figure 3-4, the first block of data describes the disease impact on the relevant population (in this case, females in the United States), categorized by age group, but in less refined groupings than the actual population data. This approach is intended to reduce user burden in data entry, reflecting the many cases where more refined disease burden data may not be available. The population data include the number of people in each age group (calculated automatically from the population data if entered previously), the annual incidence per 100,000 people, and the case fatality rate (probability of death, conditional upon contracting the disease).
The second block of data on this page shows the disease burden,
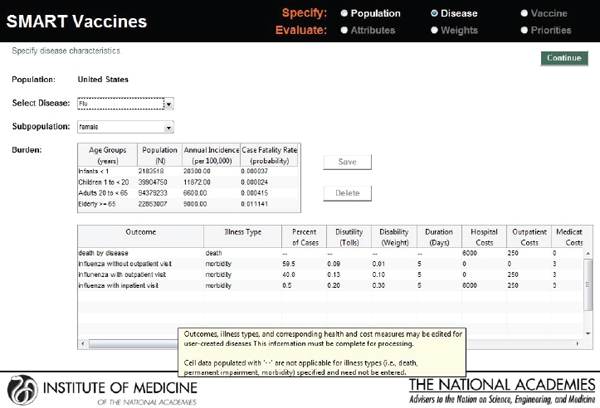
FIGURE 3-4
SMART Vaccines 1.0 screen where the user defines the burden of the selected disease, including morbidity scenarios and quality-of-life scores. Mouse-over pop-ups guide the user with additional information on the parameters.
breaking the cases down into categories of severity, including death, and categories of required treatment (without outpatient treatment, with outpatient treatment, and with inpatient hospital care). For each of these categories the user must enter the costs of providing each type of treatment (hospital costs, outpatient costs, medication costs, and other costs) as well as the disease duration and the disability tolls (for DALYs) or weight (for QALYs).
The user then enters vaccine characteristics—a central component of the priority-setting process—in the screen shown in Figure 3-5. In this example, which involves information concerning an influenza vaccine for the U.S. female population, separated into several age groups, the user specifies (using check marks) which age groups might appropriately receive the vaccine, the percent receiving the vaccination (coverage), and the effectiveness of the vaccine. It also provides the option of making herd immunity present or absent by using a check box.
The second block on this screen requires data about the vaccine candidate itself—the duration of immunity conferred, the time to adop-
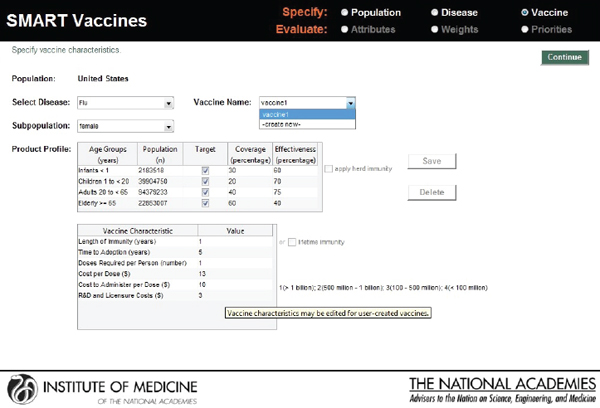
FIGURE 3-5
SMART Vaccines 1.0 screen where the user enters such information as the product profile characteristics and other characteristics related to the vaccines being ranked.
tion, doses required, cost per dose, administration cost, and estimates of research and development cost, licensure cost, and one-time start-up costs.
In the next step, the user selects the vaccine attributes of interest. The attributes selected and the weights attached to them apply to every candidate vaccine (see Figure 3-6). In SMART Vaccines 1.0, the user can click a radio button for any category to bring up the list of attributes within that group. Using a check box, the user can then select the attributes that will be entered into the analysis.
In this screenshot the set of attributes in the category “Health Considerations” is shown, and the user has selected “Incident cases prevented per year” and “Quality-adjusted life years gained.” In the subsequent screenshot (see Figure 3-7), the selection of attributes in the category “Scientific and Business Considerations” is shown. The user has selected “Likelihood of financial profitability for the manufacturer,” “Demonstrates new production platforms,” and “Interest from NGOs and philanthropic organizations.” This set of attributes might be chosen by, say, a vaccine manufacturer, whereas a different user might select a completely different set. Figure 3-8 shows the empty fields in which users can enter user-
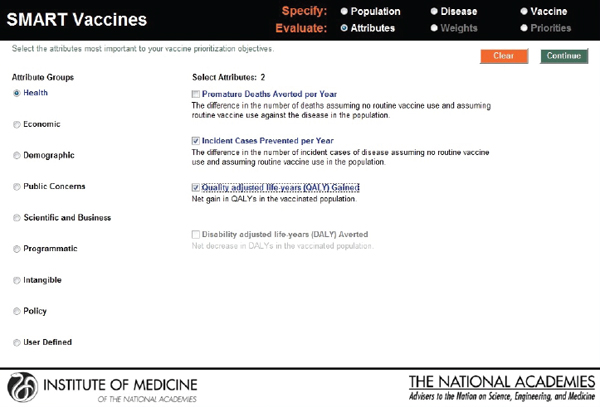
FIGURE 3-6
SMART Vaccines 1.0 attribute selection page that permits the user to select and subsequently rank the attributes of importance listed in nine categories from health to policy, including up to seven user defined attributes.
defined attributes. Currently, SMART Vaccines 1.0 can only handle binary options for user-defined attributes—that is, any attribute defined by the user is answered with either yes or no.
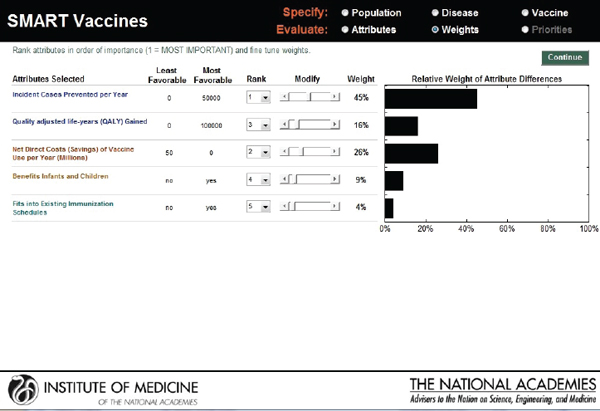
The next screen (see Figure 3-9) appears in the form of a ranking dashboard and shows the attributes selected by this hypothetical user from all of the categories (note the color coding). The user assigns a rank to each of the seven chosen attributes. The weights calculated by the rank order centroid method appear in the bar chart on the right, with the greatest weight being applied to the attribute with the highest ranking.
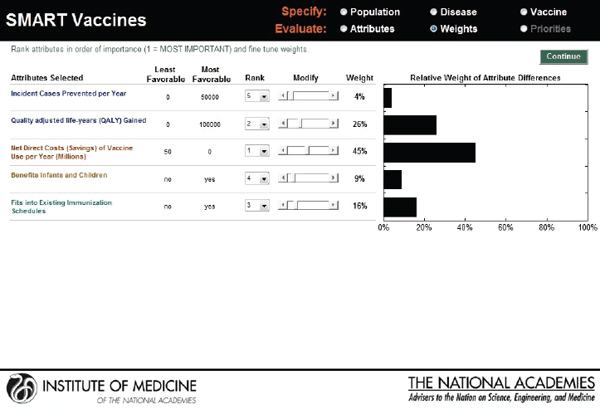
As with the prototype discussed earlier, the slider bars allow the user to modify these preliminary weights (calculated by the rank order centroid method) up and down (see Figure 3-10), and SMART Vaccines automatically recalculates the weights on other attributes so that the weights continue to sum to 100 percent (a requirement of the multi-attribute utility model). More radical changes in weights can be accomplished by altering the rankings altogether. In this example, the user has increased the weights placed on “Likelihood of financial profitability for the manufacturer” from 4 percent in Figure 3-9 to 31 percent in Figure 3-10, thus making this the
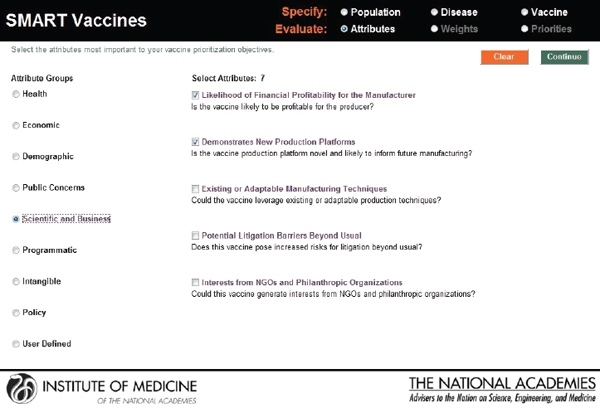
FIGURE 3-7
SMART Vaccines 1.0 attribute selection page, continued.
attribute with the highest rank. The weight on “Incident cases prevented per year” has been decreased from 37 percent to 20 percent, making it the second highest ranking attribute. Other attributes’ weights have been automatically adjusted so that the final sum of the weight’s percentages is 100.
This screen also informs the user of the range of outcomes built into the SMART Vaccines. For example, for the attribute “Incident cases prevented per year,” the least favorable outcome is 0 (i.e., the vaccine has no effect on preventing the disease incidence), while the most favorable outcome is 100,000.
Furthermore, in SMART Vaccines 1.0 any sensitivity analysis conducted on vaccine attributes, disease burden, and utility-function weights is a one-way sensitivity analysis allowing the user to alter one set of numbers (e.g., the weights). The resulting SMART Scores are conditional on the specific numbers assigned for the vaccine attributes and disease burden (additional information can be found in Appendix D). Similarly, once the weights are set, the user can conduct a sensitivity analysis on the characteristics of a potential vaccine (recalling that the vaccine characteristics are unknown before the vaccine exists), but in this case the sensitivity analysis hinges on the weights assigned to each attribute. Thus, a sensitivity analysis in which the characteristics of a potential new vaccine were altered
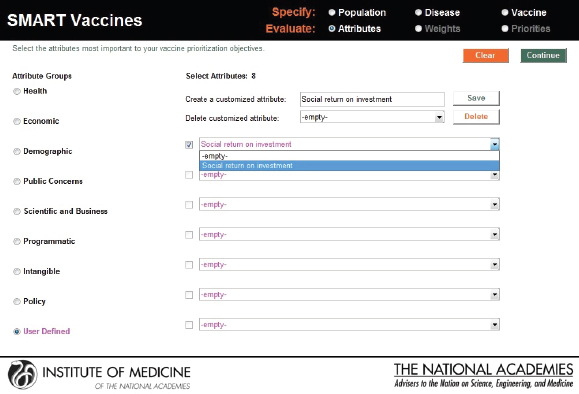
FIGURE 3-8
User-defined attributes permit inclusion of up to seven new qualitative attributes that can be answered with a yes or a no response.
using the utility weights assigned by user A will give different results from an identical sensitivity analysis in which the vaccine characteristics of a potential new vaccine were altered using the utility weights assigned by user B.
In the final output screen (see Figure 3-11), the user-selected attributes are listed on the far left side, with color coding to indicate their attribute category. The user is provided an option to compare multiple vaccine candidates using the horizontal pull-down menus for the population originally selected. The computed values appear automatically for each of the vaccine candidates that are selected, with scoring indicated in parenthesis.
The categorical values that require the user’s judgments include pull-down menu options with selections ranging from Yes or No to Level 1 through Level 5. As soon as the selections are made, a bar graphical representation of SMART Scores appears on the right hand side (see Figure 3-12).
In the screen shown in Figure 3-12, a hypothetical influenza vaccine has the highest score (75) in the comparison pool, while the human papillomavirus vaccine has the lowest score (25), based on the user’s preference structure. The resulting SMART Scores are color coded to indicate
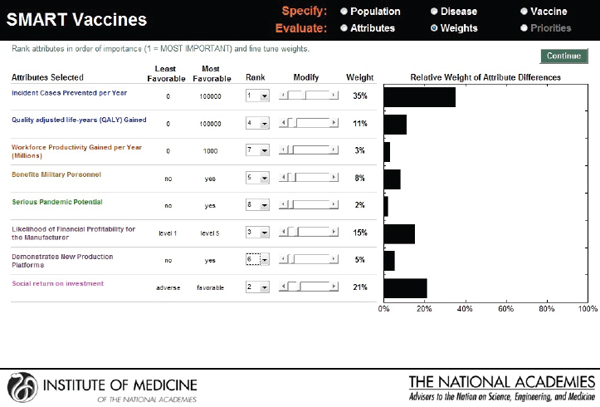
FIGURE 3-9
SMART Vaccines ranking dashboard showing initial weights produced by the rank order centroid method. The dynamically adjustable rank order centroid weights (presented as graphs) can be adjusted up or down using slider bars. Alteration of weights and ranks are permitted for the user to conduct “What if?” analyses.
the weight of the user-selected attributes on the final output. In this case the health-related attributes (dark blue) received the highest priority from this user, while the attributes related to vaccine’s capacity to create new production platforms (violet) received the lowest priority.
The SMART Score is also normalized for the entire population even though the initial population specifications were stratified by sex to reflect the differences in life expectancy, quality of life, and the variation of disease effects in males and females. The computational submodel calculates health and economic measures for both sexes as an aggregate. Thus, the user can interpret and compare the SMART Scores among two or more candidate vaccines for the total population.
The user is allowed to carry out real-time sensitivity analysis by making changes to three key components of the SMART Score that rely on user input—the utility weights, the vaccine characteristics, and the disease burden data. The user can also make changes to the weights that are pre-applied and see instantaneous shifts in the SMART Scores on different screens (see Figures 3-13, 3-14, and 3-15).
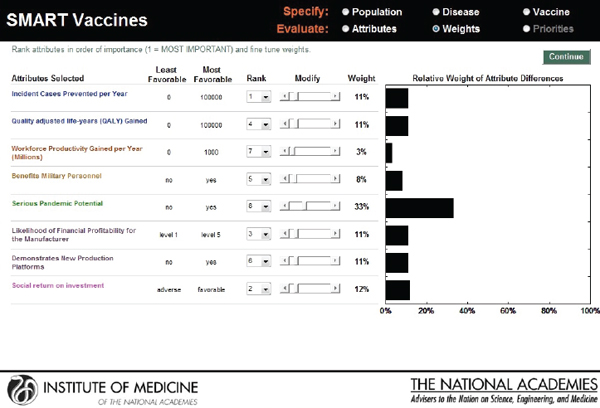
FIGURE 3-10
SMART Vaccines ranking dashboard showing the dynamically adjustable rank order centroid weights (presented as graphs) using slider bars. The alteration of weights and ranks is permitted for the user to be able to conduct “What if?” analyses.
In SMART Vaccines 1.0, sensitivity analysis is limited to one-way analysis only, but the user can construct two-way or higher analysis by conducting a series of one-way analyses with different values for the second variable under consideration. The output screen for SMART Vaccines 1.0 was significantly redesigned from the version presented in the Phase I report in response to stakeholder feedback.
Representative Use Case Scenarios
The committee then developed hypothetical case scenarios to illustrate the potential use of SMART Vaccines in different settings and from different perspectives. Two such scenarios are discussed in this section, with each scenario involving the perspectives of two users with different attribute and ranking structures. Rank order centroid weights are used in all the scenarios as an illustration, although, as noted earlier, it is possible to adjust the weights with the slider bars in accordance to the user’s preferences.
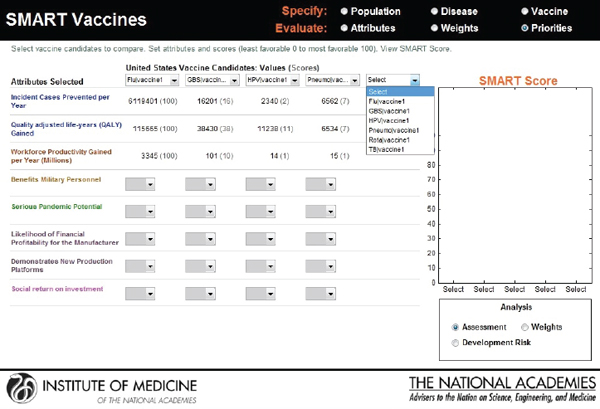
FIGURE 3-11
Output screen for SMART Vaccines. Computational values are instantaneously produced for each of the vaccines under comparison, which can be selected by pull-down menus.
Users with Different Attributes and Different Ranking Systems for Two New Vaccines
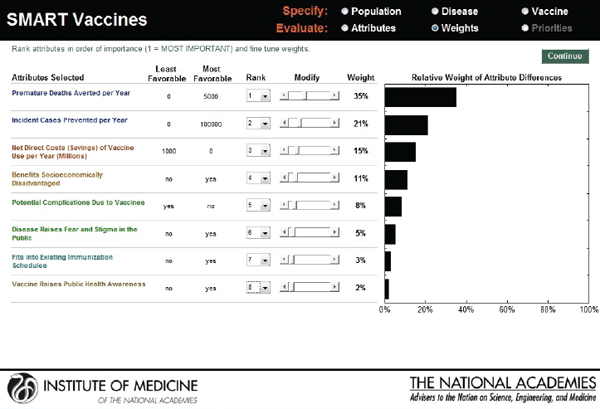
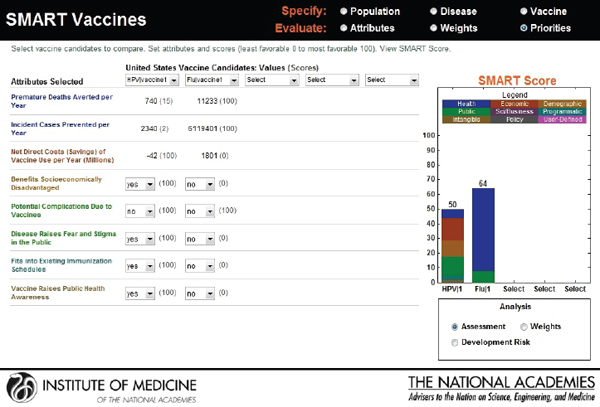
Hypothetical user A is a federal agency director in the United States interested in evaluating two new vaccine candidates: a preventive vaccine for human papillomavirus and an influenza vaccine. He sets his value preference with highest ranks for health burden reduction, through the measures of premature deaths averted per year (weighted at 34 percent) and incident cases prevented per year (weighted at 21 percent), followed by economic and other attributes. Figure 3-16 shows the attributes selected, their ranks, and the rank order centroid weights. In Figure 3-17, the selected attributes are combined to produce SMART Scores of 50 for a new human papillomavirus and of 64 for a new influenza vaccine that are based on user A’s preference structure.
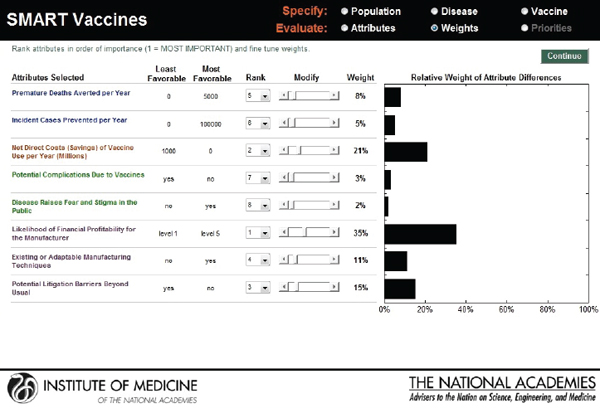
Hypothetical user B, also from the United States, is a senior executive in a major pharmaceutical firm. She is interested in the prioritization of a new human papillomavirus vaccine versus an influenza vaccine. Figure 3-18 shows that she has ranked the likelihood of financial profitability for her company as her top prioritiy, while the last rank is assigned to
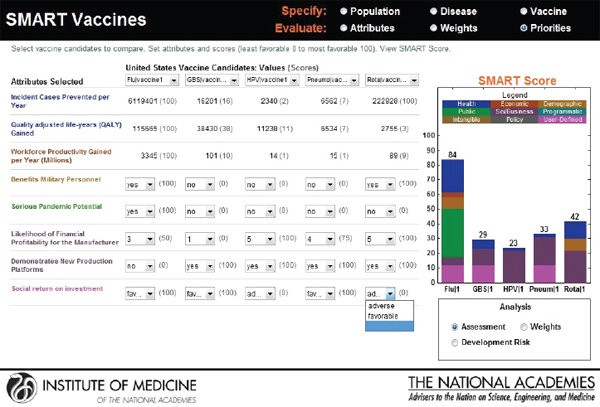
FIGURE 3-12
Output screen for SMART Vaccines. Qualitative values are combined with the computed values to produce a color-coded bar graph showing the SMART Scores for the vaccines under comparison. Real-time sensitivity analysis is possible through the user’s adjustment of values, disease and vaccine characteristics, and weights.
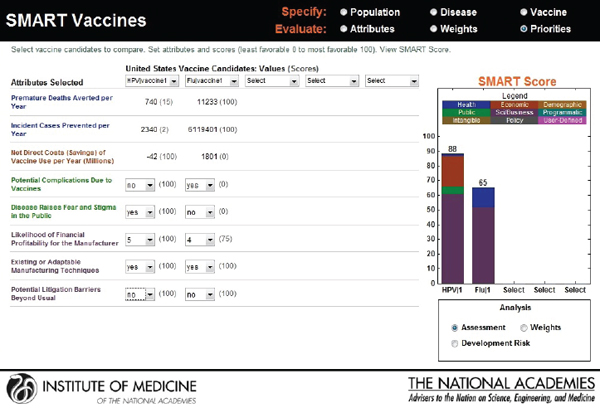
reducing challenges relating to cold-chain requirements. Figure 3-19 indicates SMART Scores of 88 for a new human papillomavirus and of 65 for a new influenza vaccine that are based on user B’s selected attributes. This scenario demonstrates how user A and user B selected and ranked different attributes in their prioritizations of identical new vaccine candidates and obtained different results. According to user A’s attribute and ranking structure, influenza vaccine is a better candidate, while user B’s preferences identify human papillomavirus as the best investment option for her company.
Users with Same Attributes But Different Ranking Systems for Two New Vaccines
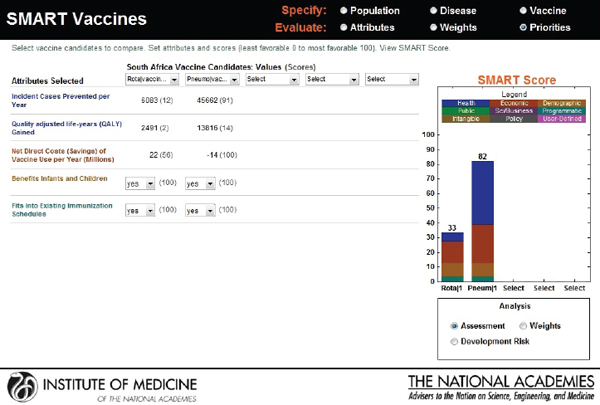
As an extension to the above scenario, but in a different context—South Africa—suppose that user X (a hypothetical health minister) and user Y (a hypothetical finance and trade minister) are interested in comparing two
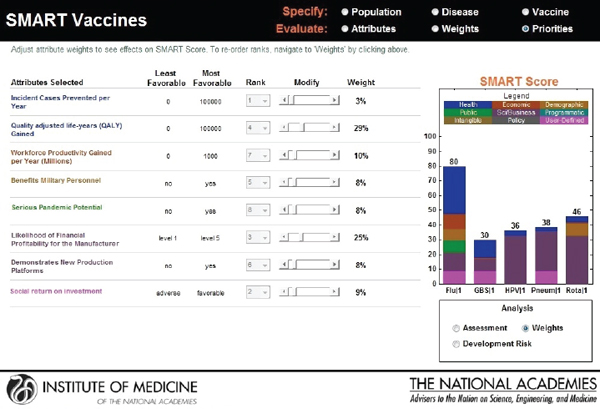
FIGURE 3-13
Output screen for SMART Vaccines permitting sensitivity analysis based on adjustment of weights.
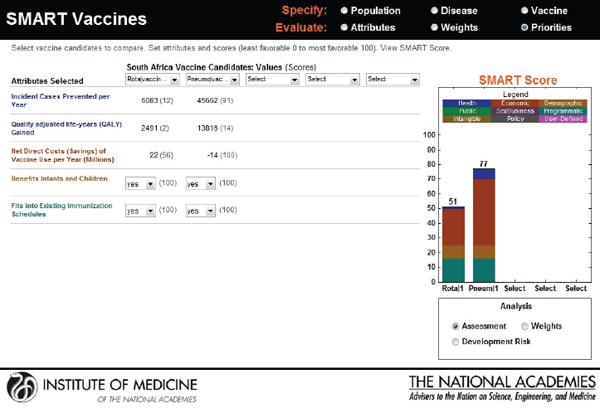
new candidates: a rotavirus and a pneumococcal vaccine. Though the users choose the same attributes—see Figure 3-20 for user X and Figure 3-21 for user Y—their rank orders for the selected attributes are different. User X has ranked incident cases prevented per year as most important, whereas user Y has selected net savings resulting from vaccine use as having the highest priority, with the other ranks also varying according to the different perspectives of the two users.
Figure 3-22 shows user X’s comparative scores: a 33 for rotavirus and an 82 for pneumococcal vaccine. User Y’s results are shown in Figure 3-23: a SMART Score of 52 for rotavirus and of 77 for pneumococcal vaccine. The users may have arrived at these scores independently, but now their SMART Scores could enable a discussion between them. In this case, the “winner” in both cases is pneumococcal vaccine, albeit with slightly different scores. If user X and user Y had settled on other sets of attributes and value judgments, then their preferences could have led to quite different results, as often happens in real-world scenarios. Regardless of the outcome, however, the SMART Scores can help start a discussion between the users in which they compare their differing values and results.
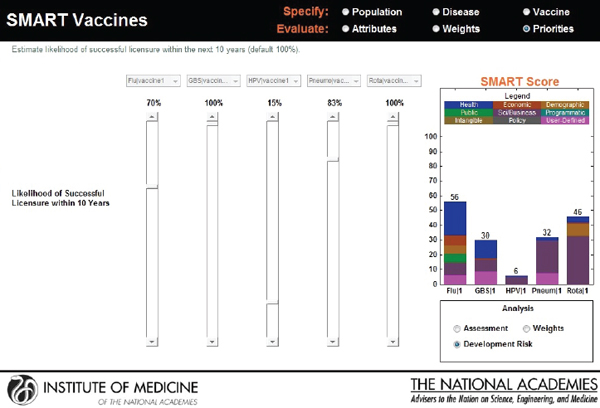
FIGURE 3-14
Output screen for SMART Vaccines permitting sensitivity analysis based on adjustment of development risk.
Users’ Evaluation of the Prototype
The committee engaged seven potential users to provide comments on the user interface and functionalities relating to an early prototype of SMART Vaccines 1.0. These consultant evaluators participated in a webinar led by a committee member. Three evaluation sessions were conducted, with two of them lasting 1 hour each (one and two participants, respectively) and a third session lasting about 90 minutes (four participants). These sessions, which were carried out via a remote desktop connection, were intended to illustrate the dynamic capabilities of the software and to engage the evaluators in constructing possible evaluation scenarios. The evaluators were given a set of framing questions (see Box 3-1) in advance of the demonstration sessions as a way of directing the focus of their feedback during those sessions.
The reactions of the evaluators were overall very positive concerning the design and innovation underlying SMART Vaccines. In addition to this positive overall response, the consultants also provided feedback about possible further improvements and explored potential additional applications of SMART Vaccines, which are discussed in Chapter 4. Moreover,
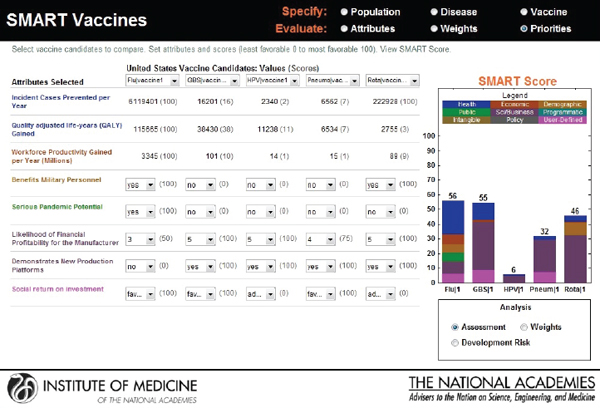
FIGURE 3-15
Output screen for SMART Vaccines permitting adjustment or reassessment of original scores.
during the review process, external reviewers of this report participated in a webinar session containing the software demonstration and offered feedback. Subsequently, the prototype evaluators were re-engaged to allow hands-on interaction with SMART Vaccines and to provide additional feedback prior to the software and report release.
BOX 3-1
Framing Questions for Evaluators of SMART Vaccines 1.0
• Do you foresee using SMART Vaccines in the decision-making process of your organization?
• What additional features would be desirable in SMART Vaccines?
• Could the SMART Score be persuasive in guiding you to a decision?