


Below is the uncorrected machine-read text of this chapter, intended to provide our own search engines and external engines with highly rich, chapter-representative searchable text of each book. Because it is UNCORRECTED material, please consider the following text as a useful but insufficient proxy for the authoritative book pages.
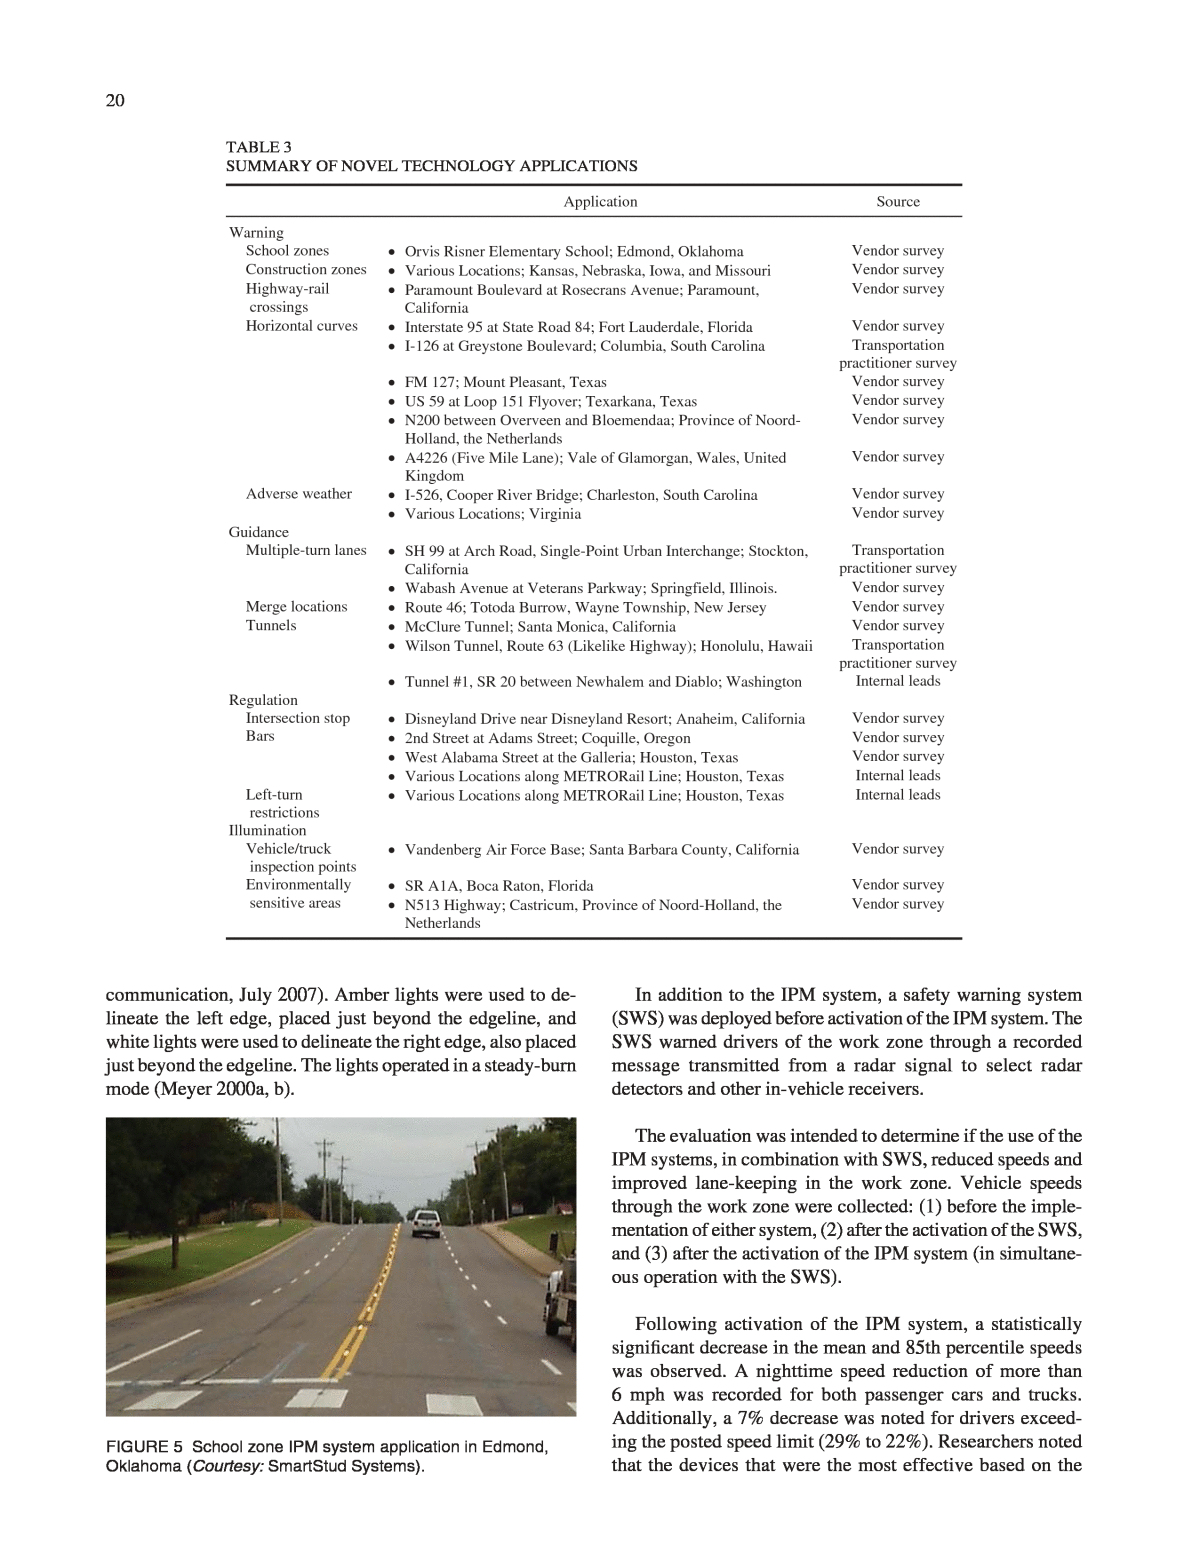
19 This chapter details experiences from recent IPM system applications, including documentation of system and facility characteristics, operation modes, installation and construc- tion methods, maintenance requirements, system costs, and perceived and measured effectiveness. Applications are categorized by their function: to warn, guide, regulate, or provide illumination for road users. Table 3 lists novel IPM system applications, identified primarily through the trans- portation practitioner survey and the IPM system vendor survey. WARNING With the primary intent to warn road users, IPM systems have been implementedâas an isolated system or in combination with other warning devicesâin school zones, in construction zones, at highwayârail crossings, along horizontal curves, and in areas that experience frequent adverse weather. School Zones As a natural outgrowth of pedestrian crosswalk applications, IPM systems have recently been implemented to provide supplemental warning in school zones. Risner Elementary School, Edmond, Oklahoma In 2000, the city of Edmond, Oklahoma, installed an IPM system at the Orvis Risner Elementary School to augment flashing school zone beacons that are activated during spe- cific periods in the morning and afternoon. Yellow IPM sys- tem markers are placed along the double yellow centerline through the school zone (see Figure 5). The first installation had the markers spaced at a distance of 50 ft; subsequent in- stallations have reduced the marker spacing to 25 ft. The IPM system is activated 30 min before, and deacti- vated 10 min after, classes begin in the morning. In the after- noon, the system is activated 10 min before, and deactivated 30 min after classes end. The system operates in constant flash mode when activated. Because the times of operation are only during daylight hours, the city had engaged the system vendor to enhance the luminous intensity of the markers in daylight conditions. Some issues related to water penetration and subsequent elec- trical failures were reported with this system. Also, a recent ice storm required contractors to âbladeâ the streets, resulting in the accidental removal of the IPM system markers. Costs for the original system, installed before the 2000â2001 school year, totaled $38,000. The city of Edmond budgets $55,000 each year for school zone improvements, which now include IPM systems, as well as signalized count- down pedestrian crossings and real-time, radar-based driver feedback speed signs (T. Minnick, personal communication, Aug. 8, 2007). To measure the effectiveness of the IPM system in enhanc- ing school zone safety, vehicle speed data were collected before the system was installed and seven months after the activation of the system. The incidence of speeding in the school zone was approximately 30% before the installation of the IPM system and dropped to 19% after the installation. Additionally, a survey was conducted to determine how par- ents, police, teachers, and bus and daycare van drivers reacted to the IPM system. The survey showed that 95% of the re- spondents had noticed the IPM system, 93% believed the IPM system increases awareness of the school zone, and 89% believed the system improves safety in the school zone (Speeding . . . 2002). Construction Zones Various LocationsâIowa, Kansas, Missouri, and Nebraska In 1999, a collaborative study of smart work-zone technology was performed by the State Departments of Transportation in Iowa, Kansas, Missouri, and Nebraska (the Midwest Smart Work Zone Deployment Initiative) (Meyer 2000b). One of the technologies tested during the deployment initiative was an IPM system. During the deployment, the westbound lanes of I-70 in Kansas were closed and two-way traffic was redirected to the two eastbound lanes, approximately 10 miles east of Salinas, Kansas. An IPM system was used to delineate the general traffic lanes and the crossover traffic lanes from the west- bound side of I-70. The IPM system markers were installed using a âtemporaryâ asphalt adhesive at a distance of 50 ft apart for approximately 1,200 ft (M. Harrison, personal CHAPTER THREE APPLICATIONS OF IN-PAVEMENT MARKER TECHNOLOGY
communication, July 2007). Amber lights were used to de- lineate the left edge, placed just beyond the edgeline, and white lights were used to delineate the right edge, also placed just beyond the edgeline. The lights operated in a steady-burn mode (Meyer 2000a, b). 20 In addition to the IPM system, a safety warning system (SWS) was deployed before activation of the IPM system. The SWS warned drivers of the work zone through a recorded message transmitted from a radar signal to select radar detectors and other in-vehicle receivers. The evaluation was intended to determine if the use of the IPM systems, in combination with SWS, reduced speeds and improved lane-keeping in the work zone. Vehicle speeds through the work zone were collected: (1) before the imple- mentation of either system, (2) after the activation of the SWS, and (3) after the activation of the IPM system (in simultane- ous operation with the SWS). Following activation of the IPM system, a statistically significant decrease in the mean and 85th percentile speeds was observed. A nighttime speed reduction of more than 6 mph was recorded for both passenger cars and trucks. Additionally, a 7% decrease was noted for drivers exceed- ing the posted speed limit (29% to 22%). Researchers noted that the devices that were the most effective based on the Application Source Warning School zones Orvis Risner Elementary School; Edmond, Oklahoma Vendor survey Construction zones Various Locations; Kansas, Nebraska, Iowa, and Missouri Vendor survey Highway-rail crossings Paramount Boulevard at Rosecrans Avenue; Paramount, California Vendor survey Interstate 95 at State Road 84; Fort Lauderdale, Florida Vendor survey I-126 at Greystone Boulevard; Columbia, South Carolina Transportation practitioner survey FM 127; Mount Pleasant, Texas Vendor survey US 59 at Loop 151 Flyover; Texarkana, Texas Vendor survey N200 between Overveen and Bloemendaa; Province of Noord- Holland, the Netherlands Vendor survey Horizontal curves A4226 (Five Mile Lane); Vale of Glamorgan, Wales, United Kingdom Vendor survey I-526, Cooper River Bridge; Charleston, South Carolina Vendor survey Adverse weather Various Locations; Virginia Vendor survey Guidance SH 99 at Arch Road, Single-Point Urban Interchange; Stockton, California Transportation practitioner survey Multiple-turn lanes Wabash Avenue at Veterans Parkway; Springfield, Illinois. Vendor survey Merge locations Route 46; Totoda Burrow, Wayne Township, New Jersey Vendor survey McClure Tunnel; Santa Monica, California Vendor survey Wilson Tunnel, Route 63 (Likelike Highway); Honolulu, Hawaii Transportation practitioner survey Tunnel s Tunnel #1, SR 20 between Newhalem and Diablo; Washington Internal leads Regulation Disneyland Drive near Disneyland Resort; Anaheim, California Vendor survey 2nd Street at Adams Street; Coquille, Oregon Vendor survey West Alabama Street at the Galleria; Houston, Texas Vendor survey Intersection stop Bars Various Locations along METRORail Line; Houston, Texas Internal leads Left-turn restrictions Various Locations along METRORail Line; Houston, Texas Internal leads Illumination Vehicle/truck inspection points Vandenberg Air Force Base; Santa Barbara County, California Vendor survey SR A1A, Boca Raton, Florida Vendor survey Environmentally sensitive areas N513 Highway; Castricum , Province of Noord-Holland, the Netherlands Vendor survey TABLE 3 SUMMARY OF NOVEL TECHNOLOGY APPLICATIONS FIGURE 5 School zone IPM system application in Edmond, Oklahoma (Courtesy: SmartStud Systems).
21 quantitative data collected were the speed display and the hardwired (as compared with solar) IPM system (Meyer 2000a). Lane-keeping is also important in a construction zone be- cause it helps prevent lane crossovers and subsequent head- on collisions. The lane-keeping benefit of the IPM system was measured using pneumatic tubes placed partially in the roadway. The tubes were configured in such a way to track whether a vehicle encroached on the centerline or right line by three feet, two feet, or one foot. If a vehicle did not activate any of these tubes, it was assumed that the vehicle was trav- eling in the middle of the designated lane. The percentage of vehicles within one foot of the inside edge decreased from 8.9% to 5.2%, indicating that vehicles were traveling closer to the middle of the lane while in the construction zone (Meyer 2000a). This reduction proved to be statistically significant. One challenge to IPM system use in construction zones is the ability to supply and route adequate power cables. The use of solar-powered IPM systems was investigated in this same study. Unlike the hardwired systems, the solar-powered IPM systems did not produce statistically significant results because the lighting was reportedly too dim (E. Meyer, per- sonal communication, July 26, 2007). HighwayâRail Crossings Paramount Boulevard at Rosecrans Avenue, Paramount, California The highwayârail crossing at the intersection of Paramount Boulevard and Rosecrans Avenue in Paramount, California, is atypical because the railroad crosses diagonally across the intersection and not just across one approach. The intersection was too wide for regular railroad crossing gates and the typ- ical railroad crossing lights would have visually blocked the existing traffic signal faces. Sight distance issues were caused by a building on one corner. An IPM system was identified as a suitable alternative warning device at this location (see Figures 6 and 7). Eighty-five red LED IPM system markers were used in the application. More markers were required here than at an intersection with a 90 degree railroad crossing because the markers must be seen from all four approaches. The rail line is a spur trap that services a refinery, with trains crossing once or twice per day (i.e., a daily delivery in and out). The trains do not travel at high speeds, but rather at approximately 5 mph. Traffic volumes at the intersection are high; approximately 30,000 vehicles per day eastbound and westbound and 20,000 vehicles per day northbound and southbound. Additionally, there are approximately 400 high school and middle school students who walk through this in- tersection each day. When the train approaches, it must receive a green indica- tion on the tracks before proceeding through the intersection. When the train has a green indication, all vehicle traffic ap- proaches receive a red indication and the IPM markers begin flashing with a red illumination. Typically, all rail activity occurs during daylight hours; the illuminated markers appear bright enough for all approaches. Few operational issues were reported with the system based on four years of operation. Only one instance of an electrical short circuit was reported; 66 of the markers tem- porarily lost power. Occasional power washing by city street crews is required for the system (B. Pagett, personal com- munication, July 23, 2007). For this application, the IPM system was originally ap- proved by the California Public Utilities Commission and FHWA as a demonstration project. The system cost between $55,000 and $60,000. Rosecrans Avenue P aram o u nt B o ulevard Railroad Crossing FIGURE 6 Paramount Boulevard at Rosecrans Avenue, Paramount, California. FIGURE 7 At-grade highwayârail crossing IPM system application, Paramount, California (Courtesy: LightGuard Systems, Inc.).
speed. As the driver slows, the chase sequence slows. The IPM system markers extend through the entrance to SR 84 to pro- vide added warning of the curvature at this location (G. Soles, personal communication, July 26, 2007). The IPM system at this location has experienced a num- ber of setbacks to effective operation. Lightning strikes, maintenance crew familiarity with the IPM system, power supply issues, and pavement resurfacing activity have pre- vented continuous successful operation for periods longer than six months. The IPM system was struck by lightning twice within a two-month period, motivating the vendor to install addi- tional grounding for the system. Next, a maintenance crew, unfamiliar with the power supply system, reconnected the power supply incorrectly to a night timer causing the lights to function only at night. The lights were restored to 24-h function, but another storm caused an electrical malfunction in the system. The system was repaired and upgraded with addressable chips by the vendor; FDOT reported significant improvement in system performance after the installation of addressable chips. The IPM system was also compromised during recent road resurfacing activities. The contractor was provided a map and verbal direction where the IPM system loops, lights, and wiring were installed, but the system was still acciden- tally damaged by the contractorâs milling machine. In this in- stance, the system was very hard to repair because the milling damage to the cabling was under the surface and difficult to detect. After the system was restored following resurfacing, another lighting strike hit. The system was restored but, in July 2007, was again reported as being without power. No formal evaluation of IPM system effectiveness has been performed. Anecdotally, the Paramount city engineer noted that no crashes have occurred at the intersection since the in- stallation (predeployment crash data were not available) and that the school crossing guards have reacted positively to the system. Horizontal Curves In-pavement marker systems offer the potential for increased visibility over traditional RRPMs through horizontal curves. RRPMs function by reflecting light from a vehicleâs head- lights. Hence, the entire extent of some horizontal curves cannot be illuminated by RRPMs. On the other hand, IPM markers can be designed to provide illumination from a wider range of viewing angles; giving a more consistent, complete, and clear indication of road curvature. A number of horizon- tal curve IPM system applications were identified. Interstate 95 at State Road 84, Fort Lauderdale, Florida In November 2004, the Florida Department of Transportation (FDOT) installed an IPM system on the exit ramp from south- bound I-95 to westbound State Road (SR) 84. The intersec- tion has been the site of several crashes attributable to high vehicle exit speeds from I-95 and the sharp, 90 degree turn required for traffic to enter onto SR 84 (see Figures 8 and 9). The IPM system is activated when a vehicle is detected traveling at 45 mph or greater on the I-95 exit ramp. The IPM system operates in a reverse chase sequence (i.e., toward the vehicle), giving a driver the sense that he is traveling at a faster 22 Exit Ramp to SR 84 FIGURE 8 Exit ramp from I-95 to SR 84, Fort Lauderdale, Florida. FIGURE 9 Horizontal curve IPM system application, Fort Lauderdale, Florida (Courtesy: Florida Department of Transportation).
23 Unfortunately, no automatic feedback system is available to provide information regarding system failure or real-time status. Malfunctions are often reported to FDOT by the Florida Highway Patrol and Road Ranger motorist assistance program drivers. Despite the technical issues that the system has incurred, FDOT believes the system is very effective and important for enhancing safety on the exit ramp. According to FDOT, the IPM system markers are very sturdy and are capable of being driven over by semi-trucks with no apparent damage. FDOT has also received positive feedback from the public regard- ing the system. Once IPM system operation has stabilized (i.e., successfully operating continuously for at least six months), FDOT will formally evaluate its effectiveness. Data reflecting conditions before IPM system installation have been previously collected for comparison. I-126 at Greystone Boulevard, Columbia, South Carolina At the exit ramp to Greystone Boulevard from I-126 near Columbia, South Carolina, road users were observed travers- ing a horizontal curve with excess speed, leading to frequent run-off-the-road crashes into traffic control devices intended to warn the driver (e.g., chevron signing along the curve). An IPM system was implemented at this location to increase the visibility of the curve (see Figure 10). For a distance of 200 ft, IPM system markers were at- tached directly to the surface of the roadway using butyl pads. The markers consist of two LEDs for illumination, but also provide passive guidance through a reflector- ized lens (similar to an RRPM). The IPM system is solar- powered; each marker is activated internally by a photocell and operates during low-light times. Once activated, the units flash at a rate of approximately 60 to 80 times per minute. FIGURE 10 I-126 at Greystone Boulevard, Columbia, South Carolina. FIGURE 11 Horizontal curve IPM system application (daylight), Mount Pleasant, Texas (Courtesy: TxDOT Atlanta District). FIGURE 12 Horizontal curve IPM system application (night), Mount Pleasant, Texas (Courtesy: TxDOT Atlanta District). Each marker cost approximately $55, with a total of 13 units installed ($715) and installation was performed by South Carolina DOT (SCDOT) personnel. The IPM system is likely too new (installed one month ago at the time of this report) to report any operational or maintenance related issues or to provide substantive perceptions of effectiveness. Personnel from SCDOT did indicate that 2 of the 13 chevron signs on the curve have been hit by vehicles since the recent installation of the IPM system. No information was provided regarding the frequency of crashes prior to IPM system installation for com- parison (A. Leaphart, personal communication, July 2007). Farm-to-Market 127, Mount Pleasant, Texas The Texas DOT (TxDOT) had a problematic horizontal curve on Farm-to-Market (FM) 127 outside of Mount Pleasant, Texas. The curve is in a rural area with no safety lighting; road users were frequently leaving the road and running into traffic control devices intended to warn the driver (e.g., chevron signing along the curve). To enhance curve delineation, IPM system markers were mounted on the chevron sign posts (a hole was drilled in the chevronâs pipe and the marker was bolted to the post using antitheft bolts) (see Figures 11 and 12).
The original IPM system that was installed at this location was solar-powered. The observed luminous intensity was often less than desired owing to large trees in the area that were preventing the solar panels from receiving enough light to adequately charge the system. To remedy these issues, in 2006, the IPM system was modified and hardwired to an AC power source. Luminous intensity has appeared to improve following this modifica- tion; TxDOT personnel noted that during night operation the markers are âsuper bright,â but can still be seen reasonably well during the day, because of the shadows cast from sur- rounding trees. The IPM system operates 24 hours per day and is activated when an upstream radar detector, located on an advance warning sign, detects a vehicle traveling faster than the posted advisory speed of 35 mph. When the system is acti- vated, the IPM system markers on the chevron sign posts flash with the advisory speed beacons. The installation and equipment cost approximately $15,000 for this application. Personnel from TxDOT remarked that that the system is not a low-cost solution, but is applicable to the most critical problematic locations (C. Ibarra, personal communication, Aug. 3, 2007). Other than the issues identified previously related to power source (hardwired versus solar), no issues related to installation, operation, or maintenance were reported for this system. A few incidents of vandalism (e.g., markers stolen) have occurred. Overall, TxDOT personnel assess the IPM system posi- tively, but note that familiar road users do not reduce speeds for the curve because the locals know how to traverse the curve. Operational impacts for unfamiliar motorists may be most important. No formal evaluation has been performed to determine the effectiveness of the IPM system in improving safety at this site. U.S. 59 at Loop 151 Flyover, Texarkana, Texas After the TxDOT Atlanta District experienced perceived success with the IPM system application on FM 127, an ad- ditional candidate location was identified. The flyover from U.S. 59 onto Loop 151 in Texarkana, Texas, had a long his- tory of road users impacting the ramp barriers. This flyover ramp is also in a fog-prone area. For this installation, IPM system markers were installed on the right-side concrete barrier of the curve (see Figures 13 and 14). The installation is approximately one-half mile long. The markers were bolted directly to the barrier using antitheft bolts. The IPM system is activated by a photocell and is illuminated when the ambient light begins to dim. Once the system is acti- 24 vated, the lights operate on a steady burn until the ambient light is bright enough to turn off the photocell. The IPM system at this location has experienced some challenges since implementation, but TxDOT is working with the manufacturer to remedy issues with the system. One challenge with this installation was the physical length (one-half mile) and the power requirements of each marker. Each marker requires 21 volts to operate, and ensuring enough voltage is available to illuminate the last sets of markers along the line was difficult because of power consumption along the cable. In response, the manufacturer developed spe- cial power reduction modules that adjust the initial 33-volt input to the required 21 volts per marker. At the end of the half-mile installation, no additional power reduction is nec- essary to achieve the required 21-volt power. Personnel from TxDOT suggested that this installation would have been easier if a power supply had been provided at each end of the line. The IPM system cost $56,000 for an approximate half-mile length of roadway, which included equipment and installation. FIGURE 13 Horizontal curve IPM system application (close-up view), Texarkana, Texas (Courtesy: TxDOT Atlanta District). FIGURE 14 Horizontal curve IPM system application, Texarkana, Texas (Courtesy: TxDOT Atlanta District).
25 A formal evaluation of the effectiveness of this IPM system has not been done. Anecdotally, TxDOT personnel report fewer tire marks on the barriers at this location than before. Additionally, TxDOT personnel believe that the markers add to the aesthetics of the flyover (see Figure 15) (C. Ibarra, per- sonal communication, Aug. 3, 2007). N200 between Overveen and Bloemendaa, Province of Noord-Holland, the Netherlands Limited information was available regarding an IPM sys- tem implemented in the Province of Noord-Holland along N200 in the Netherlands. N200 is a four-lane, divided roadway characterized by a high degree of curvature. IPM system markers are installed on the outside edge of each curve (see Figure 16). The benefits of this system are purported to be increased safety and an energy reduction of more than 90% when compared with conventional overhead illumination (Astucia Traffic Safety Systems 2007b). A4226 (Five Mile Lane), Vale of Glamorgan, Wales, United Kingdom Five Mile Laneâa narrow rural roadwayâis characterized by a high degree of curvature. In response to an elevated crash rate, several mitigating treatments were implemented including a speed limit reduction, deployment of mobile and permanent speed cameras, supplemental road markings and signage, and pavement resurfacing with high-skid-resistance material. In July 2002, an IPM system was installed to en- hance delineation on the centerline of this two-lane roadway (see Figure 17). It was noted that in the three years after the IPM system was installed, crash rates were reduced by 72% when com- pared with the three years prior to installation. It was believed that the increased visibility in the curved sections contributed to the reduction in crashes (Astucia Traffic Safety Systems 2007c). Adverse Weather The effectiveness of IPM systems in enhancing safety and operations during adverse weather conditions has been the subject of international and domestic study. In a laboratory setting in Australia, Styles (2004a) consid- ered the activation performance of environmentally triggered IPM systems. Thirteen light-sensitive, five temperature- sensitive, and seven moisture-sensitive markers were tested according to their response to fading light, fog, and low tem- perature. Based on these tests, it was noted that the markers will perform their intended illuminating tasks: (1) before ice formation, (2) upon formation of moisture on their surface, and (3) in advance of light intensity levels falling below levels that are present with good street lighting. FIGURE 15 Horizontal curve IPM system application (aesthetic view), Texarkana, Texas (Courtesy: TxDOT Atlanta District). FIGURE 16 Horizontal curve IPM system application, Province of Noord-Holland, the Netherlands (Courtesy: Astucia Traffic Safety Systems). FIGURE 17 Horizontal curve IPM system application, Wales, United Kingdom (Courtesy: Astucia Traffic Safety Systems).
In Japan, Munehiro et al. (2006) examined the required luminous intensity of IPM systems in fog conditions. They evaluated LED marker characteristics during day and night conditions, asking 20 subjects to subjectively evaluate glare, visibility, and safety of test deployments of varying LED in- tensities. They found that the desired luminous intensities of 1000 candelas (cd) for daytime and 70 cd for nighttime were acceptable for IPM systems during fog conditions. In a related study, Hagiwara et al. (2001) investigated the luminous intensity of LEDs in snow conditions and reported difficulty in relying on illuminated markers for tracking dur- ing snowstorms, particularly during daylight snowstorm con- ditions. Markers would have to be spaced closely to contrast with the background light levels and the increased scatter of light during these events. Domestically, Whitlock and Weinberger (1998) noted that flashing amber lights significantly enhance driver awareness during adverse weather conditions for IPM systems imple- mented at pedestrian crosswalks (1998). Practical experience related to IPM system effectiveness during adverse weather is described here. I-526, Cooper River Bridge, Charleston, South Carolina In 1992, the SCDOT installed an IPM system on the Cooper River Bridge as a result of a review of environmental im- pacts potentially caused by fog created by a nearby paper mill (Potash and Brown 1988). The IPM system, intended to provide longer-range delineation of the road beyond the range of vehicle headlights, was just one of five measures selected for implementation. Other measures include dy- namic message signs, closed-circuit television cameras, environmental sensors, and a control and communications infrastructure (Goodwin 2003). An IPM system originally designed for airport runway lighting was used. System markers are placed every 110 ft along the edgelines of the bridge. The IPM system is manu- ally activated by a remote traffic management center (TMC). Weather sensors located on the bridge alert the TMC when fog conditions exist. The TMC verifies the condition by camera or with an on-site inspection. When visibility conditions reach less than 750 ft, the edgeline markers are illuminated. The markers are operated in a steady-burn state (R. Clark, personal communication, Aug. 13, 2007). In light fog, every other marker is illuminated (i.e., a marker spacing of 220 ft); in heavy fog, all markers are illuminated (i.e., marker spacing of 110 ft). Frequent light source failures have proven challenging and costly for this system. Additionally, the slope of the bridge results in sand and other sediment build-up on the markers (on the downslope), leading to reduced luminous intensity, 26 overheating, and subsequent failure. Street sweepers also cause debris build-up; the units must be periodically cleaned (approximately once per month) to function properly. System costs were not available for this location. No formal evaluations have been performed to determine the effectiveness of this IPM system, but a representative from SCDOT notes that favorable comments regarding the system were received from the public following implementation. Various Locations, State of Virginia Sections of I-64 and I-77 in Virginia are prone to heavy fog. An early IPM system, on a 5.8-mile segment of I-64, was implemented in 1976, and continually operated until 1997, when the system was upgraded. Upgrades included brighter edgeline markers (previously, incandescent lights were used), new visibility sensors, and 10 DMSs. A before-and-after evaluation of the 1976 IPM system on I-64 showed a decrease in crashes from 40 (four fog-related) to 31 crashes (one fog-related) in a 19-month period. After the system upgrades in 1997, another 19-month before-and- after study examined crash rates. Again, a decrease in crashes was observed, from 60 (five fog-related) to 54 crashes (two fog-related) (Lynn et al. 2002). The statistical significance of these observed changes was not reported. Most recently, the Virginia Transportation Research Council (VTRC) has proposed using several different sys- tems, including IPM systems with chase sequence capabili- ties to reflect variable speed limits, to help prevent crashes in fog-prone areas. In February 2007, the Virginia legislature enabled this application by passing legislation that allows use of variable speed limits. The VTRC also recommends inves- tigation of IPM system effectiveness for pacing vehicles in fog and warning road users of tailgating vehicles (S. Shergold, personal communication, July 26, 2007). GUIDANCE With the primary intent to guide road users, IPM systems have been implemented at multiple-turn lanes, merge loca- tions, and tunnels. The general effectiveness of IPM systems in enhancing road user guidance was investigated by Styles (2004b). Lat- eral placement, speed, brake use, high-beam headlight use, and travel on (or over) the centerline were considered for a two-lane roadway in Australia. Styles observed that driver distance from the centerline increased significantly (+2.44 in. and +3.07 in.) at two of four test locations. Travel farther from the centerline increases the distance between oncoming vehicles and was surmised to lead to fewer head-on colli- sions. At the other two test locations, the distance to the cen- terline decreased (â1.99 in. and â2.46 in.), but only the latter
27 decrease was statistically significant at the 90% confidence level. Researchers concluded that the clearer delineation of the centerline may make road users more comfortable travel- ing closer to the centerline, in contrast to traveling closer to what may be a more poorly delineated roadway edge. The study further concluded that brake use and high-beam head- light use were not significantly affected owing to the IPM system, but some reduction in speed (ranging from â0.75 to â1.93 mph) was observed in a before-and-after review of the IPM system installation. Multiple-Turn Lanes IPM systems have the potential to enhance lane-tracking dur- ing multiple-turn-lane maneuvers and subsequently reduce the occurrence of sideswipe crashes. SH 99 at Arch Road, Single-Point Urban Interchange, Stockton, California In Stockton, California, an IPM system was implemented to enhance two-lane, left-turn operations from all approaches of the Arch Road at State Highway 99 (SH 99) intersection (see Figure 18). This intersection is a single-point urban inter- change with average daily traffic of 14,000 vehicles. The IPM system consists of white LED markers mounted flush with the pavement surface. The system is hardwired for both communications and power, both of which run in an underground conduit. Each marker is individually spliced to the power source to provide easy access for replacement. The IPM system is activated during the left-turn phase of the traffic signal. The markers define the lane line of the two left-turn lanes and illuminate in a forward chase sequence, giving road users a sense of motion and providing positive directional guidance. The markers remain illuminated until the entire curve is lit; the chase sequence then repeats. The system operates 24 hours per day (G. Tsutsumi, personal com- munication, July 2007). The system was originally test oper- ated in two different modes: (1) steady-burn, and (2) forward chasing. The forward chase sequence was perceived to be more effective in keeping traffic moving and, hence, is the only mode of operation used currently. Frequent LED failures, likely resulting from intersec- tion traffic under normal operation and particularly from vibrations produced by heavy trucks, occur about once every two to three months. The manufacturer is working with the city to minimize these failures. No real-time, re- mote failure feedback is available for this system. Failures are noted from field observation, from remote visual inspec- tion using nearby closed-circuit cameras, or through public feedback. The initial installation of the IPM system was reported to cost approximately $75,000, with annual maintenance costs of approximately $15,000 per year. The maintenance costs are primarily attributable to the frequent LED failures. Addi- tionally, large sections of the intersection must be closed to service the system. No formal evaluation has been conducted to determine the effectiveness of the IPM system in improving road user guid- ance through this intersection. The city of Stockton has, how- ever, received positive public feedback regarding the IPM system. Wabash Avenue at Veterans Parkway, Springfield, Illinois In 2004, the Illinois DOT (IDOT) installed an IPM system at the intersection of Wabash Avenue at Veterans Parkway in Springfield, Illinois (see Figure 19). The IPM system was in- tended to provide a more permanent means to delineate the FIGURE 18 Multiple-turn lane IPM system application, Stockton, California (Courtesy: Caltrans). FIGURE 19 Multiple-turn lane IPM system application, Springfield, Illinois (Courtesy: SmartStud Systems).
lanes at this busy intersection, compared with dashed pave- ment markings that fade within a matter of months. Left-turn delineation for dual left-turn lanes is provided at all approaches. When the left-turn phase is activated, the white LED markers illuminate and operate in a steady burn through the turn phase and approximately three to four seconds after the phase. Marker visibility is described as acceptable during daylight, but superior at night. The system operates 24 h a day. Similar to experiences in Stockton, California, the primary issues with this IPM system have included LED failure. Two full replacements of markers (but not cabling) have occurred since the initial installation owing to the large number of LED failures. Although the system was under war- ranty and replacement costs were assumed by the manufac- turer, IDOT still had to provide costly and disruptive traffic control through the intersection (K. Armstrong, personal com- munication, Aug. 16, 2007). The entire cost for this system, including traffic control, was approximately $120,000. According to IDOT, the IPM system has improved traffic control at the intersection by better delineating the dual left-turn lanes at each approach. This effect has not been confirmed through formal evaluation, however. Significant positive feed- back, including several favorable editorials published in local newspapers, was received after the installation of the system. Merge Locations At merge locations, IPM systems have the potential to enhance lane-tracking for road users, particularly if the merge maneu- ver is complicated by curvilinear roadway geometrics. Route 46, Totowa Burrow, Wayne Township, New Jersey In 2006, the New Jersey DOT (NJDOT) installed an IPM sys- tem on Route 46, in Totowa Burrow, Wayne Township, New Jersey (see Figures 20â22). This IPM system was intended to assist road users with lane delineation at an entry ramp merge location within a curve. System markers were used to delineate centerlines and edgelines and to depict an arrow on the pavement at the merge location. The IPM system oper- ates in a steady-burn state 24 hours per day. The lights are visible during daylight hours and dimmed at night. Installation issues have challenged the effective operation of this IPM system. The general roadway contractor was not familiar with either the IPM product or installation proce- dures. Channels to house the cables connecting the markers were not placed deep enough into the pavement, eventually exposing the cables to traffic and the environment. This led to early cable fatigue and failure and subsequent whole sys- tem failures. Challenges also existed related to the design of the âmergeâ arrow as road users had difficulty determining 28 FIGURE 20 Merge location IPM system application, Wayne Township, New Jersey (Courtesy: HIL-Tech, Ltd.). FIGURE 21 Merge location IPM system application (arrow view), Wayne Township, New Jersey (Courtesy: HIL-Tech, Ltd.). FIGURE 22 Merge location IPM system application (taper view), Wayne Township, New Jersey (Courtesy: HIL-Tech, Ltd.).
29 that the lighted object is an arrow until he or she is immedi- ately in proximity to the arrow. Despite these installation challenges, NJDOT personnel consider the IPM system to be very effective and recom- mended its use in fog-prone areas or other locations needing additional roadway delineation. IPM systems were only rec- ommended for the most critical locations, however, because of the system cost. Specific IPM system costs were not read- ily available from NJDOT; system installation was included as a construction change order on a larger project. Tunnels IPM systems used in tunnels can provide guidance and addi- tional roadway illumination for road users. Such systems have been shown to be more effective at night; the tunnel environment is similar to night conditions. IPM systems can be particularly beneficial when a road user enters a dark tunnel from a fully lit daytime environment. These IPM systems have been used extensively in European tunnels and their effectiveness in improving safety and oper- ation has been the subject of much study. The average travel speed through tunnels has been shown to increase slightly, whereas speed limit violations decreased following implementation of IPM systems (Eigentler 2005). One explanation for the increased average speed is that road users may feel more comfortable driving in the tunnel. Addi- tionally, road users more commonly maintained a two-second or more headway distance in higher-density traffic following implementation of IPM systems. Another study conducted by Ruhr University in Bochum examined the use of IPM systems in three different tunnels in Germany (Eigentler 2005). The study measured speed through the tunnel and distances maintained from the side of the tun- nel. In addition, road users were surveyed after they exited the tunnel. Trucks changed their lane-tracking to travel in the rightmost portion of the lane following IPM system imple- mentation. A small increase in average speed, leading to a smoother speed progression through the tunnel, was also ob- served. Road users were better able to adjust from the open road environment to the tunnel environment without slowing down. This is an operational advantage in that decreases in speed at the tunnel entrance can cause a sufficient disruption in the traffic flow, leading to major congestion in heavy traffic. Austria was the first country to approve guidelines for IPM system use in tunnel applications in its Guidelines for Tunnel Equipment (Eigentler 2005). After a 1999 fire disaster, the Tauern Tunnel reopened with an IPM system to help guide road users through the tunnel. In Norway, fire agencies are pro- moting use of IPM systems in tunnels; in emergency situa- tions, the IPM system could provide escape or evacuation route delineation regardless of the direction of traffic. Domestically, IPM systems have been recently imple- mented in tunnels in the states of California, Hawaii, and Washington. McClure Tunnel, Santa Monica, California In October 2003, an IPM system was installed in the McClure Tunnel, where I-10 meets the Pacific Coast Highway in Santa Monica, California. The IPM was installed on the center median barrier to delineate the center of the tunnel and guide road users through a sharp curve (see Figure 23). The tunnel environment limits opportunities for self- cleaning of IPM units (i.e., through rainfall); however, the barrier mount also limits dirt and debris build-up on the IPM system markers. Caltrans personnel report infrequent main- tenance activity, resulting only when vehicles hit the center median barrier and dislodge the IPM system electrical wires or conduit. The IPM system cost was reported to be between $60,000 and $70,000; the length of the tunnel and the dis- tance between markers was not reported. Caltrans personnel purport enhanced visibility for road users and a reduction in crashes as a result of the IPM system, but a formal evaluation has not been done to support these findings (G. Toor, personal communication, July 27, 2007). Wilson Tunnel, Route 63 (Likelike Highway), Honolulu, Hawaii In May 2006, the Hawaii DOT (HDOT) implemented an IPM system in the eastbound Wilson Tunnel on Route 63 outside of Honolulu (see Figures 24 and 25). The intention of FIGURE 23 Tunnel IPM system application, Santa Monica, California (Courtesy: SmartStud Systems).
the IPM system was to provide lane guidance and reduce crashes; the system provides a guidance and warning function both inside the tunnel and outside at the tunnel exit. The subject roadway consists of two one-way tunnels, each with two 12-ft lanes and sidewalks. The length of each tunnel is approximately 2,700 ft. The average daily traffic for both directions in the tunnel is 29,500 vehicles, with a posted speed limit of 35 mph (A. Takeshita, personal communication, Aug. 13â15, 2007). IPM markers are mounted within the double-white center lane lines and on the right edgeline in the eastbound tunnel only. The white LED markers are operated in a steady-burn state 24 hours per day. To date, there have been no reported failures with the mark- ers or system. Failure detection does not occur automatically, but is detected through inspection by the HDOT maintenance 30 crews or through public notifications. The initial cost of the system was $70,000, which is comparable to the system costs reported for the Santa Monica, California, IPM system tunnel application. Although no formal evaluation of effectiveness has been performed, HDOT reported a perceived improvement in tunnel operation and safety as a result of the IPM system. Tunnel # 1, SR-20 between Newhalem and Diablo, Washington In July 2005, the Washington State DOT (WSDOT) imple- mented an IPM system in Tunnel #1 on State Route 20, be- tween Newhalem and Diablo (see Figure 26). The IPM system implementation was motivated by a desire for increased safety through added delineation inside the tunnel, particularly for road users crossing from bright daylight conditions into the dark tunnel. At this location, the roadway has two lanes (one lane in each direction) and a width of 30 ft (including shoulders) inside the tunnel. The tunnel is 630 ft in length. The average daily traffic for both directions of travel through the tunnel is 1,500 vehicles per day, and the posted speed limit is 45 mph. The IPM system markers are placed along the centerline for the length of the tunnel. The yellow LED markers operate in a steady-burn state when activated either by vehicle loop detectors at each tunnel approach or by push buttons for bi- cyclists entering the tunnel. Installation required a saw cut into the concrete for the inductive power line. In addition, a 6- to 10-in.-wide strip of pavement surface was milled down for a length of about 18 in. in front of and behind each marker (see Figure 27) allowing the marker to be recessed from the traffic lane surface to help avoid damage from snowplows. Some maintenance is required to clean the individual markers every three to six months as debris and dirt on the FIGURE 24 Wilson Tunnel (inside the tunnel), Route 63, Honolulu, Hawaii (Courtesy: Hawaii DOT). FIGURE 25 Wilson Tunnel (exit from the tunnel), Route 63, Honolulu, Hawaii (Courtesy: Hawaii DOT). FIGURE 26 Tunnel IPM system application, between Newhalem and Diablo, Washington (Courtesy: WSDOT).
31 markers hinder their visibility over time. To date, there have been no reported failures with the markers or system. Failure detection does not occur automatically, but is detected through inspection by the WSDOT maintenance crews or through motorist notifications. The total system cost was estimated as $100,000. Ongoing annual costs associated with system maintenance are approximately $1,000. The operation and safety of the facility have improved with the addition of the IPM, WSDOT believes, although no formal evaluation is available (G. Baghai, personal communication, Aug. 3â7, 2007). REGULATION IPM systems have been implemented in combination with other regulatory devices at intersection stop bars and for left- turn restrictions to enhance regulation of road users. Intersection Stop Bars IPM systems implemented at intersection stop bars can be in- tegrated with traffic signals or other control devices to en- hance regulation of road users. Disneyland Drive near Disneyland Resort, Anaheim, California An IPM system intersection stop-bar application on Disney- land Drive in Anaheim, California, was credited with reducing crashes from 14 in a six-month period prior to implementa- tion to 6 in the six-month period following implementation. The system was also credited with reducing red light run- ning and increasing stop-bar adherence (Kaku Associates, Inc. 2002). 2nd Street at Adams Street, Coquille, Oregon In Coquille, Oregon, in 2006, the intersection of 2nd Street and Adams Streetâa four-way stop-controlled intersectionâ was modified from an all-red flashing signal to an IPM system stop-bar application with lighted stop signs on all approaches (see Figure 28). The IPM system and stop signs for any approach illuminate when a vehicle is detected traveling at least 5 mph approaching the intersection. Challenges to successful IPM system operation in stop- bar applications include sensor failure and adherence to the pavement. Marker adherence issues have been attributed to fully loaded logging trucks running directly over the light systems in Coquille, Oregon (unnamed city staff member, personal communication, July 23, 2007). Despite these issues, the IPM system is viewed as beneficial, enhancing the visibil- ity of the four-way stop control. Both daytime and nighttime operations are considered to be effective. The system cost was approximately $40,000; maintenance is covered under a manufacturer warranty. West Alabama Street at the Galleria Shopping Mall, Houston, Texas Under FHWAâs experimental designation, an IPM system was implemented at a signalized pedestrian crossing that connects two sections of the Galleria Mall at West Alabama Street. The IPM system is illuminated during the yellow and red phases of the traffic signal and matches the signalâs color indications. The markers used in this application have five amber LEDs and five red LEDs. When the traf- fic signal provides a yellow indication, the amber LEDs illuminate in a steady-burn state (see Figure 29). When the traffic signal provides a red indication, the red LEDs illu- minate, also in a steady-burn state (see Figure 30). When the traffic signal shows a green indication, the IPM system is deactivated. FIGURE 27 Tunnel IPM system application (milled pavement view), between Newhalem and Diablo, Washington (Courtesy: WSDOT). FIGURE 28 Intersection stop-bar IPM system application, Coquille, Oregon (Courtesy: LightGuard Systems, Inc.).
Initially there were problems with electrical âshortsâ in the IPM system; however, this was attributed to initial system wiring rather than equipment failure. Once resolved, few additional maintenance issues were reported. As with other applications, it was noted that the IPM system markers do collect dirt and debris and require occasional high-pressure water cleaning (tunnel-like conditions under the pedestrian bridge prevents rain from self-cleaning the markers) (R. Taube, personal communication, July 23, 2007). Decreased lumi- nous intensity was also noted with the IPM system markers. This is likely attributable to the reduced number of LEDs per illumination phase (i.e., 5 yellow or red LEDs per illumination rather than the more typical 10). The total cost for this IPM system was approximately $45,000, comprising material costs of $30,000 and installation costs of $15,000 (P. English, per- sonal communication, July 23, 2007). The effectiveness of the IPM system at this location was measured at two different times following implementation: (1) initially following system implementation, and (2) following extended implementation 32 to better determine lasting system effects over time (TEDSI Infrastructure Group 2004a, b). When compared with the âbe- foreâ conditions, the following changes were observed after IPM system implementation: ⢠Pedestrian compliance with the signal increased by 17% initially following implementation and by 19% follow- ing extended implementation. ⢠Motorist noncompliance with the signal decreased by 23% initially following implementation and by 25% following extended implementation. ⢠Red-light running decreased by 50% initially follow- ing implementation and by 77% following extended implementation. ⢠Stop-bar violations (i.e., the number of vehicles en- croaching over the stop bar) decreased by 6% initially following implementation and by 26% following ex- tended implementation. Note that in each case the IPM system effectiveness was ob- served to increase rather than decrease over time, although the time period for measurement following extended imple- mentation was not reported (e.g., three months, six months, and one year). Various Locations along METRORail Line, Houston, Texas In 2006, The Houston Metropolitan Transit Authority of Harris County, Texas (METRO) implemented an IPM system at an in- tersection stop bar in the Houston central business district, specifically at the intersection of Jefferson Street and Main Street (see Figure 31). Only the Jefferson Street approach was initially equipped with the IPM system. Jefferson Street is a five-lane, one-way, eastbound street that intersects the METRORail line at Main Street. The motivation for this im- plementation was to increase road user awareness of the traffic FIGURE 29 Stop-bar application Amber Phase, Alabama Street at Galleria, Houston, Texas. FIGURE 30 Stop-bar application Red Phase, Alabama Street at Galleria, Houston, Texas. FIGURE 31 Intersection stop-bar IPM system application, Jefferson Street at Main Street Houston, Texas.
33 signal and the onset of a red indication, to subsequently reduce the incidence of red-light running on streets intersecting the rail line. The Jefferson Street approach served as the initial test site. The IPM system at this location is configured in a linear layout with two offset rows of red LED markers. The spacing of IPM markers in each row is approximately one foot, but the offset of the markers between the two rows effectively presents a six-inch spacing. The IPM system is activated in a steady-burn state when the eastbound traffic signal indica- tion for the Jefferson Street approach changes to red. The IPM system is deactivated when the traffic signal operates in an all-red flashing mode. This IPM system uses an inductive loop power source, eliminating the need for the markers to be hardwired directly to the power source. The installation of the system involved cutting a groove in the pavement to place the inductive power loop, coring the pavement to install the power nodes, and ad- hering the markers to the pavement surface above the nodes. Reported issues with the performance of this IPM system include a lack of marker adherence to the pavement (i.e., a high frequency of pop-offs) and a loss of luminous intensity over time (W. Langford, personal communication, 2007). As with the IPM system application at West Alabama Street at the Galleria Shopping Mall in Houston, Texas, the Jefferson Street at Main Street IPM system was deployed with FHWAâs experimental approval. As part of this process, semi- annual reports are required to document the effectiveness of the application under experiment. The first report provided in- formation on driver comprehension, traffic operations (includ- ing red-light running and violations of the right-turn-on-red prohibition), and vehicle crashes (Tydlacka and Voigt 2006). Driver comprehension studies were conducted in April 2006 with 103 individuals who drive in and around Houston and specifically, along the METRORail line. The partici- pants were shown a selection of video clips (some of which contained computer-animated renditions of the proposed in- tersection stop-bar IPM system application in the active state) and asked to complete a survey after viewing the videos. These comprehension studies were completed before the IPM system was activated in the field. The driver com- prehension studies showed that nearly 90% of respondents stated that the first characteristic they noticed about the in- tersection was the IPM system at the stop bar. More than 80% believed that the purpose of the system was to tell driv- ers where to stop for the traffic signal. It was concluded that most drivers noticed the IPM system and associated the IPM system with the traffic signal (based on computer-animated renditions of the proposed IPM system). The initial operational analysis was supported by three days of data prior to IPM system implementation and one day of early âafterâ data following implementation. The results showed a minor reduction in red-light running (from 9 per day to 8 per day), but a major reduction (more than 50%) in right-turn-on-red maneuvers (from 47 per day to 18 per day). Similar findings were observed when these changes were normalized to reflect violations per 1,000 cycles or violations per 10,000 vehicles (Tydlacka and Voigt 2006). Crash frequency was also monitored before and following IPM system activation. One year of crash data before IPM system implementation and six months of data following im- plementation were considered. A reduction from two to zero eastbound crashes was observed after the IPM system was implemented. The short observation period and infrequent crash occurrence limits further conclusions related to the crash reduction potential of the IPM system at this site. These findings related to driver comprehension, traffic operations, and vehicle crashes at Jefferson Street are preliminary but promising. Evaluations are still ongoing. Given the promise of the initial IPM system at Jefferson Street, a second street that approaches Main StreetâGray Streetâwas equipped with an intersection stop-bar IPM sys- tem at Main Street. This intersection was also equipped with LED-bordered backplates installed behind the traffic signal faces. Figure 32 depicts both the IPM system intersection stop-bar application and the LED-bordered backplates. When the traffic signal indication changes to red, the IPM system and the LED-bordered backplates are concurrently illuminated in a red, steady-burn state. Evaluations of the effectiveness of these combined systems are ongoing. Most recently, Houston METRO has implemented sev- eral additional IPM systems at intersection stop bars (as well as LED-bordered backplates) along Main Street and the light rail line. Two different types of IPM systems were used across these locations, requiring different installation techniques, power delivery methods, and operating modes (i.e., flashing). FIGURE 32 Intersection stop-bar IPM system with LED-bordered backplates, West Gray Street at Main Street, Houston, Texas.
One of the IPM systems is designed such that each marker flashes consistently, but individual markers flash with left and right sides alternating. Table 4 summarizes current inter- section stop-bar IPM system and LED-bordered backplate applications currently in use by Houston METRO. Left-Turn Restrictions Left-turn restrictions are typically conveyed to road users through static regulatory signing. IPM systems have the poten- tial to enhance road user awareness of turn prohibitions, and offer more flexibility in operations related to time-of-day or transit-priority restrictions. Various Locations along METRORail Line, Houston, Texas A segment of Houstonâs METRORail light rail is centered on Fannin Street running in the former median portion of the road- way. Along this corridor, left-turn movements are prohibited in both northbound and southbound directions along Fannin Street (within the Texas Medical Center) when a train is ap- proaching. Despite this left-turn restriction, a number of crashes have occurred involving left-turn movements by road users. To reinforce the turn restriction, Houston METRO first installed a dynamic lane control assignment system (see Figures 33â35). A âRed Xâ indicates that left-turn movements are prohibited; a âGreen Arrowâ indicates that left-turn movements are allowed and a âTrain Approachingâ sign provides additional warning to road users (âMETRORail . . .â 2007). These overhead- 34 mounted dynamic signs are linked to the traffic signal con- troller. When a train approaches from either direction, the âGreen Arrowâ is replaced with a âRed Xâ and the âTrain Ap- proachingâ sign is illuminated (âWalking . . .â 2007). To supplement this dynamic lane control assignment sys- tem, Houston METRO in 2006 implemented an IPM system on the northbound and southbound approaches of Fannin Street at Dryden Street (see Figures 36 and 37). A single row of red IPM system markers is placed along the lane line between the left-turn lane and the left through Location Along Main Street IPM System LED Backplates Implementation Date Jefferson Street (eastbound) March 2006 (IPM System) August 2007 (LED Backplates) Gray Street (westbound) October 2006 (IPM System) June 2007 (LED Backplates) McGowen Street (east/westbound) November 2006 Webster Street (eastbound) February 2007 Dallas Street (eastbound) May 2007 Commerce Street (westbound) June 2007 Walker Street (westbound) June 2007 Elgin Street (east/westbound) June 2007 Alabam a Street (east/westbound) June 2007 Pierce Street (eastbound) July 2007 (IPM System) February 2007 (LED Backplates) TABLE 4 INTERSECTION STOP-BAR IPM SYSTEMS AND LED-BORDERED BACKPLATES IN HOUSTON, TEXAS FIGURE 33 Active âXâ for do not enter left turn lane on X, Houston, Texas (Courtesy: Houston METRO).
35 lane in both the northbound and southbound directions. The markers are spaced approximately 5 ft apart and extend from the beginning of the left-turn bay through the Dryden inter- section. The system is activated in a steady-burn state when the dynamic lane control assignment indicates a âRed X.â The installation of the system involved cutting a groove in the pavement to place the inductive power loop, coring the pavement to install the power nodes, and adhering the mark- ers to the pavement surface above the nodes. Not unique to this application, power supply issues were encountered early in IPM system operation but have since been resolved. On more than one occasion, the system was without power owing to a suspected manufacturing defect in the power supply. Also, marker adhesion has been problem- atic; some markers were dislodged from the pavement and were lost or destroyed by traffic. Once the missing markers were replaced with stronger adhesive, the system has oper- ated with few to no problems (W. Langford, personal com- munication, 2007). As with the previous IPM system applications in Houston, Texas, this IPM system was implemented with FHWAâs experimental approval. As part of this process, semi-annual reports are required to document the effectiveness of the appli- cation under experiment. The first report provided information on driver comprehension, traffic operations (including viola- tions of the prohibited left-turn maneuver), and vehicle crashes. Conducted simultaneously with the previously described driver comprehension studies for IPM system intersection stop-bar applications, the driver comprehension studies for this application were conducted in April 2006 with 103 indi- viduals who drive in and around Houston and, specifically, the Texas Medical Center. The participants were shown a selection of video clips (some of which contained computer-animated renditions of the proposed IPM system in the active state) and asked to complete a survey after they viewed the videos. These comprehension studies were completed before the IPM system was activated on Fannin Street. The results of this FIGURE 34 Active âArrowâ for permitted access left-turn lane, Houston, Texas (Courtesy: Houston METRO). FIGURE 35 Train approaching sign (flashes on train approach). IPM (Not Active) FIGURE 36 Left-turn restriction IPM system application (not active), Houston, Texas. IPM (Active) FIGURE 37 Left-turn restriction IPM system application (active), Houston, Texas.
study indicated that approximately 82% of the respondents understood the meaning of the IPM system to be âdo not enter the left lane.â Only 50%, however, thought that the IPM system signaled that a train was coming. Respondents were also shown an image with the IPM system and an overhead âTrain Approachingâ sign, yet 18% did not include âa train is comingâ or âdo not turn leftâ in their response. The driver comprehension study concluded that although most drivers understood that the purpose of the IPM system was to restrict access to the left-turn lane, some road users may be chal- lenged to determine when a train is approaching or when they are allowed to enter the left-turn lane using the current dy- namic lane control assignment and IPM system. The operational analysis for this combined dynamic lane control assignment and IPM system application considered five specific violation types: 1. Type 1 LT ViolatorâVehicle enters left-turn lane against the âRed Xâ of the dynamic left-turn lane con- trol signal and completes left turn. 2. Type 2a LT ViolatorâVehicle completes left turn from lane other than left-turn lane against the âRed Xâ of the dynamic left-turn lane control signal. 3. Type 2b LT ViolatorâVehicle completes left turn from lane other than left-turn lane with the âGreen Arrowâ of the dynamic left-turn lane control signal. 4. LT Violator/BailoutâVehicle enters left-turn lane against the âRed Xâ of the dynamic left-turn lane con- trol signal and does not complete the left turn. 5. BailoutâVehicle enters the left-turn lane legally with the âGreen Arrowâ of the dynamic left-turn lane con- trol signal and does not complete the left turn, contin- uing straight on Fannin Street. Three days of data prior to IPM system implementation and one day of early âafterâ data following implementation sup- ported this operational analysis. The results showed a consis- tent trend in violations; total violations were either the same or slightly higher than before when measured shortly after im- plementation. The number of Type 1 violators (i.e., vehicle en- ters left-turn lane against the âRed Xâ of the dynamic left-turn lane control signal and completes left turn) per 10,000 vehicles was observed to decrease, however, for each direction. These results should be viewed as preliminary and should take into account the short observation period (i.e., one day) following IPM system implementation (Tydlacka and Voigt 2006). The crash analysis at this site was inconclusive owing to an infrequency of observed crashes (no left-turn vehicle/train crashes occurred at this location in the year before IPM system implementation or in the six months following implementa- tion) and the abbreviated observation period following IPM system implementation. Although no significant reduction in crashes could be attributed to IPM system implementation at this site, left-turn vehicle/train crashes have shown a consis- tent annual decline over time. 36 ILLUMINATION With a primary intent to provide an alternate source of illu- mination, IPM systems have been implemented at vehicle and truck inspection points and in environmentally sensitive areas, potentially affected by light pollution attributable to conventional overhead roadway lighting systems. Vehicle and Truck Inspection Points At locations where safety and security is of heightened con- cern (e.g., international border crossings and military facili- ties), IPM systems have the potential to enhance the monitoring capabilities of officials at these locations through improved illumination. Vandenberg Air Force Base, Santa Barbara County, California Because of their upward light projection, IPM systems have been used by monitoring inspectors to better view the under- carriages of entering and exiting vehicles (see Figure 38). Most contacts interviewed for this synthesis effort declined to divulge details about these systems for security reasons; a representative from Vandenberg Air Force Base did con- firm the use of IPM systems at two different locations. No additional information regarding the installation, operation, maintenance, cost, or effectiveness of these IPM systems was available. Environmentally Sensitive Areas Light pollution, attributable to conventional overhead roadway lighting systems, has prompted the use of IPM systems as an alternative source of illumination at a number of locations deemed to be environmentally sensitive. FIGURE 38 Vehicle and truck inspection point IPM system application (Courtesy: Traffic Safety Corporation).
37 SR A1A, Boca Raton, Florida In Boca Raton, Florida, sea turtle hatchlings are instinctively drawn to the ocean by the reflection of light from the sky on the waterâs surface. Along State Route A1A, the installation of overhead artificial roadway lighting confused the hatch- lings, drawing them inland (instead of toward the ocean) where they became dehydrated, preyed upon, and even run over by vehicles. In 2001, FDOT initiated an experimental demonstration project to test the use of IPM systems as an al- ternate illumination source with the intent of preserving the sea turtle hatchlings (see Figure 39). A one-half-mile section of SR A1A, adjacent to the beach and the cityâs Spanish River Park, was selected as the demon- stration site. The existing overhead roadway lights were deac- tivated and combined bollard lighting and IPM systems were implemented. The alternative light sources were physically lower in height than the sea dunes adjacent to the roadway to prevent light from reaching the beach. The alternate light sys- tem is only used during the sea turtle mating season (from May to October), and is photo-sensitive, illuminating at dusk. Not unique to this application, marker adhesion was re- ported as initially problematic at this location; the adhesive used to hold the markers in place would release in Floridaâs high summer temperatures. This issue was fully resolved by the manufacturer. The control cabinet was also struck by lightning and has since been replaced with a stronger, grounded box. Although no IPM system costs were directly reported, a resurfacing project is planned for SR A1A that will pro- vide continued use of the existing half-mile IPM system and extend the system for an additional half-mile. The cost of the combined resurfacing/IPM system project is $500,000 (A. Broadwell, personal communication, July 26, 2007). Two separate studies were done by the University of Florida to determine the effectiveness of the combined bol- lard lighting and IPM systems, considering both the turtle hatchlings and the general public. The hatchlings study re- vealed a 99% decrease in hatchling disorientation attribut- able to the alternative light system. In the public acceptance study, the majority of the public was in favor of the project and agreed that the alternative light system was adequate for roadway usage. Older road users, however, were observed to be less receptive to the alternative light system. No changes in crash characteristics were observed as a result of the alter- native lighting (Ellis and Washburn 2003). N513 Highway, Castricum, Province of Noord-Holland, the Netherlands Along the N513 Highway in the Province of Noord- Holland, the Netherlands, an IPM system was implemented as an alternative to overhead roadway lighting to address safety concerns in an environmentally sensitive location. At this location, bicyclists returning from the adjacent beach and conservation area frequently cross the N513 highway. The proximity of the conservation area pre- cluded use of conventional overhead roadway lighting to increase the visibility of the bicyclists as they crossed the highway. In 2003, solar-powered IPM system markers were placed along the centerline of the roadway for a distance of approx- imately 180 ft on both sides of the bicycle crossing (see Fig- ure 40). Inductive loops are used to activate the IPM system as vehicles approach the crossing area. The Dutch reported a 99.2% savings in energy and minimal impacts on wildlife as a result of the IPM system. In addition, no fatalities or injuries have been reported since the installation of this system. No information was provided, however, re- garding safety levels before IPM system implementation to FIGURE 39 Environmentally sensitive area IPM system application SH A1A Boca Raton, Florida (Courtesy: SmartStud Systems). FIGURE 40 Environmentally sensitive area IPM system application, Province of Noord-Holland, the Netherlands (Courtesy: Astucia Traffic Safety Systems).
determine whether this result is notable (Astucia Traffic Safety Systems 2007a). CONCEPTUAL APPLICATIONS While investigating existing IPM systems, several concep- tual applications of IPM systems were uncovered including: ⢠Fire station exit warning systems; ⢠Toll booth open/closed operational status; 38 ⢠High-occupancy-vehicle lane open/closed operational status, entrance and exit lane delineation, enforcement areas, and reversible lanes; ⢠Parking garage guidance to open spaces; and ⢠Airport gate lead-ins. These potential applications of IPM systems are still in the conceptual stage and have not yet been field-tested to deter- mine their ability to enhance safety, operations, or aesthetics under these conditions.
