


Below is the uncorrected machine-read text of this chapter, intended to provide our own search engines and external engines with highly rich, chapter-representative searchable text of each book. Because it is UNCORRECTED material, please consider the following text as a useful but insufficient proxy for the authoritative book pages.
96 This chapter summarizes the results of embankment and slope stability studies that were carried out for the Project. The primary objectives of these studies were to: ⢠Develop a methodology for evaluating the seismic re- sponse of embankments and slopes that can be easily used by designers; ⢠Account for the results of ground motion and wave scat- tering studies presented in Chapters 5 and 6 in the pro- posed approach; and ⢠Provide comments on the use of the proposed methodol- ogy in low seismicity areas, where a âno analysisâ approach may be appropriate for the seismic analysis and design of embankments and slopes. The proposed methodology is intended for use in con- structed embankments or naturally occurring soil slopes. As noted in Section 4.3, rock slopes are not being considered in this development. This chapter begins with a brief summary of the types of slopes and embankments commonly encountered during transportation projects. This discussion is followed by a brief summary of current practice, a summary of the methodology being proposed, and an example application of this method- ology. The chapter is concluded with a discussion of other considerations relative to the seismic analysis and design of slopes and embankments. As with previous chapters, the ap- proach identified in this chapter will form the basis of the proposed specifications, commentaries, and example prob- lems given in Volume 2 of this Final Report. 8.1 Types and Performance of Slopes Two general classes of slopes need to be considered for the methodology development: natural slopes and constructed or engineered slopes. These two categories of slopes will vary sig- nificantly in terms of geometry, material properties, and groundwater conditions. In most cases the constructed slopes will be relatively uniform in soil conditions, though the con- structed material will vary from sands and gravels to fill that has high fines content (that is, cohesive soil content). On the other hand the natural slopes will usually be highly variable, with layers that range from gravels to clays and often the groundwater will be located within the slope. 8.1.1 Engineered Slopes and Embankments These slopes generally will be constructed from an imported material. Depending on the geographic area, the imported materials can be predominantly sands or gravels or they can have a high percentage of cohesive soil. The slopes are com- pacted and will usually exhibit good strength characteristics. Slope angles often will range from 2H:1V (horizontal to ver- tical) to flatter than 3H:1V. Height of the slope can vary from a few feet to over 50 feet. A common example of these slopes would be the approach fill used at either end of a bridge. These approach fill slopes would be on the order of 30 feet in height. These slopes are perhaps the easiest to evaluate from the standpoint that the fill is defined, and therefore determina- tion of material properties is more straight-forward. If the fill is cohesionless, the friction angle (Ï) will normally be 35 de- grees or higher. If the fill has appreciable fines content, the compacted strength often will be in excess of 2,000 psf. The groundwater location for most of these slopes will be at some distance below the base of the fill. The designs of these slopes become problematic if the embankment fill is being placed on a soft or liquefiable foundation material. In these cases the de- termination of the strength of the foundation material under static and seismic loading becomes a key consideration dur- ing the analysis. The geotechnical investigation of the engineered fill gener- ally will be limited to investigating the characteristics of the C H A P T E R 8 Slopes and Embankments
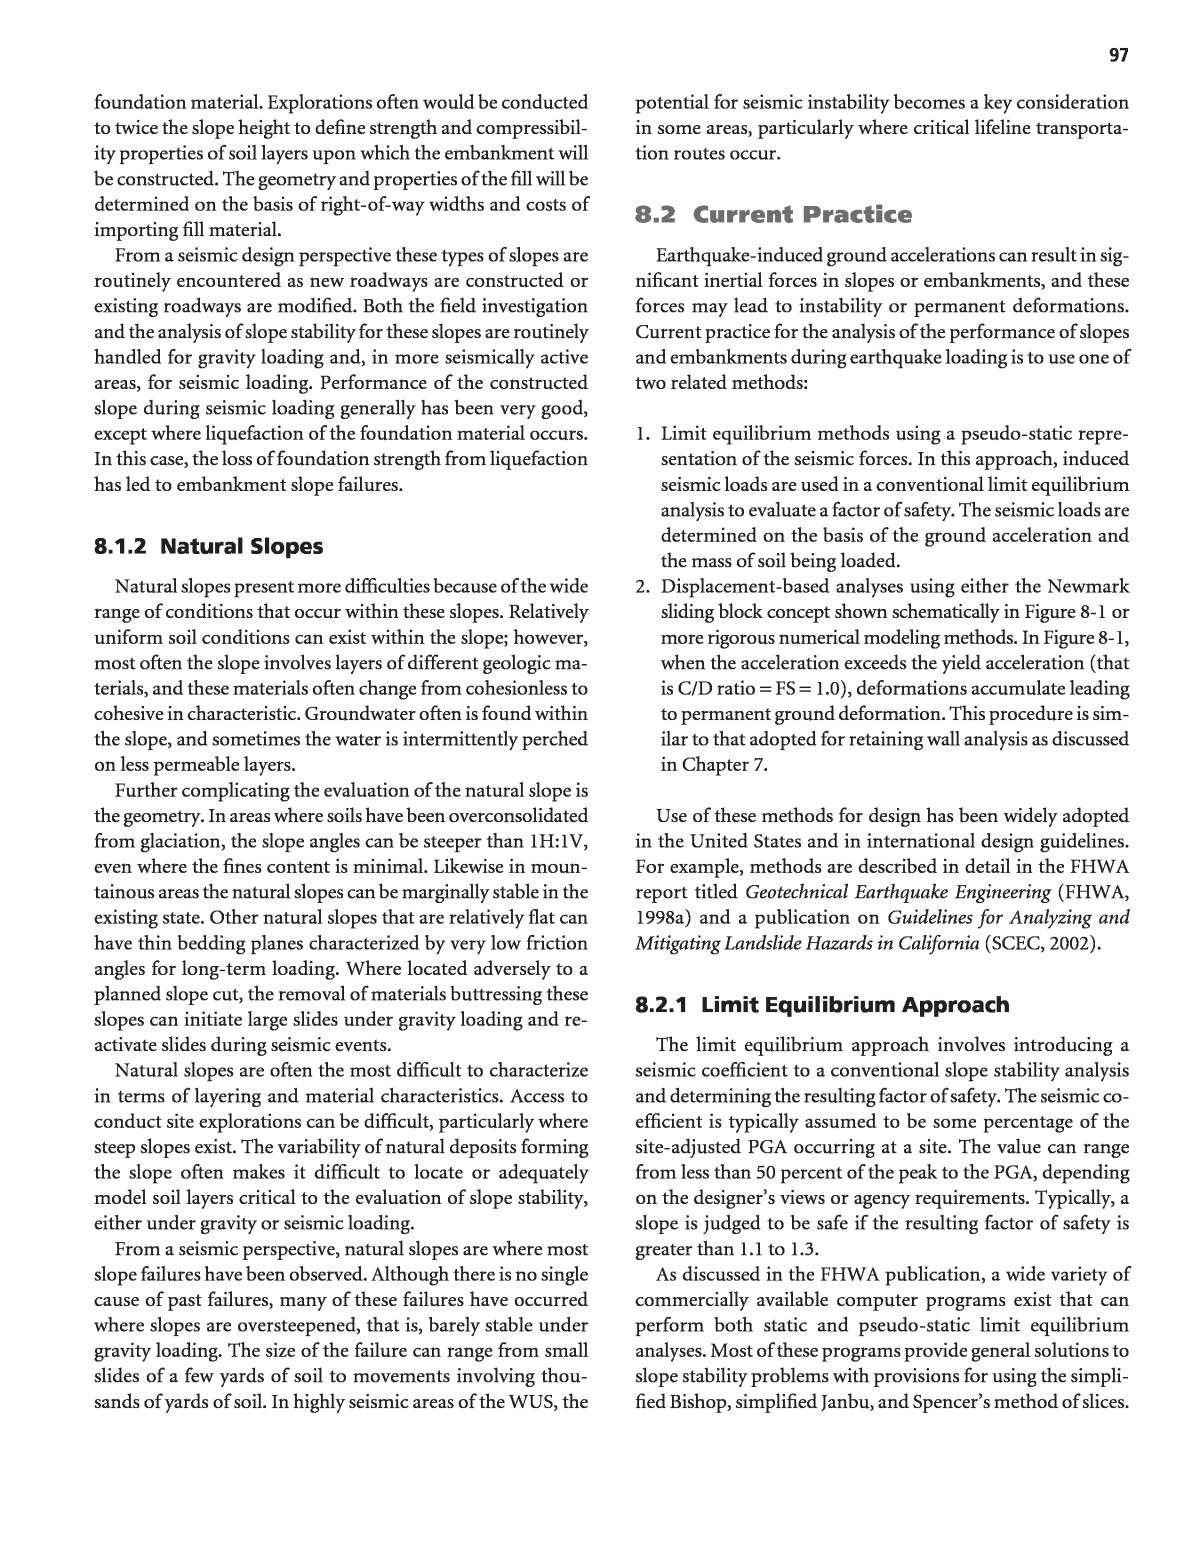
97 foundation material. Explorations often would be conducted to twice the slope height to define strength and compressibil- ity properties of soil layers upon which the embankment will be constructed. The geometry and properties of the fill will be determined on the basis of right-of-way widths and costs of importing fill material. From a seismic design perspective these types of slopes are routinely encountered as new roadways are constructed or existing roadways are modified. Both the field investigation and the analysis of slope stability for these slopes are routinely handled for gravity loading and, in more seismically active areas, for seismic loading. Performance of the constructed slope during seismic loading generally has been very good, except where liquefaction of the foundation material occurs. In this case, the loss of foundation strength from liquefaction has led to embankment slope failures. 8.1.2 Natural Slopes Natural slopes present more difficulties because of the wide range of conditions that occur within these slopes. Relatively uniform soil conditions can exist within the slope; however, most often the slope involves layers of different geologic ma- terials, and these materials often change from cohesionless to cohesive in characteristic. Groundwater often is found within the slope, and sometimes the water is intermittently perched on less permeable layers. Further complicating the evaluation of the natural slope is the geometry. In areas where soils have been overconsolidated from glaciation, the slope angles can be steeper than 1H:1V, even where the fines content is minimal. Likewise in moun- tainous areas the natural slopes can be marginally stable in the existing state. Other natural slopes that are relatively flat can have thin bedding planes characterized by very low friction angles for long-term loading. Where located adversely to a planned slope cut, the removal of materials buttressing these slopes can initiate large slides under gravity loading and re- activate slides during seismic events. Natural slopes are often the most difficult to characterize in terms of layering and material characteristics. Access to conduct site explorations can be difficult, particularly where steep slopes exist. The variability of natural deposits forming the slope often makes it difficult to locate or adequately model soil layers critical to the evaluation of slope stability, either under gravity or seismic loading. From a seismic perspective, natural slopes are where most slope failures have been observed. Although there is no single cause of past failures, many of these failures have occurred where slopes are oversteepened, that is, barely stable under gravity loading. The size of the failure can range from small slides of a few yards of soil to movements involving thou- sands of yards of soil. In highly seismic areas of the WUS, the potential for seismic instability becomes a key consideration in some areas, particularly where critical lifeline transporta- tion routes occur. 8.2 Current Practice Earthquake-induced ground accelerations can result in sig- nificant inertial forces in slopes or embankments, and these forces may lead to instability or permanent deformations. Current practice for the analysis of the performance of slopes and embankments during earthquake loading is to use one of two related methods: 1. Limit equilibrium methods using a pseudo-static repre- sentation of the seismic forces. In this approach, induced seismic loads are used in a conventional limit equilibrium analysis to evaluate a factor of safety. The seismic loads are determined on the basis of the ground acceleration and the mass of soil being loaded. 2. Displacement-based analyses using either the Newmark sliding block concept shown schematically in Figure 8-1 or more rigorous numerical modeling methods. In Figure 8-1, when the acceleration exceeds the yield acceleration (that is C/D ratio = FS = 1.0), deformations accumulate leading to permanent ground deformation. This procedure is sim- ilar to that adopted for retaining wall analysis as discussed in Chapter 7. Use of these methods for design has been widely adopted in the United States and in international design guidelines. For example, methods are described in detail in the FHWA report titled Geotechnical Earthquake Engineering (FHWA, 1998a) and a publication on Guidelines for Analyzing and Mitigating Landslide Hazards in California (SCEC, 2002). 8.2.1 Limit Equilibrium Approach The limit equilibrium approach involves introducing a seismic coefficient to a conventional slope stability analysis and determining the resulting factor of safety. The seismic co- efficient is typically assumed to be some percentage of the site-adjusted PGA occurring at a site. The value can range from less than 50 percent of the peak to the PGA, depending on the designerâs views or agency requirements. Typically, a slope is judged to be safe if the resulting factor of safety is greater than 1.1 to 1.3. As discussed in the FHWA publication, a wide variety of commercially available computer programs exist that can perform both static and pseudo-static limit equilibrium analyses. Most of these programs provide general solutions to slope stability problems with provisions for using the simpli- fied Bishop, simplified Janbu, and Spencerâs method of slices.
98 Potential sliding surfaces, both circular or polygonal, usually can be prespecified or randomly generated. Commonly used programs include PCSTABL (developed at Purdue Univer- sity), UTEXAS4 (developed at the University of Texas at Austin), SLOPE/W (distributed by Geo-Slope International), and SLIDE (RocScience). An important consideration in the limit equilibrium ap- proach is that the rate of loading during the earthquake is rel- atively fast. For this reason, in most cases undrained total stress strength parameters should be used in the stability model, rather than drained or effective stress parameters. The undrained total stress parameters are obtained from static strength tests conducted in the laboratory, from in situ strength testing or from empirical relationships. Although the rate effects associated with earthquake load- ing may result in a higher undrained strength during the first cycle of loading, various studies have shown that after 10 to 15 cycles of significant loading, as might occur during a seis- mic event, degradation of the undrained strength often oc- curs. In view of this potential for degradation, a conservative approach is to use the static undrained strength in the seismic stability analysis. Where this simplification is questionable, cyclic loading tests can be conducted in the laboratory to ob- tain a more precise definition of the strength parameters dur- ing cyclic loading. In the limit equilibrium approach, a seismic coefficient is used to determine the inertial forces imposed by the earth- quake upon the potential failure mass. The seismic coefficient used in the analysis is based on the site-adjusted PGA ad- justed for wave scattering effects using the α factor defined in Chapters 6 or 7. The vertical acceleration is normally set equal to zero based on studies that have shown vertical accelera- tions have a minor effect on the seismic stability evaluation for most cases. A factor of safety is determined by applying the seismic co- efficient in the limit equilibrium stability program. An allow- able factor of safety is selected such that behavior of the slope, in terms of permanent deformation, is within a range con- sidered acceptable. A factor of safety (or C/D ratio) of more than 1.0 when using the peak seismic coefficient implies no slope movement, while a factor of safety less than 1.0 when using the peak seismic coefficient implies permanent move- ment. Typically, the seismic coefficient is assumed to be 50 per- cent of the peak, as noted above, reflecting the acceptance of 1 to 2 inches of permanent movement. In this case, as long as the factor of safety is greater than 1.1 to 1.3, the deformations are assumed to be minimal. The drawback of the limit equilibrium approach lies in the difficulty of relating the value of the seismic coefficient to the characteristics of the design earthquake. Use of either the peak ground acceleration coefficient or the peak average hor- izontal acceleration over the failure mass, in conjunction with a pseudo-static factor of safety of 1.0, usually gives excessively conservative assessments of slope performance in earthquakes. However, often little guidance on selection of the seismic coefficient as a fraction of the peak ground acceleration is available to the designer. Los Angeles County uses a nominal seismic coefficient of 0.15 and requires a factor of safety >1.1. The recently pub- lished guidelines by Southern California Earthquake Center (SCEC) (2002) for the State of California suggests reducing peak ground acceleration map values in California by about 0.3 to 0.6 (depending on earthquake magnitude and peak ground acceleration values) to ensure slope displacements are Figure 8-1. Newmark sliding block concept for slopes.
less than about 6 inches, a screening value suggested as a po- tential criteria to determine if a Newmark displacement analysis is necessary. 8.2.2 Displacement-Based Approach In contrast to the limit equilibrium approach, the displacement-based approach involves the explicit calculation of cumulative seismic deformation. The potential failure mass is treated as either a rigid body or deformable body, depending on whether a simplified Newmark sliding block approach or more advanced numerical modeling is used. 8.2.2.1 Newmark Sliding Block Approach The Newmark sliding block approach treats the potential failure mass as a rigid body on a yielding base. The accelera- tion time history of the rigid body is assumed to correspond to the average acceleration time history of the failure mass. Deformation accumulates when the rigid body acceleration exceeds the yield acceleration of the failure mass (ky) where ky is defined as the horizontal acceleration that results in a factor of safety of 1.0 in a pseudo-static limit equilibrium analysis. This approach may be used to calibrate an appropriate pseudo-static seismic coefficient reflecting acceptable dis- placement performance, as discussed in Chapter 7 for retain- ing wall analysis. Similar discussions for slopes are presented in the FHWA publication Geotechnical Earthquake Engineering (FHWA, 1998a). For example, Figure 8-2 shows results of Newmark seismic deformation analyses performed by Hynes and Franklin (1984) using 348 strong motion records (all soil/ rock conditions; 4.5 < Mw < 7.4) and six synthetic records. The Hynes and Franklin âupper boundâ curve presented in Fig- ure 8-2 suggests that deformations will be less than 12 inches (30 cm) for yield accelerations greater than or equal to one- half the peak acceleration. In utilizing such curves, it must be recognized that slope- height effects should be taken into account to determine a height-dependent, average maximum acceleration for use as the kmax value (as was the case for retaining walls discussed in Chapter 7). This was recognized by the studies published by Makdisi and Seed (1978), who developed slope displacement design charts for the seismic design of earth dams. Results from the Makdisi and Seed (1978) analyses are shown in Figure 8-3. Analyses were conducted for a limited number of dam heights (for example, 75 to 135 feet) and earthquake records. The lower left figure illustrates the nor- malized reduction in average maximum seismic coefficient with slide depth (equivalent to an α factor using the termi- nology from Chapters 6 and 7), and equals an average of 0.35 for a full height slide (average height studied equals approxi- mately 100 feet) which is compatible with values noted in Chapters 6 and 7. A range of displacements as a function of ky/kmax is noted on the lower right figure and shows earth- quake magnitude variation. The Newmark displacement equations discussed in Chap- ter 5 show insensitivity to earthquake magnitude, which is be- lieved to be better reflected in PGV. Makdisi and Seed note that variability is reduced by normalizing data by kmax and the natural period of embankments. The height parameter used in the analyses conducted for this Project reflects changes in natural period, and kmax is included in the Newmark equation. In 2000 an updated approach for estimating the displace- ment of slopes during a seismic event was developed through the SCEC. The displacement analysis procedures documented in the SCEC (2002) Guidelines are relatively complex and would require simplification for use in a nationwide specifi- cation document. Recommended procedures described in the SCEC Guidelines are illustrated by Figures 8-4 and 8-5. Figure 8-4 shows the ratio of the maximum average seis- mic coefficient (averaged over the slide mass) to the maxi- mum bedrock acceleration multiplied by a nonlinear re- sponse factor (NRF) (equals 1.00 for 0.4g) plotted against the natural period (Ts) of the slide mass (4H/Vs, where H is the average height of slide and Vs is the shear wave velocity) di- vided by the dominant period Tm of the earthquake. In effect, this plot is analogous to the plot of α versus the wall height (assuming the height of the slide equals the wall height) dis- cussed in Chapter 6. For example, if Tm = 0.3 sec, H = 20 feet, NRF = 1, Vs = 800 ft/sec, then Ts /Tm = 0.1/0.3 = 0.33, and hence α = 1 as would be expected. However, if H = 100 feet with the same parameters, Ts /Tm = 0.5/0.3 = 1.66 and hence α = 0.3, which is reasonably compatible with the α curves presented in Chapter 6. Figure 8-2. Permanent seismic deformation chart (Hynes and Franklin, 1984). 99
100 Figure 8-5 shows a median prediction sliding displacement chart, normalized by kmax and D5â95, an earthquake duration parameter dependent on magnitude. For example, if ky/kmax = 0.2, kmax = 0.4, D5â95 = 10 seconds, then u equals about 15 inches, compared to about 6 inches (or 12 inches to achieve an 84 per- cent confidence level) for the recommended Newmark chart shown on Figure 7-18 of this report. This difference is rela- tively small considering the general accuracy of the Newmark method. 8.3 Proposed Design Methodology Two approaches for the seismic design of embankments and slopes are described in the previous section: (1) the limit equilibrium approach, and (2) displacement-based method. Both are relatively simple to use, and both involve essentially the same modeling effort. The advantage of the displacement- Figure 8-3. Permanent seismic deformation charts (Makdisi and Seed, 1978). Figure 8-4. Normalized MHEA for deep-seated slide surface vs. normalized fundamental period of slide mass (Bray and Rathje, 1998). Figure 8-5. Normalized sliding displacement (SCEC, 2002; modified from Bray and Rathje, 1998).
based approach is that the amount of movement associated with the analysis is estimated, and sometimes this can be an important consideration. Note that both approaches assume that liquefaction or porewater pressure effects are not a con- sideration. Section 8.5.3 provides comments on the potential treatment of liquefaction. 8.3.1 Limit Equilibrium Approach The limit equilibrium approach involves the following steps: 1. Conduct static slope stability analyses using appropriate resistance factors to confirm that performance meets static loading requirements. Typically these will be a C/D ratio of 1.3 to 1.5 for natural slopes and 1.5 for engineered slopes. A variety of factors should be considered when se- lecting the C/D ratio including the quality of the site char- acterization and the implications of failure. Both short- term, undrained stability, and long-term drained stability should normally be considered in this evaluation. 2. Establish the site peak ground acceleration coefficient kmax and spectral acceleration at one second, S1 from the new AASHTO ground motions maps for a 1,000-year re- turn period, including appropriate site soil modification factors. 3. Determine the corresponding PGV from correlation equations between S1 and PGV (provided in Chapter 5). 4. Modify kmax to account for slope height effects for full slope or embankment height stability analyses (note that α factors described in Chapter 7 for retaining walls appear compatible with those for slopes based on comparison with analysis methods described above). 5. Reduce the resulting kmax by a factor of 0.5, as long as 1 to 2 inches of permanent displacement are permissible. If larger amounts of deformation are acceptable, further re- ductions in kmax are possible, but these would have to be determined by conducting separate calibration studies between displacement and the ratio of the yield accelera- tion (ky) and kmax. 6. Conduct a conventional slope stability analysis using 0.5 kmax. If the factor of safety is at least 1.1, the slope meets seismic loading requirements. 8.3.2 Displacement-Based Approach The following displacement-based methodology is recom- mended for slopes and embankments, where the static strength parameters can reasonably be assumed for seismic analyses: 1. Conduct static slope stability analyses using appropriate resistance factors to confirm that performance meets static loading requirements. 2. Establish the site peak ground acceleration coefficient kmax and spectral acceleration at one second, S1 from the new AASHTO ground motion maps for a 1,000-year return period, including appropriate site soil modification factors. 3. Determine the corresponding PGV from correlation equations between S1 and PGV (provided in Chapter 5). 4. Modify kmax to account for slope height effects for full slope or embankment height stability analyses (note that α factors described in Chapter 7 for retaining walls appear compatible with those for slopes based on comparison with analysis methods described above). 5. Determine the yield acceleration (ky) using a pseudo-static stability analysis for the slope (that is, the seismic coeffi- cient corresponding to a factor of safety equal to 1.0). Note that these stability analyses should normally be conducted using the undrained strength of the soil because of the short-term loading from the earthquake. 6. Establish the earthquake slope displacement potential cor- responding to the value of ky/kmax using the Newmark dis- placement chart recommendations given in Chapter 5. 7. Evaluate the acceptability of the displacement based on performance criteria established by the owner for the spe- cific project site. 8.4 Example Application The proposed displacement-based methodology is illus- trated by considering an existing slope located in the State of Washington. This slope is next to a heavily traveled roadway. The roadway is being widened to accommodate projected in- creases in traffic. Stability analyses were required to deter- mine the potential effects of seismic loading to the slopes lo- cated above and below the roadway. 8.4.1 Problem Description Seismic stability of the natural slopes was evaluated for the following conditions: ⢠Slope angles ranging from 2H:1V up to 1H:1V. ⢠Soils comprised of glacial till and fill. Till is a dense silty sand with gravel. Standard penetration test (SPT) blow- counts range from 30 blows per foot to refusal. Soil strength values were interpreted from SPT blowcounts. (See Appendix J for sections and assigned properties). ⢠Groundwater located at the base of the slope. ⢠The firm-ground values of PGA, Ss, and S1 for site are esti- mated to be 0.41g, 0.92g, and 0.30g, respectively, for the 1,000-year earthquake based on the USGS deaggregation website. (Note that at the time the example was developed, the new AASHTO ground motion hazard maps and im- plementation CD were not available to the NCHRP 12-70 101
102 Project Team.) The soil conditions are representative of Site Class C. The objective of the seismic stability study was to evaluate the displacements that would be expected for the design earthquake. The owner also is interested in the risk to the roadway facility, and therefore, stability also was evaluated for a 10 percent probability of exceedance in 50 years (475-year event) and for a 2 percent probability of exceedance (2,475-year event). There is debate locally on the strength properties to assign till; therefore, each of the commonly used alternatives is evaluated. 8.4.2 Results The ground motion criteria for the site were obtained from the USGS website for the three return periods, as summarized in Table 8-1; local site effects were considered using the pro- cedures recommended in Chapter 5. The computer program SLIDE was used to determine the static factor of safety and then the yield accelerations (ky) for the various cases involved. With the yield acceleration, site- adjusted PGV, and the site-adjusted peak seismic coefficient (that is, PGA adjusted for site class and wave scattering), the equations in Chapter 5 were used to estimate permanent dis- placement. The estimated displacements from the analyses are summarized in Table 8-2. The summary in Table 8-2 indicates that the displacements ranged from zero to a maximum of 73 inches, depending on assumptions made for soil properties and the design earth- quake. Details for these analyses are included in Appendix J. 8.5 Other Considerations There are three other considerations relative to the seismic design of slopes and embankments: (1) the use of the limit equilibrium method for determining acceptability of slope under seismic loading, (2) the acceleration level at which a âNo Analysisâ approach can be invoked, and (3) methods to consider when there is a liquefaction potential. These con- siderations are summarized below. 8.5.1 Limit Equilibrium Design Methods Computer programs are routinely used for evaluating the static stability of slopes. As demonstrated in the example problem, the incremental effort to determine ky is relatively minor. However, a particular state DOT may choose to de- velop a value of kmax to use either (1) in pseudo-static screen- ing analyses (by calibrating against a displacement chart ap- propriate for seismic hazard levels in their state) in lieu of requiring a displacement analysis, or (2) if they feel a dis- placement level different than the several inches identified in Section 8.3.1 is permissible. Ground Motion Parameter Parameter Units Site Class 7% in 75 Years 10% in 50 Years 2% in 50 Years PGA B 0.41 0.31 0.58 Ss B 0.92 0.68 1.30 S1 B 0.30 0.22 0.44 Ss/2.5 0.37 0.27 0.52 Magnitude 6.8 6.8 6.8 C 1.00 1.10 1.00Fpga D 1.10 1.20 1.00 C 1.50 1.58 1.36 Fv D 1.80 1.96 1.56 In/sec C 25 19 33PGV In/sec D 30 24 38 C 1.10 1.02 1.03 β = Fv S1 / Fpga PGA* D 1.20 1.16 1.18 Failure Slope Height ft 15 15 15 C 0.93 0.93 0.93 α Factor per Equation 7-2 D 0.94 0.94 0.94 C 0.38 0.32 0.54Kav = PGA*Fpga * α D 0.42 0.35 0.54 Table 8-1. Ground motions for example problem.
Typically, if the site is nonliquefiable (that is, significant loss in strength does not occur during seismic loading), a seis- mic coefficient of 50 percent of the site-adjusted PGA (after adjustments for site soil effects and wave scattering) will re- sult in ground displacements of less than 1 to 2 inches, as long as the resulting C/D ratio (that is, factor of safety) is greater than 1.0. In view of the simplifications associated with this method, common practice is to use a C/D ratio > 1.1 to de- fine acceptable slope conditions. It is a fairly simple task to calibrate the reduction based on the typical site-adjusted PGA and PGV for the area, the shape of the normalized response spectrum, and the displacement that is acceptable. Newmark curves in Chapter 5 then can be used to âback outâ the ky value. If the ky value is used in the slope stability computer program as the seismic coefficient, and the resulting factor of safety is greater than 1.0, acceptable slope displacements are predicted. 8.5.2 No Analysis Cut-off The same concept as described in the preceding subsection can be used to define a âno analysisâ area. In this case, if the C/D ratio for gravity loading is greater than a predetermined value, then the slope will be inherently safe during seismic loading, as long as liquefaction does not occur. For engi- neered slopes, most transportation agencies require that the minimum C/D ratio is 1.5 or more, and for natural slopes the acceptable C/D ratio ranges from 1.3 to 1.5, depending on the potential consequences of slope instability. The following results were developed to define combina- tions of slope angles and the site-adjusted PGA values below which a seismic stability analysis did not appear warranted. This guidance must be used with some care. It works best when the slope is relatively homogeneous in consistency and there is no water table within the slope. As the slope becomes more complicated, particularly if there are thin, low-strength bedding planes, then this screening criteria identified in Table 8-3 should not be used and a detailed slope stability analysis performed, in which the strength in each soil layer is modeled. 8.5.3 Liquefaction Potential No effort has been made within this Project to introduce liquefaction effects into the seismic stability analysis. This topic has been specifically avoided due to the complexity of the issues involved and the on-going debate regarding the best approach for addressing liquefaction. Several approaches are currently being used or proposed. ⢠The simplest are the empirical relationships suggested by Youd et al. (2002) for estimating displacement during lat- Ground Motion Displacement (inches) Parameter Slope Angle Static C/D Ratio kyield 7% in 75 Years 10% in 50 Years 2% in 50 Years Upper Bound Till (Ï = 42 degrees) Case 1 1H to 1V 0.9 NA NA NA NA Case 2 1.5H to 1V 1.3 0.13 6-9 3-5 14-18 Case 3 2H to 1V 1.7 0.25 <1 <1 3-4 Upper Bound Till (Ï = 38 degrees, c = 200 psf) Case 1 1H to 1V 1.2 0.09 12-19 7-11 26-32 Case 2 1.5H to 1V 1.6 0.26 <1 0 3 Case 3 2H to 1V 2.0 0.32 0 0 <1 Lower Bound Till (Ï = 36 degrees) Case 1 1H to 1V 0.8 NA NA NA NA Case 2 1.5H to 1V 1.2 0.07 18-27 11-17 36-44 Case 3 2H to 1V 1.5 0.17 3-5 1-2 8-11 Table 8-2. Results of ground displacement estimates for example stability evaluation. Slope Angle Fpga PGA 3H:1V 0.3 2H:1V 0.2 Table 8-3. Proposed screening levels for no-analysis cut-off. 103
104 eral spreading. These relationships are based on empirical correlations between observed lateral displacement, earth- quake parameters, and soil conditions. This approach is typically applied near rivers or other locations where slopes are gentle and a free face might exist. Generally, results from these methods are considered most suitable for screen- ing of potential displacement issues and involve too much uncertainty for design. ⢠An approach was suggested in the NCHRP 12-49 Project (NCHRP Report 472, 2002) for addressing liquefaction of bridge abutments. This approach includes the effects of foundation pile pinning. Combinations of earthquake magnitude, site-adjusted PGA, and SPT blowcounts are used to decide whether the liquefaction analysis is required. A residual strength is assigned to the liquefied layer using either of two empirical relationships (Seed and Harder, 1990; Olson and Stark, 2002). While this approach is rela- tively simple to apply, it is often criticized that it relies on triggering relationships for liquefaction and does not prop- erly account for the dilation effects that occur under large ground displacement. Results of recent centrifuge research programs also indicate the methodology may not replicate important mechanisms that occur during seismic loading. ⢠Various computer models, such as FLAC, also are used commonly to investigate the seismic stability problem where liquefiable soils have been identified. These methods seem to be used extensively by designers, often without having a particularly good understanding or appreciation for the uncertainties of the model. One significant criticism of this method is that thin layers that lead to ground dis- placement during liquefaction are often ignored. ⢠The NCHRP 20-07 Project initially suggested that the en- tire issue of liquefaction could be ignored if the magnitude of the design earthquake is less than a value of approxi- mately 6.5. The controlling magnitude was taken from a study conducted by Dickenson et al. (2002) for the Oregon Department of Transportation. It is likely that Dickenson and his co-authors did not intend for his work to be used in this manner, and preliminary feedback from the geo- technical community suggested that this approach was too unconservative for adoption by AASHTO. There is little doubt that liquefaction-related slope insta- bility is an important consideration in some locations. How- ever, in the absence of a consensus approach within the pro- fession for handling this issue, it is difficult to provide specific guidance. The current difficulty in developing an approach results from uncertainties in two areas: (1) the capacity of the soil in its liquefied state, particularly where there are static shearing stresses (that is, sloping ground effects) for the site and also where the soil could dilate under large deformations, and (2) the ground motions to use after the seismic wave trav- els through the liquefied soil. While numerical methods, such as DESRA (1978), are available to address the latter issue, these methods are limited in availability to designers. The approach used to address liquefaction during seismic slope and embankment design has and likely will continue to require more research. Until a consensus is reached within the profession, the NCHRP 12-70 Project team recommends using the methodology summarized in the NCHRP 12-49 Project, but providing more cautionary words on the limitations of this method. 8.6 Conclusions This chapter summarizes the approach recommended for the seismic analysis and design of slopes. The methodology uses conventional limit equilibrium slope stability analysis methods, in combination with the Newmark method for es- timating displacements. Relative to existing methods, the approach: ⢠Incorporates the results of wave scattering and ground mo- tion studies summarized in Chapters 5 and 6, including an equation that relates the PGV to the spectral acceleration at one second. ⢠Uses a new set of equations for estimating displacements that were calibrated against the USNRC strong motion data- base, making the equations applicable to the CEUS as well as the WUS. The proposed method is thought to be relatively simple to use and easily adopted by designers. The primary outstand- ing issues are (1) the use of this method to develop a âno analysisâ approach and (2) an appropriate methodology for introducing liquefaction potential into the analysis. Interim approaches for addressing each of these issues are given in the chapter; however, further research on each is required.
