


Below is the uncorrected machine-read text of this chapter, intended to provide our own search engines and external engines with highly rich, chapter-representative searchable text of each book. Because it is UNCORRECTED material, please consider the following text as a useful but insufficient proxy for the authoritative book pages.
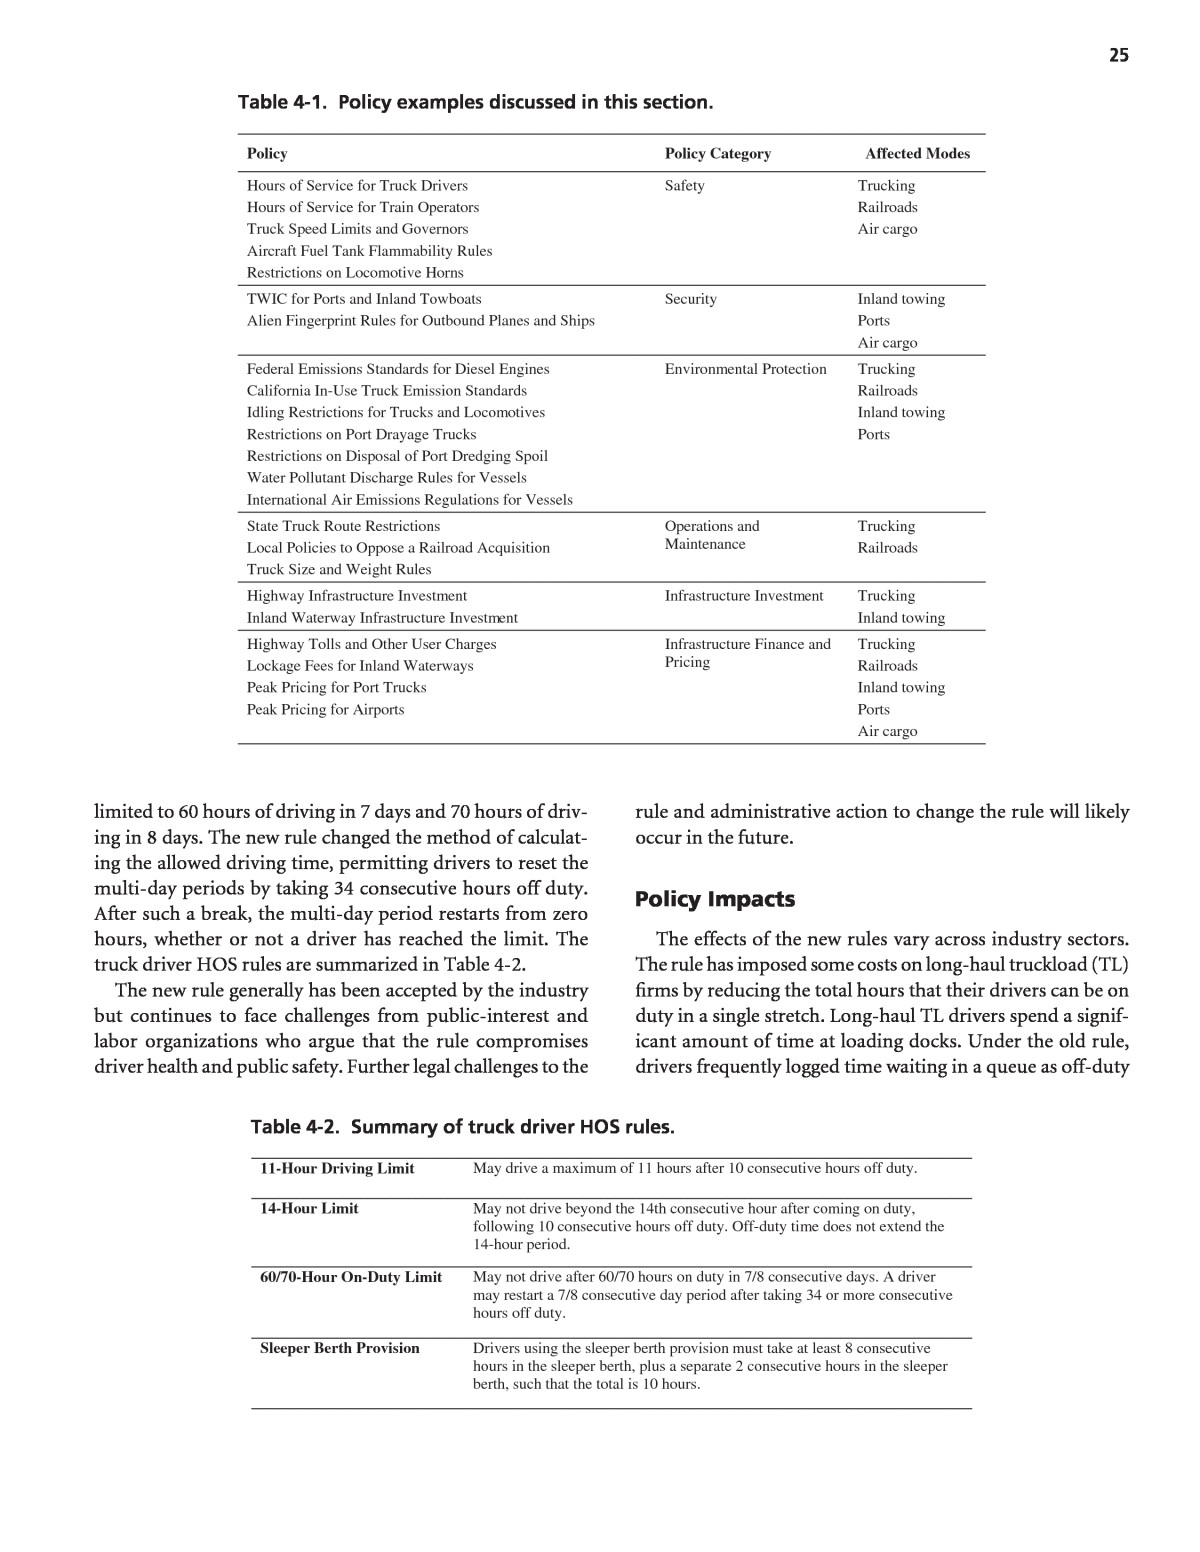
24 Introduction Government policy decisions can affect the freight trans- portation system in numerous ways. Many of these effects are small, but some can be significant. Because the freight trans- portation system is the backbone of the U.S. economy, changes in freight movement can ripple through U.S. society and affect us in our daily lives. Freight system effects can be complex, and an understand- ing of the effects often requires at least a basic knowledge of the policy context. To illustrate these effects, this chapter re- views 23 government policy decisions, listed in Table 4-1. Some of these examples reflect a single law or government agency rulemaking (e.g., HOS rules for truck drivers). Other examples reflect a set of multiple policy decisions with a sim- ilar objective (e.g., Federal emission standards for diesel en- gines). In a few cases, the âpolicyâ is one of inaction rather than action (e.g., inland waterway infrastructure investment). Given that this research is to inform policy debates, the re- search team focused on examples of recently enacted policies (nearly all post-1990) and also some proposed policies that have not been enacted. ⢠Recently enacted policies may have effects that can be ob- served, or the effects may not yet be evident. In many cases, the effects of these policies have been projected as part of an impact analysis, although such analyses may not have considered the impacts on all components of the freight system. ⢠Proposed policies obviously do not have effects that can be observed, although effects can be projected based on similar past policies. Effects may have been projected (e.g., by the government, an affected party, or a researcher), par- ticularly for Federal government rules on safety, security, or environmental issues. For each example, the research team briefly describes the policy and its effects to the extent they are understood. The information on effects was informed by an extensive litera- ture review, interviews with approximately 40 freight indus- try experts, and two focus groups. For five of the examples, a more detailed examination of the effects of the policies is in- cluded in Appendix B. The research team then briefly discusses the extent to which any effects were unexpected by the involved policymakers and the extent to which understanding the effects is relevant to de- cision making. This last pointâthe decision-making context and role of informationâis discussed in greater detail in Chapter 6. HOS Rules for Truck Drivers Policy Description The truck driver HOS rules have been the subject of some controversy since they were first issued in 1938 to improve highway safety by reducing truck driver fatigue. After a sig- nificant change in 1962, the rules remained largely the same until 2003. During this period, the HOS rules limited opera- tors of commercial vehicles to 10 hours of driving before an 8-hour rest break and an on-duty period of not more than 15 hours before the 8-hour break. The 15-hour âclockâ would, however, stop when a driver went off duty for a meal or any kind of short rest. Thus, the elapsed time from the start of the on-duty period to the end could easily exceed 15 hours. In 2003 the rule was modified to enhance truck safety by reducing fatigue. The new rule put drivers on a 24-hour cycle of on- and off-duty time, consistent with natural circadian rhythm. The rule also reduced the on-duty hours from 15 to 14 and extended the required rest period to 10 hours. Further, and importantly, the new 14-hour on-duty clock does not stop for an interim break. Fourteen hours after the start of an on-duty period, a driver cannot drive until after a 10-hour break. The rule also increased total driving time from 10 to 11 hours per day. The HOS rules also address total driving time in a multi-day period. Under the old rule, drivers were C H A P T E R 4 How Do Public Policies Affect the Freight Transportation System?
25 limited to 60 hours of driving in 7 days and 70 hours of driv- ing in 8 days. The new rule changed the method of calculat- ing the allowed driving time, permitting drivers to reset the multi-day periods by taking 34 consecutive hours off duty. After such a break, the multi-day period restarts from zero hours, whether or not a driver has reached the limit. The truck driver HOS rules are summarized in Table 4-2. The new rule generally has been accepted by the industry but continues to face challenges from public-interest and labor organizations who argue that the rule compromises driver health and public safety. Further legal challenges to the rule and administrative action to change the rule will likely occur in the future. Policy Impacts The effects of the new rules vary across industry sectors. The rule has imposed some costs on long-haul truckload (TL) firms by reducing the total hours that their drivers can be on duty in a single stretch. Long-haul TL drivers spend a signif- icant amount of time at loading docks. Under the old rule, drivers frequently logged time waiting in a queue as off-duty Policy Policy Category Affected Modes Hours of Service for Truck Drivers Hours of Service for Train Operators Truck Speed Limits and Governors Aircraft Fuel Tank Flammability Rules Restrictions on Locomotive Horns Safety Trucking Railroads Air cargo TWIC for Ports and Inland Towboats Alien Fingerprint Rules for Outbound Planes and Ships Security Inland towing Ports Air cargo Federal Emissions Standards for Diesel Engines California In-Use Truck Emission Standards Idling Restrictions for Trucks and Locomotives Restrictions on Port Drayage Trucks Restrictions on Disposal of Port Dredging Spoil Water Pollutant Discharge Rules for Vessels International Air Emissions Regulations for Vessels Environmental Protection Trucking Railroads Inland towing Ports State Truck Route Restrictions Local Policies to Oppose a Railroad Acquisition Truck Size and Weight Rules Operations and Maintenance Trucking Railroads Highway Infrastructure Investment Inland Waterway Infrastructure Investment Infrastructure Investment Trucking Inland towing Highway Tolls and Other User Charges Lockage Fees for Inland Waterways Peak Pricing for Port Trucks Peak Pricing for Airports Infrastructure Finance and Pricing Trucking Railroads Inland towing Ports Air cargo Table 4-1. Policy examples discussed in this section. 11-Hour Driving Limit May drive a maximum of 11 hours after 10 consecutive hours off duty. 14-Hour Limit May not drive beyond the 14th consecutive hour after coming on duty, following 10 consecutive hours off duty. Off-duty time does not extend the 14-hour period. 60/70-Hour On-Duty Limit May not drive after 60/70 hours on duty in 7/8 consecutive days. A driver may restart a 7/8 consecutive day period after taking 34 or more consecutive hours off duty. Sleeper Berth Provision Drivers using the sleeper berth provision must take at least 8 consecutive hours in the sleeper berth, plus a separate 2 consecutive hours in the sleeper berth, such that the total is 10 hours. Table 4-2. Summary of truck driver HOS rules.
26 time. This was not legal, but it prevented the waiting time from constraining their allowed driving and on-duty time. For most long-haul TL drivers, the non-stopping clock has had a greater effect on time from start to end of an on-duty period than the reduction of on-duty time from 15 to 14 hours. Because waiting time now reduces time available for driving, the ability of long-haul TL drivers to use the allowed 11th driving hour is limited. The inability to stop the clock for a break may also be a fac- tor when new rules (e.g., local requirements that deliveries be made only at certain times) force changes in scheduling. That a driver cannot go off the clock when, for example, such a change introduces a delay at the end of a trip, may introduce new complexities into trip planning. FMCSA analysis of survey data before and after the 2003 rule change suggests that the rule has reduced hours on the job for drivers.3 In fact, on-duty hours fell from 64 to 62 for an 8-day period in a random selection of drivers. It is likely that this effect was greatest for long-haul TL drivers in un- scheduled operation. Less-than-truckload (LTL) over-the- road drivers are almost always on schedules, and the same is true for many private drivers. Given that these latter groups of drivers typically do not come close to exhausting their on- duty hours, more of them are likely to be driving at least part of the 11th hour. A study by J. B. Hunt found that 74 percent of their drivers used the 34-hour restart provision at least once in 30 days.4 Increased scheduling flexibility from the 34-hour restart pe- riod has been widely perceived as a benefit under the new rule. Aside from the flexibility, many drivers appreciate that the restart makes it easier for them to keep track of their al- lowable hours under the multi-day provision; the procedure for the old rule was complicated. Unexpected Impacts A number of industry comments have suggested that the rule change has not had a negative impact on trucking pro- ductivity. Industry trends in safety performance measures have been positive. Large truck fatality and injury rates per mile have decreased during the period that the new HOS rule has been in effect.5 In general, these results are consistent with the forecast impacts in the regulatory impact analysis (RIA) for the rule. The decisionmakers in FMCSA had a clear idea of what the effects would be. As a result of the non-stopping 14-hour clock in the 2003 rule, carriers have had a stronger hand in working with ship- pers and receivers to reduce driver wait times. In many cases, carriers have imposed detention charges. As a result, shippers and receivers have had to take measures to reduce waiting time at their loading docks. The effect of reduced waiting time was not specifically analyzed in the RIA as a benefit of the rule. In this sense, this was an unexpected impact. HOS Rules for Train Operators Policy Description The railroad HOS rules were originally created by statute in 1907 to correct abusive labor conditions in the railroad industry. Until recently, the law required that train crews and dispatchers work no more than 12 hours at a time. After 12 hours on duty, there must be 10 hours off duty. However, if crews work less than 12 hours, they are only required to be given 8 hours of rest. In some cases, a train crew will reach its HOS limit at a place where they cannot be released from duty. In these cases, crews are required to stop the train, wherever it is, and wait for a new crew. The time after the train stops and before the crew can go off-duty is known as âlimboâ time. Limbo time has come to mean time spent waiting for a new crew plus time traveling to the location where they can be released from duty. Limbo time does not count toward on-duty or off-duty time. Detailed provisions for limbo time are in each railroadâs labor agreements, and they vary among carriers. On September 12, 2008, a Metrolink passenger train col- lided with a Union Pacific freight train in Los Angeles, killing 25 people. Following the accident, Congress pushed rapidly to pass a rail safety law. On October 16, 2008, President Bush signed the Rail Safety Improvement Act of 2008 into law. Be- lieving that long work hours contributed to the accident, the law revised the railroad HOS rules that went into effect in July of 2009. Specifically, the Act ⢠Limits the total on-duty and limbo time for train crew and dispatchers to 276 hours per month; ⢠Keeps total allowable shift time at 12 consecutive hours; ⢠Increases uninterrupted off-duty hours from 8 to 10 hours in a 24-hour period, regardless of prior on-duty time; and ⢠Requires 2 consecutive days off after 6 consecutive days worked or 3 consecutive days off after 7 consecutive days worked and reduces allowable limbo time to 40 hours per month and then to 30 hours per month 1 year after enactment. Policy Impacts Overall, recent changes to the HOS rule will likely improve safety on passenger and freight railroads. The changes address 3FMCSA, Final Rule: Hours of Service of Drivers, August 25, 2005, 70 FR 49977- 50073. 4Ibid. 5Insurance Institute for Highway Safety, âFatality Facts: 2006,â www.iihs.org/ research/fatality_facts_2006/largetrucks.html#sec1
widely acknowledged limitations of the current work rules. Authority over the rules was moved from the Department of Labor to the FRA to ensure a greater focus on safety. Unexpected Impacts The rules will reduce train operator fatigue, but will likely require that railroads hire more staff for train crews. More re- strictive work rules will make it more likely that a fully rested train crew might be unavailable for service. In some cases, this could cause delays in the movement of freight or passenger trains during times of heavy demand. Over time, one would expect railroads to hire staff and adjust operations to reduce the likelihood of this happening. Another possible response to the new rule is that railroads may seek to reduce the number of crew required to staff a train. The Rail Safety Improvement Act requires that railroads adopt positive train control. When positive train control tech- nologies are fully implemented, railroads may be able to argue that train crews can safely be reduced to a single person. Because the new rules were implemented just prior to this writing, it is difficult to identify any unexpected impacts at this time. The speed with which the bill was passed suggests that Congress may not have fully considered all of its poten- tial effects. In addition, because the rule was implemented by statute, a notice and comment period and a formal RIA were not conducted. FRA is issuing some new rules to implement parts of the law. The demographics of the current railroad workforce will require companies to hire aggressively. Retirement of a large cohort of workers will soon require significant new staff recruitment. The HOS rule changes will require more new workers beyond those needed for replacement. To the extent that new and less experienced staff constitute a higher safety risk, the initial safety benefits of the rule may not be as large as expected, but this effect would disappear over time, as the new staff acquires experience. Truck Speed Limits and Speed Governor Rules Policy Description The first speed limits were introduced in 1901 to improve roadway safety. Since then, setting speed limits has been mostly the purview of state governments. To reduce fuel con- sumption during the energy crisis, the Emergency Highway Energy Conservation Act was passed in 1973, which created a national speed limit of 55 miles per hour. In response to pub- lic pressure for higher limits, Federal law was modified in 1987 to allow speed limits as high as 65 mph. National speed limits were repealed in 1994. Although advocates of the na- tional speed limit in 1973 estimated that it would reduce fuel consumption by 2.2 percent, widespread non-compliance re- sulted in fuel savings that were substantially lower, between 0.5 and 1 percent.6 Following the repeal of the national speed limit in 1994, many states have raised speed limits to 70 or 75 mph for auto- mobiles and introduced differential speed limits for cars and trucks. These limit heavy trucks to maximum speeds that are as much as 15 mph less than automobiles (see Figure 4-1). A related policy debate concerns mandatory speed gover- nors on trucks. The American Trucking Associations (ATA) 5 mph difference 10 mph difference 15 mph difference Source: Insurance Institute for Highway Safety, Highway Loss Data Institute, http://www.iihs.org/laws/speedlimits.aspx Figure 4-1. Auto/truck difference between maximum interstate speed limits, 2009. 6Steven L. Johnson and Naveen Pawar, âCost-Benefit Evaluation of Large Truck- Automobile Speed Limit Differentials on Rural Interstate Highways,â Prepared for the Research and Special Programs Administration, US DOT. November 2005. 27
28 submitted a petition in 2006 requesting that FMCSA require manufacturers to allow the adjustment of speed-limiting de- vices to no more than 68 mph on all new trucks over 26,000 pounds GVW.7 Approximately 77 percent of ATAâs members have speed limiters set at 68 mph or lower.8 The Province of Ontario recently passed a law requiring trucks with a model year of 1995 or newer to be speed limited at 65 mph, and the Province of Quebec has adopted similar rules.9 Policy Impacts The safety impact of lowering speed limits and creating dif- ferential speed limits for cars and trucks has been the subject of debate among researchers and policymakers. Research clearly finds that lower vehicle speeds reduce the severity of crashes and the incidence of fatalities.10 Lower speeds also im- prove truck-braking distances. On the other hand, differen- tial speeds caused by lower speed limits can increase crash risk. Many researchers have argued that it is the speed differ- ence between vehicles, not the absolute speed, that is most important for creating crash risk. Trucks traveling at speeds lower than the rest of traffic interact with more vehicles, in- creasing risk. In addition to the car-truck differential, speed limits over 65 mph tend to increase speed differentials be- tween trucks by dividing trucks into company drivers (who tend to be speed limited at lower levels) and owner-operators (who typically can travel at higher speeds). Overall, researchers and policymakers have not reached consensus on the impact of differential speeds. Regarding mandatory truck speed governors, large truck- ing companies, many represented by ATA, are supportive; they argue mandatory truck speed governors improve safety, reduce fuel consumption, and lower vehicle maintenance costs. Small owner-operators represented by the Owner Oper- ator Independent Drivers Association (OOIDA) have opposed the ATA speed limiter proposal, arguing that it is a public re- lations stunt by large businesses that could disadvantage small firms.11 There are also regional differences in firmsâ view of truck speeds. Interview respondents noted that truck- ing firms with major western operations would suffer signif- icant driver productivity losses if speeds were reduced from 75 mph to lower levels. For a more detailed discussion of the ef- fects of truck speed policies, see Appendix B. Unexpected Impacts The fuel economy impacts of the 1973 law were overesti- mated because lawmakers did not consider the effects of non- compliance. With respect to the recent increase in highway speed limits, the negative effects of differential speed limits were not fully expected by legislators and policymakers. The safety benefits of these policies have yet to be conclusively documented with scientific studies. Nonetheless, many indus- try safety managers are proponents of reducing truck speeds based on their firmsâ experience. A potential unexpected impact of governing speed could be higher driver turnover, because many drivers oppose the use of speed governors, especially when drivers are paid by the mile or trip. If driver turnover increases and results in experienced drivers being replaced with inexperienced drivers, this could increase safety risk. Surveys of drivers have also suggested that being speed limited at lower speeds can cause fatigue in drivers on long trips. Drivers will obviously be on the road for less time if they travel at higher speeds. Speed-limited drivers also ex- pressed frustration at being trapped in the right-hand lane and being forced to constantly deal with merging traffic.12 Aircraft Fuel Tank Flammability Rules Policy Description Since 1960, 18 airplanes have been damaged or destroyed as the result of fuel tank explosions. Such an explosion was determined to be the cause of the 1996 crash of TWA Flight 800 off Long Island, New York. This accident resulted in the death of all 230 people aboard. Although investigators have not always identified the ignition source of these explosions, for some of the most recent incidents, investigators deter- mined that the explosion involved empty or nearly empty center-wing fuel tanks that contained flammable vapors when the fuel tanks exploded.13 In response to these incidents, FAA issued a final rule in July 2008 that requires manufacturers and operators of certain jet aircraft (both new and existing) to meet performance require- ments for reducing fuel tank flammability to an acceptably safe level.14 Although the rule does not direct the adoption of 7ATA, âPetition for Rulemaking before the National Highway Traffic Safety Ad- ministration (NHTSA) to amend 48 CFR Part 571 to Require Vehicle Manufac- turers to Install Speed Limiting Devices Set at No More than 68 MPH on New Trucks with a GVWR of Greater than 26,000 Pounds,â 2006. 8âTruckers Back a National 65-mph Speed Limit,â U.S. News and World Report, March 26, 2008. 9âOntario to Require 65-MPH Speed Limiters on Trucks,â Transport Topics, June 18, 2008. 10TRB, Safety Impacts of Speed Limiter Device Installations on Commercial Trucks and Buses: A Synthesis of Safety Practice, 2008. 11OOIDA, âOOIDA Accuses Feds of Pandering to Big Business by Toying with Speed Limiter Idea,â press release, January 26, 2007. 12Johnson and Pawar, November 2005. 13FAA, âReduction of Fuel Tank Flammability in Transport Category Airplanes,â Notice of Final Rule, July 21, 2008, 73 FR 42445. 14FAA, 73 FR 42444â42504.
specific technologies, the rule assumes that the affected aircraft will have to be equipped with some additional technology to render flammable vapors inert (âinerting technologyâ) and that the cost will be borne by the aircraft owner or purchaser. In its Notice of Proposed Rulemaking, FAA chose to exempt from the rule aircraft used in all-cargo operations because the potential benefits (in terms of lives saved) are far less than with passenger aircraft. However, the agency invited comments on whether it should apply the new requirements to all-cargo air- planes. Comments on the proposed rule from air cargo com- panies and associations supported FAAâs stance in the pro- posed rule that all-cargo airplanes should be exempted. The commenters noted that FAAâs cost-benefit analysis showed that the benefits of applying the rule to all-cargo airplanes were far outweighed by the costs. FedEx Express added that its own cost figures for installing and maintaining an inerting system were significantly greater than the numbers FAA used. In the final rule, FAA kept the provision exempting existing all-cargo airplane operators from the requirement to retrofit their jets with fuel-inerting technology. But FAA did require that new all-cargo airplanes meet the ruleâs performance re- quirements for fuel-tank flammability. FAA concluded that this requirement for new cargo aircraft would be cost-effective, because the installation of the technology could be efficiently integrated into the production process for new airplanes. Also, the agency asserted that, in most cases, this integration would be done for the passenger version of the same airplane, so ad- ditional engineering work would be minimal. In the final rule, FAA also required that when any airplane is converted from passenger use to all-cargo use, the cargo operator must keep in operation any fuel-inerting technology already on the airplane. Policy Impacts As part of its rulemaking process, FAA estimated undis- counted compliance costs of $100 million ($37 million dis- counted) for air cargo operators. By comparison, FAA esti- mated undiscounted compliance costs of $2.1 billion ($1 billion discounted) for air passenger carriers. The rule is too new to allow a look-back analysis of actual compliance costs. In the re- search teamâs interviews with air cargo carriers, it was noted that if the rule were to add time to preparing an airplane for flight, the rule could prove costly to air cargo carriers offering expe- dited, time-definite deliveries. However, the written comments of FedEx Express, UPS, and the Air Cargo Association did not express any concerns about flight delays, so it appears unlikely that delays will result from the rule. Unexpected Impacts It appears that any impacts of this policy on the freight in- dustry have been fully explored during FAAâs rulemaking process. FAA completed a detailed RIA with impacts broken out for the air cargo industry. Restrictions on Locomotive Horns Policy Description Collisions at highway rail crossings are the second biggest cause of injuries and fatalities in railroad operations.15 As a supplement to grade crossing equipment, the sounding of a locomotiveâs horn before a highway grade crossing pro- vides an additional way to alert motorists of the direction and imminent approach of a train. Nonetheless, to reduce noise levels, many communities have enacted restrictions and bans on the use of locomotive horns, especially com- munities with a large number of grade crossings and high train volumes. The issue was placed on the public agenda in Florida in 1984 by a state law that allowed communities to ban the night- time use of train horns at gated grade crossings associated with intrastate rail carriers. As a result of this, night-time horn bans were implemented at approximately 500 grade cross- ings. A 1992 FRA study found that night-time collisions in Florida had increased 195 percent at the grade crossings with horn bans, while daytime collision rates had remained un- changed.16 This information was distributed to the state of Florida and the localities maintaining the horn bans. None of the bans was repealed as a result of this study. Because of con- cern over the safety effects of horn bans, Congress passed the Swift Rail Development Act in 1994. Among other things, this law instructed FRA to issue a rule requiring the use of loco- motive horns at all public highway rail crossings. Policy Impacts In 1995, FRA conducted a nationwide study on train horn bans. This study was updated in 2000. This research found that enacting horn bans in the absence of substitute safety mea- sures significantly increased the risk of grade-crossing colli- sions.17 Using data over the period 1992â1996, horn bans were found to increase the accident rate 30 percent for all types of crossings and 62 percent at crossings with gates (Figure 4-2). Horn bans had no significant effect on accident rates with only passive safety devices (i.e., nothing but crossbucks).18 In April 2005, FRA issued a rule requiring that locomotives sound their horns at public highway crossings but provided 15FRA, Final Environmental Impact Statement: Interim Final Rule for the Use of Locomotive Horns at Highway-Rail Grade Crossings, December 2003. 16FRA, Floridaâs Train Whistle Ban, 2nd ed., September 1992. 17FRA, Nationwide Study of Train Whistle Bans, April 1995. 18FRA, Updated Analysis of Train Whistle Bans, January 2000. 29
-20% 0% 20% 40% 60% 80% 100% 1992-1996, Passive Only 1992-1996, All Other Active 1992-1996, Gates Only 1992-1996, All Types Combined 1989-1993, All Types Combined Percent change in accident rate with horn ban Source: FRA, Updated Analysis of Train Whistle Bans, January 2000. 30 some exceptions to this requirement. These exceptions are as follows: ⢠The locomotive speed is 15 miles per hour or less and the train crew or appropriately equipped flaggers provide warning to motorists; or ⢠If the highway-rail grade crossing corridor is equipped with supplementary safety measures at each public high- way-rail grade crossing; or ⢠If the locomotive is within a quiet zone and the highway- rail grade crossing corridor has a Quiet Zone Risk Index at or below the Nationwide Significant Risk Threshold or the Risk Index with Horns. Communities that wish to apply for a quiet zone could be re- quired to provide supplemental safety measures to reduce the risk of grade crossings in the proposed quiet zone. These could include four-quadrant gates, permanent or night-time closing of some crossings, conversion of two-way streets to one-way to avoid the need for the expensive four-quadrant gates, and crossing gates with medians or traffic separators. Some com- munities have incurred costs between $200,000 to $1,000,000 per grade crossing to improve safety measures.19 Implement- ing a quiet zone also transfers liability for any collisions that do occur from the railroad to the local government. Unexpected Impacts The research team believes that most localities enacting horn bans understood that they were incurring safety risks in order to reduce noise levels around rail lines. Even when the magni- tude of the safety impacts was documented in an FRA study in 1992, none of the localities with horn bans repealed them. The research team cannot document a cost to rail carriers from increased grade-crossing accidents, but it is clear that deaths and injuries expose carriers to potential liability. The quiet-zone provision for shifting liability to local governments has some mitigating effect in this regard. Further, the rail in- dustry does not want to be perceived as a threat to safety. One can also consider the horn bans within a larger con- text of public policymaking. In many cases localities allowed developers to build residential housing units near rail lines. In other cases, railroads sold land that was near their right-of- way without giving adequate consideration to the long-term effects of the development that would occur. When viewed in this larger context, the long-term impacts of these public pol- icy decisions were unexpected. TWIC for Ports and Inland Towboats Policy Description As part of the response to the events of 9/11, the Mari- time Transportation Security Act of 2002 required the Department of Homeland Security (DHS) to issue regula- tions to prevent individuals from entering secure areas of vessels or certain port and offshore facilities without a bio- metric security credential from the Federal government. The law required that individuals pass a background check by DHS before they received a credential. The law also speci- fied that vessel and facility owners prevent individuals with- out a biometric security credential from accessing secure areas unless accompanied by another individual having a credential. Figure 4-2. Comparison of crossing accident rates with and without horn bans. 19John Heckman, âTrain âQuiet Zonesâ Can Be More Dangerous and Costly,â Newton Kansan, November 13, 2008.
In January 2007, the Transportation Security Adminis- tration (TSA) and the U.S. Coast Guard published com- panion final rules for the TWIC program. The rules apply to all credentialed merchant mariners and to workers who require unescorted access to secure areas of ports and ves- sels (e.g., longshoremen and truck drivers). To obtain a TWIC card, these personnel must undergo a security threat assessment by TSA and pay a user fee. The TWIC re- quirement was phased in across the country between 2008 and 2009. As of September 2009, TSA had enrolled more than 1.3 million people and had printed about 1.2 million credentials. Policy Impacts Many of the nearly 2,000 written comments on the pro- posed TWIC rules said that the compliance costs would be too high and would greatly exceed any security benefits, at least for particular portions of the maritime industry. The impacts most often cited by commenters related to ⢠The fees associated with obtaining a TWIC card, ⢠Other costs for employees to obtain a TWIC card (e.g., making two trips to an enrollment center), ⢠The effect of delays in processing TWIC applications on workforce and hiring, ⢠The cost of providing escorts to those not possessing a TWIC card, and ⢠The cost of installing TWIC cardreaders at facilities or on vessels (a requirement that was dropped from the final rule). The regulatory impact analysis for the final TWIC rule provided a wide range for the agencyâs estimate of the total discounted, 10-year cost of compliance: $700 million to $3.2 billion. In part, TSA attributed the variance in its estimate to uncertainty about the opportunity costs associated with the enrollment process and the waiting time to receive a TWIC. Another reason for the variance was uncertainty about the cost of complying with the requirement to escort those without TWIC cards when they visit secure areas of a vessel or facility. The port officials the research team interviewed in the midst of the phased rollout of the TWIC program generally expected the ruleâs biggest impacts to fall on the trucking in- dustry. They suggested that a high percentage of truck driv- ers would fail to qualify for a TWIC card, or that many driv- ers would not receive a TWIC card before the rule went into effect. However, one port official said that most truck drivers who had been initially disqualified from receiving a TWIC card had been able to get one by going through the appeals process. TSA data shows that, through August 2009, the agency had initially disqualified less than 5 percent of TWIC applicants and that it had granted more than 85 percent of the appeals requested.20 In general, port officials who were interviewed did not ex- pect the TWIC rules to impede the flow of goods through ports. In fact, one port official suggested that, if implemented properly, the rule could improve the flow of goods. This lack of concern may be due to the Federal governmentâs decision to drop the requirement for facilities and vessels to install TWIC cardreaders from the final rule. Several freight officials, as well as commenters to the TSA and Coast Guard dockets, said that the proposed rules seemed geared to large, coastal ports and showed little ap- preciation for the operational realities of the inland towing industry. They asserted that the compliance costs for inland freight carriers would far outweigh the minimal safety ben- efits that would be achieved by applying the rule to them. In response to these concerns, Congress amended its require- ments for the TWIC rule through the Security and Account- ability For Every Port (SAFE Port) Act of 2006. In that law, Congress required TSA to allow new workers to start work- ing immediately if they pass an interim check against vari- ous terrorist databases. Freight officials who were inter- viewed during the rollout of the TWIC program reported mixed results. Some complained about long delays in ob- taining TWIC cards for employees, while others reported no major issues. Unexpected Impacts It would have been difficult for Congress to anticipate the full impact of the TWIC requirements when it passed the Maritime Transportation Security Act in 2002, because it left the exact requirements of the rule to DHS to determine. By the time the final rules were issued, however, TSA and the Coast Guard had received nearly 2,000 written comments on the proposed rules and had also held four public meetings around the country, which together drew roughly 1,200 peo- ple. Among those commenting were representatives of ports and inland waterway carriers, and they largely raised the same concerns as the research teamâs interviewees. DHS had to be aware of the potential impacts of the rules when it issued them in 2007. Because the research team interviewed freight experts just as the TWIC Program was being rolled out, it was difficult for them to assess the actual impacts of the program. The issuance of some TWIC cards has been delayed by computer problems and other technical issues, but the ruleâs regulatory impact analysis included a range of costs to account for such delays. 20TSA, âTWIC Dashboard: August 26, 2009,â http://www.tsa.gov/assets/pdf/ twic_dashboard.pdf 31
32 Alien Fingerprint Rules for Outbound Planes and Ships Policy Description Under the current U.S. Visitor and Immigrant Status In- dicator Technology (US-VISIT) Program, the U.S. govern- ment collects biometric data (digital finger scans and photographs) from aliens seeking to enter the country. The Federal government then checks that information against its databases to identify suspected terrorists, known crimi- nals, or individuals who have previously violated U.S. im- migration laws. Currently, however, there is no system to help the Federal government determine whether or not an alien has overstayed the terms of his or her visa or other terms of admission. Following the 9/11 terrorist attacks, the National Commis- sion on Terrorist Attacks upon the U.S. (the 9/11 Commis- sion) observed that several of the 9/11 hijackers could have been denied admission to the United States based on previ- ous violations of immigration laws, including having previ- ously overstayed their terms of admission. In response, the Implementing Recommendations of the 9/11 Commission Act of 2007 required that an exit system be implemented to complement the existing entry system. In April 2008, DHS proposed a rule to create the exit system. The rule would re- quire aliens leaving the United States from an air or sea port to provide biometric information if they were required to do so when entering the country. Policy Impacts Freight carriers were not sure that the rule would apply to their crews or other workers traveling, but they submitted comments to the docket asserting that complying with the rule would be very costly. Their overriding concern with the rule, one that was shared by passenger carriers, was that it would require the carriers themselves to collect the biometric information and submit it to DHS. They said that it would be more appropriate for the Federal government itself to collect the data. Specifically regarding the ruleâs potential impacts on the freight industry, the Cargo Airline Association (CAA) said that crews and workers traveling on all-cargo aircraft do not necessarily access the aircraft through a central location, so collecting fingerprints from them would be more difficult and more costly than for passenger carriers. For example, CAA said that there is no obvious place (e.g., a passenger ticket counter) in the all-cargo environment to collect the re- quired biometric data. Furthermore, CAA said that, because the number of affected aliens in the all-cargo environment would be relatively small, the cost to carriers per individual fingerprinted would be much greater than for passenger car- riers. One all-cargo manager said that his companyâs crew- members move all over the companyâs network and mix with other flight crews continually, so the company could not avoid the ruleâs requirements by limiting alien crewmembers to domestic routes. In formal comments, the Chamber of Shipping of Amer- ica (CSA), which represents maritime carriers, said that, if the rule applied to its members, they would have to install bio- metric collection equipment on their vessels to take finger- prints of their crews. This approach would be the only work- able one, because the carriers generally do not own or operate the facilities at which they berth. CSA said that, because vessel crews typically number less than 30, installing such equipment would be âcost-prohibitive.â Unexpected Impacts If this policy were implemented as proposed, with the re- quirements extending to all crewmembers on air cargo planes and marine freight vessels, then it could result in impacts on the freight industry that were not expected by the policymak- ers. This is because the primary focus has been on aliens trav- eling via passenger airlines and cruise lines. The RIA for the rule refers repeatedly to âpassenger carriersâ and does not ex- plicitly identify freight carriers as part of the regulated popula- tion. For example, the RIA assumes that the rule would apply to only 9 sea carriers and 33 seaports, totals that clearly do not capture the operations of cargo vessels at U.S. ports.21 It is rea- sonable to believe that those drafting the rule may not have considered cargo carriage or the ruleâs impact on it. Federal Emission Standards for Diesel Engines Policy Description Diesel engines are a major source of air pollution, including ground-level ozone (smog) and particulate matter (PM). Many areas of the country do not comply with Federal ambient air quality standards for these pollutants. In order to reduce the public health impacts of air pollution, EPA has adopted increas- ingly stringent emission standards for new heavy-duty trucks, locomotives, and marine vessels. The standards have taken ef- fect in phases. Truck standards have generally preceded loco- motive and marine standards by 5 to 10 years in terms of level of emission control. To meet the standards, manufacturers have used, or will use, several new technologies, including exhaust gas recirculation (EGR), diesel particulate filters (DPF), and selective catalytic reduction (SCR). 21DHS, Air/Sea Biometric Exit Project: Regulatory Impact Analysis, DHS-2008- 0039-0002, April 17, 2008, p. 45.
Policy Impacts The addition of emission control technologies undoubt- edly raises the cost of new trucks, locomotives, and vessels. It can also increase maintenance and operating costs for vehicle owners. In addition, the advent of new emission standards can disrupt normal purchasing patterns, with carriers buying more or fewer new pieces of equipment in a given year than they otherwise would. To date, the effect of emission standards on new equip- ment purchase price has been small. EPA estimated that the 2007 truck standards would result in additional costs of about $2,300 per engine in 2007, or roughly 3 percent of the pur- chase price of a new Class 8 truck.22 The locomotive and ma- rine vessel standards currently in effect are less stringent than the truck standards, and their effect on purchase price is con- sidered to be quite small. The actual effect on prices is diffi- cult to quantify because the changes occurred concurrently with other improvements. The most stringent level of standards, not yet in effect, will likely require use of SCR and have a significantly larger effect on equipment prices. For example, the Tier 4 locomotive stan- dards, which take effect in 2015, may require a separate urea rail car and development of urea fueling stations. EPA esti- mates a price impact of $84,000 per locomotive, or 4 percent of the price of a new locomotive.23 For marine vessels with large (Category 2) engines, the effect on price is expected to be ap- proximately $250,000, or 7 percent of vessel purchase price.24 The effect of emission standards on maintenance and op- erating costs is probably more important than the effect on purchase price. EPA originally estimated that the 2007 truck standards would increase operating costs by $3,800 over the lifetime of the engine. Some fleet owners believe the actual costs have been higher. For example, one large truckload car- rier has claimed that the cost of maintaining engines compli- ant with the 2002/04 standards (using EGR) is about $8,000 more than earlier engines, and the maintenance cost for 2007-compliant engines (using DPFs) has been an additional $9,000.25 Manufacturers acknowledge some maintenance cost increases, but note that the changes deliver better per- formance and some of the initial bugs have now been fixed. Most of the emission reduction technologies cause a slight reduction in fuel economy, although manufacturers claim they have offset these effects with other types of improve- ments. The emission-control equipment has also necessitated a shift to ultra-low-sulfur diesel fuel, which costs about 5 cents more per gallon. A related effect of the 2007 truck standards was the large âpre-buyâ that occurred in 2006. Fearing maintenance problems and a decline in fuel economy, many carriers pur- chased large quantities of new trucks before the 2007 stan- dards took effect. This caused disruption for the truck mak- ers, and sales of new trucks dropped off significantly in 2007 as a result. Unexpected Impacts The impacts of emissions standards on equipment costs are expected. EPA regularly performs cost-benefit analyses of their regulations, which include estimates of impacts on new equipment costs as well as operation and maintenance costs. In their regulatory documents, EPA makes the case that the economic benefits of the policies (improved public health) exceed the costs to industry. Some would argue that EPA underestimates the impacts to industry, particularly the impacts of the recent truck stan- dards on maintenance costs. Anecdotal evidence supports these claims, although there is very limited information from objective neutral parties on the issue. The magnitude of the 2006 truck âpre-buyâ appears to be unexpected and unintended. Some industry observers note that EPA could have structured the regulations differently so as to minimize this impact. Although it caused disruption to truck and engine manufacturers, there is little evidence that the pre-buy had significant impacts on the freight transporta- tion system. California In-Use Truck Emission Standards Policy Description California is the only state with authority to set its own motor vehicle emission standards. Air quality problems as- sociated with diesel emissions have been particularly acute in California; in response, the state has pursued policies to reduce diesel emissions. In recent years, Californiaâs stan- dards for new vehicles have mirrored USEPA standards. However, because of the relatively slow turnover of the truck fleet, it can take many years to fully realize the bene- fits of emission standards affecting only new trucks. To speed the introduction of low-emission technologies for trucks, California broke new ground in December 2008 by adopting emission standards for in-use (existing) on-road trucks. (A similar set of in-use standards for off-road equip- 22USEPA, Regulatory Impact Analysis: Heavy-Duty Engine and Vehicle Standards and Highway Diesel Fuel Sulfur Control Requirements, EPA420-R-00-026, De- cember 2000. 23USEPA, Regulatory Impact Analysis: Control of Emissions of Air Pollution from Locomotive Engines and Marine Compression Ignition Engines Less than 30 Liters Per Cylinder, EPA420-R-08-001, March 2008. 24Ibid. 25Daniel P. Bearth, âFleets Find Higher Costs, Uncertain Life Cycles,â Transport Topics, Oct. 20, 2008. 33
34 ment was adopted in 2007.) The rules apply to all trucks that operate in California, including those registered in other states. For fleets with four or more vehicles, the regulations re- quire that pre-1994 trucks be installed with exhaust-retrofit devices beginning in 2010, and these requirements extend to pre-2004 trucks beginning in 2011. The regulation adds compliance flexibility by allowing fleets to choose among three compliance options that best suit their situations. Fleets with one to three vehicles are exempt from the 2010 and 2011 retrofit requirements, but must show partial com- pliance by 2013.26 Policy Impacts The California regulations could have a significant impact on fleets that operate older vehicles. These fleets will be forced to install exhaust-retrofit devices (costing $5,000â$20,000) or replace their vehicles sooner than they otherwise would. The California Air Resources Board (CARB) notes that the rules will affect approximately 170,000 businesses and almost a mil- lion vehicles. Hardest hit will be fleets with four or more trucks that operate older equipment. Large long-haul carriers, which typically do not operate trucks more than 4 or 5 years old, will be largely unaffected. California is making available some in- centive funding to assist fleets with compliance CARB has modeled the economic impacts of the rule.27 CARB notes The total increased cost of the regulation is estimated to be $5.5 billion (2008 dollars). While it is expected that most fleets will pass through these costs to their customers, this is expected to result in a negligible impact on consumers, equating to about a few cent increase for a pair of shoes, less than one one- hundredth of a cent increase per pound of produce, or an in- crease of from $3 to $10 for a new car. Unexpected Impacts As with the Federal emission standards, Californiaâs stan- dards are subject to extensive analysis of potential impacts through the rulemaking process. CARB has estimated the number of trucks and fleets that will be affected and the cost to different types of fleets. CARB also held public meetings across the state to receive feedback on their proposed rules; many trucking industry representatives provided comments. The in-use truck rules have not yet taken effect, so the extent to which CARBâs predicted impacts are accurate is not known. Because an emission regulation of this type is unprecedented, the potential for unexpected impacts is likely higher than other types of emission regulations. Idling Restrictions for Trucks and Locomotives Policy Description Truck idling contributes to air pollution and noise im- pacts. In response, approximately 15 states, as well as some cities, have adopted idling restrictions for trucks.28 Most of the regulations limit idling to between 5 and 15 minutes, with exceptions in situations such as traffic congestion, extreme temperature, and service/repair. Fines typically range from $100 to $500, escalating in some jurisdictions for multiple of- fenses. Californiaâs law is considered the most restrictive; it prohibits idling for more than 5 minutes within Californiaâs borders and requires that new trucks be equipped with a non- programmable system that automatically shuts down the en- gine after 5 minutes of idling.29 Locomotive idling regulations are much less common. In 2005, CARB signed a Memorandum of Agreement (MOA) with the Burlington Northern Santa Fe (BNSF) and Union Pacific (UP) railroads that obligates the railroads to signifi- cantly reduce diesel emissions in and around railyards throughout California. Under the agreement, UP and BNSF agreed to phase out non-essential idling within 6 months and install idling reduction devices on all their California-based locomotives within 3 years.30 No other state has enforced a lo- comotive idling law. Policy Impacts Idling restrictions create an initial cost for carriers if they require the installation of an auxiliary power unit (APU) or other technology in order to comply. APUs cost $7,000 to $10,000, plus installation. Trucks can also be retrofitted with automatic engine shut-down systems. Some industry experts believe that Californiaâs law has had a significant cost impact, particularly for carriers that do not rapidly turn over their fleets and have therefore needed to retrofit their trucks with shut-down systems. Large long-haul fleets operating in Cali- fornia have been purchasing new trucks with the shut-down systems at minimal additional cost. Carriers benefit from fuel savings when they reduce idling. For this reason, most large carriers, as well as the American 28American Transportation Research Institute (ATRI), Compendium of Idling Regulations, updated 2005. 29For information, see: http://www.arb.ca.gov/msprog/truck-idling/truck-idling. htm 30For information, see: http://www.arb.ca.gov/railyard/ryagreement/ryagreement. htm 26A full description of the proposed regulations can be found at: www.arb.ca.gov/ msprog/onrdiesel/onrdiesel.htm 27CARB, âCost Model Methodology for the Statewide Truck & Bus Regulation,â July 2, 2008.
Trucking Associations (ATA) and state trucking associa- tions, do not object to reasonable idling laws. With high fuel prices and corporate environmental initiatives, many large carriers have similar internal policies to discourage long- term idling. CARB performed a cost-benefit analysis when developing the stateâs idling regulation.31 CARB estimated that the truck- ing industry would experience a net benefit from the law, with fuel savings offsetting the cost of APU installation within 5 years. The total statewide cost savings estimated by CARB was nearly $500 million for the period 2005â2009, and an ad- ditional $100 million for the period 2010â2013. The major trucking industry objection to idling laws comes from the inconsistencies in laws among different jurisdictions. This is particularly true at the city level, where some cities have imposed very strict idling limits or âno idle zonesâ in delivery areas. Carriers report that they can have difficulty complying with laws when each state and city has a different time limit and set of exemptions. The net impact on the trucking industry of the differing laws is likely minimal, however, serving more as an annoyance than a significant cost impact. UP and BNSF voluntarily entered into the California agreement and both report that it has not been burdensome to them. There have been no significant impacts on opera- tional efficiency. The cost of installing idling reduction de- vices has been minimal and is soon recovered through fuel savings. As a consequence, the railroads are voluntarily apply- ing similar practices outside of California. Some argue that the railroads would benefit by more aggressive adoption of idle-reduction technologies and practices, particularly in the eastern United States. Unexpected Impacts The impacts of idling restrictions are not unexpected. State agencies that have adopted idling limits are probably aware that truck owners may be compelled to install idle-reduction devices. State agencies also likely believe that trucking com- panies benefit from reduced idling in the long run, which is supported by the fact that large carriers and trucking associ- ations typically support reasonable state idling laws. The teamâs research suggests that many state and local gov- ernments are not aware of the inconsistencies in regulations across jurisdictions. There is little evidence that states and cities have attempted to harmonize their idling laws with their neighbors. Again, the impacts of inconsistent regula- tion, by itself, are probably not significant. EPAâs efforts to standardize state idling laws may help remedy this situation in the near future. Restrictions on Port Drayage Trucks Policy Description Trucks serving ports can be a significant source of air pollu- tant emissions, in part because they tend to be older and higher polluting than long-haul trucks. As part of a joint effort to re- duce air pollutant emissions related to their operations, the Ports of Los Angeles and Long Beach have recently launched the Clean Truck Program. The goal of this program is to reduce emissions from drayage trucks by 80 percent by 2012. This pro- gram is just one component of the San Pedro Bay Ports Clean Air Action Plan, which the two ports adopted in November 2006. The Clean Truck Program is designed to replace the old- est and dirtiest of the roughly 16,000 to 18,000 trucks that visit the ports regularly and retrofit others with pollution-control equipment. The program is being phased in over 4 years and will ultimately affect most trucks that serve the ports. CARB has also enacted a statewide regulation to reduce emissions from drayage trucks that operate at Californiaâs ports and intermodal railyards. This rule, which went into ef- fect in December 2008, is very similar to the drayage restric- tions in the portsâ Clean Truck Program, albeit with a slightly longer implementation timeline. To help the owners of drayage trucks (mostly owner- operators) purchase new trucks or retrofit their existing trucks, the ports are providing $1.7 billion in leases, loans, and grants. To generate funding, the ports have adopted fees of $35 per 20-foot-equivalent unit on loaded containers en- tering or leaving the ports by drayage truck. The state of Cal- ifornia is providing an additional $400 million to help finance retrofits and replacements. Even with this assistance, how- ever, vehicle owners will be asked to shoulder 20 to 50 percent of the cost of the new vehicle or retrofit.32 The Clean Truck Program also includes non-environmental provisions, some of which aim to reshape significantly the structure of the drayage market. These provisions have gen- erated strong opposition from the motor-carrier industry and some Federal agencies. These provisions are included in con- cession agreements that the ports are requiring carriers to sign to continue servicing the ports. The most controversial provi- sion requires carriers to switch from using owner-operators to using employee drivers. Currently, drayage is handled prima- rily by independent owner-operators who contract with 31CARB, Staff Report: Initial Statement of Reasons for Proposed Rulemaking, Air- borne Toxic Control Measure to Limit Diesel-Fueled Commercial Motor Vehicle Idling, July 2004. 32The Ports of Los Angeles and Long Beach Clean Truck Program, âProgram An- nouncement #SPBP-PA002: Availability of Truck Replacement Funds Under the Goods Movement Emissions Reduction Program, Fiscal Year 2007â08,â Octo- ber 20, 2008. 35
36 licensed motor carriers and are paid by the dray. The market is highly competitive and, as a result, drayage truckers earn in- comes below those of truckers in other comparable markets.33 In justifying this requirement, the Port of Los Angeles said that requiring carriers to use employee drivers would enable the port to hold carriers accountable for maintaining trucks and for employing properly credentialed drivers. The port also ar- gued that the requirement would reduce the number of trucks needed to provide drayage.34 The concession requirements, and the employee driver provision in particular, have prompted legal challenges by ATA and the Federal Maritime Commission (FMC). At pres- ent, both ports have implemented the initial phase of the Clean Truck Program, which includes the ban on pre-1989 trucks and the requirement for carriers to obtain concession agreements. In addition, all trucks entering port terminals must be registered in the portsâ Drayage Truck Registry. Policy Impacts The Ports of Los Angeles and Long Beach commissioned studies to estimate the likely impacts of the Clean Truck Pro- gram on the drayage fleet, on the competitiveness of the ports, and on the freight transportation system in general. These analyses considered not just the environmental provisions but also the other provisions of the program.35 These analyses pre- dicted that the Clean Truck Program would result in the clo- sure of some carriers and an increase in the cost of drayage service. One analysis, commissioned by the Port of Los Ange- les, estimated that drayage costs would increase by $1.1 billion per year at the Port of Los Angeles alone.36 For the state drayage truck rule, CARB estimated that 23,000 to 32,000 drayage trucks will be subject to vehicle retrofit and replace- ment requirements at a total cost of $1.1 and $1.5 billion.37 The cost to an individual truck owner would be approximately $10,000 if covered under Phase I (primarily retrofits) or $33,000 if covered under Phase II (vehicle replacement). Unexpected Impacts The ports have studied the potential impacts of this pol- icy extensively. The increase in drayage costs resulting from the policy is not unexpected, although the total cost may ultimately be higher or lower than current projections. The effects of the concessions requirements, if allowed, could be unexpected because such a provision is unprecedented in the United States. Restrictions on Disposal of Port Dredging Spoil Policy Description To maintain adequate channel depths for shipping, the U.S. Army Corps of Engineers (USACE) is responsible for dredg- ing major navigation routes. The disposal of dredged material, known as dredging spoil, has often been a contentious issue and one affected by multiple policy decisions. Dredged mate- rial may contain industrial contaminants that have built up in the sediment of navigation channels. On-land disposal of this material may affect local habitats. Ocean disposal of dredged material may affect fish habitats, water quality, and other as- pects of the marine environment. Regulation of the disposal of dredging spoil is a shared re- sponsibility between EPA and USACE. After USACE has approved a project from an economic and engineering per- spective and prepared a dredging management plan, EPA must still approve the disposal of the dredging spoil. Disposal of dredged material into inland waters is governed by Section 404 of the Clean Water Act (CWA). Disposal of dredged ma- terial into ocean waters is governed by the Marine Protection, Research and Sanctuaries Act, also known as the Ocean Dumping Act. State and local authorities also get involved in these decisions when they oppose disposal sites that are under consideration. If an area has been designated a Superfund site, USACE sus- pends dredging maintenance activities in that portion of the river until after a Record of Decision (ROD) has been signed and remedial actions have been completed by the principal re- sponsible parties under the Comprehensive Environmental Response Compensation and Liability Act (CERCLA). Interpretation of the Resource Conservation and Recovery Act (RCRA) is another source of legal complexity in the disposal of dredging materials. The USACE policy is that dredged materials are not a solid waste and thus not subject to solid waste regulations under RCRA. Some Federal and state agencies do not concur with this policy. As a result, there is a considerable amount of confusion about the application of solid waste regulations to contaminated sediments in different states.38 33Boston Consulting Group, âSan Pedro Bay Ports Clean Truck Program: CTP Options Analysis,â prepared for the Port of Los Angeles, March 2008, p.4, http://www.portoflosangeles.org/CAAP/CTP_Analysis.pdf 34Port of Los Angeles, âLos Angeles Harbor Commission Approves Clean Truck Program Concession Agreement,â May 15, 2008. 35For a list of relevant studies, see p. 37 of the Boston Consulting Groupâs March 2008 analysis, http://www.portoflosangeles.org/CAAP/CTP_Analysis.pdf 36Boston Consulting Group, p. 80. 37CARB, Technical Support Document: Regulation to Control Emissions from In- Use On-Road Diesel-Fueled Heavy Duty Drayage Trucks, October 2007. 38Great Lakes Dredging Team, Decision Making Process For Dredged Material Management, October 13, 1998.
Policy Impacts The economic benefits of dredging deeper ship channels derive from the fact that deeper channels allow larger ships to call at a port. Over time, the marine shipping industry has been moving to larger container ships, and this trend is ex- pected to continue. Because the cost of operating a con- tainer ship does not increase proportionally with the size of the vessel, larger ships reduce the cost of shipping freight. Ports that do not have channel depths to serve larger con- tainer ships can lose business to those that do. In addition, lower cost freight transportation may benefit local busi- nesses that rely on trade. Deeper channels are also important for other cargoes, espe- cially for liquid bulk (e.g., petroleum) and dry bulk (e.g., coal). For instance, tankers that are too heavily laden for a channel must offload oil to barges in order to reduce their draft. Light- ering, as this is called, adds to the cost of moving petroleum through these channels. Issues over spoil disposal have often delayed dredging proj- ects. Some high-profile projects have been held up by problems in obtaining environmental permits or by litigation from con- cerned communities after the permits have been issued. An ex- ample is the Port of Oakland, where litigation over various dis- posal options delayed for 11 years the start of a major dredging project to increase channel depths to 42 feet. This included chal- lenges by Californiaâs Water Resources Control Board and De- partment of Fish and Game, EPA, a fishermanâs association, and a local water authority. Industry experts have suggested that those ports that upgrade their facilities first often receive long-term benefits from lock- ing in market share. The first port of call for a ship is a ârevenue goldmineâ for the receiving port because all of the containers for inland sites tend to unload there. It can be difficult to get shippers back once they leave a port, because of the business in- frastructure involved in a terminal agreement. Shippers develop long-term terminal agreements, move equipment, and have long-term contracts with trucking firms, drayage operations, and railroads. Thus, policy decisions regarding dredging can have major impacts on the freight system across nearly all modes and a large geographic scale. Unexpected Impacts Government agency decisions that delay individual dredg- ing projects (e.g., the Oakland example) are probably made with at least some recognition of their economic repercussions related to freight movement. The Port of Oaklandâs dredging plans were contested by a diverse range of parties, many of whom were not primarily concerned with the economic im- pacts. Had they foreseen clearly the effects on the port, it is not clear that they would have acted differently. They saw the particular environmental issues with which they were con- cerned as more important than the portâs level of traffic. GAO has argued that the COE has overestimated the bene- fits of some dredging projects.39 In this sense, the magnitude of positive impacts may be unexpectedly small for some projects. Water Pollutant Discharge Rules for Vessels Policy Description In 1973, less than 1 year after the CWA was enacted, EPA promulgated a regulation that excluded discharges incidental to the normal operation of vessels from requiring a permit under the National Pollutant Discharge Elimination System (NPDES). This exclusion was revoked as a result of a 2005 U.S. District Court decision. In 2008, President Bush signed two laws that exempted certain vessels from the need to com- ply with NPDES permits. The first law exempted recreational vessels and instead directed the Coast Guard to promulgate a regulation to require recreational boaters to use best manage- ment practices identified by EPA.40 The second law imposed a 2-year moratorium on requiring NPDES permits for inci- dental discharges other than ballast water from vessels less than 79 feet long or commercial fishing vessels of any length.41 EPA issued a final Vessel General Permit (VGP) in Decem- ber 2008. This permit applies to incidental discharges into U.S. waters. The permit establishes effluent limits (mostly in the form of best management practices) to control the dis- charge of 26 different vessel waste streams. The permit also includes specific requirements for certain vessels (including barges and oil tankers) that have incidental discharges not shared by other types of vessels. In addition to the effluent limits, the permit includes requirements for inspections of vessels, recordkeeping, and reporting. Policy Impacts EPAâs rulemaking will increase compliance costs for most marine vessels engaged in U.S. freight movement. In its final economic impact analysis for the VGP, EPA estimated that the permit would apply to roughly 38,000 freight or tank barges and 8,300 freight or tank ships (these figures include both domestic and foreign vessels). EPA estimated that the total annual incremental compliance costs for both domestic and foreign freight vessels would range from $5.6 million to $16 million annually. The cost attributable to the paperwork 39GAO, âDelaware River Deepening Project: Comprehensive Reanalysis Needed,â June 7, 2002. 40P.L. No. 110-288. 41P.L. No. 110-299. 37
38 burden alone was $0.4 million to $3 million annually for all freight vessels. EPA also estimated that less than 6 percent of the approximately 1,600 affected small entities involved in freight transportation would incur compliance costs exceed- ing 1 percent of revenues.42 Maritime trade associations have argued that EPAâs eco- nomic analysis contained serious flaws. For example, the commenters said that EPA incorrectly assumed that vessel owners and operators are already conducting some of the re- quired activities, either because they are standard industry practices or because they are already required by other regula- tions. They also argued that the economic analysis understated the compliance cost burden, because it did not adequately re- flect the diversity of affected vessels and their operations. In interviews, freight executives were more concerned about the paperwork and bureaucracy associated with the NPDES per- mitting regime than with the cost of performing the best management practices identified in the permit. Unexpected Impacts It is too soon to determine if the EPAâs regulatory action is having unexpected impacts on the freight system. If the freight industryâs criticisms of VGP and EPAâs economic analysis are valid, the compliance costs for the industry will be higher than the agency expected. Compliance costs for discharge rules will ultimately raise the cost of marine freight transport. The degree to which carriers can pass on these higher costs to shippers de- pends on many factors, including the presence of competing modes. In some situations, compliance costs for discharge rules would lead to slightly higher costs for transported raw commodities, intermediate products, and finished goods. If al- ternative modes, such as rail, offer competing service, marine vessel compliance costs could lead to a shift to these alternative modes. International Air Emissions Regulations for Vessels Policy Description Oceangoing vessels emit large quantities of nitrogen oxides (NOx), sulfur oxides (SOx), and PM, all of which can contribute significantly to air pollution problems in U.S. coastal cities. The EPA does not have regulatory authority over foreign- flagged vessels; emissions regulation can only be achieved through international treaties. In July 2008, President Bush signed the Maritime Pollution Protection Act, which cleared the way for U.S. ratification of the international treaty regu- lating emissions from large diesel-powered, oceangoing ves- sels. Under this treaty, known as MARPOL Annex VI, ocean- going vessels must limit NOx emissions from their main propulsion engines. The treaty also sets a cap on the sulfur content of the fuel these vessels burn, and it includes a pro- gram for designating special sulfur oxide Emission Control Areas (ECAs) where more stringent fuel controls apply. In October 2008, the Member States of the International Maritime Organization (IMO) (including the United States) adopted amendments to Annex VI that set even tighter in- ternational standards for marine diesel engines and their fuels. Beginning in 2015, new and existing ships operating in ECAs will be required to use fuel with no more than 1,000 parts per million (ppm) (0.1 percent) sulfur, which repre- sents a 98-percent reduction from todayâs global cap. Begin- ning in 2016, new ships operating in ECAs must also have advanced-technology engines designed to cut NOx emis- sions by roughly 80 percent. The new fuel standards will phase in over time, beginning with an interim fuel sulfur standard in 2010. Although two ECAs have already been established in Eu- rope, there are currently none in North America. The EPA originally considered an ECA for the West Coast only. The United States and Canada have now proposed the designa- tion of the entire West, East, and Gulf Coast coastlines as a North American ECA. The proposed ECA would extend 200 nautical miles from shore and would exclude western Alaska and the arctic coasts. If approved, the ECA could enter into force as early as 2012. Policy Impacts If a North American ECA were created, oceangoing cargo carriers would have to purchase low-sulfur fuel, which is more expensive than conventional fuel, or install scrubbers on their ships to capture the sulfur before it is emitted. EPA has noted that the economic impacts on ships engaged in in- ternational trade are expected to be modest. EPA estimates that operating costs for a ship in a route that includes about 1,700 nm of operation in the proposed ECA would increase by about 3 percent, which would raise the cost of transport of a 20-foot-long container by about $18. Two researchers have examined the cost of reducing sulfur emissions off the West Coast of the United States only under two scenarios for sulfur content and two scenarios for the ECA distance (Table 4-3). In the research teamâs interviews with port officials, offi- cials most often expressed concern about the effect that a re- gional ECA (e.g., Pacific Coast) would have on the relative competitiveness of affected ports. They suggested that a re- gional ECA would drive cargo to other, unaffected ports. Port officials expressed similar concerns about establishing an 42USEPA, Economic and Benefits Analysis of the Final Vessel and General Permit, December 18, 2008.
ECA in U.S. waters only, or in U.S. and Canadian waters, but not in those of Mexico. These officials suggested that a na- tionwide or, better yet, a continent-wide, ECA would keep the playing field level among North American ports. These initial concerns were likely instrumental in the decision to propose an ECA for all U.S. coasts. Shippers have been supportive of international regulation of oceangoing vessels. For example, the Pacific Merchant Shipping Association (PMSA) and the World Shipping Coun- cil endorsed the October 2008 amendments to Annex VI. This support seems to stem from a desire for uniform regu- lation. Such a desire helps explain PMSAâs opposition to a re- cently proposed California regulation that would require oceangoing vessels to use low-sulfur fuel when traveling within 24 nautical miles of the state.43 Unexpected Impacts Because an ECA has not yet been established in the United States, it is not possible to assess the degree to which impacts are unexpected. The IMO requires that extensive analysis and documentation accompany a countryâs ECA application. Ac- cordingly, EPA has already begun to estimate the economic impacts of an ECA designation.44 The analyses done thus far do not appear to estimate the diversion of cargo activity that could result from designation of a North American ECA. State Truck Route Restrictions Policy Description Local governments often discourage heavy trucks from traveling on their roads because of concerns about noise, emissions, and safety impacts of trucks. In addition, govern- ments may be concerned about pavement damage caused by heavy trucks. Such policies have recently become more widespread at the state level, with both New Jersey and New York adopting rules confining line-haul truck movements to certain main roads. New Jerseyâs rule designates the Na- tional Network as the roads to be used for line-haul move- ments and a New Jersey Access Network to be used until a truck reaches the appropriate local roads for getting to a ship- per or receiver.45 The New York State DOTâs (NYSDOTâs) regulation designates certain highways, Interstates, and other main inter-city routes for line-haul movement and an access network for getting to, or close to, pickup and deliv- ery points.46 Other states, including Maryland, Virginia, and Oregon, have implemented truck routing restriction rules that vary in their scope. Policy Impacts These rules force truckers, at least in some instances, to use routes other than those they would have chosen. To the degree this is the case, these rules impose costs in terms of operating costs and transit time, if not in other ways. The research teamâs interviews with trucking firms suggest that a requirement to stay on major highways for through travel is not viewed as too onerous, provided the requirement does not force them to run on toll roads. Trucking executives emphasized, however, that there were frequently major problems with the access routes they were required to use and, beyond that, with local restric- tions affecting the roads, or types of equipment, that could be used to reach facilities of shippers and receivers. It was these rules, they said, that imposed the greatest costs and operating problems. Several industry experts observed that, if rules on local roads and access roads became too restric- tive for 18-wheelers, distribution centers and LTL terminals would have to move out of the state, with local service pro- vided by straight trucks. The effect of this would be higher costs of doing business for a wide range of businesses and a negative economic-development effect from the departure of the terminals and warehouses. Unexpected Impacts The negative impacts of these policies generally are not un- expected. When state and local officials restrict heavy-truck movement, they certainly know that there will be a negative effect on the trucking industry. Trucking-industry represen- tatives and lobbyists will have made that case. But this, of ECA Distance from Coast Sulfur Content 100 nautical miles 200 nautical miles 0.5 percent $94 million $180 million 1.5 percent $73 million $140 million Source: Wang, Chengfen and James J. Corbett, University of Delaware, A Preliminary Estimation of Costs and Benefits for Reducing Sulfur Emissions from Cargo Ships in the U.S. West Coastal Waters, prepared for 2007 TRB Annual Meeting (TRB 07-302). Table 4-3. Estimate of ECA cost. 39 43John McLaurin, President, Pacific Merchant Shipping Association, comment submitted to CARB regarding its Proposed Regulation Order Airborne Toxic Con- trol Measure for Fuel Sulfur and Other Operational Requirements for Ocean-Going Vessels within California Waters and 24 Nautical Miles of the California Baseline, July 23, 2008. 44For example, see U.S. EPA, Global Trade and Fuels Assessment Future Trends and Effects of Requiring Clean Fuels in the Marine Sector, November 2008. 45NJDOT, Truck Access: Adopted Repeal and New Rules [N.J.A.C. 16:32]. 46See NYSDOT, https://www.nysdot.gov/programs/truckpolicy
40 itself, would be unlikely to deter legislators and officials who have decided that reduced heavy-truck traffic on local roads will be of benefit. To the extent that businesses in their state or area experience higher trucking costs, it probably will not register on the political scale, unless the cost is high enough to cause firms to consider relocation. One trucking executive observed that his firm had to discontinue service to a cus- tomer in an eastern state when local restrictions made service too costly for them. He believed, however, that the customer was able to find another carrier that was willing to bear the costs of service in that area. Relocation of terminals and distribution centers might have enough of an economic impact to catch the attention of officials, and this would likely be an unexpected impact and one not directly intended. But the research team cannot infer that relevant officials would have acted any differently in such a case, even had they known that they might lose some jobs and raise costs for affected businesses. Local Policies to Oppose a Railroad Acquisition Policy Description For reasons of quality of life and safety, local governments may take actions to block a proposed railroad acquisition so as to prevent increases in railroad traffic in their communi- ties. Increased rail traffic may cause more noise and roadway congestion. Specific concerns include blockage of street traf- fic at grade crossings, safety, and train noise and vibration. The benefits of rail traffic increases often include freight-system efficiency gains. As a general principle, local governments have no author- ity to constrain levels of rail traffic on an existing line or other- wise interfere with rail operations. However, local govern- ments can attempt to influence railroad traffic in the case of merger and acquisition proceedings before the Surface Trans- portation Board (STB). Local governments typically do this by formally adopting a resolution opposing the acquisition, then submitting comments to the STB. Some may go further by hiring consultants to conduct analysis that bolsters their case or filing a lawsuit against the STB or railroad. Policy Impacts In the case of rail mergers or acquisitions, local (or state) governments can ask the STB to either reject an acquisition or impose conditions, which imposes costs on railroads. A good example is Canadian Nationalâs (CNâs) recently approved ac- quisition of the Elgin, Joliet, and Eastern (EJ&E), a short line that runs just west of Chicago through many suburban neigh- borhoods with a southern terminus in Indiana. CN believes it will obtain significant efficiency gains by rerouting traffic over the EJ&E from other lines in the Chicago area. Shippers sup- ported the acquisition, because they also perceive improvement in moving through the congested Chicago rail nexus.47 The re- sult will be a major increase in traffic through the towns on the EJ&E line with corresponding decreases in traffic through other communities. Typical mitigation measures requested in cases of this nature include construction of a new line bypassing the towns or elimination of grade crossings by construction of overpasses or underpasses. Sound barriers or earthen berms are also sought to mitigate noise impacts. At least nine towns and one county filed comments opposing the acquisition. Barrington, IL, argued that no mitigation was possible so that the proposed acquisition should be re- jected.48 The STB ultimately approved the transaction with mitigating conditions.49 The required conditions included two grade-separation projects with CN required to bear 67.0 percent of the cost of one and 78.5 percent of the other. Various safety and noise measures were also included as con- ditions. Beyond the STB-imposed mitigations, CN entered into voluntary arrangements with a number of towns. CN has estimated the cost of the voluntary agreements at $60 million.50 (CN has not made a public estimate of the cost of the required mitigations.) Unexpected Impacts From the perspective of local elected officials, negative fi- nancial effects on the CN are not relevant and neither is the efficiency enhancement that would have been lost if the STB had turned down the transaction. The focus of these officials is the impact on life in their towns and not on larger questions about the efficiency of the freight system. It is likely that they are not aware of negative impacts on the system, but it is also the case that knowledge of such impacts would be unlikely to change their positions. The STB is, of course, keenly aware of impacts on the freight system; it is the Boardâs task to analyze and under- stand those impacts. The Boardâs decision was fully informed on the efficiency issues. Greater knowledge of the effect on the freight system would not have changed the positions of the parties in this case. The STB had sufficient knowledge, and the positions of the local officials would not have been affected if they had had the same knowledge. 47National Industrial Traffic League, comment, January 28, 2008, STB Finance Docket 35087. 48Village of Barrington, comment, February 15, 2008, STB Finance Docket 35087. 49STB, Decision No. 16, Canadian National Railway Company and Grand Trunk CorporationâControlâEJ&E West Company, December 24, 2008, STB Fi- nance Docket 35087. 50CN press release, âCN reaches seventh Illinois voluntary mitigation agreement for EJ&E transaction,â December 23, 2008.
Truck Size and Weight Rules Policy Description Laws and regulations governing truck size and weight lim- its have been enacted to serve various purposes. The first state laws date back to the early 1900s, while the first federal laws date from 1956 when the current federal-aid highway pro- gram was created. The purpose of earlier laws and regulations was to fix design parameters for road construction. The 1982 Surface Transportation Assistance Act (STAA), which pre- empted state regulations more restrictive than the federal limits on the Interstates, was designed to reduce the costs of interstate commerce. The 1991Intermodal Surface Trans- portation Efficiency Act (ISTEA), which blocked the states from allowing expanded use of longer combination vehicles (LCVs), was justified by Congress as a safety measure (50a). The main provisions of the current laws and federal regula- tions are as follows: ⢠Maximum gross weight of vehicles on Interstate highways: 80,000 lbs ⢠Maximum axle weight on Interstate highways: 20,000 lbs on a single axle; 34,000 lbs on a tandem axle ⢠States may not impose lower limits than the federal limits on Interstate highways ⢠Width of vehicles: states must allow 102 in. on the National Network (Interstates plus 160,000 miles of other main roads) ⢠Trailer length and numbers: states must allow single trail- ers at least 48 feet in length and tractors pulling two 28-ft trailers on the National Network. Grandfather clauses in federal law allow the operation of trucks not complying with federal limits in states where such trucks were in operation at the time of the enactment of the federal limit. The states regulate size and weight on state roads not covered by federal law. The most important category of truck exceeding the fed- eral limits that operates in the United States is the LCV, a ve- hicle with two trailers having a combined total length greater than that of the two 28-ft trailers allowed by federal law or with three trailers. Most LCV operations are subject to max- imum gross weight limits of greater than 80,000 lbs. LCVs op- erate on the turnpikes of several eastern states and more ex- tensively in a group of western states (Figure 4-3). Policy Impacts The benefits and costs of increasing the federal size and weight limits have been debated for decades. Bills that would liberalize the limits have been introduced repeatedly in Congress, with the support of industry groups and some states, but no major revision in federal legislation has been enacted since 1982. Studies conducted in 1990 and 2002 by TRB50a,50b,50c concluded that liberalizing size and weight regulations by allowing vehicles with greater cargo volume capacity and/or greater cargo weight capacity could reduce fuel consumption in freight transportation and also reduce total shipper costs. The main arguments against increasing the limits have been that (1) highway safety would be de- graded; (2) diversion of freight from rail to truck would in- crease social costs; and (3) highway agencies could not af- ford the cost of upgrading infrastructure to accommodate larger trucks. The 1990 TRB studies concluded that the safety impacts of liberalized limits would be positive be- cause the dominant influence on safety would be a reduc- tion in truck VMT. However, the 2002 TRB study acknowl- edged that understanding of the safety factors that determine the safe performance of large trucks is incom- plete and therefore called for regulatory changes to be tested in rigorously monitored large-scale pilot tests. Re- garding highway agency costs, the TRB studies recom- mended that truck fees be adjusted to cover the cost of pro- viding infrastructure for them. The studies predict that liberalizing limits would divert some freight from rail to truck. This diversion would not increase the social cost of freight transportation, provided (1) trucks paid fees that covered their infrastructure costs; and (2) pollution, safety, and congestion effects are small or positive. The 2002 TRB study emphasized that changes in size and weight regulations made in coordination with complemen- tary changes in highway management would offer the greatest potential for improving system performance. The study recommended (1) adjustments to truck fees to cover highway agency costs; (2) improved bridge management; (3) systematic monitoring of truck traffic; (4) reform of en- forcement methods; and (5) vehicle safety regulations gov- erning the performance of larger trucks. The most recent study by the USDOT did not attempt to resolve the issue of whether productivity gains from in- creased limits would outweigh safety costs. The report noted that LCVs â. . . generally show poorer stability or control properties than the base tractor-semitrailer configuration.â The study also reported productivity gains but left the ques- tion of net benefits or costs open.51 Separate from the Federal limits, the variation in size and weight rules among western states produces economic ineffi- ciency. First, the variation reduces competition because the 41 50aTRB. 2002. Special Report 267: Regulations of Weights, Lengths, and Widths of Commercial Motor Vehicles. National Research Council, Washington, D.C. 50bTRB. 1990a. Special Report 225: Truck Weight Limits: Issues and Options. National Research Council, Washington, D.C. 50cTRB. 1990b. Special Report 227: New Trucks for Greater Productivity and Less Road Wear: An Evaluation of the Turner Proposal. National Research Council, Washington, D.C. 51USDOT, Comprehensive Truck Size and Weight Study: Executive Summary, August 2000, p. ES-10.
âFederal uniformity scenarioâ in which the grandfather pro- visions in Federal law would be revoked and states would be required to adopt the Federal weight limit of 80,000 pounds. In a subsequent study, USDOT analyzed a âwestern unifor- mity scenarioâ in which the maximum GVW limits of 13 western states would be harmonized at 129,000 pounds. (This limit is near the high end of the range among the grandfa- thered states.) Table 4-4 summarizes the impacts of these two scenarios; see Appendix B-2 for more information on these impacts. Unexpected Impacts Regarding the Federal rules, this is a case in which both Congress and the USDOT are well aware of the impacts of the decision not to raise the limits beyond their present levels. In 1982 and 1991 Congress made clear decisions to come down on the safety side of the issue. It did so in full knowledge of the productivity cost, and the USDOT has made no effort to persuade Congress to do otherwise. 42 equipment acceptable in one state cannot always be used in neighboring states. One option for carriers wishing to do business in multiple western states is to use equipment that complies with the most stringent state rule under which they operate, but this would put them at a competitive disadvan- tage with other carriers that can run longer and heavier trucks. Another option for carriers is to purchase extra equip- ment for use in particular western states, but this will also raise costs for the carrier compared with rivals that operate within only one state. Finally, carriers could have drivers stop at state lines to readjust loads to comply with rules in the next state, but this process will also increase costs and make oper- ations more complicated. Harmonizing the size and weight rules among the grand- fathered western states would improve the economic effi- ciency of the freight transportation system, but such a change would also have other effects on the freight system, depend- ing on the levels at which the harmonized standards are set. Two USDOT studies shed some light on how the impacts on the freight system would differ depending on where the harmonized standards are set. One included modeling of a Source: U.S. Department of Energy, Fact #411: February 13, 2006 States that Allow Longer Combination Vehicles Note: Michigan allows double-trailer combinations exceeding 80,000 lbs, but with restrictions that prevent the operation of the LCVs illustrated. Figure 4-3. States that allow longer combination vehicles.
43 Type of Impact Metrics Impacts in Federal Uniformity Scenario (80,000 lbs max GVW) Impacts in Western Uniformity Scenario (129,000 lbs max GVW) Freight distribution by type of truck VMT by truck configuration Significant decrease in VMT traveled by doubles, triples, and 6-axle single trailers. Increase in VMT by 5-axle single trailers. Significant shift of VMT from single trailers to double- and triple-trailers Mode share Percentage Mode shift not analyzed Little or no shift from rail to truck Safety Crash rate involving trucks per million truck VMT; rate of fatal truck crash per million truck VMT Net impact is unclear: reduced VMT by longer, heavier trucks would reduce crash severity and possibly number of accidents, but increase in total truck VMT would likely increase number of accidents Net impact is unclear: decrease in total truck VMT would likely reduce number of accidents; but more VMT by longer, heavier trucks would increase crash severity and possibly number of accidents Fuel consumption Gallons of diesel Higher due to increase in truck VMT Lower due to decrease in truck VMT, but partially offset by reduced fuel economy of heavier trucks Air quality Tons of emissions Higher due to increase in fuel consumption Lower due to decrease in fuel consumption Traffic operations Vehicle-hours of delay; cost of congestion Slight increase in number of vehicle-hours of delay due to increase in truck VMT Slight decrease in delay due to fewer truck VMT, but offset somewhat by effect of longer, heavier trucks on traffic flow Shipper costs Dollars Higher due to increase in cost-per- Lower due to decrease in cost- Railroad revenues Dollars Higher due to decreased competition from longer, heavier trucks ton-mile per-ton-mile Lower due to increased competition from longer, heavier trucks Table 4-4. Summary of impacts of harmonization of state truck size and weight rules. Regarding the state variation, state legislatures adopted laws permitting larger vehicles in the past, in part because of special characteristics of traffic moving within their states, such as mining operations and steel production. It is a rea- sonable surmise that state legislatures focused on operating conditions within their own boundaries and paid little atten- tion to potential effects on interstate operations. Congress has been focused on the safety issue and made a deliberate deci- sion to shut down the process by which individual states were permitting heavier and longer trucks and has shown no inter- est in allowing more exceptions to bring about harmoniza- tion in the western states. So it is likely that negative impacts were neither intended nor expected. But it is doubtful that Congress or state legislatures would have acted differently with more information or closer analysis of the consequences of varying size and weight limits among states. Level of Investment in Highway Infrastructure Policy Description Federal and state policy decisions regarding investment in highway infrastructure can have major impacts on the freight system. Fiscal realities for the states are such that they are not in a position to take up the slack. Some states may be able to use a combination of tolls and private financing, but there is often significant political resistance to these approaches to rais- ing money. Policy Impacts The impacts of policy decisions that result in underfund- ing of highway infrastructure include higher freight trans- portation costs due to worsening congestion, safety, and pavement condition. In the research teamâs interviews, con- dition of highway infrastructure did not surface as one of the first concerns of trucking firms. Large firms had fairly strong negative views of new tolls (discussed below in the section on user charges) but acknowledged that new tolls for new capac- ity were acceptable, albeit with some reservations. The re- search teamâs discussions with truckers suggest that the in- dustry does not perceive capacity as a systemwide issue but, rather, as a matter of specific choke points that need to be ad- dressed. A somewhat similar view is reflected in GAOâs recent paper on freight transportation.52 The GAO paper puts the 52GAO, âFreight Transportation: National Policy and Strategies Can Help Im- prove Freight Mobility.â GAO-08-287. January 2008.
44 54Michael Bronzini, âInland Waterways: Still or Turbulent Waters Ahead?â An- nals of the American Academy of Political and Social Science, Vol. 553, p. 70, Sep- tember, 1997. issue in a systemic context but focuses on particular bottle- necks and trouble spots. GAO is, however, explicit on the point that funding from state and Federal sources is insuffi- cient for new capacity given that most of the available funds must be used for maintenance and rebuilding, leaving little for new capacity. The result is diminishing performance of highway-freight carriage. Unexpected Impacts The policy choice in this case is more one of inaction than action, and the impacts are probably not expected nor in- tended by most policymakers. Legislators, focused in part on projects in their own districts or states and in part on the total amount in a highway bill, are not likely to be consciously con- sidering effects on the freight system. Decisionmakers may realize there are some negative effects of not providing a higher level of investment but underestimate the magnitude of the impact. In the absence of a catastrophic breakdown in the system, members of Congress are not likely to perceive themselves as choosing to reduce the performance of high- way-freight movement, although that may be a result of funding levels. In general, legislators at all levels of govern- ment will be thinking primarily of passenger service as they consider support for highway improvements. This is also likely to be the case where local officials have a hand in project selection. Local officials typically operate in a political environment where peak-period congestion for commuters has the highest priority. In a paper prepared for the Section 1909 Commission, the point is made that MPOs have insufficient freight-planning capability.53 It is likely that the shortcomings of these institutions in regard to freight planning reflect, in part, the priorities of state and local leg- islative bodies. Level of Investment in Inland Waterway Infrastructure Policy Description Industry executives and academic observers share the view that there is a serious shortfall in investment in the inland waterways. Although some of the concern is about lack of capacityâe.g., small (600-foot) locks at some points on the Upper Mississippiâthe much greater concern is perception of a growing probability of a catastrophic failure as the infra- structure ages. With some exceptions, most of the original lock-and-dam sets were built in the 1920s and 1930s. There have been replacementsâmost of the lock-and-dam sets on the Ohio River have been replaced. Nonetheless, much of the infrastructure is old. One paper states that almost half of all lock chambers on the inland system were built more than 50 years ago.54 Policy Impacts Although the industry experts interviewed agreed there is a growing risk of lock or dam failure, opinion diverged on how great the risk is. One of the industry executives observed that the infrastructure is ârobustâ and the locks and dams built in the 1920s and 1930s are âresilient,â given proper maintenance. But this individual still noted that, as the facilities continue to age, the risk of failure will grow. Others believe that the risk today is considerable. Nationwide, inland barges move a relatively small share of total domestic tonnage, and any negative impacts would be restricted geographically and to a limited set of commodities. Shallow-draft water carriage accounted for 3.9 percent of freight tonnage and 6.9 percent of ton-miles in 2002. The consequences of a failure would depend on the specifics of the facility that fails. Most, though not all, locks are doublesâ either two 1,200-foot locks or a 1,200 with a 600-foot aux- iliary. (Some locks are smaller with auxiliaries as small as 360 feet.) In the former case, failure of either lock would, depending on the traffic volumes during the outage, result in zero or very little delay or some noticeable delay, but the traf- fic would keep moving. If a 1,200-foot lock with a 600-foot auxiliary failed, the delays would be considerably greater. A 15-barge tow, typical for the Upper Mississippi, can pass through a 1,200-foot lock intact, but would have to be bro- ken up to use a 600-foot auxiliary, moved through in two passes, and then put back together. Aside from the delay, one industry executive noted that there are safety issues as well, because risk of injury to crew is greatest when tows are being put together or broken up. If a single lock fails, then river traffic is stopped until the lock can be repaired. As almost all the traffic is bulk com- modities of one kind or another, it would have to shift to rail for at least part of its journeyâfaster but more costly per ton- mile. The worst case would be a dam failure, which would close the river for the entire stretch between the dams next above and below the failed dam and, presumably, require more time for repair. For an estimate of the cost of a lock fail- ure, see Appendix B. 53Cambridge Systematics, âImplications of Investments Targeted at Reducing Rail, Rail/Highway, Rail/Port, Highway/Port, Rail/Barge, and Highway/Barge Freight Bottlenecks,â Briefing Paper 4L-07, prepared for the Section 1909 Com- mission, April, 2007, p. 5.
45 Unexpected Impacts All the industry experts the research team interviewed be- lieve that Congress is paying little attention to the likelihood of a significant infrastructure failure on the inland water- way system. These industry expects offer several reasons for this lack of attention. One is the constrained fiscal condi- tion of the Federal government. Congress has been reluc- tant to provide increased resources for infrastructure even where there is widespread support for such increases. Con- gress likely does not see failure of inland navigation facili- ties as life-threatening events, even though flood control was one of the original reasons for building the system of dams on the Mississippi and its major tributaries. The po- litical pressure generated by a bridge collapse with loss of life is not present here. To the extent that the issue gets consideration, it may be seen as a case in which the maximum damage would be a temporary increase in the cost of moving certain commodi- ties and, therefore, an issue not meriting a high priority in the use of scarce funds. On September 29, 2009, the 1,200-foot main chamber of Markland Locks and Dam on the Ohio River failed. It is still out of service, and traffic is using the 600-foot auxiliary with substantial delays. It will be instruc- tive to see what response, if any, this outage brings from Congress. Highway Tolls and Other User Charges Policy Description Highway construction and maintenance are largely paid for with revenues from fuel taxes and other user charges, in- cluding tolls. Both the Federal government and states impose fuel taxes. States, regional authorities, local governments, and private facility operators can set highway and bridge tolls. The levels and forms of these taxes and charges affect the use of different parts of the system and the levels of use by different groups of vehicles. The form of charges can also affect the time of day at which different groups use certain segments. This would be the case with prices that vary, in some fashion, with level of use. Charges of this nature are intended to reduce congestion at peak-demand times. Where tolls are used primarily to re- cover the cost of infrastructure, they tend to be flat charges, often with higher charges for heavier vehicles. Most tolls are intended for cost recovery, although there is increasing use of variable pricing to reduce congestion. Policy Impacts Tolls, in particular, affect freight carriage because tolls are operating costs for trucking firms that canât easily be passed on to customers. Trucking firms are affected in two ways. The amounts of fuel taxes (or any other use taxes not specific to a particular segment) affect total vehicle miles of travel (VMT) of highway freight, just as any other cost of truck op- eration does. Tolls will also affect which roads truckers use, and peak-period pricing will have some effect on when they use them. All charges to truckers affect the total cost of highway freight carriage and, therefore, the relative costs of highway and rail carriage. The relative costs of these modes determine, in part, their relative shares of freight traffic. Beyond that, however, the overall efficiency of the freight system is affected if the highway charges paid by truckers do not reflect the full costs of truck use of the highways. There is an economic cost to society when the relative costs of competing modes are skewed by public pol- icy. Most observers believe that 5-axle trucks (18-wheelers) do not generate sufficient user charges to cover their direct cost impacts on highways. The most recent Highway Cost Alloca- tion Study from FHWA found that heavy 5-axle trucks met 80 percent of their cost responsibility.55 The transportation economists interviewed for this study were essentially in agreement that underpricing of highway use by heavy trucks leads to a loss of economic efficiency as the nation uses more truck carriage and less rail carriage than the underlying real costs would indicate. One potential operational impact of new tolls is diversionâ truckers taking to alternate routes, frequently lower grade roadsâin order to avoid tolls. One trucking executive said his firm diverted from all tolled roads without exception. An- other said his firm would avoid tolls on existing roads, but would do a benefit-cost analysis of using a tolled road with new capacity. The executives pointed out that diverting to avoid a toll does not save them the full amount of the toll, be- cause operating costs will rise, and speed will fall, on most al- ternate routes. The crash rate is also likely to be higher. For a more detailed assessment of tolling impacts, see Appendix B. Recent work on toll roads in Ohio has shown that the elas- ticity of truckersâ demand for tolled, high-quality roads is about 0.13 (e.g., doubling tolls would lead to 13 percent diver- sion).56 Given the high volumes of truck traffic on these roads, that means a significant increase in truck traffic on alternate routesâtwo-lane roads in many cases. Thus, in addition to increased operating costs for trucking firms, there are addi- tional costs to society in terms of increased congestion and increased crash rates on the alternate routes. 55USDOT, FHWA, 2000 Addendum to the 1997 Federal Highway Cost Alloca- tion Study, May 2000. 56Peter Swan and Michael H. Belzer. âEmpirical Evidence of Toll Road Traffic Diversion and Implications for Highway Infrastructure Privatization,â 2007, submitted for presentation at the 2008 TRB meeting.
46 Unexpected Impacts In the case of costs to trucking firms from highway tolls, one can safely say that decisionmakers (typically states) were aware that new tolls would increase truckersâ costs. Whether decisionmakers saw the costs in larger terms as an impact on the freight system is doubtful. That state legislators or trans- portation officials anticipated significant diversion from tolled roads seems less likely; and the same would be true for external costs of truck diversion to lower level roads. Officials are reaching for tolls as a response to severe financial pressure on their states, and awareness of increased cost to truckers and to motorists might not be sufficient to dissuade them. Lockage Fees for Inland Waterways Policy Description Historically, the inland towing industry paid no user charges or taxes. The Federal government financed the inland navigation system out of general funds under the principle that flood-control and navigation projects provided a broad public benefit, such that the financing burden should not be placed on the users of the navigation system. This was in con- trast to the highway and aviation systems, where revenues from user taxes and fees have long been expected to cover a very high proportion of Federal expenditures. The principle of paying for the inland system as a general, public benefit was partially abandoned with the Inland Water- way Revenue Act of 1978 and the Water Resources Develop- ment Act of 1986. As a result of these Acts, vessel operators on most of the inland waterway system pay a $0.20 per gallon fuel tax, the revenues from which accrue to the Inland Water- ways Trust Fund. The Bush Administration proposed phasing out the fuel tax and replacing it with a lockage fee. With the lockage fee, a tow would pay a fee per barge per lock. For each lock with a main-chamber length of 600 feet or more, the fee would start at $50 per barge in 2009 and increase in $10 increments to 2012. For locks with a main chamber less than 600 feet, the fee would be 60 percent of that for the larger locks. (For con- text, all of the locks on the Mississippi and Ohio Rivers have main chambers of at least 600 feet.) Policy Impacts According to industry testimony, the fee level reached in 2012 would roughly double the total payments from inland towing.57 Lockage fees would also entail some shifting of the burden among users. The fuel-tax payment depends on fuel consumption and therefore will vary with the number and weight of barges. The lockage fee would vary with the num- ber of barges and number of locks used. Thus, a towboat op- erating in free water on the Mississippi downstream from Locks and Dam 27 would pay no user fee at all, and traffic on the Upper Mississippi, the Ohio, and other tributaries would pay fees. The largest relative shift of burden would be from tows that never use locks at all to tows that do use locks. Although the relative change in tax burden within the indus- try would have some effect, the greater effect would be the in- crease in the overall tax burden on inland towing. This would necessarily raise barge rates and affect barge share relative to rail. The effect would, of course, be greatest for moves with a high number of locks relative to length of haul. But because the lockage fee drops for smaller locks and smaller tows, this might have the curious effect of favoring the less cost-effective trafficâsmall tows on low-volume rivers. A more detailed assessment of the impacts of this proposed policy is included in Appendix B. It is possible that the cost to the industry from a mode shift might be offset if the higher revenues from the fee caused Congress to increase the level of investment in the inland waterway system. This, in turn, could increase tow- ing efficiency, allowing the barge industry to regain some modal share. Unexpected Impacts In this case, the research team has to speculate about the impacts of a proposal that has not been implemented and may well not be implemented. One clear intent of the policy proposal is a substantial increase in user-fee payments from the inland barge industry. Presumably, the purpose of the lockage fee is to tie the pricing of the system closer to the de- gree of use of the facilities that account for most of its cost. The proposed policy does that to some degree, but it is far from the marginal-cost pricing for which many economists would argue. The flat fee per lock per barge takes little ac- count of cost differences among river segments and, as noted, the lower fee for smaller locks might reduce cost recovery on low-volume segments. Peak Pricing for Port Trucks Policy Description The Ports of Long Beach and Los Angeles are the largest container ports in the United States. Local roads are often congested with trucks traveling to and from the ports. To ad- dress this issue, the California Legislature proposed a law to tax containers moving through the port between 8 AM and 5 PM. The purpose of this proposed tax was to shift traffic into off-peak hours. 57Stephen Little, Waterways Council, Inc., statement before the Committee on Transportation and Infrastructure, U.S. House of Representatives, April 30, 2008.
47 To provide an alternative to this tax, an industry group composed primarily of importers and exporters created the Off Peak Program.58 Containers shipped through the ports during peak hours (3 AM to 6 PM) are charged a traffic mit- igation fee. The proceeds of the fee were used to reimburse terminal operators for the cost of keeping their facilities open during off-peak hours. The coalition created a non-profit or- ganization called PierPASS to administer the program. Cur- rently, shippers moving cargo from port terminals during the day are subject to a $50 fee for 20-foot containers and a $100 fee for 40-foot containers. Cargo owners can avoid this fee by moving containers during off-peak periods. Policy Impacts Overall, this program has been successful in shifting truck traffic into off-peak periods. An independent study of PierPASS found that prior to the program, 17 to 21 percent of port truck traffic moved during off-peak hours. The share of non-exempt cargo that moves in off-peak hours increased from around 30 percent shortly after the program inception to nearly 40 per- cent at present.59 The standardization of off-peak terminal hours was an important element of the programâs success. Negative impacts of the PierPASS program have fallen pri- marily on drayage truck drivers, because they often must work longer hours and generally receive no change in compensation. Some warehouse operators have been forced to adjust their op- erating hours without the ability to pass on higher costs.60 Fees on port trucks or containers may cause diversion of ma- rine traffic to other ports. There is no evidence that such a di- version has occurred as a result of the Off Peak Program. One recent study estimated traffic diversion from the portâs Clean Truck Program (which involves a fee of $35 on each loaded 20-foot container and $70 on each loaded 40-foot container) would be merely 0.5 percent.61 Another study looked at the di- version effects of different levels of container fees.62 That study found that, without port access road congestion improve- ments, a fee of $60 on a 40-foot import container would reduce import volume at the Ports of Long Beach and Los Angeles by 6 percent. If the container fee were used for roadway conges- tion relief, the fee could go as high as $200 per 40-foot con- tainer before significant diversion to other ports would occur. Unexpected Impacts The Off Peak Program was a response to imminent action that was being proposed in the state legislature. Some inter- view respondents noted that the legislature had not done analysis of the potential collateral impacts, including such is- sues as driver shortages at night or local area noise and con- gestion impacts from nighttime dropoffs. Additional costs of the program may fall on shippers and receivers, who may need to adjust facility schedules to accommodate longer hours. Exporters of lower value products have been hurt more by container fees than have other businesses. The fees represent a larger percentage of the value of their product. For instance, some agricultural shippers use containers to ship grain. In gen- eral, U.S. exports have a lower value per ton than imports. Because of this, container fees have a larger impact on the price of U.S. exports than foreign imports. The long-term cumulative economic impact of container fees has not been extensively considered. Peak Pricing for Airports Policy Description In July 2008, as part of a broader attempt to use market- based pricing to address congestion across the U.S. trans- portation system, FAA amended its policy statement regard- ing airport rates and charges.63 According to FAA, the intent is to provide incentives to air carriers to use congested airports during off-peak hours or to use alternate airports to meet re- gional air service needs. According to FAA, the change does not allow congestion pricing, per se. Rather, it allows airport operators to allocate new categories of cost to peak-hour land- ing fees, thus achieving some of the effects of congestion pric- ing. Specifically, the policy amendment ⢠Expands the ability of airport operators to include in the peak-period user charges of a congested airport a portion of the airfield costs of other, underutilized airports owned and operated by the same entity; and ⢠Permits the operator of a congested airport to add to peak- period user charges a portion of the cost of airfield projects under construction. (Previously these costs could be re- couped only after project completion.) Policy Impacts This policy increases costs for carriers who keep some of their flights in peak periods. There is also a cost to carriers of 58The History of PierPASS. https://www.pierpass-tmf.org/Documents/Pier PASSHistory.pdf 59PierPASS Review: Final Report. BST Associates. July 9, 2008. 60Genevieve Giuliano and Thomas OâBrien, âImpacts of Impacts of the Long Beach and Los Angeles Ports PierPASS Program,â Presentation at the National Urban Freight Conference, December 5, 2007. 61Container Diversion and Economic Impact Study: Effects of Higher Drayage Costs at San Pedro Bay Ports, prepared for the Ports of Los Angeles and Long Beach, September 27, 2007. 62Leachman & Associates, Final Report Port and Modal Elasticity Study, Prepared for Southern California Association of Governments, September 2005. 63FAA, âPolicy Regarding Airport Rates and Charges,â Notice of amendment to policy statement, July 14, 2008, 73 FR 40430â40445.
48 shifting flights from the peak, given that they would not have been choosing to operate in a time of congestion unless they found some benefit in doing so. Because air cargo traffic can more easily operate during off-peak times than passenger traf- fic, freight system impacts of this policy are likely minimal. CAA and FedEx Express asserted that higher landing fees alone would not cause all-cargo air carriers to relocate to sec- ondary airports. They noted that the cargo carriers must con- sider issues of greater importance than landing fees (e.g., the airportâs proximity to customers and the need for ground in- frastructure such as warehouse space). CAA and carrier executives also noted that, although most all-cargo operations are during off-peak hours, some daytime flights are necessary. For at least some of those daytime flights, they argue, the cost of adjusting operations and schedules to avoid peak periods will far outweigh the increase in the land- ing fee. In this light, the policy amendment will result in increased costs to air-cargo operators. Unexpected Impacts In its Federal Register notices, FAA indicated some con- sideration of the potential impact on the air-cargo industry. For example, in its notice of proposed amendment to its policy statement, FAA considered permitting the operator of a congested airport to add the cost of airfield projects under construction to landing fees throughout the day, not just the fees for peak periods.64 However, the agency con- cluded that doing so would penalize cargo operators and others already avoiding peak periods without providing an incentive to change flight schedules. However, there is no indication that FAA conducted a quantitative analysis of how the policy amendment would affect carriers (either pas- senger or cargo). 64FAA, âPolicy Regarding Airport Rates and Charges,â Notice of proposed amendment to policy statement, January 17, 2008, 73 FR 3310â3316.
