


Below is the uncorrected machine-read text of this chapter, intended to provide our own search engines and external engines with highly rich, chapter-representative searchable text of each book. Because it is UNCORRECTED material, please consider the following text as a useful but insufficient proxy for the authoritative book pages.
7Historically, the bases of taxation underlying transporta- tion revenue-generation systems have focused on specific fac- tors that tie vehicle ownership and operation to individual motorists or motor carriers. Since 1919, when Oregon imple- mented the nationâs first gasoline tax, motor fuel taxes have served as the primary source of funding for our nationâs roads and bridges; however, there is a broad spectrum of revenue sys- tems that are either in operation or have been proposed across the United States. These systems can be organized into the following categories based on the basis of taxation: ⢠Vehicle ownership â Registration fees â Licensing fees â Personal property taxes ⢠Highway user fees â Toll roads â Congestion/cordon pricing â High occupancy toll lanes â VMT fees ⢠Energy consumption â Motor fuel taxes â Sales taxes on motor fuels â Utility fees ⢠Beneficiary and local option fees â Beneficiary charges/value capture â Transportation impact fee â Local option sales taxes â Local option property taxes The alternative revenue-generation systems examined in this chapter move beyond the traditional methods of rais- ing revenue based on motor vehicle ownership and fuel con- sumption toward systems that tie tax payments more directly to system usage. Movement in this direction would enhance the efficiency, equity, and long-term stability of the nationâs transportation revenue system. This chapter presents an overview of the existing motor fuel tax system and the alternative revenue-generation systems of tolling, VMT fees, cordon/congestion pricing, and parking pricing. Each of these revenue-generation systems has been applied both within the United States and internationally. In addition to providing an overview of these systems, this chap- ter examines the lessons learned from real-world applications. 2.1 Motor Fuel Taxes Revenues from motor fuel taxes represent the primary funding source supporting the nationâs highway programs. In 2007 alone, state motor fuel taxes raised more than $37 billion for the improvement of highway facilities (FHWA, 2008). In recent years, the financial limitations of the current system have become evident as revenues have failed to keep pace with the demands for additional highway investment. Furthermore, a number of constraints could collectively limit the long-term viability of the motor fuel tax as a major funding source, includ- ing increased fuel efficiency, market penetration of alternative fuels, price inflation, and volatility with respect to motor fuel prices. In addition to the aforementioned revenue constraints, there is evidence to suggest that motor fuel taxes have histor- ically suffered from a persistent problem with evasion. His- toric changes in administrative and enforcement practices designed to address the evasion issue (e.g., diesel fuel dyeing, taxation of kerosene and other alternative fuels, enhanced auditing practices, moving the point of taxation up the distri- bution chain) have increased revenues deposited in highway funds across the nation. 2.1.1 Motor Fuel Tax Administration and Enforcement Practices In the United States, motor fuel taxes are collected by states at the terminal, first receipt/sale, distributor, or retail level. From an administrative cost standpoint, there are trade-offs associated with moving the point of taxation up the distribution chain. Taxing at the retail level vastly increases the number of C H A P T E R 2 Overview of Existing and Alternative Revenue-Generation Systems
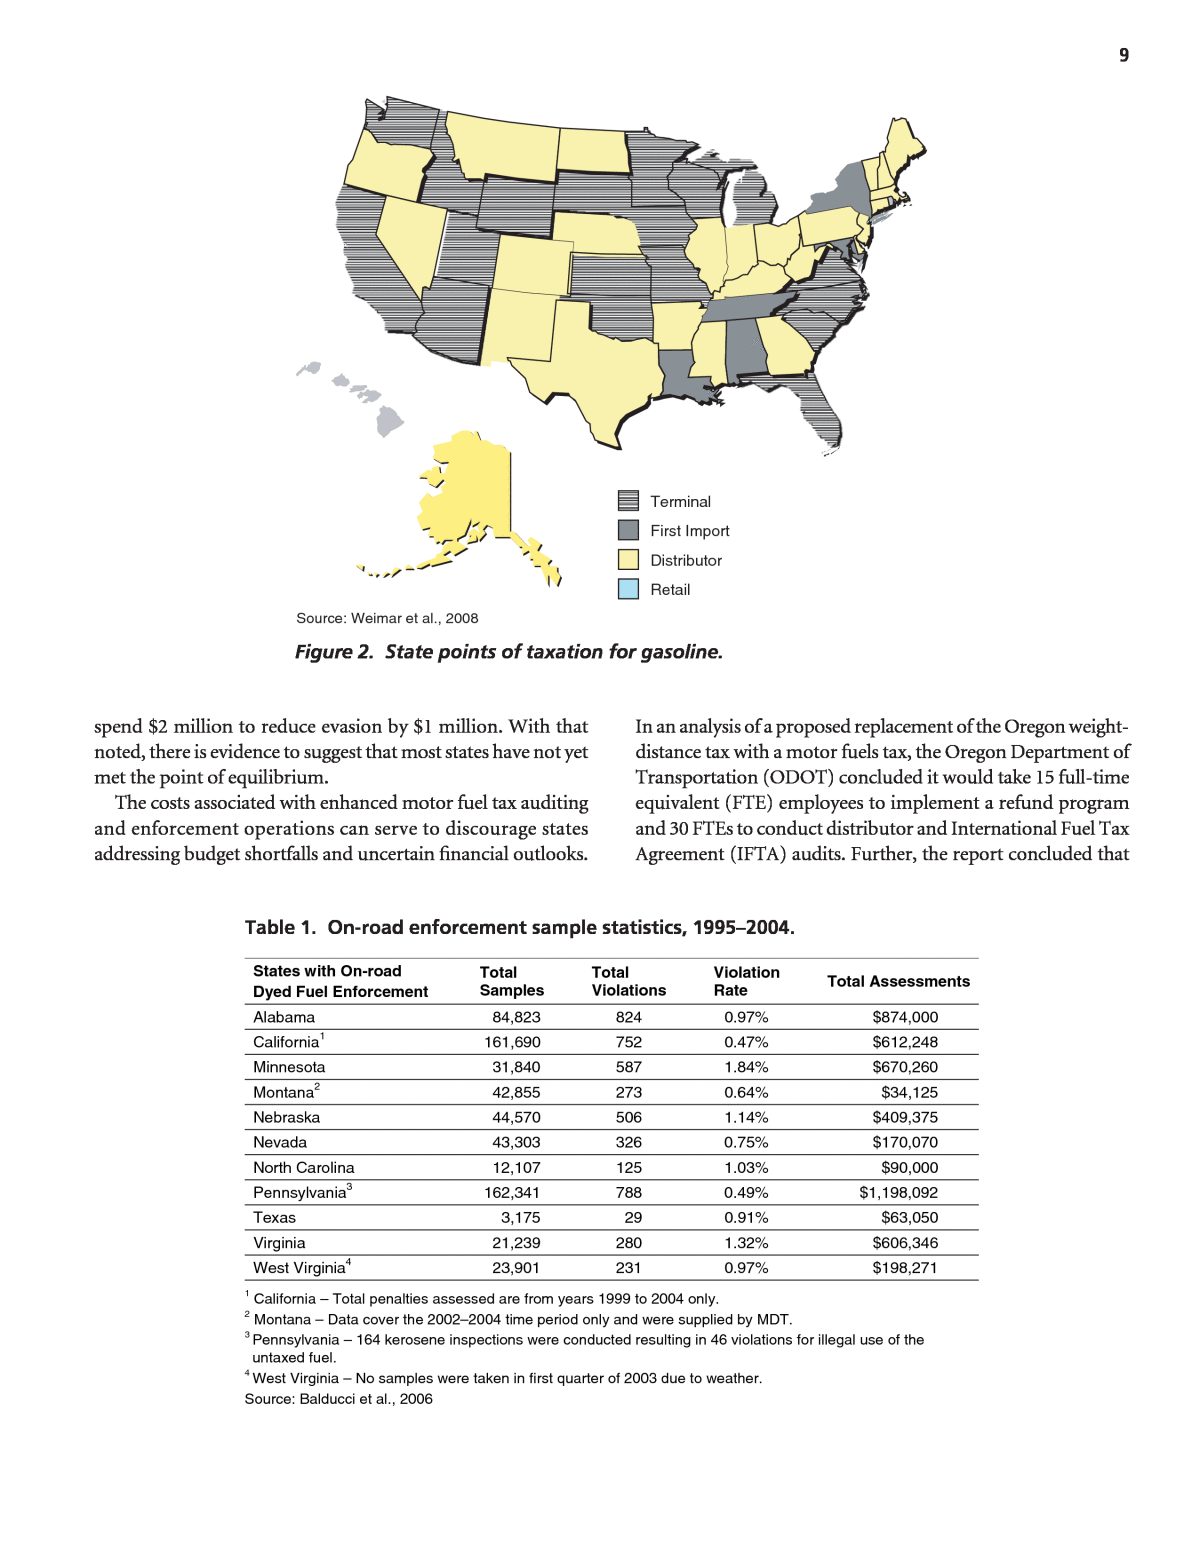
taxpayers. Consequently, there are more motor fuel tax returns to process and operations to audit. Moving the point of tax- ation up the distribution chain, while reducing the population of taxpayers and greatly reducing the number of audits, requires a refund program, including associated auditing requirements. Figure 1 and Figure 2 document state points of taxation for gasoline and diesel fuel (Weimar et al., 2008). The Omnibus Budget Reconciliation Act (OBRA) of 1993 mandated the dyeing of tax-exempt diesel fuel. This provision enabled law enforcement officials to detect visible evidence of tax-exempt fuel during roadside inspections. When caught using tax-exempt fuel on-road, motor carriers were assigned a federal penalty of $1,000 or $10 per gallon (Baluch, 1996). In 1994, the first year the law took effect, federal diesel fuel tax collections grew by $1 billion, leading the FHWA to attribute $600 to $700 million of that amount to the administration and enforcement provisions contained within the 1993 OBRA (GAO, 1996). As of 2008, 38 states had enacted dyed fuel statutes. In order to be effective, however, these dyed fuel statutes must be accompanied by on-road inspections, which can be expen- sive and time consuming. Some states have left the inspec- tions up to the 150 Internal Revenue Service (IRS) officers nationwide dedicated to conducting dyed fuel inspections. Many states, however, use designated officers to conduct fuel dipping in order to detect the misuse of dyed fuel. The costs associated with on-road dyed fuel inspections vary from state to state based on the number of inspections and the type of personnel used. Dyed fuel inspections can be per- formed during the operation of other safety inspections, or they can be the responsibility of state police officers. Dyed fuel inspections can be conducted at checkpoints, weigh sta- tions, or when vehicles are pulled over by police officers. On-road state enforcement sample statistics are presented in Table 1. As evasion techniques have evolved so too have auditing practices, with compliance agencies focusing more resources on field audits and joint stateâIRS audits. The Intermodal Surface Transportation Efficiency Act (ISTEA) of 1991 authorized the allocation of $5 million in annual federal Highway Trust Fund (HTF) proceeds to the states and the IRS for enhanced audit and enforcement operations. Programs established with these funds have led to greater coordination between states. The Fed- eration of Tax Administrators (FTA) established a uniformity subcommittee that issued a model-legislation checklist for states moving the point of taxation up the distribution chain and also established an 11-point plan for enhancing uniformity between states (FTA, 2003). The goal of eradicating all forms of evasion, however, is not only unachievable, it is inefficient. When focusing enforcement and collection resources, there is a theoretical optimum level of tax evasion. The optimum level of evasion is at the point of equilibrium between marginal revenue losses and marginal enforcement costs. That is, it is impractical and inefficient to 8 Source: Weimar et al., 2008 Terminal First Receipt/Sale Distributor Retail Figure 1. State points of taxation for diesel fuel.
9Source: Weimar et al., 2008 Terminal First Import Distributor Retail Figure 2. State points of taxation for gasoline. States with On-road Dyed Fuel Enforcement Total Assessments Alabama California1 Minnesota Montana2 Nebraska Nevada North Carolina Pennsylvania3 Texas Virginia West Virginia4 Total Samples 84,823 161,690 31,840 42,855 44,570 43,303 12,107 162,341 3,175 21,239 23,901 Total Violations 824 752 587 273 506 326 125 788 29 280 231 Violation Rate 0.97% 0.47% 1.84% 0.64% 1.14% 0.75% 1.03% 0.49% 0.91% 1.32% 0.97% $874,000 $612,248 $670,260 $34,125 $409,375 $170,070 $90,000 $1,198,092 $63,050 $606,346 $198,271 1 California â Total penalties assessed are from years 1999 to 2004 only. 2 Montana â Data cover the 2002â2004 time period only and were supplied by MDT. 3 Pennsylvania â 164 kerosene inspections were conducted resulting in 46 violations for illegal use of the untaxed fuel. 4 West Virginia â No samples were taken in first quarter of 2003 due to weather. Source: Balducci et al., 2006 Table 1. On-road enforcement sample statistics, 1995â2004. spend $2 million to reduce evasion by $1 million. With that noted, there is evidence to suggest that most states have not yet met the point of equilibrium. The costs associated with enhanced motor fuel tax auditing and enforcement operations can serve to discourage states addressing budget shortfalls and uncertain financial outlooks. In an analysis of a proposed replacement of the Oregon weight- distance tax with a motor fuels tax, the Oregon Department of Transportation (ODOT) concluded it would take 15 full-time equivalent (FTE) employees to implement a refund program and 30 FTEs to conduct distributor and International Fuel Tax Agreement (IFTA) audits. Further, the report concluded that
the costs of administering the motor fuel tax could exceed $10 million annually (Jones, 1995). The literature suggests that while it is expensive to effectively audit and enforce motor fuel tax codes, enhanced compliance activities yield positive returns on investment. From October 1992 through 1993, gasoline tax revenues reported in 38 states averaged $443 per auditor staff hour. Over the same time period, diesel tax revenues were enhanced at the rate of $321 per auditing hour (CSG & CGPA, 1996). Finally, FHWA reports that it receives $10 to $20 for each dollar spent on audits and criminal prosecutions (FHWA, 1999). 2.1.2 Previous Administrative Cost Estimates Historically, relatively few studies have attempted to esti- mate the administrative costs associated with motor fuel tax collection, and while study findings have varied, results indi- cate that motor fuel administrative costs are likely less than 1% of gross collections minus deductions for distributor collection allowances, refunds, and other allowances for handling losses and evaporation. In 1994, NCHRP Report 377: Alternatives to Motor Fuel Taxes for Financing Surface Transportation Improvements esti- mated motor fuel administrative costs at $200 million for all states (Reno and Stowers, 1994). In 1993, when this research was performed, net receipts from state motor fuel taxes totaled roughly $24.9 billion (FHWA, 1994b). Using net collections as the denominator to the administrative cost numerator, the aforementioned cost estimate presented in this publication represented 0.8% of total tax collections. In 1995, in response to a proposal to eliminate Oregonâs weight-distance tax and replace it with a tax on diesel, ODOT compared the administrative costs of the proposed system to that of the existing one. ODOT found that despite a reduction of 20 FTEs and a cost reduction of $1.4 million associated with the registration and reporting of tax records by out-of-state operators, net administrative costs would grow under the motor fuel tax due to the expanded workload associated with IFTA audits (3 FTEs, $250,000) and an expanded refund pro- gram (15 FTEs, $1.3 million). Assuming that the proposed motor fuel tax program would have been revenue neutral with respect to the weight-distance tax system it was designed to replace, estimated administrative costs would have been in the 4.5 to 5% range (Jones, 1995). The costs to administer motor fuel tax programs have ranged in recent years from 0.2% (Peters and Kramer, 2003) to 1.0% (HDR, 2009). The higher-end estimate was presented in an HDR report prepared for the U.S. Department of Transporta- tion and was based on data reported by states in Form 556 to FHWA for presentation in Highway Statistics. This estimate includes all deductions by state collection agencies, expenses of collecting and administering motor fuel taxes, expenses of inspecting motor fuel, and other costs or deductions by the col- lecting agencies. 2.2 Tolling This section summarizes the current practices and future trends that will affect toll-collection activities. Due to the long history and widespread use of tolling in the United States, this section provides an overview from an extensive body of litera- ture on toll systems, management practices, governance frame- works, system configurations, and pricing policies. 2.2.1 Overview of Tolling Systems and Current Practices Toll roads have been in existence since the early days of the United States. The first toll road in the United States was the PhiladelphiaâLancaster Turnpike, which was developed in the 1790s. Throughout the 1800s, a number of turnpikes were established in the United States. The first modern toll road with a toll-road agency was the Pennsylvania Turnpike, which opened in 1940. This was followed by additional tolled turn- pikes in Connecticut, Delaware, Florida, Illinois, Indiana, Kansas, Maine, Maryland, Massachusetts, New York, New Jersey, New Hampshire, Ohio, and Oklahoma. These roads were managed, administered, operated, and maintained by the state highway agency and/or a dedicated toll-road agency that reported to the state government. Although there are some exceptions, these facilities have historically been categorized by relatively high labor costs, reduced operational and main- tenance expenditures, and cash collection at tollbooths. More- over, these agencies are often constrained either politically and/or legally from increasing toll rates on a timely basis to cover increases in costs. The next important development with regard to the devel- opment and administration of toll roads involved the cre- ation of local toll-road agencies [e.g., the Harris County Toll Road Authority (HCTRA) in Houston, Texas, and the OrlandoâOrange County Expressway Authority in Orlando, Florida]. Moreover, a number of bridges and causeways have been developed and managed by city, county, and regional government agencies. The advantage of this approach is that revenues generated by the toll road system, which are drawn primarily from commuters, are plowed back into the local economy rather than being dispersed over a wide geo- graphic area. Finally, a growing number of toll facilities are operated by private entities under concession agreement. Private financing has been used for asset monetizations as well as for the devel- opment of new toll road facilities. Table 2 lists the roughly 90 toll agencies in the United States and Canada. 10
11 Mature State Agencies Mature Local & Regional Toll- Road Agencies Maturing and Ramp-Up Public Toll-Road Agencies Priv ate Toll-Road Agencies Alligator Alley (FL) Bay Area (CA) Toll Authority, California Alamo Regional Mobility Authority (TX) Adams Avenue Turnpike, LLC (UT) Caltrans (CA) Blue Water Bridge Authority Bay Area Toll Authority (CA) Ambassador Bridge DelDOT (DE) Buffalo and Fort Erie Public Bridge Authority Cameron County Regional Mobility Authority (CCRMA) (TX) B&P Bridge Company (TX) Floridaâs Turnpike Enterprise (FTE) Cameron County (TX) Camino Real Regional Mobility Authority (CRRMA) (TX) Brownsville and Matamoros Bridge Co. (TX) Georgia State Road and Tollway Authority (SRTA) Cape May County Bridge Commission (NJ) Central Texas Regional Mobility Authority (CTRMA) Chicago Skyway Illinois State Toll Highway Authority (ISHTA) City of Del Rio (TX) Connector 2000 Association Inc., (SC) Dulles Greenway Kansas Turnpike Authority (KTA) City of El Paso (T X) Eagle Pass (TX) Bridge Foley Beach (AL) Express Louisiana Department of Transportation & Development City of Pharr (Pharr-Reynosa Bridge) Foothill/Eastern (CA) Transportation Corridor Agency Indiana Toll Road (ITR) Maine Turnpike Authority Chesapeake Bay (VA) Bridge and Tunnel Grayson County (TX) Regional Mobility Authority (GCRMA) I-495 HOT lanes, Virginia Maryland Transportation Authority (MdTA) Delaware River and Bay Authority (DRBA) Hidalgo County Regional Mobility Authority Northwest Parkway Public Authority (CO) Michigan Department of Transportation (MDOT) Delaware River Joint Toll Bridge Commission (DRJTBC) Lake of the Ozarks Community Bridge (MO) Pocahontas Parkway Association (VA) New Hampshire Turnpike Delaware River Port Authority (DRPA) McAllen (TX) International Toll Bridge, Texas South Bay Expressway (CA) New Jersey Turnpike Authority (NJTA) E-470 Public Highway Authority (CO) Metropolitan Washington Airports Authority (MWAA) Starr Camargo Bridge Company New York State Thruway Authority (NYSTA) Galveston County (TX) Minnesota Department of Transportation (Mn/DOT) Toronto 407 Intl Inc. New York State Bridge Authority Golden Gate Bridge, Highway and Transportation District (CA) North Carolina Turnpike Authority (NCTA) United Toll Systems (AL) Oklahoma Turnpike Authority (OTA) Greater New Orleans Expressway Commission (GNEOC) North East Texas Regional Mobility Authority (NETRMA) Ohio Turnpike Commission (OTC) Harris County (TX) Toll Road Authority (HCTRA) North West Arkansas Regional Mobility Authority Pennsylvania Turnpike Commission Lee County (FL) Orange County (CA) Transportation Authority (OCTA) Pinellas Bayway (FL) Massport (MA) Osceola County (FL) Rhode Island Turnpike and Bridge Authority (RITBA) Metropolitan Transportation Authority (MTA) Bridges & Tunnels San Diego Association of Governments (SANDAG) South Carolina Department of Transportation (SCDOT) Miami-Dade Expressway System (MDX) San Joaquin Hills Transportation Corridor Authority (SJTCA) Sunshine Skyway Bridge (FL) Mid-Bay Bridge Authority (MBBA) Santa Rosa (FL) Bay Bridge Authority West Virginia Parkways Authority Niagara Falls Bridge Commission Sulphur River Regional Mobility Authority (TX) North Texas Tollway Authority (NTTA) Texas Turnpike Authority (TTA) OrlandoâOrange County Expressway Authority (OOCEA) Utah Department of Transportation Port Authority of New York and New Jersey (PANY/NJ) Washington Department of Transportation (WSDOT) Richmond Metropolitan Authority (VA) South Jersey (NJ) Trans. Authority Starr County (TX) Tampa (FL) Hillsborough Expressway Authority Source: Jacobs Engineering Group, 2010 Table 2. State, local, and private toll agencies.
2.2.2 Practices and Trends Affecting Tolling Systems In the last 10 to 20 years, five practices and major trends have had a dramatic impact on toll road operations: ⢠The change in governance structures of toll agencies, includ- ing the establishment of multimodal agencies and the intro- duction of private equity capital, ⢠The adoption of electronic toll-collection (ETC) systems, which permit free-flow movement at toll gantries, ⢠Improved traffic flow conditions due to higher throughput in the ETC lanes, ⢠Congestion management and the introduction of variable pricing schedules, ⢠The use of leakage rates to measure the rate of driver non- payment, and ⢠The charging of administrative fees and/or the criminaliza- tion of toll violations. These practices and trends will continue to have an impact on the costs of toll collection, administration, and enforcement. 2.2.3 Change in Governance Structure of Toll Agencies The majority of toll facilities are operated by a public agency that is part of or reports directly to a state, county, or munic- ipal government. The functional responsibilities of these agencies primarily focus on the administration, operation, maintenance, oversight, and enforcement of the toll facili- ties under their respective jurisdictions. Non-transportation related activities are limited to the leasing or operation of food and gas concessions, real estate transactions near the high- way, and financial transactions related to the management of new and outstanding debt issues. A notable exception is the management of an arts facility by the New Jersey Turnpike Authority (NJTA, 2007). The decreased availability of funding from fuel tax revenues has encouraged state and local agencies to consider a variety of new approaches that can be used to finance highway infra- structure. This has resulted in the establishment of new gov- ernance structures for tolling systems, such as ⢠Multi-jurisdictional agencies, which have been granted toll authority as well as the responsibility to develop new toll roads: An example of this governance structure is the Cen- tral Texas Regional Mobility Authority (CTRMA), which is developing toll roads in two counties in the Austin metro- politan area in Texas. Other Regional Mobility Authorities (RMAs) include the Alamo RMA (San Antonio), Cameron County RMA (BrownsvilleâHarlingen), Camino Real (El Paso), Grayson County Regional RMA (Sherman, Deni- son), North East Texas RMA (NETRMA, Tyler), Hidalgo County RMA (McAllen), and the Sulphur River RMA (Paris). To date, CTRMA and NETRMA are the only RMAs within Texas that operate completed toll roads within their respective jurisdictions. ⢠Multimodal agencies that operate toll roads in addition to other transportation facilities: A traditional example is the Port Authority of New York and New Jersey, which oper- ates airports, transit lines, and the Port Authority Trans- Hudson (PATH) rail system in addition to toll bridges and tunnels. A newer example is the Metropolitan Washington Airports Authority, which began to operate the Dulles Toll Road (DTR) in 2008 after operations of this facility were transferred from the Virginia Department of Transporta- tion (VDOT). The DTR is being used to help finance the extension of a transit line in the Washington, D.C., area. In addition, the Orange County Transportation Authority (OCTA) manages and operates SR-91 and bus transit lines in California. ⢠Private capital: In several states, a number of toll facilities have been developed or are being developed using private equity and debt capital. This includes project delivery using designâbuild (DB) contracts as well as project development and long-term operations through designâbuildâfinanceâ operate (DBFO) contracts. Recent examples include the South Bay Expressway in San Diego, California; the Toronto 407 in Canada; the SH 130 Segments 5 & 6 between Austin and San Antonio, Texas; and the I-495 HOT lanes in North- ern Virginia. A parallel trend is the monetization of older facilities, such as the Chicago Skyway and the Indiana Toll Road (ITR). Due to the incentive to maximize profits, the introduction of private capital has led to the assessment of higher toll rates, improved revenue collection, and pres- sures to reduce toll administration and collection costs. Enforcement activities typically remain the responsibility of the public sector. A number of public agencies, including multi-segment, multi-jurisdictional, and/or multimodal toll-road agencies, may cross-subsidize between facilities. An example is the New York State Thruway Authorityâs (NYSTA) operation and financial support of the Erie Canal. The extent of cross- subsidization between facilities may depend on the existing legislation, corporate charters, and the bond agreements for these agencies. 2.2.4 Electronic Toll Collection and Video Tolling Beginning in the late 1980s, ETC based on radio frequency identification (RFID) technology emerged, having been tech- nically proven for use in revenue operations. Over the past few 12
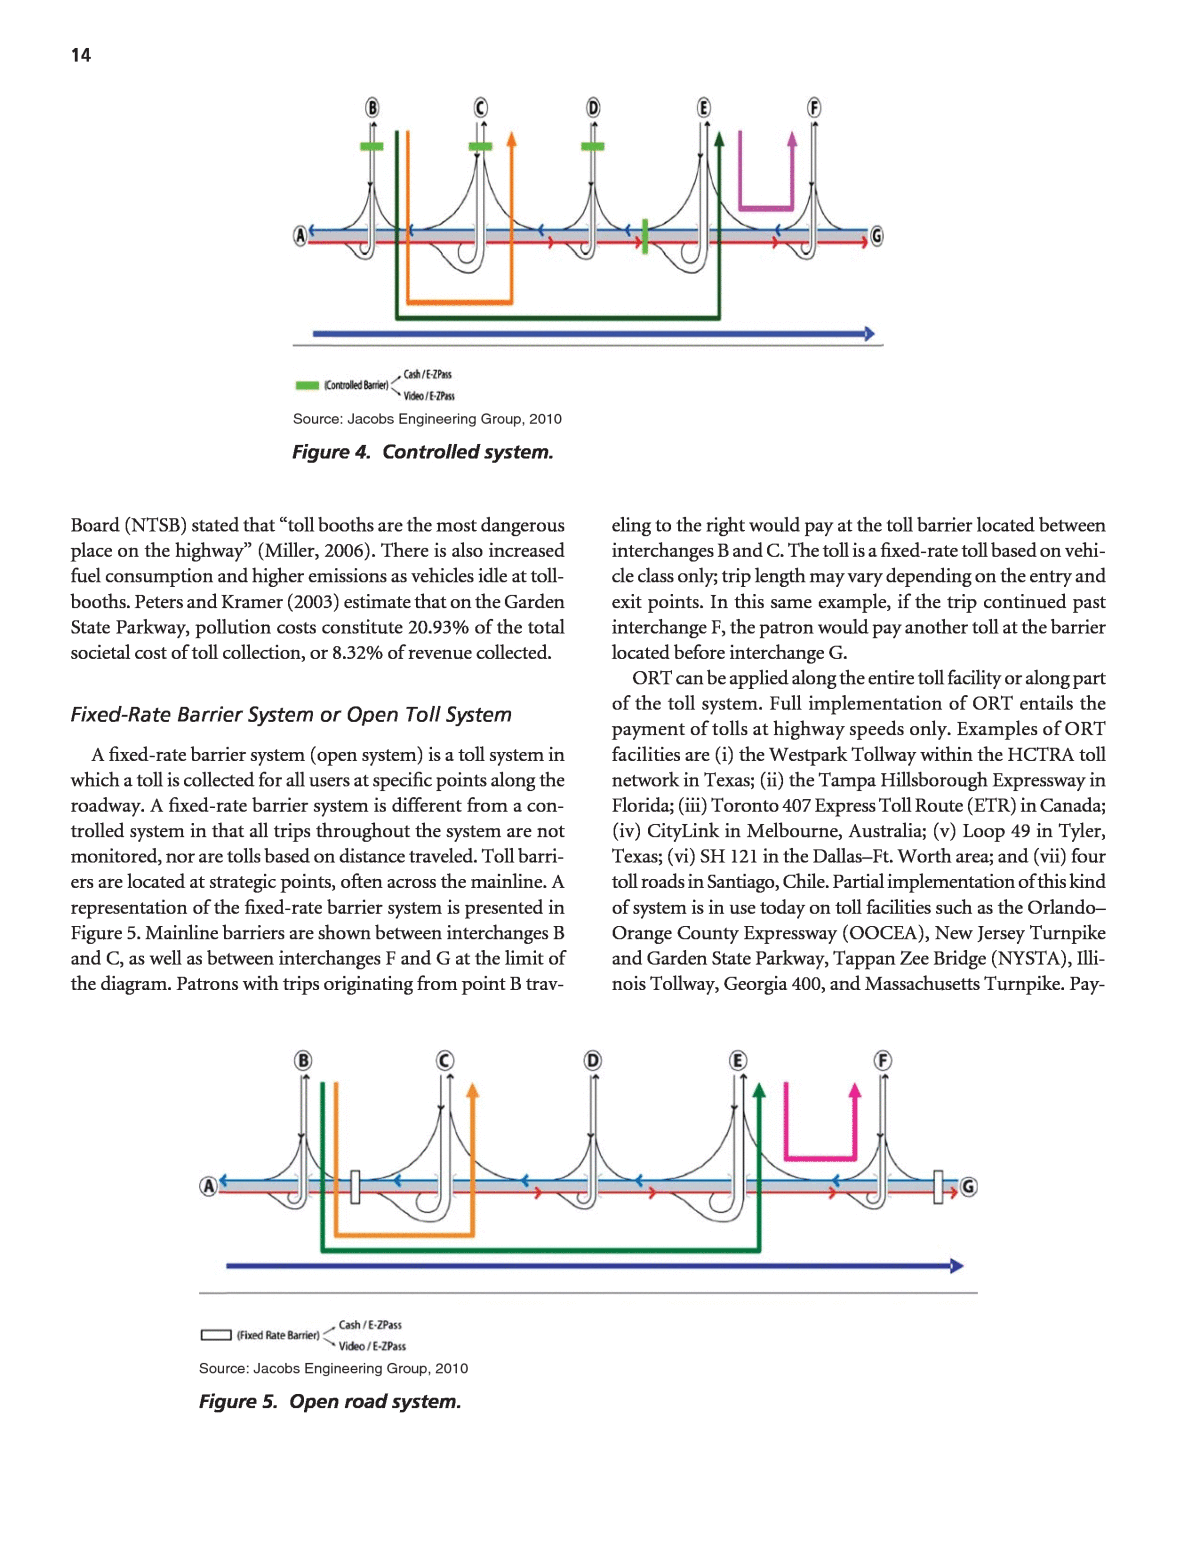
decades, many toll agencies have turned to electronic toll transponders or tags affixed to vehicles for drivers to pay tolls. In addition to providing added convenience to drivers and enhancing vehicle throughput, toll tags help reduce congestion by eliminating the need for cars to stop for the payment of tolls. Toll tags also help reduce air pollution by eliminating stop- and-go traffic and the idling of cars at staffed toll lanes. Beyond improving customer service for drivers and toll lane through- put for toll agencies, a recent study conducted by the Massa- chusetts Institute of Technology (MIT) claims that ETC has had one additional impact that has political ramificationsâ drivers are much less aware of toll rates when they pay electron- ically (Finkelstein, 2007). Because of the largely proprietary nature of first-generation ETC systems, tags are not interoperable across systems, just as VHS and Beta technologies were not compatible for video- cassettes, and computer programming languages are not uni- versally compatible. Over time, different approaches have been used to provide interoperability. In the early 1990s, the E-ZPass Interagency Group (IAG) created a seven-state, fully inter- operable ETC network in the northeast United States by selecting common tag and reader technology and developing account reciprocity procedures, allowing customers to use E-ZPass at any equipped facility with only one customer account. The IAG has expanded significantly since then to include 13 states and 24 different agencies. Toll authorities in a number of states have worked out similar cooperative agree- ments that allow a transponder from one toll authority to func- tion properly on a road in another part of the state. Texas, Florida, California, Washington, and Colorado have statewide interoperability programs. Other possible approaches to inter- operability are being evaluated by the recently formed Alliance for Toll Interoperability, which has over 30 participating toll agencies. Under this initiative, toll-road agencies are explor- ing the application and widespread use of video tolling inter- operability and exchange of license plate or ETC account information. As ETC has expanded, some toll agencies have moved toward open-road tolling (ORT), where traditional toll plazas have been modified or removed entirely to allow for higher speed express lanes. ETC tags are detected by readers that are mounted on overhead gantries. Figure 3 shows an ORT instal- lation in Austin, Texas. Tolls are collected electronically, either through customersâ already-established ETC accounts or by using automatic license plate recognition technology to read the license plates and obtain identification and address information for billing drivers. Toll authorities are beginning to consider converting to open-road and all-electronic tolling. At the very least, a number of agencies are implementing hybrid systems. Three basic toll-collection concepts are currently in use. The toll-collection concepts are (i) controlled ticket system (closed system), (ii) fixed-rate barrier system (open system), and (iii) hybrid tolling system. A description and a schematic representation of each toll-collection system are provided in the subsequent sections. Controlled Ticket System or Closed Toll System A toll-collection system is considered to be a controlled ticket system (or closed system) when all vehicles entering and exiting the system are monitored and tolls are calculated on the basis of vehicle class and distance traveled. In a controlled ticket system, both mainline toll barriers and ramp toll plazas are sit- uated such that no toll-free traffic movements are permitted. Typically, a patron traveling without a transponder will receive a ticket upon entering the system and submit that ticket to a toll collector upon exiting. The toll collector will collect the toll, which is based on the vehicle class and distance traveled. In cases where electronic toll collection is available, entry and exit from the system can be processed electronically. A representa- tion of the controlled ticket system concept is presented in Figure 4. As demonstrated in the figure, a mainline toll barrier is located between interchanges D and E, and ramp toll plazas are located at interchanges B, C, and D. The controlled system is assumed to continue to the left of the schematic, whereas interchanges E and F are located to the right of the mainline toll barrier and, therefore, are considered outside of the con- trolled system. A trip from B to C (shown in orange) will incur a toll based on the distance traveled between interchanges B and C. Similarly, a trip from B to E (shown in green) will incur a toll based on distanced traveled between the ingress point and the egress point to the controlled section of the road. For toll-road users, the primary obligation is to carry suf- ficient cash, use a debit or credit card, or maintain a valid transponder to pay for each trip. With a closed toll system, there is a greater risk of collisions at the cash lanes. During Congressional hearings, the National Transportation Safety 13 Source: CTRMA, 2008 Figure 3. Electronic toll collection on US 183A, Austin, Texas.
Board (NTSB) stated that âtoll booths are the most dangerous place on the highwayâ (Miller, 2006). There is also increased fuel consumption and higher emissions as vehicles idle at toll- booths. Peters and Kramer (2003) estimate that on the Garden State Parkway, pollution costs constitute 20.93% of the total societal cost of toll collection, or 8.32% of revenue collected. Fixed-Rate Barrier System or Open Toll System A fixed-rate barrier system (open system) is a toll system in which a toll is collected for all users at specific points along the roadway. A fixed-rate barrier system is different from a con- trolled system in that all trips throughout the system are not monitored, nor are tolls based on distance traveled. Toll barri- ers are located at strategic points, often across the mainline. A representation of the fixed-rate barrier system is presented in Figure 5. Mainline barriers are shown between interchanges B and C, as well as between interchanges F and G at the limit of the diagram. Patrons with trips originating from point B trav- eling to the right would pay at the toll barrier located between interchanges B and C. The toll is a fixed-rate toll based on vehi- cle class only; trip length may vary depending on the entry and exit points. In this same example, if the trip continued past interchange F, the patron would pay another toll at the barrier located before interchange G. ORT can be applied along the entire toll facility or along part of the toll system. Full implementation of ORT entails the payment of tolls at highway speeds only. Examples of ORT facilities are (i) the Westpark Tollway within the HCTRA toll network in Texas; (ii) the Tampa Hillsborough Expressway in Florida; (iii) Toronto 407 Express Toll Route (ETR) in Canada; (iv) CityLink in Melbourne, Australia; (v) Loop 49 in Tyler, Texas; (vi) SH 121 in the DallasâFt. Worth area; and (vii) four toll roads in Santiago, Chile. Partial implementation of this kind of system is in use today on toll facilities such as the Orlandoâ Orange County Expressway (OOCEA), New Jersey Turnpike and Garden State Parkway, Tappan Zee Bridge (NYSTA), Illi- nois Tollway, Georgia 400, and Massachusetts Turnpike. Pay- 14 Source: Jacobs Engineering Group, 2010 Figure 4. Controlled system. Source: Jacobs Engineering Group, 2010 Figure 5. Open road system.
ment is typically conducted through debit and credit cards. Typically, transponder holders maintain a minimum balance, which must be replenished once their account balance falls below a minimum threshold or becomes negative. Open toll-road collection systems require the installation of toll gantries, the installation of intelligent transportation sys- tems (ITS) with the concomitant purchase of hardware and software, and the construction of a customer service center (CSC). The CSC is intended to oversee the distribution or sale of transponders, maintain and update customer accounts, answer questions, resolve disputed transactions, and inter- face with toll enforcement activities. Toll transponders may be purchased from the toll agency or a third party provider. Toll agencies have introduced various strategies related to the distribution, sale, and pricing of transponders. These approaches include charging potential customers full cost, sell- ing transponders below cost, linking transponder purchase to discounts on toll transactions, and giving transponders at no cost. By offering transponders at no or reduced cost to poten- tial users, toll agencies have attempted to increase transponder penetration and increase throughput. Moreover, the distri- bution of transponders at below or no cost also attempts to address environmental justice issues related to the cost of pur- chasing transponders as well as the lack of access to credit/ debit cards by low-income users. There are also administrative expenses related to the reconciliation of out-of-area or out-of- state transactions as well as marketing expenses to promote toll road and transponder use. To convert an existing closed system to open road (or hybrid) toll collection, it is also nec- essary to remove tollbooths, modify or add highway lanes, and increase signage. The primary advantage to users of open toll systems is that they improve traffic flow and permit free-flow movements and faster travel speeds, subject to general traffic conditions. Toll- road users no longer have to stop at tollbooths, nor do they need to wait while other drivers pay for their transactions. As a result, the open toll-collection system has a quantifiable and potentially significant value of time benefit for users, especially commuters. Due to decreased stopping and idling, open toll- collection systems may lead to reduced fuel consumption and emissions. In addition, ORT facilities have improved safety conditions because the potential for rear-end collisions at toll- booths is reduced. To allow for free-flow movements and to avoid discriminat- ing against individuals who do not have a credit or debit card, toll agencies have been implementing video tolling options for toll-road users. There are two forms of video tolling: un- registered and registered accounts. Unregistered video-tolling systems permit users without access to a credit/debit card to pay for the use of a toll road facility. Specifically, unregistered video tolling systems look up vehicle registration information from the state department of motor vehicles (DMV) database. Upon motorist use of a facility, a bill is then mailed to the address listed with the DMV. Bills can be paid using check, money order, or other methods. With registered video tolling, the motorist must first regis- ter the vehicleâs plates with the tolling agency and then estab- lish an account by depositing funds or arranging some other method of payment prior to using the toll system. The toll sys- tem will associate the plate images with the account holder and debit the toll amount to the account. However, toll-road users with access to a credit/debit card may still pay the toll amount through an unregistered video-tolling account if they opt not to register their license plates with the toll agency. Video tolling systems may require toll-road agencies to pur- chase additional hardware and software needed for implemen- tation. Video tolling also requires interagency coordination if the DMV database is operated and updated by a separate agency. Additionally, video tolling may require additional administrative staff to review the accuracy of toll transactions and process payments received by mail. With respect to ETC and video tolling, users may have con- cerns relating to the privacy of credit/debit card information, vehicle information, and home address information. There are additional concerns associated with billing errors related to toll amount, the inaccurate assessment of late fees, and ghost transactions. These errors increase compliance costs since the responsibility for rectifying toll accounts is placed on the cus- tomer. Customers may also have concerns with respect to delayed payment or nonpayment, which typically result in the receipt of letters and telephone calls from collection agencies asking for full (or partial) payment of toll transactions along with administrative and/or late fees. In an effort to improve the accuracy of customer billing and payment processes, toll agen- cies, especially those that operate open road facilities, have been examining and implementing a variety of information technol- ogy improvements. However, this has had the effect of increas- ing variable costs over time due to the integration between new and existing IT systems, operations and maintenance activities, and the replacement of obsolete hardware and software. Hybrid Tolling System A hybrid tolling system is a combination of both a closed/ controlled ticket system and an open/fixed-rate barrier sys- tem. Hybrid systems give customers the option to pay by var- ious methods. ETC equipment monitors the entry and exit of transponder users to and from the toll road as in a controlled system. Electronic tolls are charged based on both vehicle class and distance traveled. Cash customers, on the other hand, pay a fixed-rate toll based on vehicle class at a designated main- line toll-barrier location regardless of their point of entry or exit between toll plazas. Figure 6 provides a schematic of a hybrid tolling system. Purple bars represent ETC gantries, 15
and diagonally dashed bars represent mainline fixed-rate barriers applicable only to cash customers. Since there is only one mainline plaza between C and F, cash-paying travelers originating at interchange B destined for either C or E pay the same toll despite the differences in distances traveled. Comparison of Toll-Collection Systems For users of toll facilities, open or hybrid toll-collection sys- tems have the advantage of faster traffic movements, improved travel times, and improved safety conditions. However, the development of open road or hybrid systems requires the installation of an ITS system and the establishment of a cus- tomer service center, which represents an ongoing cost for the toll-road agency. Open toll-road systems also require ongoing operational costs relating to customer account maintenance and violation enforcement. Open and hybrid toll-road systems tend to increase throughput, resulting in increased use and rev- enue generation. However, there may be an increase in revenue losses because violators have greater opportunities to avoid payment. Because video tolling can be used in either an open or hybrid toll-collection system, it has been described as a sep- arate system. Table 3 compares the payment and enforcement methods as well as the advantages and disadvantages between closed, open, and hybrid toll-collection systems. 2.2.5 Congestion Management Toll-road facilities designed for congestion management purposesâexpress lanes and HOT lanesâhave been designed specifically to improve traffic flow, especially during peak peri- ods. These facilities are typically located adjacent to non-tolled, general-purpose lanes in congested urban highways. Access is gained by drivers only if they pay a toll or meet designated vehi- cle occupancy requirements. Free access to mass transit vehi- cles is also typically offered. Access requirements and pricing structures for express/HOT lanes vary. In some cases, only single occupant vehicles (SOVs) are required to pay a toll, while in other cases, SOVs are not permitted access at all, HOV-2 drivers (those with only two occupants) pay a toll or monthly fee, and HOV-3+ drivers (those with three or more occupants) travel toll-free. Some HOT lanes have charged con- stant rates, but increasingly, HOT lanes use some form of value pricing (sometimes also called congestion or variable pricing), which adjusts tolls based on traffic periods or conditions. Tolls are highest during peak travel periods and lowest in off-peak periods, with the rates designed to maintain free-flowing traf- fic conditions. To manage congestion, toll agencies have implemented vari- able pricing, in which the toll rate charged depends on the time of day (variable/static) or congestion levels (variable/dynamic). Variable/static pricing is defined as having a set schedule of tolls that vary throughout the day, often in hourly increments based on recent historical data. Variable/static pricing often includes peak period pricing, which uses price disincentives to discourage facility use during peak periods. Facilities that have implemented variable/static pricing include the Tappan Zee Bridge in New York, I-25 in Colorado, SR-91 in California, Toronto 407, and two bridges operated by Lee County, Florida. Under variable/dynamic pricing, the toll rate fluctuates based on real-time traffic information. This pricing method requires variable message signs that display the toll rate before the decision point (e.g., the point where a motorist must decide whether to take the toll route or an alternate route). The use of variable/dynamic pricing requires the monitoring of vehicle speeds, volumes, and/or traffic density. Toll rates are set according to a predetermined algorithm. Tolls on existing facilities can change as often as every 3 to 6 minutes. San Diegoâs I-15 express lanes and Minneapolisâs I-394 MnPass express lanes are examples of facilities that use variable/ 16 Source: Jacobs Engineering Group, 2010 Figure 6. Hybrid system.
dynamic pricing. Figure 7 summarizes the existing and planned projects in the United States that involve the development of HOT lanes, express lanes, or variable pricing mechanisms. 2.2.6 Leakage Rates The calculation of leakage rates is a common practice used by toll agencies to estimate the number of transactions for which they have not received payment. Below are the defini- tions used by the International Bridge, Tunnel and Turnpike Association (IBTTA) with regard to toll violations and leakage: ⢠Leakage: Transactions where no revenue has been collected or revenue is not fully collected. Leakage does not include non-revenue or violation transactions wherein the vehicle is either not permitted to cross the barrier or where a violation image is taken. ⢠Variance: An error in the toll communication system that occurs when something between the onboard and roadside dialogue has failed. ⢠Violation: A record of an unpaid toll that occurs when a cus- tomer does not pay the proper amount. ⢠Transaction: A time-framed event occurring in the toll lane representing either a cash or electronic toll. The transaction is identified by all or a combination of the following parameters: location, time, date, vehicle class, vehicle ID, and toll amount. Because of the different disclosure requirements, system configurations, technologies employed, and metrics used, it is relatively difficult to provide a direct comparison of toll agen- cies with respect to toll leakage. While some agencies will dis- close debt that has been written off and/or disclose the amount of revenues that may not be collected, the manner in which these numbers are derived and the factors that influence these 17 Toll System Option Closed Toll Collection Open Toll Collection Hybrid Description and payment method Drivers pay at manned tollbooths or at automated coin machines (ACMs) Lanes have gates Gantry-mounted collection equipment ETC-only lanes Gates possible but not likely Mixture of barriers, ETC, and/or video tolling Enforcement method Gates Video cameras Toll attendants Police Video cameras Police Bills are mailed Some gates Video cameras Toll attendants Bills are mailed Police Advantages Fewer violations if gated Lower probability of customer account errors Increased throughput along the facility Increased revenues Minimum violation rate at gated areas Strategically placed gates Balances increased throughput and traffic flow with lost revenues Disadvantages Gates decrease throughput Cost for tollbooths and attendants Bottlenecks at tollbooths Employee theft Equipment malfunctions Increased potential for accidents at tollbooths Lower throughput can result in lower revenue generation Account management and back office costs Violation processing and collection costs, (e.g., court, collection agencies, liens) High violation rate without gates leading to more lost revenues Legal actions can result in negative publicity Incurs both barrier system and ETC costs Bottlenecks/accidents at collection points due to driver confusion Higher violation rate than gated system Source: Jacobs Engineering Group, 2010 Table 3. Comparison of closed, open, and hybrid toll-collection systems.
parameters are not always apparent. It should be noted that industry rules of thumb estimate toll system leakage to be between 5% and 10%. Below are some of the main issues that influence the reporting of toll leakage: ⢠Limited information disclosure: Because of the sensitivities involved, some toll-road authorities may be reluctant to publicly report leakage information, especially if leakage rates are relatively high. The publication of leakage informa- tion could have negative impact on existing debt obligations as well as potentially encouraging additional violations. Sim- ilarly, private-sector developers that are publicly traded tend to avoid the publication of this information since this could have a negative impact on their stock price. ⢠System configuration: System configuration will also affect toll-system leakage rates. Toll systems with more access and entry points will likely have higher leakage relative to compa- rable toll systems with fewer entry points. Similarly, toll sys- tems that use and maintain a higher percentage of physical barriers throughout the system (e.g., gates, retaining walls, and/or Jersey barriers) will likely have lower leakage rates. Along these same lines, it is more difficult to directly make the following comparisons: (i) systems with single-project authorities versus multi-project toll systems, (ii) urban ver- sus rural systems, and (iii) toll systems with mostly long- distance roads versus bridge systems. ⢠Technology used for enforcement: The estimation of leak- age rates will also be affected by the extent to which the sys- tem uses cash rather than electronic toll collection. A mostly cash system will place greater reliance on more physical measurements of road usage such as gates, in-lane traffic count equipment, eyewitness reports, and traffic citations. In contrast, ETC systems will rely more heavily on camera and video recognition systems. Similarly, leakage rates may differ on systems that collect front and back license plate information versus ETC systems that use only back license plate information. The inability to trace temporary or other paper license plates will also affect toll-system leakage rates. 18 Source: AE COM, 2006 Figure 7. Congestion management projects in the United States.
⢠Different metrics used: At present, there is no formal, stan- dard industry metric for determining and reporting toll leakage, and a number of agencies use more than one met- ric. These metrics can be based on total annual transactions, total annual revenues, or some combination of these param- eters. Even if some toll agencies use the same metric, there is considerable variability in how the formulas are calculated. This can lead to different conclusions with respect to total toll leakage as well as creating an incentive for smoothing the results. 2.2.7 Administrative Fees and Criminalization of Toll Violations Toll-violation enforcement is a significant issue for all toll- collection methods. There is a direct correlation between the type of toll-collection method used and the type of violation enforcement measures that should be considered and installed. This correlation relates to the ability to prevent violations and to collect payments from violators. Enforcement activities are either undertaken in-house or are contracted out to third party (public) agencies. Issues related to violation enforcement include (i) the physical detection and prevention of toll vio- lations and (ii) the prosecution and accountability of toll violators using legal methods. Detection and Prevention Detection and prevention of toll violations can be under- taken using the following methods: ⢠Gates: Gates will not open until payment is registered. ⢠Toll attendant observation: An attendant records the license plate number of the vehicle that he or she observed not pay- ing. Information is logged on paper or electronically and is cross-referenced against motor vehicle records to determine vehicle ownership. ⢠Camera/video enforcement system: A picture of the license plate is taken if the system fails to record an ETC or cash payment associated with that vehicle. The license plate is cross-referenced against motor vehicle records to determine vehicle ownership. ⢠Police/law enforcement: Police observe nonpayment and pursue violator. Accountability and Prosecution Toll violators can be made accountable for their actions using the following legal methods: ⢠Traffic offense: Failure to pay may result in traffic citation. ⢠Civil offense: Failure to pay may result in collection efforts, including sending notices of nonpayment, filings in civil courts, use of collection agencies, placing property liens, credit reporting, driverâs license or license plate holds, and vehicle impounding. ⢠Criminal offense: Failure to pay may result in charges of theft with restitution required. ⢠Administrative fees: Failure to pay may result in additional administrative fees. The main differences between civil and criminal enforce- ment typically are the costs of administration relative to the level of deterrence desired or needed. Specifically, civil enforce- ment is less expensive to administer and offers greater control in processing violations, but it may provide less of a deterrent to violations. Examples of toll facilities that use civil enforce- ment include the Illinois State Toll Highway Authority and the Orange County Transportation Authority. Criminal enforcement is a stronger deterrent against toll violations because of the possibility of the imposition of larger fines and possible imprisonment. However, criminal enforce- ment may be more expensive to administer and more difficult to coordinate since it involves prosecution under criminal court proceedings. Criminal enforcement requires coordination with police authorities, courts, and prosecutors. From a cost per- spective, a toll agency would need to determine if the costs of the desired enforcement mechanism are reasonable given the projected return in revenues and fees. Examples of toll agen- cies that use criminal enforcement are the Delaware River Joint Toll Bridge Commission in Pennsylvania and New Jersey and the Harris County Toll Road Authority in Texas. In either circumstance, civil or criminal, unless specifically prohibited, the state always retains (or should reserve) the right to pursue the collection of fees and penalties owed to it through all available means, including withholding privileges adminis- tered by the state such as vehicle registration. Whether toll data are subject to legal proceedings and can be released to outside parties (e.g., those involved in non-highway criminal, civil, or matrimonial issues) depends on the existing statutes within each state. Generally, state public information or open records laws require the release of information that a governmental entity collects or that is retained on its behalf. Because elec- tronic tolling requires the collection of personal information (name, address, phone number, credit card, vehicle descrip- tion, license plate, etc.), states have amended their statutes to prevent the unauthorized release of this information and to limit release to certain circumstances. This can include court order, toll enforcement, and the investigation of a felony offense. The retention of personal data is typically limited to only the period necessary to collect outstanding toll and fee amounts due to the agency. With the increase in the number of electronic toll facilities around the country, the collection of personal data has gener- ally had a limited impact on user acceptance. Ease of travel has 19
typically outweighed privacy concerns. Nonetheless, some agencies offer anonymous ETC accounts for individuals who do not want to divulge personal information. Additionally, many state laws limit toll violation photos to license plates. Table 4 summarizes the main differences between civil and criminal enforcement systems. 2.2.8 Tolling Administrative Cost Estimation and Comparisons In a report prepared for the U.S. Department of Transporta- tion, HDR estimated the differences in administrative costs for various revenue-generation systems as alternatives to the fuel tax (HDR, 2009). The report analyzed a video-based tolling system, an automatic vehicle identification (AVI) based tolling system, and a GPS-based tolling/VMT system. The study found that the administrative costs of video- or AVI-based systems were significantly higher than the costs of collecting the fuel tax. At the national level, the GPS-based system had the lowest costs among the technologies employed, but it was still much higher in cost than the fuel tax system if the hardware was included as part of the cost. Comparative Analysis of Tolling Systems in the United States Although a wide body of literature has been published on tolling-system activities, only a few reports compare the costs of toll collection among toll systems. Most toll agencies are extremely cautious in releasing their financial data because this could have an impact on their cost of capital for upcoming bond issues, their bond covenant requirements, and inter- governmental agreements among toll agencies. Toll sys- tems financed with private capital have additional concerns relating to stock prices (if publicly traded). Because of the increased shift toward the implementation of ETC systems and other broad shifts within the tolling industry, this section focuses on reports that have compared tolling systems within the last 3 to 5 years. A report commissioned by the Washington State Depart- ment of Transportation (WSDOT) in 2007 examined the costs of toll-collection activities for seven toll systems. The intent of this report was to develop a comparative cost estimate with respect to toll-collection activities for toll systems that are sim- ilar to the Tacoma Narrows Bridge (TNB), which was sched- uled to open later that year. The WSDOT report used annual financial reports as its primary data sources. In addition, each agency was contacted to collect information at a level that would be useful for comparison to the estimated operational costs for the TNB. In an effort to normalize cost data between toll systems, the analysis performed in the WSDOT report accounted for variations in traffic volumes, toll-collection methods, governance structure, violation rate, accounting prac- tices, and bond covenants. The report attempted to exclude capital and maintenance costs related to physical infrastruc- ture. The analysis found that toll-collection costs as a percent of revenues ranged from 14% to 20% (Figure 8). Moreover, the cost per transaction ranged from $0.23 to $0.56 (WSDOT, 2007). The study found that collection costs did not vary sig- nificantly between toll systems with high rates of ETC use versus lower rates. However, the analysis did not attempt to differentiate between administrative, collection, and enforce- ment costs. Another report commissioned by the U.S. DOT attempted to compare the costs of fuel taxes, VMT, and tolling systems. With respect to tolling, that analysis developed a financial 20 Civil Enforcement Criminal Enforcement Fewer administrative costs Less evidence required to render a violation decision Can better control processing for quicker resolution Trial location may be more flexible Less effective a deterrence, especially for repeat offenders Typically shorter statute of limitations Increased seriousness of the offense can lead to stronger deterrence Typically longer statute of limitations Higher administrative costs Requires great coordination efforts and involves more individuals/ processes over which the agency may have no control. Source: Jacobs Engineering Group, 2010 Table 4. Comparison of civil and criminal enforcement systems. Source: Washington State Department of Transportation, 2007 Figure 8. Toll-collection costs as percentage of revenues.
model that was used to forecast toll-collection costs and rev- enues over 20 years. The analysis included both capital costs for implementation and operating and maintenance (O&M) costs. The model was based on a 10-mile corridor and a 1,000-mile corridor, with three lanes in each direction and tolling points every 20 miles. The cost data for that study were derived from seven toll systems, including the I-394 project in Minnesota and proposed projects in California, Georgia, and Florida. The study also looked at video-based, AVI-based, and GPS-based systems for toll collection (Office of Economic and Strategic Analysis, 2009). That analysis did not find much variation in the initial capital costs related to these toll-collection systems. As a result, toll collection and administrative costs were identical with respect to VMT over 20 years (Table 5). Although video- based tolling was more expensive to operate over the 1,000- mile corridor (14% of revenues), it did not differ substantially from the methods using AVI (10%) and GPS (12%). For the 10-mile corridor, the video and AVI methods were cost pro- hibitive, with the capital and operating costs exceeding the revenues. However, this analysis did find that GPS-based sys- tems were less expensive to operate over a 10-mile corridor (53% of revenues) than the other two methods in that cor- ridor (HDR, 2009). Comparative Analysis of Tolling Practices Outside of the United States A report presented at the 2006 Conference on Road Charg- ing Systems in Paris studied a number of European and Asian toll and cordon facilities. The Austrian, German, and Swiss sys- tems use tolls to raise funds for financing highway operations and expansion in addition to congestion management. The other three systems (London, Stockholm, and Singapore) are cordon tolling systems designed to cut congestion in CBDs. For the tolling systems, capital and operating costs as a per- cent of revenues ranged from 8% in Switzerland to 23% in Germany. Capital and operating costs as a percent of total revenues for cordon pricing programs ranged from 40% in Stockholm and Singapore to 55% in London (Table 6) (Oery and Trans, 2006). 2.3 VMT Fees VMT fees can be implemented in a variety of ways. They can be limited to specific areas or facilities or they can be compre- hensive. They can be collected based on simple odometer read- ings or calculated based on careful evaluation of all travel done by a vehicle. They can be a flat fee for each mile driven or can be varied by time of day, class of road, geographic area, or direction of travel. It may even be feasible to set separate prices for each lane of a road. They can be the same for all vehicles or varied based on vehicle characteristics. The simplest type is a flat fee or charge that is based on the number of vehicle miles driven. Where vehicles are driven outside of the jurisdiction levying the charge, there will likely have to be a method to determine where the miles were driven. Charging for all VMT could be viewed as unfair for those with substantial travel in other jurisdictions, and if multiple juris- dictions impose charges, there will be concern about the allo- cation of revenue. Under fuel taxes, the state tax on gasoline is collected based on the location of the service station. This works reasonably well for people on long trips since they are likely to purchase gas in some proportion to the miles driven in each state. However, people who live in one state and work in a bordering state may have substantial use of roads in a state where they seldom purchase fuel. For diesel use by heavy vehicles, the tax is allocated under the IFTA based on where the vehicle is operated rather than where fuel is purchased. 2.3.1 Prices Set to Improve Management of the Road System VMT charges can be varied based on level of congestion, class of road, road damage done by the vehicle, or pollution and other externalities generated by the vehicle. Such charges are fairly rare, but there is growing interest in using the price system to better manage the road system (CBO, 2009). The economically efficient set of charges would generate incentives for the most efficient use of the road system, but there are complications and trade-offs. Perhaps the most important complication is that the efficient prices may not gen- erate the appropriate amount of revenue. For cars and other 21 Video AVI GPS Corridor length 10-mile 1000-mile 10-mile 1000-mile 10-mile 1000-mile % of revenues 151% 14% 111% 10% 53% 12% VMT (000) $2,259 $225,930 $2,259 $225,930 $2,259 $225,930 Source: HDR, Comparing Administrative Costs of Collecting Highway Revenues: Fuel Tax vs. Direct User Charge, Prepared for the Office of Economic and Strategic Analysis, U.S. Department of Transportation, February 2009 Table 5. Comparison of capital and operating costs between toll-collection systems.
light vehicles, the primary concern is congestion. The impact on congestion will depend on the level of congestion, and this is likely to vary for several reasons. First, there is systemic con- gestion, which is associated simply with the number of people using the road. This is subject to certain patterns of congestion as well as to random variation. Second, there is bottleneck con- gestion, which is associated with capacity constraints on a road, either due to physical differences, such as reduced number of lanes, or operational conditions, such as on-and-off traffic. Finally, there is incident congestion, associated with accidents, weather, or other factors that may interfere with traffic flow (CBO, 2009). When setting prices for congestion, there is a trade-off between the ability to manage congestion efficiently and the ability of the driver to make decisions based on the effi- cient price. Prices set in advance may not accurately reflect conditions at any given time, but prices that vary dynamically may not allow the driver sufficient advance information to change behavior. Charges based on congestion management would generate little or no revenue on low-volume roads, espe- cially outside of urban areas. Charges for externalities that vary with miles driven could also be included in efficient VMT fees. Externalities can be dif- ferent under different circumstances and may be mileage based or based on other characteristics, such as amount of fuel used (Parry, Walls, and Harrington, 2007). For heavy vehicles, the cost imposed on the road relates to the size of the vehicle and to the operating characteristics. Because of the size and possibly slower acceleration, more room for braking, and problems with steep road grades, heavy vehicles are often compared with light vehicles in terms of road capacity used by means of passenger car equivalent (PCE) measures. The PCE will vary based on a variety of characteris- tics, including the level of congestion and steepness of road grade, and this may be the best determination for congestion- related charges to heavy vehicles. In addition, heavy vehicles cause substantial damage to road pavement based on the weight per axle and certain other characteristics of the vehicle. This damage also varies with the ability of the road to withstand heavy loads. Thus, the efficient charge for a heavy vehicle would also vary with the class of road, weight of the vehicle, and num- ber of axles (Small, Winston, and Evans, 1989). 2.3.2 Review of U.S. Experience VMT fees are not directly used for most road financing in the United States; however, there have been a number of exper- iments with distance-based charges, and several states have used weight-mile taxes for heavy vehicles. Most of the experi- ments have been based on using GPS to determine the location of the vehicle; however, Donath et al. (2009) proposed a sys- tem that would rely on location data related to cell phone tow- ers as a promising near-term solution to determining where a vehicle is being operated. This system has not been tested, and no cost estimates were provided. There is interest in odometer- based or self-reported VMT systems, but Sorenson et al. (2009) reviewed near-term options for implementing VMT fees and concluded that odometer-based systems would require major changes to DMV operations and databases. 22 FACILITY Tolling Systems Cordon Systems Austria* Germany* Switzerland* London* Stockholm*** Singapore Operating costs 735 m/a 7620 m/a Toll collect (incl. capital costs) 750 m/a BAG**** 735 m/a 7133 m/a 740 m/a (720 m/a estimate for permanent system) 77 m/a Average charge 70.27/km (40 t truck) 70.12/km (40 t truck) 70.67/km (40 t truck) 77.4/day (now 711.8) 72.7/day 70â2 per trip Fee income 7770 m/a 72 860 m/a 7800 m/a 7275 m/a 780 m/a 739 m/a Operating costs as a % of revenues 9% 16%** 4% 48% 25% 7% Annualized costs (incl. capital costs) as a % of revenues 12% 23%** 8% 55% 40% 40% * Presentation by Bernhard Oehry, Rapp Trans; data for London facility does not include the Western Extension. ** Including costs of deployment, construction, operation, and development of the infrastructure network. *** Stockholm figures for 2006. **** For enforcement under the Bundesamt für Güterverkehr (BAG), or Federal Office of Freight Transport. Source: Conference on Road Charging Systems, Technology Choice and Cost Effectiveness, Paris, June 1, 2006 Table 6. Approximate costs and revenues for selected tolling and cordon systems outside the United States (2005).
Oregon VMT Experiment The Oregon mileage-charging experiment has generated substantial interest (Rufolo and Kimpel, 2008; Whitty, 2007; and Kim et al., 2008). In the experiment, participating vehicles were charged a mileage fee and received a refund of the state gas tax when they fueled at participating stations. Some vehi- cles were charged a flat fee for all miles driven in Oregon, while other vehicles were charged a premium rate for driving in the Portland metropolitan area during weekday rush hours and were charged a discounted rate for all other driving in Oregon. Vehicles were not charged for driving outside of the state and did not receive rebates for gas taxes paid to other states. There are several distinct advantages to this system as a mechanism for collecting revenue. Since the fuel tax is the default, the majority of revenue for the system is collected from the distributors who pay the fuel tax. This substantially reduces the potential for evasion and the need for enforcement mech- anisms. People who do not pay the mileage fee default to pay- ing the gas tax. In addition, the state has limited need to audit or monitor individual motorists or vehicles. It should be rela- tively simple for a computer system to compare gas tax refunds with miles driven to flag vehicles with anomalies for audit. In general, the state would regularly have to audit the service stations only with respect to the net difference between the mileage fee collected and the gas tax included in the whole- sale purchase of fuel. The system shows promise as a method to transition from the fuel tax to a mileage-based fee, and it could support congestion pricing at some point. Despite the positive aspects of the experiment, there appear to be both technological and non-technological issues that deserve fur- ther consideration. While the system is compatible with congestion pricing, congestion pricing is only feasible if the majority of vehicles are participating. Yet the system is projected to be installed only on new vehicles. Since the phase-in period is expected to be fairly long, this does not seem to be a reasonable short-term system for using pricing to address congestion problems. Also, the system does not distinguish factors that affect the impact that a vehicle has on the level of congestion (e.g., class of road or direction of travel), although it does charge for each mile driven in the defined area. The technological improvements required relate to the cost and reliability of the system. In general there is going to be a trade-off between cost and reliability. For the system tested, estimates of the mileage by zone were compared with the odometer mileage for some vehicles, and the differences were as high as 20% (Kim et al., 2008). In addition, the geographic refinement of the zones was limited. For a revenue collection system, users must be convinced that the system is fair, and discrepancies in the determination of location or mileage may create problems. Hence, costs may have to come down sub- stantially to allow a system with enough reliability to be used for revenue collection, or some capabilities may have to be omitted during the phase in. If the capabilities (e.g., for conges- tion pricing) are left out of the early vehicles, then the imple- mentation for congestion pricing could be further delayed. The system relied on radio frequency (RF) communication between the vehicle and the fuel pump. For fueling transac- tions, the signal strength was required to reach a pre-specified level before the vehicle was clearly identified as fueling at a specific pump. This appears to have resulted in a substantial number of transactions that were not identified as being for participating vehicles. Spacing of the pumps, the level of RF interference, and other factors may have affected the reliability of the system, and failed connections created some problems for the system. If not identified as a participant, the vehicle was charged the state gas tax and not the mileage fee. At the next transaction, the mileage fee from the last identified connec- tion would be charged, but the refund would only include the gas tax on the current purchase. The owner had to submit a receipt showing the gas tax paid in the interim fueling to get the appropriate refund of the state gas tax. Greater reliability is needed for an operational system, and this is likely to increase the actual deployment cost relative to the cost incurred in the experiment. Miles driven with no GPS signal were not charged. The GPS was left on at all times to minimize the number of miles driven that could not be allocated, but this resulted in battery problems for a large number of vehicles. Behavioral responses may not all be positive. Even with a flat fee per mile that approximated the gas tax, some people reported reducing driving simply because they became more aware of short trips and cost. There was some evidence that the flat fee induced people to group trips. This reduced the total number of trips, but since drivers appeared to group these trips with their rush-hour trip to or from work, it may have increased rush-hour travel. If the grouping resulted in more travel on uncongested local streets, it would not be a problem; however, if the travel were on congested arterials or other roads, the flat fee pricing may have a negative effect on conges- tion. This could be exacerbated if it increased the amount of stopping and starting (e.g., through more on-street parking) and further disrupted traffic. The effect of a flat mileage fee on rush-hour travel should receive further analysis. Finally, major oil companies did not agree to allow their gas stations to participate in the Oregon experiment. Since they represent the majority of stations, the reasons for their refusal should be clarified and addressed. Puget Sound Regional Council The Puget Sound Regional Council sponsored a project to equip vehicles with a device to track all road usage in the area 23
and set prices based on the class of road and time of travel. Detailed information on all travel by a vehicle was collected and uploaded regularly by cellular transmission. The system is reported to have worked well, but complete details have not yet been released. A number of issues were identified that need to be addressed before the system can be implemented (Puget Sound Regional Council, 2008). These include further refinement of the system and design of enforcement and billing systems. In particular, there was no enforcement mechanism in the design of the experiment, and an enforcement system would have an addi- tional cost. Dense road networks without access controls were identified as a concern for the pricing system. The trade-off between having data processed on the vehicle with summary data sent to the billing center versus uploading of all data for processing at a central location was identified as having privacy implications as well as communication cost implications. The detailed information on travel collected did not appear to be a concern for the participants, but it would almost certainly be a concern if participation were not completely voluntary. Implementation of a full-scale system is projected to have a mechanism for non-participants that could also maintain anonymous usage. Also, the area subject to the pricing seems to have been limited by the storage capacity of the system. The cost of the initial installation of the GPS and communication costs were identified as key concerns, but declining costs over time for each were also noted. Iowa Pooled Fund Study and Extension The Iowa Pooled Fund study designed a GPS-based system that could track miles driven by area and could include a vari- ety of areas with varying degrees of overlap and separate pricing systems. All data are maintained in a secure environment, with only total amounts owed by the vehicle to each jurisdiction gen- erally available. The data were uploaded regularly using a smart- card system. If there were a dispute regarding amounts owed, the vehicle owner could decrypt the data to show detailed travel information (Forkenbrock and Kuhl, 2002). A system similar to this is undergoing extensive testing over a number of years and seven locations. It will be some time before the conclusions from this extended study will be avail- able. However, the basic design is likely to follow that described by Forkenbrock (2008). It is likely to be somewhat different from the initial experiment. The onboard computer will have the capability to store polygons so that charges can be varied by geographic area but not by road. It is expected that there will be differentiation by state but that local governments could also add charges for travel within their jurisdictions. The com- puter may have the capability to use more detailed files to iden- tify class of road so that differential prices could be charged for different roads. For periods without a GPS signal, the informa- tion from the odometer will be used to generate charges, and the comparison between the GPS mileage and the odometer mileage will be used to monitor the system. Billing data will be uploaded once per month to a central billing operation. The billing center will only receive information on the total bill and the apportionment among jurisdictions. During the upload, updated fee files could also be sent to the vehicle. The fee struc- ture could be specific to vehicle classes, with characteristics such as fuel efficiency and emissions affecting the rate charged. Pay-as-You-Drive Experiments Several of the experiments in the FHWAâs Value Pricing Pilot program were designed to convert some of the fixed costs of driving to variable costs. These used different types of tech- nology and helped to identify some of the potential methods to collect a mileage-based user fee (MBUF) as well as some of the potential drawbacks of these approaches. One such study con- ducted in Minnesota used a commercial system that plugs into the OBDII (an onboard diagnostic system) port to obtain mileage data and tracked total mileage and time for each trip. This allowed for differences by time of day in pricing but would not allow for differences based on location of travel or class of road. In addition, data had to be manually downloaded, and the system is not compatible with all vehicles (Abou-Zeid et al., 2008). A separate account must be set up for each participant and there would have to be a billing or payment system. Georgia tested a system similar to the one tested in Iowa, but without the encryption, as a method to charge flat VMT fees. An extension appears to be having delays due to instability with the hardware and software. Lessons from Experiments The costs associated with the experimental approaches appear relatively high, and operational improvements would be required for implementation of any of the systems on a large scale. Nevertheless, they show that these types of systems are feasible. Since the experiments typically used prototype equip- ment on a small scale, the expectation is that per-vehicle cost for an operational system would be lower. This would be par- ticularly true if the technology is already in the vehicle for other reasons. Oregon Weight-Mile Oregon charges heavy vehicles for mileage based on the declared weight of the vehicle and the number of axles. The charge is intended to equitably allocate the cost of road damage to heavy vehicles since the amount of road damage increases with vehicle weight but decreases with additional axles for a given weight. The system is based on monthly or 24
quarterly reports by owners of heavy vehicles. Only mileage totals are reported. The rate is based on the registered weight of the vehicle and the number of axles to avoid the need for detailed monitoring of load changes. Certain vehicles, such as log trucks, have the option of paying a flat fee, but most vehi- cles must pay the weight-mile tax. The charge is levied in lieu of the diesel fuel tax; Oregon does not levy a diesel fuel tax on fuel purchased for use in a vehicle paying the weight-mile tax. The mileage reports are based on owner fleet records, and the system is well established (Rufolo, Bronfman, and Kuhner, 2000). Oregon is one of four states in the nation with a weight- distance tax, with the others being New Mexico, New York, and Kentucky. 2.3.3 Review of International Experience A number of countries levy mileage charges on heavy vehicles, with the German system being the most studied. The Dutch have proposed charging all vehicles for all road usage, with the charge varying based on both vehicle and road characteristics. German Truck Fee The German system levies a fee based on the road, distance traveled, number of axles, and emission class of the truck. The fee is charged on the autobahn system but has the potential to be expanded to other roads. Truck drivers have the option of paying manually at various point-of-sale (POS) systems for trip permits or of having a GPS-based system installed that allows for automatic collection of the tolls. The large majority of tolls are paid using the GPS. The GPS determines the loca- tion of the vehicle and uses the location information to deter- mine tolls based on 5,200 toll segments in the system. The information on tolls is then transmitted to a billing system. In addition to the GPS, the system has a dead-reckoning capabil- ity for times when the GPS signal is not available. The cost of the GPS is paid by the toll authority, but installation costs are paid by the user. The global system for mobile communica- tion (GSM) is used to communicate with the computer cen- ter. The system has additional communication capabilities for enforcement and for interoperability with other European communication systems. The initial start-up had substantial cost overruns, and the units are fairly expensive (Samuel, 2005 and Kossak, 2006). The system used in the Puget Sound study is a simplified version of the German system. Dutch Proposal The Dutch have a detailed proposal to move to VMT charges for all road use, although there is still much uncertainty about the specifics of the system. They have compiled a sub- stantial amount of information. Since the system has not been implemented yet, the information compiled in the Dutch sys- tem is still somewhat speculative. However, the Dutch com- pleted detailed cost studies and continue to move toward implementation. It appears that the intent to implement road pricing for heavy vehicles starting in 2011 has now been postponed. 2.3.4 Discussion of Issues Related to VMT Fees A VMT charge will have to be collected and enforced. This has not been a concern for many of the experimental approaches since they did not actually collect any money from participants. The typical procedure was to set an endowment account that was expected to cover the charges a vehicle would incur with no change in miles driven. The mileage charges were then deducted from this account and any balance was given to the user at the end of the experiment. This procedure gave the marginal pricing incentives without creating actual cost or financial risk for the participants. However, it also meant that the experiments were not completely realistic, lacking any bill-paying mechanism and any method to enforce collection when the bill was not paid. As noted earlier, the Oregon system had a relatively simple mechanism for payment; the charge was adjusted at the pump when the vehicle was fueling. Under full implementation, vir- tually all collection activity would occur at the fuel pump, and most of the actual revenue would come from the fuel distrib- utors, who would still be liable for the state fuel tax. All of the other systems require that some form of bill-paying system be implemented. In addition, some methods of enforcement and auditing will be required. Finally, some method of reconciliation when customers dispute their charges must be implemented. There are substantial trade-offs between system capabilities, cost, and complexity. The simple systems just keep track of total miles traveled. Somewhat more complex systems keep track of mileage by geographic area. The most complex systems are those that require identification of class of road. Aside from the need for more detailed information, the potential for error in identifying roads typically requires additional capabilities to improve accuracy. Both the Oregon and Minnesota systems get data from the OBDII port. It appears that the OBDII port may be problem- atic as a general requirement. First, it was only required in vehicles starting in 1996, but some vehicles with the port do not meet all of the specifications. Both experiments had problems with certain vehicles due to issues with the OBDII port. In Minnesota they were excluded from participation, and in Ore- gon these vehicles were equipped with an alternate system that simply used the GPS to calculate miles traveled. Also, in the Oregon experiment, there were discrepancies between the 25
miles driven as calculated using speed data from the OBDII port and miles from the odometer reading. Any system to collect revenue will be subject to evasion and avoidance behavior. Both may be relevant in terms of evaluat- ing a VMT system. Some systems will be designed to induce avoidance (e.g., congestion pricing systems), but others may induce inefficient behavior. For example, a system like Ore- gonâs, which charges by the mile in-state but has no charge for out-of-state mileage, could induce a driver to make a long trip along the Washington side of the border with that state. This would reduce the amount of mileage fee owed to Oregon with- out affecting the gas tax rebate. Evasion is a larger problem. With a GPS-based system, this might be accomplished by blocking the antenna to prevent signal acquisition. Since sig- nals may be problematic in some areas, such as those with large buildings or forests, it may be difficult to determine whether there has been purposeful interference or a natural problem. There must be a mechanism for audit and reconciliation if there are differences between the amounts that the system charges motorists and their view of an appropriate level of charges. If integrated with the gas tax, the POS software requires substantial modification to allow the system to inter- act with the mileage-fee system. Some determination of the cost for this conversion and determination of who will be responsible should be made. It would also be necessary to sub- stantially improve the ability to detect which pump a vehicle is being fueled at since missed reads create both an accounting and a customer-relations problem. The accuracy of the system will be more important as the number of vehicles participat- ing increases, since there would be more possibility of inter- ference or incorrect association between a vehicle and a pump. For more complex systems, information on prices must be communicated to vehicles and displayed to drivers. There should also be a method to update information. This is likely to be necessary if there is any intention to change fees over time. There are several equity issues that must be addressed. If the fee is simply a mileage fee for equipped vehicles, equity between equipped and non-equipped vehicles will be an issue. One possibility would be to refund an estimate of the gas tax based on miles driven and EPA mileage estimates. Other equity concerns relate to equity between vehicle classes, geographic equity, and equity relative to income. If the system is to be used for road management, some deter- mination must be made of how the system will be phased in and what level of coverage is needed to make the system effec- tive. For example, congestion pricing is not likely to be effec- tive unless most vehicles face the congestion charge. There may be a need to pass enabling legislation or apply for existing exceptions allowing for a charge to be levied on the Interstate highway system. To encourage interstate com- merce, the legislation creating the Interstate system prohib- ited the use of tolls on the system. A number of toll roads were incorporated into the system and allowed to continue using toll revenue; however, roads built from that point on as part of the Interstate system could not have tolls levied. ISTEA allowed for some exceptions to this prohibition, but it generally still pre- vails. Detailed discussion of the prohibitions, exceptions, and legal issues are presented in Fishman (2009, pp. 20â28). Infor- mation on the use of tolls on the Interstate system can be found in FHWA (2009a). 2.4 Cordon Pricing Cordon pricing systems have been implemented in Singa- pore, London, Oslo, Stockholm, Milan, Malta, and several small cities in Norway. The objectives of implementing cordon pric- ing systems are to reduce congestion in congested areas with rel- atively high densities, to raise funds to finance infrastructure development, and to reduce vehicle emissions. Additionally, public agencies have used congestion pricing policies to man- age vehicle ownership rates in areas with high population den- sities, encourage greater walking or cycling, and induce transit usage. Other potential benefits of cordon pricing include reduc- tions in vehicle emissions, decreased fuel consumption, and improved safety conditions. Public acceptance is one of the major obstacles encountered in the implementation of the cordon pricing system. For exam- ple, in the early 1980s, Hong Kong implemented a cordon pric- ing system on a pilot project basis, but it was later discontinued due to public opposition. Cordon pricing systems were also considered in Edinburgh, United Kingdom, which held a referendum on the implementation of a two-cordon system. More than 74% of voters rejected the cordon pricing scheme in a referendum held in 2005. Concerns were raised regarding the potential fairness to local residents who live in outlying areas as well the potentially negative impact on local businesses. Table 7 summarizes the locations in which cordon (or conges- tion) pricing systems have been adopted or considered. In this section, the operational and financial performance of the Singapore, London, Oslo, Stockholm, and Milan systems will be examined in greater detail. The financial performance of four of these systems (not including Singapore) will also be com- pared with tolling systems in the United States and Canada. The remainder of this section is divided into six subsections. The first five subsections describe cordon pricing systems that have been implemented in a country or major cities, and the last subsection provides a summary analysis for the five systems presented. 2.4.1 Singapore Overview of the Singapore System The Singapore system was the first cordon pricing system ever implemented, initially instituted as a manually based 26
scheme (i.e., paper tickets checked at various control points) in 1975. This system was developed to manage congestion and system demand, especially within the more congested parts of the CBD, which was designated as a restricted zone (RZ). The RZ covered 610 hectares at the beginning and then was expanded to 725 hectares to include reclaimed land along the seafront as well as newly commercialized areas. The conges- tion pricing periods have been expanded over time. When the system was first opened for operation, the congestion charge was applied during the morning peak period from 7:30 to 10:15 a.m. except for Sundays and holidays. In the late 1980s, the charging period was expanded to cover the evening peak period from 4:30 to 7:00 p.m. In 1994, the congestion pricing period was modified to cover the off-peak period of 10:15 a.m. to 4:30 p.m., essentially extending the congestion pricing throughout the workday (Yap, 2005). Operations and Enforcement of the Singapore System Before being replaced by an electronic system in 1998, cor- don pricing was administered manually though the use of paper permits that were checked at 31 control points demar- cated by overhead gantries. Additionally, 13 park-and-ride facilities were established at the outer edges of the RZ. To gain access to the RZ during the congestion charge periods, drivers were required to purchase and display a specially marked monthly or daily license. Monthly licenses could be purchased at the post office, while daily licenses were sold at post offices, roadside sales booths, gas stations, and convenience stores. Different-shaped licenses were used for various vehicle classi- fications. To deter fraud and support enforcement activities, license colors were changed each month. The other manual pricing system in Singapore involved the use of special licenses for use on local expressways during the morning peak period. The congestion zone licenses were also valid. This system was enforced at five separate checkpoints. Technological improvements permitted the implemen- tation of an electronic vehicle recognition and enforcement system in 1998. The electronic road pricing (ERP) system sup- ported enforcement along a wider area in addition to the man- ual checkpoints. Moreover, the ERP system reduced the evasion technique of transferring licenses among vehicle owners. This system uses in-vehicle transponders, smart cards, electronic gantries, and a central control center, which processes payment transactions, reviews violation images, and sends out violation notices. The ERP system is intended to be user-friendly. As a vehi- cle passes through the ERP gantry, the appropriate charge is deducted from a smart card. If a driver lacks a smart card or is carrying an insufficient balance, then the ERP system will take a picture of the vehicle. The image will be sent to the control center, which will retrieve the vehicle registration number using optical character recognition (OCR) technology. Drivers 27 Location Date Adopted Coverage Area Status Singapore 1975 Central business district, 66 gantries Operational Hong Kong 1983 Toll tunnels linking Hong Kong and Kowloon Pensinsula Demonstration project cancelled in 1985 Bergen, Norway 1986 Urban ring road, eight toll stations Operational Oslo 1990 Urban ring road, 19 toll stations Operational Trondheim, Norway 1991 Urban ring road, 22 toll stations Operational Kristiansand, Norway 1 992 Partial ring road, five toll stations Operational Rome 1998 6 km 2 area Operational Stavanger, Norway 2001 Urban ring road, 21 stations Operational Durham , U.K. 2002 Single streets Operational Na ms os, Norway 2003 Urban toll road, three toll stations Operational London 2003 Central business district, expanded in 2007 Operational Tønsberg, Norway 2004 Urban ring road, six toll stations Operational Stockholm 2005 Two zones Pilot project adopted Valetta, Malta 2007 Urban cordon Operational Milan 2008 Urban 8.2 km 2 cordon area, 43 gates Operational Edinburgh, U.K. N/A Two cordons, Edinburgh Bypass and Central Business District Referendum rejected Manchester, U.K. N/A Two cordons Referendum rejected New York, NY N/A N/A Considered, but not adopted San Francisco, CA N/A N/A Considered, but not adopted Auckland, New Zealand N/A N/A Under study Source: Jacobs Engineering Group (2010) and Bain and Plantagie (2003) Table 7. Summary of operational and proposed congestion pricing systems.
without a valid smart card are assessed an administrative charge to cover processing costs (Menon, Gobinath, and Kian-Kong, 2004). Additionally, penalties are assessed for nonpayment in excess of 28 days and violators are required to appear in court. Impact of the Singapore System on Traffic The initial decrease in traffic was 44%, which was largely due to a reduction in through trips. During the 1980s, traffic levels within the congestion zone steadily increased as a result of increases in population, economic activity, and vehicle owner- ship. Because fees are assessed each time a vehicle enters the congestion zone, the ERP system had the immediate impact of reducing the number of multiple trips. To better manage con- gestion, the congestion charge increases or decreases in accor- dance with traffic levels, as described below. To maintain traffic flow, the Singapore Land Transport Authority, which oversees the congestion pricing system as well as the public transit, has instituted an 85th Percentile Speed Measurement Mechanism, in which congestion charges vary to meet an 85th percentile benchmark. The average speed for roads located within the CBD is targeted at 20 km/hour to 30 km/hour. For expressways, the average speed is targeted to be from 45 km/hour to 65 km/hour. When the average speeds exceed the upper threshold, the congestion charge is decreased to optimize road capacity for that facility. To discourage road use during heavy travel periods, congestion prices increase when average speed falls below the lower threshold. Although financial data on the ERP system are not available, the Singapore Land Transport Authority has compiled sta- tistical information that indirectly measures the effectiveness of this approach. From 2004 to 2008, the ERP system added 21 gantries, which has increased enforcement and helped to maintain traffic speeds on local highways and arterials despite the estimated 4% increase in the number of vehicles per annum. Additionally, the average daily traffic entering into the city has increased at a roughly 2.5% compound annual growth rate (CAGR) per annum. Depending on vehicle classification, the average vehicle-kilometers traveled (VKT) per vehicle have either decreased or remained relatively constant during this period. Table 8 summarizes traffic data within Singapore from 2004 to 2008. A unique aspect of this cordon pricing system is that Singa- pore has three separate international ports of entry, including one ferry terminal and two land connections. Foreign vehicle owners can purchase temporary transponders and smart cards. Because some foreign visitors need to enter into Singapore on a regular basis, a number of vehicle owners have found it to be more cost effective to purchase a permanent in-vehicle transponder. 2.4.2 London Overview of the London System As a means of reducing traffic congestion within the London CBD and to raise revenues, the City of London instituted a fee for private automobiles in 2003. Cordon charges are imposed weekdays from 7 a.m. to 6 p.m., but are not based on distance traveled or location. In the first year that the congestion charge was implemented, the average daily traffic decreased from 378,000 to 324,000, or 14% (Transport for London, 2007). In 2005, the daily congestion charge was increased from £5/vehicle to £8/vehicle (as of December 22, 2009, $1 = £0.625977). In 2007, the congestion zone was expanded to include parts of inner west London, including Westminster, Kensington, and Chelsea (see Figure 9). This expansion has nearly doubled the size of the congestion zone. Although the western zone experi- ences high levels of congestion throughout the day, it is rela- tively residential, with two-thirds of the traffic (in terms of VKT) of the original congestion zone. Operations and Enforcement of the London System To enforce the congestion pricing systems, Transport for London (TfL), which operates the payment system within the congestion zone, has installed video cameras at entrances, exits, and within the congestion zone to read vehicle license plates. 28 Year Total Vehicles Owned ERP Gantries Average Speed (km) ADT(*) Entering City Average Annual VKT per Vehicle 2004 2005 2006 2007 2008 CAGR 727,395 754,992 799,373 851,336 894,682 4.2% 45 48 48 58 66 8.0% Highway Arterial 62.7 63.0 61.6 62.4 63.3 0.2% 26.1 27.2 27.1 26.9 26.7 0.5% 246,000 244,000 270,400 278,300 278,100 2.5% Autos Motor- cycles Private and School Buses Light and Heavy Trucks 20,298 20,603 21,100 20,800 19,700 -0.6% 13,744 13,711 13,700 13,800 13,300 -0.7% 34,266 34,008 34,850 35,250 34,950 0.4% 45,237 46,905 47,300 48,500 46,350 0.5% (*) ADT denotes average daily traffic Source: Land Transport Authority of Singapore, 2009 Table 8. Singapore traffic statistics, 2004â2008.
There are currently over 300 camera sites that monitor every lane of traffic at all entry and exit points to and from the charging zone. License plate images are checked against a database to determine whether the vehicle owner has already paid the charge, is exempt from payment, and/or is eligible to receive a discount. Once the vehicle registration number (VRN) has been matched, then the photographic images of the vehicle are automatically removed from the database. The images captured by the cameras form the evidential record (ER), which is used to confirm possible violations. The ER is a compilation of images that provides evidence that a vehicle was in the zone during the congestion charging period. A black and white camera takes a close-up image of the vehicle license plate, while a color camera takes a wider image of the vehicle. All of TfLâs cameras have an integrated automatic number plate recognition (ANPR) computer system. The ER is encrypted and transmitted to the data center over a dedicated and secure broadband link. The main elements of London congestion pric- ing are ⢠Weekends, public holidays, and the period between Decem- ber 25th and January 1st are free. ⢠There are signs on or at the side of the road, but no barri- ers or tollbooths. ⢠Residents who live within the congestion zone receive a 90% discount for one vehicle, providing that owners regis- ter their vehicles with TfL. Additional vehicles must pay the full congestion charge. 29 Source: Transport for London Figure 9. London congestion charge zone.
⢠âBlue badgeâ holders (e.g., disabled persons) are eligible to receive a 100% discount. ⢠TfL has also initiated a congestion charging fleet auto pay, which provides a £1/vehicle discount for vehicle fleets of more than 10 vehicles. ⢠Payments can be made at selected retail outlets, payment machines located in the zone, online, and by cellular text messaging. ⢠Vehicle owners can purchase weekly, monthly, and annual passes. ⢠Nonpayment days result in a £120 fine, which is reduced to £60 if paid within two weeks. ⢠A free passage route runs through the congestion zone (Transport for London, 2007). The congestion zone is bordered by a high-capacity route, which allows drivers to make through-trips with ultimate origins and destinations outside the zone without paying the charge. Additionally, the Inner Ring Road, which runs through the expanded congestion zone, remains free of charge to users and essentially serves as a free northâsouth route through the congestion zone. The elevated section of the A-40 Westway that runs eastâwest through the western extension zone is also free to users. However, it is not possi- ble to enter into or exit from the A-40 within the congestion zone. Figure 9 summarizes the boundaries of the London congestion zone. Impact of the London System on Traffic TfL reported that the initial benefits (e.g., reduced traffic, emissions) of the congestion pricing scheme initially exceeded expectations. However, these benefits have since eroded due to interventions and incidents that have removed capacity from the central London road network. TfL, which also operates the London Underground, buses, and the Dockland Rail Line, has found that there has been a significant shift toward the use of public and non-motorized transit. Since 2003, there has been a 45% increase in bus ridership and a 43% increase in cycling within the zone (Transport for London, 2007). Additionally, the economic impact of the congestion pricing system within the zone is considered to be neutral. Table 9 summarizes the impact of the congestion zone in the first 5 years of operations. Financial Performance of the London System Initial projections were that the congestion charge system would generate £160 million annually in revenue but would have annual operating costs of approximately £64 million. The cost/revenue ratio would be roughly 40%. In a review of TfLâs financial statements, both actual revenues and expen- ditures have exceeded initial projections. From FY 2004 to FY 2007, operational revenues averaged £228 million per year, while annual operational expenditures averaged £126 million. During this period, operational costs/revenues and gross margin averaged 55% and 45%, respectively. Gross margin is defined as revenues minus the cost of goods sold divided by revenues. These results exceeded initial projec- tions. Moreover, the addition of non-operating costs, which are defined as financial assistance to other entities, depreci- ation, and administration and capital costs relating to the western extension improvements, averaged £16 million per annum, adding to the overall cost structure for this system. Consequently, operating margin has averaged 37.1% from FY 2004 to FY 2007. Operating margin is defined as earnings before taxes and interest divided by revenues. Table 10 sum- marizes the financial performance of the London congestion pricing system during this period. 30 Impact 2003 (Year 1) 2005 (Year 3) 2007 (Year 5) Traffic and congestion Traffic adjusted rapidly to the introduction of the congestion charge with few traffic proble ms . TfL found that there was an increase in traffic on the Inner Ring Road. VKT decreased by 15%. Average daily traffic in the congestion zone during charging hours decreased by 14%. 8% decrease in congestion in the original zone com pared to 2002 levels. VKT on the Inner Ring Road again fell slightly during 2005, returning to pre-congestion charge levels. 3% decrease in total vehicles and VKT from 2006 to 2007. Wi th the introduction of the expanded zone, traffic entering into the original zone increased by 5%. Traffic within the western expansion zone decreased by 10% co mp ared to 2006. Traffic on the boundary route along the western extension increased by 4% com pared to 2006. Congestion has returned to 2002 levels in the original zone. Total vehicles * 324,000 316,000 405,000 *Total vehicles in 2007 include both the original and expanded congestion zone. Source: Transport for London. Table 9. Impact of the London congestion zone, 2003â2007.
2.4.3 Oslo Overview of the Oslo System Despite a total population of 4.9 million and a relatively low population density, Norway has a long history of using tolls to finance the development and construction of road infrastructure. In 2005, tolls accounted for roughly 35% of funding within the annual road construction budget. Toll road projects in Norway are generally based on local initia- tives, requiring local political agreement and approval by the national parliament. Among the major cities, Oslo, Trond- heim, and Bergen have established urban toll systems, which include cordon pricing schemes. Additionally, cordon sys- tems have also been established in smaller cities such as Stavanger, Kristiansand, Tønsberg, and Namsos. The latter community has a population of only 12,000 inhabitants. The Norwegian Public Roads Administration is responsible for planning, building, and operating toll road projects as well as for planning and building the toll-collection systems. Once approved, toll roads are managed and operated by a dedi- cated toll road company owned by the local governments where the toll road is located. Oslo and its surrounding suburbs, with a total population of 1.1 million, have nearly 23% of Norwayâs population. To man- age congestion, a cordon pricing system was adopted in 1990, with 19 toll stations composing the Oslo toll ring, which demarcates the toll cordon around Oslo. The Oslo toll ring is managed and operated by Fjellinjen AS, which is owned by the Oslo City Council (60%) and the Akershus County Council (40%) (Waersted, 2005). Each car that enters into the Oslo central district passes through a toll station and pays a fixed toll amount regardless of distance traveled. Vehicles can exit the Oslo central district without paying a toll. Within the toll cor- don, seven out of the 19 toll stations have five or more lanes. Pre- viously, the toll stations had electronic payment lanes, lanes with coin machines, and manually operated lanes with toll atten- dants. In 2008, Fjellinjen AS replaced the tollbooths with an all-electronic toll-collection (AETC) system and completed the installation of new toll stations on the Bærum toll ring along Osloâs western edge. Figure 10 shows the location of the Oslo Toll Ring stations (red) and the Bærum toll stations (black). Operations and Enforcement of the Oslo System When the cordon system was originally adopted, the intent was to remove the tolls after 15 years. Because financial resources are still necessary to develop additional transporta- tion infrastructure in the area, the planned date for removing tolls has been extended twice. Tolls are currently scheduled to be removed in 2027. (Although scheduled to have been removed in 2001, tolls in Bergen were also extended for an addi- tional 15 years.) Excess income is used to finance the develop- ment of transportation infrastructure, with approximately 20% earmarked for public transit (Firth, 2002). An increase in toll rates was approved in July 2008. Without a valid AutoPASS subscription account, automobiles pay NOK 25 (Norwegian 31 Table 10. Financial performance of the London congestion zone (£ million), FY 2003/04â2006/07. Fiscal Year 03/04 04/05 05/06 06/07 Average Operational Activities Operating revenue 186.7 218.1 254.1 252.4 227.8 Operating expenditures: toll facilities and traffic mg mt 122.9 121.4 130.3 130.4 126.3 Gross incom e 63.8 96.7 123.8 122.0 101.6 Non-Operating Expenditure s Financial assistance â â â 2.5 Depreciation 1.1 1.6 2.8 4.8 Adm inistration & services â â 9.8 13.4 Western extension zone â â 3.8 12.2 Deferred charges 17.2 1.7 â â Capital financing charges 0.2 0.4 â â Subtotal non-operating expenditures 18.5 0.3 16.4 30.4 16.4 Net inco me 45.3 96.4 107.4 89.1 84.6 Benchmarks Operating costs/revenues 65.8% 55.7% 51.3% 51.7% 55.4% Gross ma rgin 34.2% 44.3% 48.7% 48.3% 44.6% Operating ma rgin 24.3% 44.2% 42.3% 35.3% 37.1% Source: Transport for London
Kroner) at the Oslo Toll ring and NOK 12.50 at the Bærum cordon. Trucks pay NOK 75 and NOK 37.50 at the Oslo and Bærum crossing, respectively (as of December 22, 2009, $1 U.S. = NOK 5.87511). With a valid AutoPASS subscription, drivers can obtain a 20% discount. Tolls assessed at the Bærum cordon are in addition to the cordon charge assessed for cross- ing into Oslo, decreased by the applicable discount for having a subscription account. Invalid accounts are assessed a sur- charge, which increases by 50% if payment is not received after three weeks of notification. AutoPASS transponders are inter- operable with similar toll and ferry payment systems in Den- mark and Sweden, allowing for a single invoice to users. Toll payment is based on a subscription system in which users have the option to prepay for an unlimited number of trips within a defined time period or a certain number of trips ranging from 25 to 350. The Oslo toll ring has no-stop lanes that allow for free-flow conditions. Payment and enforcement are generally similar to the approach used on other toll facil- ities with ETC systems. Toll transponders are attached behind the rearview mirror inside the windshield. As the vehicle passes through the payment lane, the station computer confirms whether the tag number corresponds to a valid subscription account. Once the account check has been completed, the driver will receive a plus signal at the end of the payment lane, signifying a valid account. A green plus signal will be displayed if the account has a sufficient balance, while a white plus sig- nal will be shown if the account has a low balance. An insuffi- cient account balance will result in no signal, requiring account replenishment. Figure 11 illustrates the signals that are used in the Oslo toll cordon system. As a result of recently completed improvements, toll stations now have three toll gantries located at each crossing point. The first gantry has a camera and an infrared flash, which takes an image of the rear license plate. The second gantry is fitted with a scanner that reads the AutoPASS number and measures the size of the vehicle and determines its position on the road- way. Finally, the third gantry has a double set of cameras and infrared flashes that capture an image of the front license plate. The toll gantries are also fitted with equipment that is used to take images of vehicles attempting to swerve into opposite traf- fic lanes to avoid detection. Historically, poor weather and light conditions have resulted in a 30% failure rate of video images (Waersted, 2005). As a basis of comparison, some vendor con- tracts require video image success rates of over 98%. With the installation of new equipment, the number of unread license plates is expected to decrease significantly. Impact of the Oslo System on Traffic While the tolling system has relieved bottlenecks in certain locations, the overall impact on traffic has been relatively small. After an initial 5% decrease, traffic returned to pre-cordon pricing levels within a few months, increasing steadily there- after. Independent estimates have found that toll rates should be 3 to 5 times higher to have a measurable effect on the vehic- ular traffic levels. At the end of fiscal year 2008, Fjellinjen AS had approximately 570,000 valid subscriptions, and an esti- mated 260,000 vehicles pass through its toll stations every day. The ETC lanes have a throughput capacity of 1,600 vehicles per hour, while lanes with coin machines have an estimated throughput capacity of 200 to 400 vehicles per hour. Financial Performance of the Oslo System In the year after the ETC improvements were completed at the toll stations, subscription account revenues increased by 23% and total revenues increased by 29%. Revenues from video invoicing increased from zero to NOK 385 million in FY 2008. Because Fjellinjen AS is phasing out the manual operation of its toll lanes, revenues from manual toll collection decreased by 93%. From FY 2003 to FY 2008, the total cost of operating the cordon toll system in Oslo accounted for 10% to 11% of revenues. In addition to staffing costs, additional costs that 32 Source: Fjellinjen AS Figure 10. Map of Oslo toll ring and Bærum toll stations. Source: Fjellinjen AS Valid Account Low Balance Invalid Account Figure 11. Oslo and Bærum toll station signals.
were incurred in FY 2008 were (1) losses on accounts receiv- able and provision for bad debts, (2) invoice forms and postage, (3) maintenance and operation of IT systems connected with toll collection, (4) removal of old tollbooths, (5) tollbooth oper- ations, and (6) other operational activities. Losses on accounts receivable represented the single largest operating cost item, representing 17% of total operating costs. Additionally, losses on accounts receivable were equivalent to 2% of revenues in FY 2008. Gross margin has averaged about 89.4% from FY 2003 to FY 2008. Fjellinjenâs operating margin during this period has averaged 59.4% during this period, ranging from 32% in FY 2006 to 72% in FY 2003. Lower operating margins are a result of the depreciation costs associated with the acquisition of toll- collection rights from the national Public Road Administra- tion, particularly the âOslo Package 3.â Moreover, there were additional depreciation costs associated with the implementa- tion of the ETC system, video imaging equipment, and the installation of new tollbooths. Fjellinjenâs financial results from FY 2003 to FY 2008 are summarized in Table 11. 2.4.4 Stockholm Overview of the Stockholm System In June 2003, the Stockholm City Council adopted a pro- posal to carry out a pilot program for cordon charging. During the following year, the Swedish parliament enacted the Con- gestion Charging Act, which authorized a cordon charge pilot program; the program ran from January 2006 to July 2006. The Stockholm cordon charge system had the following objectives: (1) reduce the number of vehicles passing into and out of the congestion zone during peak periods by 10% to 15%, (2) improve traffic flow along the busiest streets, (3) reduce vehicle emissions, and (4) improve the urban environment (TRANSEK AB, 2006). The pilot program was developed and administered by the City of Stockholm, the Swedish Road Administration, and Stockholm Transport. Following the implementation of the pilot program, the winning parties in the 2006 general election in Sweden announced that the Stock- holm congestion tax would be made permanent. Parliament approved the congestion tax in June 2007, and the congestion tax came into effect on August 1, 2007. Operations of the Stockholm System The development of the congestion charge system in Stockholm was modeled from the Oslo system. Oslo has population and demographic characteristics similar to those of Stockholm. The initial capital costs to operate the pilot program were estimated to be 1.82 billion Swedish Krona (SEK), or roughly $266 million ($1 U.S. = 6.842 SEK as of December 31, 2006) (TRANSEK AB, 2006). Capital costs 33 Fiscal Year 2003 2004 2005 2006 2007 2008 Average Operating revenues Subscription revenues Video invoicing â â â â â Manual payment Surcharges Remuneration to issuer â â â â Subtotal Operating costs Payroll Toll operating costs Subtotal operating costs Non-operating costs Depreciation Write-down of intangible assets â â â â â Subtotal non-operating costs Net income Financing activities Interest received Interest paid Income before contributions to roads projects Benchmarks Operating costs/revenues Gross margin Operating margin 746.6 316.3 19.7 1,082.6 12.2 96.9 109.1 200.7 200.7 772.8 11.7 60.8 723.7 10.1% 89.9% 71.4% 800.8 370.3 21.6 1,192.7 12.0 107.6 119.6 250.7 250.7 822.4 6.8 27.8 801.4 10.0% 90.0% 69.0% 849.8 346.3 23.7 1,219.8 14.1 111.2 125.3 300.6 300.6 793.8 11.1 12.9 792.0 10.3% 89.7% 65.1% 876.2 332.7 39.4 1,248.3 15.3 118.3 133.6 400.5 400.5 714.2 9.8 9.0 715.0 10.7% 89.3% 57.2% 910.9 330.0 39.6 4.3 1,284.7 17.4 126.7 144.1 730.1 730.1 410.6 7.2 3.0 414.8 11.2% 88.8% 32.0% 1176.2 385.2 23.1 50.1 5.8 1,640.4 19.9 164.5 184.4 414.6 0.6 415.2 1040.8 5.9 0.4 1046.4 11.2% 88.8% 63.5% 1,278.1 136.0 759.1 748.9 10.6% 89.4% 59.4% Source: Fjellinjen AS Table 11. Financial performance of Fjellinjen AS, 2003â2008 (NOK million).
include system development, equipment installation, staff education and training, testing, and public outreach activi- ties. Initial capital expenditures also included the (planned) decommissioning of the congestion charge system, which could be deferred or decreased if the pilot program were to be extended. Initial charges were set at SEK 10 to 15 ($1.25 to $2.50) per crossing. Payments could be made at kiosks and at conven- ience stores through 2008. During the pilot program, a monthly or annual subscription account service was not established. As a result, it was found that payment processing costs were relatively high due to the need to process individ- ual transactions. The pilot program encountered difficulties in recognizing exempted vehicles traveling to/from the Lindingö area of Stockholm, which were not required to pay the charge if they completed passage through the cordon area within 30 minutes. Impact of the Stockholm System on Traffic To evaluate the impacts of the pilot program, Stockholm commissioned a costâbenefit analysis that examined the impact on congestion, public transit usage, and vehicle emissions (TRANSEK AB, 2006). The following were some of the key findings from this 2006 study: ⢠VKT declined by 2.8%; ⢠Fuel tax revenues decreased by SEK 53 million ($7.7 million) (fuel prices in Sweden were roughly constant during this period); ⢠Public transit ridership increased by 4.5%; ⢠Road maintenance expenses decreased by SEK 1 million ($140,000); ⢠Vehicle emissions of climate gasesâcarbon dioxide (CO2) and Volatile Organic Compounds (VOCs)âin the county of Stockholm were estimated to have declined by 2.7%; ⢠Vehicle emissions of climate gases in the central area within Stockholm were estimated to have decreased by 14%; and ⢠Due to the decline in traffic, it was estimated that the num- ber of traffic accidents decreased by 3.6%. The costâbenefit analysis also estimated that the initial capi- tal costs for the congestion pricing system could be repaid with- in approximately 4 years. This estimate also took into account the value of shorter and more reliable travel times, the reduc- tion in vehicle emissions, revenues generated from congestion charges and public transit services, safety improvements, the cost of operating the congestion price system, and the expan- sion of transit services to accommodate greater demand. A follow-up study that was conducted by the City of Stock- holm Traffic Administration in 2009 found that: ⢠Traffic in 2008 in the cordon area decreased by 18%, as compared to 2005 levels; ⢠The number of registered alternative-fuel vehicles, which are exempt from congestion tolls, increased from 5% of the total vehicle fleet in 2006 to 14% in 2008; and ⢠To avoid driving in the inner city, traffic on ring (orbital) roads increased between 5% and 10% in 2008 compared to 2005 (City of Stockholm Traffic Administration, 2009). Financial Performance of the Stockholm System During the pilot program, it was estimated that the conges- tion charge system would generate roughly SEK 763 million ($111.5 million), with estimated operational costs of approx- imately SEK 220 million ($32.2 million). As a result, costs would account for about 29% of revenues. The operating margin for the congestion charge system was estimated to be approximately 65%. During 2007 and 2008, actual revenues generated from the charge system were SEK 230 million ($31.6 million) and SEK 559 million ($71.3 million), respec- tively. However, no operational cost information was available during this period. Table 12 summarizes the estimated finan- cial performance of Stockholmâs congestion charge system during the pilot program. 34 Operating revenues Operating costs* Operating income Depreciation Net income Operating costs/revenues Gross margin Operating margin *Annual operating costs were estimated by the Swedish Road Administration based on a similar system in Norway Source: City of Stockholm, TRANSEK AB (2006) Fiscal Year 2006 763.0 220.0 543.0 50.0 493.0 28.8% 71.2% 64.6% Table 12. Estimated financial performance of the Stockholm congestion price system, 2006 pilot program (SEK million).
2.4.5 Milan Overview of the Milan System The Ecopass program in Milan was designed primarily to reduce vehicular emissions and congestion within the urban center of Milan (Bloomberg.com, 2009). The congestion charges are assessed within an 8.2 km2 area that is known as the restricted zone (zone a traffic limitato, or ZTL). In January 2008 the Ecopass system was implemented as a 1-year trial pro- gram, which is a similar period to other congestion programs. The program was subsequently extended and remains in force. The Ecopass area is demarcated by 43 toll stations with a num- ber of major landmarks included within the restricted zone (Figure 12). Ecopass fees were temporarily suspended for 3 weeks during August 2008 because traffic levels typically decrease by roughly 30% in that month. Operations and Enforcement of the Milan System The cordon charge is assessed on weekdays from 7:30 a.m. to 7:30 p.m., and the amount charged depends on the vehicleâs engine emissions levels. Free access is granted to alternative fuel vehicles and for conventional automobiles that meet the high- est levels of European emissions standards. In particular, liquefied petroleum gas (LPG), compressed natural gas (CNG), hybrid, and electric vehicles (EVs) are exempted from paying a congestion charge within the restricted zone. Newer and lower polluting gasoline-powered automobiles pay 62, older gasoline-powered automobiles and lower polluting diesel powered vehicles pay 65, and older and heavy diesel powered vehicles pay 610. Residents living within the restricted zone are exempted only if they own or drive higher emissions stan- dard vehicles. Vehicle owners with non-exempted vehicles can receive a discount if an annual pass is purchased. The cost of an annual pass ranges from 650 to 6250 depending on the emission classification of the vehicle. Daily and multiple- day passes are also available. Trucks longer than 7 meters are restricted from entering into the restricted zone from 7:30 a.m. to 9:00 p.m. However, trucks can make deliveries within the restricted zone during the non-congestion charge period. Enforcement is carried out through digital cameras located at the 43 electronic gates. Violators are required to pay fines that vary from 670 to 6275, depending on vehicle emissions classification. The Ecopass fee can be paid before entering the congestion charge zone or up to midnight the next day. Pay- ment of the fee can be made via the Internet, by telephone, in designated banks, or via debit cards and credit cards. However, users have complained that the Ecopassâ Internet interface for making payments has broken down on several occasions. Additionally, there have been some delays in implementing the court process for violations and appeals. Impact of the Milan System on Traffic After completing the first year of the pilot program, the City of Milan evaluated the impact of the Ecopass system with respect to congestion, public transit usage, and vehicular emis- sions (Comune di Milano, 2009a). For most indicators, the Ecopass program was compared with the 2007 average. How- ever, traffic levels within the restricted zone were compared with actual traffic within the Ecopass area during 10 business days from October 22, 2007, to November 16, 2007. The City of Milan found the following impacts: ⢠Traffic levels in the Ecopass area, â14.4%; ⢠Traffic levels outside the Ecopass area, â3.4%; ⢠Public transit ridership, +5.7%; ⢠Congestion (as measured by traffic flow/capacity), â4.7%; ⢠Congestion (as measured in VKT), â25.1%; ⢠Average traffic speeds in the Ecopass zone, +6.7%; ⢠Particulate matter in the Ecopass zone, â14%; ⢠Nitrous oxide emissions in the Ecopass zone, â11%; ⢠CO2 emissions in the Ecopass zone, â9%; ⢠Travel time savings of 759,000 hours; and ⢠Economic impact valued at 69.3 million ($13.1 million) ($1U.S. = 61.4095 as of December 31, 2008). A related impact of the Ecopass program was that it created an incentive for residents to purchase newer automobiles, which would be exempted altogether from paying the Ecopass charge or would be charged at lower rates. The number of 35 Source: Ecopass Figure 12. Milan Ecopass area.
exempted vehicles as a percentage of total vehicles increased from 58% in January 2008 to 80% by December 2008. In all, there were an additional 677,000 new vehicles located within the Ecopass zone that complied with Class 1 or Class 2 Euro- pean emissions standards. Financial Performance of the Milan System In its first year of operation, it was found that the Ecopass system generated roughly 612.1 million, with operational costs of approximately 66.5 million. Based on these data, costs accounted for about 54% of revenues generated, exceeding the 34% average that was found for U.S. and Canadian tolling sys- tems. Table 13 summarizes the financial performance of Eco- pass during 2008 (Comune di Milano, 2009a). Capital costs and depreciation costs were not available. 2.5 Parking Pricing Systems As an alternative to tolling, parking pricing (or parking man- agement) systems are growing increasingly attractive to manage congestion and generate revenues. Parking management sys- tems can take on many different forms, but the guiding princi- ple behind all parking management systems is the idea that there is no such thing as free parking (Naparstek, 2007). The cost of parking has several components. The first and most obvious is the cost to the driver in cases where a fee is charged. For a metered space, drivers realize that they must pay a certain fee for set increments of time. Similarly, drivers understand that they must often pay a fee to park in a staffed parking garage or lot. However, to the driver, curbside spaces without meters or permit requirements are often perceived as free and are therefore more desirable. There are many hidden costs associ- ated with these free parking spaces, including: ⢠Congestion: Vehicles circle in search of free parking spaces, spending excess time on the road, affecting through traffic and leading to increased congestion. ⢠Environmental impacts: As congestion increases and vehi- cles spend more time on the roads, the amount of vehicle emissions also increases. ⢠Financial burden on the owner or operator (such as the municipality): The owner or operator must come up with funds to maintain parking areas (e.g., paving, snow removal, regulation enforcement). ⢠By charging an explicit fee for parking spaces through meters or permits, revenues are generated, which can help to offset capital and operating costs. Moreover, these sys- tems can help to manage parking demand and availability to improve the parking experience for all, including provid- ing increased convenience and easier location of parking for drivers, decreased congestion on the roadways, and increased turnover for area businesses. A limited number of parking pricing systems have been implemented. A city-run parking system in Westminster has evolved into an efficient and technologically advanced exam- ple of a parking pricing system. In Chicago, city officials recently leased the cityâs metered parking spaces to private investors for a term of 75 years to attract capital to upgrade the existing parking system. In San Francisco, local agencies are working to build a system using real-time parking data to man- age congested streets and relieve a parking shortage. The next sections will focus on these three parking systems in various phases of implementation. The design of each system will be discussed along with technology employed, impacts on the city, and costs of the systems. 2.5.1 Westminster City Councilâs Parking Program Overview of the Westminster City Parking System The City of Westminster, which is contained within Lon- don, has slowly grown its citywide parking pricing program into a larger and more efficient revenue-generation system. This program controls all public parking spaces in the city, including curbside spaces, lots, and garages. The Westminster parking pricing system is divided into eight controlled parking zones, with each zone having its own fees and restrictions. Maps of the zones as well as specific park- ing locations, fees, and restrictions, such as time restraints, are 36 Fiscal Year 2008 Operational revenues Passes sold through retailers or at booths 8.5 Passes sold online 2.1 Passes paid with debit cards 1.5 Subtotal operational revenues 12.1 Operating costs 6.5 Costs/revenues 53.9% Gross margin 46.1% Operating margin N/A Source: Ecopass Table 13. Ecopass financial performance, 2008 (6 million).
available on the Westminster website (City of Westminster, 2009). An excerpt from the ParkRight guide showing zones and hourly parking rates is shown in Figure 13. Also posted on the website are the terms of service, parking rules, instructions on how to pay for parking, and how to settle or argue any park- ing tickets. Parking in city spaces is paid for at pay boxes, by telephone, or with scratch cards, or prepaid permits. The scratch cards offer a prepaid cashless option and work somewhat like a lot- tery ticket. Scratch cards are available at various locations around the city, with costs of £2.20 and £4.40. To use these cards, drivers must scratch off the time and date that they have parked and display the scratched card on their dashboards. Since the amount of parking time the card purchases varies by zone, multiple scratch cards may be used to provide for longer parking durations. As the parking system in Westminster has evolved, the city council has been able to adjust to factors that could present significant complications to a new parking system, such as ⢠Security, ⢠Visitor parking, ⢠Disability parking, ⢠Construction and dumpster allowances, ⢠Resident parking, ⢠Event parking, and ⢠Loading and unloading zones. Operations and Enforcement of the Westminster City Parking Program Several factors set the Westminster parking system apart from other parking management systems. The first is the institutional integration of the system, which is operated and managed by a single entity, the Westminster City Coun- cil. The second is the technology that has been implemented throughout the city. Not only does the Westminster park- ing program offer many payment choices, including cash- less payment via telephone, but the city has also been outfitted with an enormous wireless network, including a vast network of closed circuit televisions (CCTVs) (Thomas, 2004). This system has had an enormous impact in improv- ing the efficiency of operations and maintenance activities as well as improving the safety of parking areas. Piloted in 2002, the city has had nearly a decade to fine-tune its park- ing system. The recent technological focus has been on improving payment methods. Improvements have been made to the pay-by-phone service, and the scratch cards were intro- duced. Additionally, new measures have been added to pro- tect the privacy of pin codes and chip readers. Westminster has also been piloting a visitorâs parking scheme as well as an âEvery Older Person Mattersâ pilot program to target incon- siderate drivers who obstruct sidewalk accessibility features. The parking system has evolved to include a car-sharing pro- gram, called the Car Club, which is being developed through a partnership with Zipcar. In addition to reducing the over- all demand for parking, this program has given local residents the ability to avoid congestion tolls on small trips within the city. Although discouraging the use of private vehicles could have an adverse effect on parking revenues, the ability to maintain or increase the availability of parking spaces for those who wish to park may sometimes outweigh potential revenue losses. 37 Source: ParkRight, Your Guide to Parking in Westminster. Westminster City Council, 2009a. Figure 13. Westminster parking zones.
Impact of the Westminster City Parking System on Traffic It is difficult to point out specific effects of the parking pro- gram in Westminster because it has evolved gradually and a true âbeforeâ and âafterâ is difficult to determine for compar- ison. However, as the program has evolved, it has become more efficient in the enforcement of parking regulations and has supported improved safety conditions in the area. The addition of CCTV has greatly improved the efficiency of conducting maintenance activities and has improved safety monitoring (including assisting in drug crime arrests). Also, the new pay-by-phone cashless payment option is perceived as being more user-friendly and convenient. Most importantly, the parking pricing system has remained flexible and continues to evolve year after year to meet the cityâs needs (Westminster City Council, 2009b). Financial Performance of the Westminster City Parking System Detailed financial data from the Annual Parking Report 2009 prepared by the City of Westminster is shown in Table 14. The annual on-street parking revenue collected over the previous 5 years has ranged from £65 million to nearly £85 million, aver- aging £75.6 million during this period. On-street parking rev- enue for the 2008/09 Westminster fiscal year decreased roughly 3.5% in comparison to the previous year. This was mostly due to the decreased number of parking tickets. During this period, on-street parking system expenditures ranged from just under £40 million to slightly over £47 million. Expenditures increased roughly 3% over the previous year. From FY 2004/05 to FY 2008/09, expenditures averaged £43.7 million. Overall, nearly 58% of parking revenue for the 2008/2009 year went toward expenditures, netting roughly 42% of gross revenue (Westmin- ster City Council, 2009b). Fluctuations in the most recent yearâs revenues and expenses over previous years are largely due to the issuance of fewer penalty charge notices (PCNs) and the elimination of the clamping and removal program. 2.5.2 SFpark Smart Parking Management Program Overview of the SFpark System Through an Urban Partnership Agreement with FHWA, the San Francisco Municipal Transportation Agency (SFMTA) is the lead agency for a pilot parking program called SFpark. SFMTA is responsible for managing city-owned garages, lots, and on-street parking throughout San Francisco. Pilot testing of SFpark was performed in the Embarcadero neighborhood in May 2009. Beginning in February 2010, the pilot program was expanded to several additional neighborhoods, including Rincon Hill, Hayes Valley, the Civic Center, the Financial Dis- trict, the Mission, Fishermanâs Wharf, the Marina, and the Fill- more District. In many sections of the city, a major contributor 38 Fiscal Year 2004/05 2005/06 2006/07 2007/08 2008/09 Av erage Rev enues Enforcement: PCNs 36.0 31.1 38.2 41.9 35.4 Enforcement: clamp & removals 4.6 2.9 3.7 4.3 0.3 Paid for parking 24.4 23.3 22.6 27.3 33.0 Permits and suspensions 7.2 8.1 9.8 11.4 12.3 Misc 0.7 Subtotal 72.2 65.4 74.3 84.9 81.7 75.7 Expenditures Enforcement 29.4 29.6 30.5 34.4 32.4 Paid for parking 2.0 2.0 2.0 2.3 4.3 Permits and suspensions 1.2 1.4 1.3 1.4 1.9 Other infrastructure 1.3 1.0 0.42 1.2 1.0 Overhead 6.0 6.1 6.7 6.6 7.7 Subtotal 39.9 40.1 40.9 45.9 47.3 42.8 Operating income 32.4 25.4 33.3 38.7 34.4 32. 8 Operating Costs/ revenues 55.1% 61.1% 55.1% 54.3% 57.9% 56.7% Gross margin 44.9% 38.9% 44.9% 45.7% 42.1% 43.3% Source: Annual Parking Report 2009, Westminster City Council, 2009b Table 14. Westminster parking program financial performance, FY 2004/05 to FY 2008/09 (£ million).
to congestion is traffic caused by vehicles circling to find curb- side spaces. According to the SFMTA, the intent of the smart parking program is to provide a system that makes parking more available by adjusting the price of parking to meet demand. SFpark will also use websites, text messaging, and variable message signs to provide information about the avail- ability and price of parking spaces to make it easier for drivers to find parking. By directing drivers more quickly toward park- ing spaces that fit their respective cost points, parking demand can be redistributed more efficiently, improving traffic flow for private vehicles and city buses alike (SFpark, 2009). The Port of San Francisco had previously conducted a pilot on-street parking study in 2006, which found that location and time of day were the biggest factors in parking demand. They also found that a significant number of people only pay for half of their stay, patrons parked an average of 75 minutes, and that there are a high number of disabled placards. Enforcement was also found to be relatively low. Revenue would be expected to increase with new parking sensors and payment systems that would assist enforcement efforts. After conducting the study, the Port of San Francisco worked with SFMTA on SFpark so that parking rates between the two project areas could function under a single system (Moyer, 2008). It is estimated that there are roughly 320,000 on-street park- ing spaces in the city of San Francisco. Approximately 25,000 of these on-street spaces are metered. Around 6,000 of these metered spaces are located in the SFpark pilot areas. In addi- tion to these 6,000 metered spaces, there are roughly 12,250 parking spaces in the SFMTA-owned garages and parking lots located within the SFpark pilot areas. The goal of SFpark is to maintain one available space for every 10 on-street spaces on each block (SFpark, 2009). Operations and Enforcement of the SFpark System The project area is composed of 13 city-controlled parking garages, one city-controlled parking lot, and roughly 25% of the cityâs on-street metered parking (Loftus, 2008). A survey of all parking spaces in the project area was made, and park- ing locations were divided up into various zones. The parking regulations for each zone (and sometimes each block within zones) may differ from one to the next in terms of meter hours and time limits. Hourly rates for each zone or city block may vary as well, since the demand for parking within each zone will not be equal. Garages will follow similar protocols based on demand and availability, but will be priced lower than on- street parking rates in the same areas for hourly parking because garages tend to be used for long-term parking (SFpark, 2009). Parking demand for special events may be higher than typical daily rates but will be based on the same supply-and- demand methodology (Roth, 2009). The SFpark pilot areas are presented in Figure 14. Prices for parking spaces will be the same from one day to the next, but will vary by time of day in an effort to smooth out demand during peak periods. It is hoped that as parking spaces become more expensive, some drivers will opt to park slightly further away from their destination to obtain a cost savings and/or shift their schedule to off-peak times. Parking prices will vary by city block. In this manner, it is hoped that parking demand can be redistributed to areas with higher available capacity, thereby optimizing usage and freeing up high-demand areas. This pricing system will be re-evaluated every 4 to 6 weeks. To avoid large variations in parking rates after each review period, the maximum amount that parking prices can fluctu- ate per hour will be $0.50. On-street and SFMTA-managed lot rates will range from $0.25 to $6.00 per hour, and SFMTA- managed garage rates will range from $1.00 to $10.00 per hour. Payment for parking will be collected via multi-space meters that accept coins, credit cards, debit cards, and the SFMTA smart cards. In some areas drivers will be able to park for longer periods than current limits allow. The program will be coupled with a public outreach program to educate local residents on how the new program will work and to encourage drivers to shift to off-peak parking or transit. To efficiently direct drivers to parking locations that will suit their needs, SFpark will provide real-time information on parking availability, pricing, time limits, and payment options. This information will be imparted using SFMTAâs website, text messages, and variable message signs to direct drivers to SFMTA garages with available parking. Sensors will need to be installed that can detect the presence of a vehicle in each on-street parking space included in the park- ing program. Parking meters and sensors will be wirelessly networked to a central database to provide real-time infor- mation to motorists. Parking data will also be relayed to wireless handheld devices carried by enforcement officials, and potentially, maintenance personnel. Software will be required to coordinate and upload real-time data, analyze data, and review parking rates. Impact of the SFpark System on Traffic The ability to monitor and manage parking demand is expected to increase the availability of parking spaces, reduce congestion, and improve traffic flow. Secondary benefits may include improved safety, a reduction in fuel consumption and vehicle emissions, and value-of-time savings to motorists. Any additional revenues generated by the SFpark system can be reinvested into transportation infrastructure and parking areas operated by the agencies involved. One potential con- cern is that that smart cards and parking meters might be hacked into or vandalized in other ways to gain free parking. This impact can be mitigated by implementing greater security 39
in the controlled parking areas (Loftus, 2008). SFMTA oper- ates only a small portion of total parking spaces in city, which are primarily reserved for short-term purposes. As a result, the parking program is expected to have a limited impact on con- gestion in the city as a whole (San Francisco County Trans- portation Authority, 2009). Financial Performance of the SFpark System Prior to the implementation of the new parking program, SFMTA reported that parking revenues were $177 million during FY 2006/07. Approximately $22 million of this revenue was from a 25% tax on parking facilities, of which the city receives 40%. Additionally, administration and operations costs were about $15 million and enforcement costs were about $32 million during FY 2006/07. Debt service costs were roughly $8 million. As of 2009, the SFpark pilot program had incurred capital costs of roughly $25 million. The U.S. DOTâs Urban Partner- ship Program funded 80% of this cost. It is not yet known what impact SFpark will have on SFMTAâs parking revenues when implemented since parking fees have yet to be determined. Although parking revenues may increase due to the assessment of higher hourly rates during high-demand periods, violation revenues may decline as a result of the advanced enforcement mechanisms that have been implemented. Program revenues are expected to be reported at the end of the 18-month pilot period. Additionally, it is very difficult to estimate the capital, maintenance, and operating costs of the SFpark program at this time. New multi-space parking meters (serving roughly 10 spaces) might be purchased and installed for around $10,000 each. San Francisco Planning and Urban Research Association (SPUR) estimates that the annual cost of this pro- gram would be around $4.6 million, assuming program man- agement costs of around $3 million annually. However, this estimate does not appear to include installation or replace- ment of in-street parking space sensors, which would have a life of 5 to 10 years. SPUR also estimates that SFpark could generate nearly $40 million per year in new revenue. 40 Source: San Francisco County Transportation Authority, 2009 Figure 14. Map of SFpark pilot locations.
SFMTA has proposed that meter hours be extended into the evening in some areas and on Sundays. A preliminary estimate suggests that this could generate an additional $17.2 million in annual revenues. It is estimated that roughly $8.4 million would be spent annually on enforcement, meter maintenance, and coin collection systems. Start-up costs would include a one-time implementation cost of around $2.5 million (San Francisco Municipal Transportation Agency, 2009). 2.5.3 Chicago Parking System: Chicago Parking Meters, LLC Overview of the Chicago Parking System Beginning in February 2009, the operations and mainte- nance of roughly 36,000 metered parking spaces in Chicago were transferred to a private investment company, Chicago Parking Meters, LLC (CPM), through a concession agreement with the City of Chicago. CPM is a consortium led by Morgan Stanley Infrastructure Partners. Within this consortium, park- ing operations are handled by the concessionaire, LAZ Park- ing. The earlier concession of several Chicago parking garages was also to a division of Morgan Stanley (Dumke and Joravsky, 2009). This was the first private concession for a publicly owned U.S. parking system (Martin, 2008). Operations and Enforcement of the Chicago Parking System Per the concession agreement, approximately 36,000 metered parking spaces (34,000 on-street and 1,240 spaces in 18 metered lots) have been leased to CPM for a term of 75 years in ex- change of a one-time payment of $1.157 billion (Waguespack, Piwinski, and Sajovec, 2008). During the term of the contract, CPM is allowed to keep parking meter revenues but is respon- sible for all operating and maintenance activities as well as sys- tem upgrades. The City of Chicago will continue to determine meter rates, locations, and hours of operation. Additionally, the City of Chicago retains the right to add new or remove existing on-street parking spaces in the future as well as restrict parking for special events or for safety reasons. However, if the concessionaireâs revenues are negatively impacted by any of these decisions, the city will be responsible for the loss of revenues (Waguespack, Piwinski, and Sajovec, 2008). Chicago also remains responsible for the enforcement of parking regulations and will continue to receive all enforce- ment-related revenues. One of the key terms of the concession agreement was that CPM would upgrade all meters to accept credit cards by mid-2011, which is faster than the city would have been able to do on its own (Martin, 2008). Since the con- cession contract was executed, CPM has been replacing older meters with centrally located pay boxes that accept coins as well as credit and debit cards. These new meters are not space- specific, so there is no finite number of spaces along each curb. This change may effectively create more parking capacity, depending on parallel parking behavior and the size of vehi- cles parked. Parking rates vary by location, and rates will gradually increase over the first 5 years of the concession. While under the cityâs control, parking meters in Chicago were organized into six zones. With the change in management, these zones were consolidated into three zones. Figure 15 identifies the metered regions. Zones include the Loop, Central Business District, and Outer Chicago. As of January 4, 2010, these zones began transitioning to new rates of $4.25 per hour (Loop), $2.50 per hour (CBD), and $1.25 per hour (Outer Chicago). Future rate increases will take place in 2011, 2012, and 2013, with final rates as high as $6.50 per hour in the Loop region. Current and future parking rates are shown in Table 15. As previously noted, CPM is replacing old single-space meters with centrally located pay boxes. These pay boxes will accept multiple forms of payment, including major credit cards, debit cards, and coins (quarters and dollars only). The pay boxes are not space-specificâa customer is given a receipt that is displayed on the vehicle dashboard. Additionally, the pay boxes are solar powered and are connected to a wireless network. Through this network, the pay boxes are able to communicate with a central server and alert personnel when maintenance is needed. Furthermore, information regarding meter malfunctions is shared with the City of Chicago, allow- ing for the automatic dismissal of some parking tickets. The CPM website provides links explaining how to use the park- ing meters and an interactive map to help find parking locations. There is also an around-the-clock customer service hotline available for reporting issues regarding the meters. In conjunction with the automatic alerts provided directly from the meters to the central server, repairs are often completed within a matter of hours. Improvements that have been made since the system opened include the addition of portable time, in which parking receipts are transferrable to other spaces with the same or lower hourly rate until the receipt expires. This allows for greater convenience to users as well as making prepayment less daunting since the remaining time can be used elsewhere. Rather than only offer- ing parking with 2-hour limits, many of the new meters offer payment options for varying time periods. Pay boxes also offer prepayment options. Other new programs provided by CPM include monthly discounts and the retrofitting of parking meters to provide protected parking for bicycles. Impact of the Chicago Parking System on Traffic Immediate impacts of the change in control of the Chicago parking meter system were two-fold. The $1.157 billion 41
payment to the city significantly freed up cash flow for the city. However, the transition to private operations has been some- what turbulent due to several operational and political chal- lenges, including broken meters, inadequate signage, poor public outreach, and a large number of parking tickets being issued. These problems, combined with a surge in the number of vandalism incidents, resulted in negative media coverage with respect to the transfer to private operations. For more than two-thirds of the cityâs meters, the hourly rate at the time of the concession had been fixed at $0.25 for over 20 years. By early 2010, parking rates increased to $1.25 per hour, representing a 400% rate increase. Although the rate increases were approved by the city and are on par with other cities, the change has been viewed negatively. However, a potential benefit to users is that the rate increase may increase the supply of available parking spots. To date, a lawsuit has 42 Source: CPM website, 2009 Figure 15. Map of Chicago parking zones.
been filed regarding the legality of the concession, including one alleging that the agreement violates the state constitution by using public funds to enforce regulations on a private sys- tem. The lawsuit also suggests that it is illegal for the city to lease out assets for a period of time that is long enough to deprive future councils of control over the parking system. One less obvious impact of the new system has been that inclement weather has presented some issues with the new pay boxes. Credit card swipe slots have been known to fill with snow or ice, requiring clearing for the swipe to function prop- erly. Additionally, some of the buttons and the credit card readers have been known to freeze over in extreme cold. In an effort to prevent snow and moisture from getting into the credit card reader, CPM has installed new covers on some pay boxes. Snow or ice accumulation can obstruct parking receipts from being displayed on dashboards. As a result, enforcement personnel have been instructed to refrain from issuing citations when they are not able to determine whether a receipt has been purchased. Financial Performance of the Chicago Parking System Records show that the 36,000 metered parking spaces gen- erated roughly $19 million in 2007. Although the city had added roughly 5,000 meters in the previous 5 years, many meters are outdated (Mihalopoulos and Dardick, 2009). It was estimated that technical upgrades to the system would cost around $30 million. With the transfer to private opera- tions and the increase in rates, independent estimates have concluded that the parking system may generate more than $1.1 million per week. According to an article in The New York Times, based on draft 2010 pro-forma numbers, CPM projects total revenues of more than $75 million and a net income of about $58 million in 2010 (Mihalopoulos, 2009). For the first 10 and a half months of operation under the concessionaire, it was projected that CPMâs net income would be slightly over $32 million. However, it is unclear whether capital or costs were included in this calculation. (Chicago CFO Gene Saffold stated that replacement costs, such as $40â$50 million, would be required roughly every 7 years for replacement pay boxes.) Other Issues The Inspector General Office (IGO) of Chicago has gener- ally been critical of this transaction. Specifically, the IGO pre- pared a report in June 2009 (City of Chicago IGO, 2009) that cited lack of information in the cityâs due diligence review, insufficient consideration of other alternatives (such as raising parking rates), and contract length as issues of concern. Addi- tionally, the IGO estimated that the City of Chicago was paid an estimated $997 billion less than what would have been col- lected had the parking-meter system been retained by the city. 43 Source: Waguespack, Piwinski, and Sajovec, 2008 Parking Meter Rates per Hour Current Future Rates Old Zone New Zone Rate Spaces 2009 2010 2011 2012 2013 6 Outer Chicago $ 0.25 23,877 $1.00 $1.25 $1.50 $1.75 $2.00 5 Outer Chicago $ 0.50 6,280 $1.00 $1.25 $1.50 $1.75 $2.00 4 Outer Chicago $ 0.75 588 $1.00 $1.25 $1.50 $1.75 $2.00 3 CBD $ 1.00 3,992 $2.00 $2.50 $3.00 $3.50 $4.00 2 CBD $ 1.50 12 $2.00 $2.50 $3.00 $3.50 $4.00 1 Loop $ 3.00 895 $3.50 $4.25 $5.00 $5.75 $6.50 Table 15. Parking meter rates by zone (prior to the concession agreement with CPM).
