
This chapter focuses on the first topic of the Committee’s statement of task: assessing the size of the groundwater contamination problem caused by residual subsurface contaminants. Specifically, in this chapter the Committee strives to answer three primary questions: (1) at how many sites does residual contamination remain such that site closure is not yet possible, (2) at what percentage of these sites does residual contamination in groundwater threaten public water systems,1 and (3) what are the projected costs for reaching site closure or for long-term management? To answer these questions, the Committee gathered information on the major federal and state regulatory programs under which hazardous waste is cleaned up to determine the size and scope of these programs and relevant trends over time. The chapter also includes a discussion on “closed” sites (the meaning of which varies by program), because such sites may contain residual contamination at levels exceeding those allowing for unlimited use and unrestricted exposure (UU/UE).
NUMBER OF U.S. HAZARDOUS WASTE SITES
The Committee sought the following types of information to assess the magnitude of the nation’s hazardous waste problem:
__________________
1 The Safe Drinking Water Act defines public water systems as consisting of community water supply systems; transient, non-community water supply systems; and non-transient, non-community water supply systems—all of which can range in size from those that serve as few as 25 people to those that serve several million.
• Number of sites characterized by progress through the major phases of remediation from site discovery to site closure, as outlined in Table 1-1,
• Principal chemicals of concern, and
• Status of “closed” sites with respect to the potential presence of residual contamination.
At a national level, information was gathered from the U.S. Environmental Protection Agency (EPA) for sites that fall under the Comprehensive Environmental Response, Compensation, and Liability Act (CERCLA), Resource Conservation and Recovery Act (RCRA), or Underground Storage Tank (UST) programs using publicly available databases and via conversations with EPA program officers. Department of Defense (DoD) sites were explored with the aid of the online Annual Reports to Congress and via conversations with DoD staff. Information from the Department of Energy (DOE) and other federal agencies was collected from published literature. Another large group of sites includes those that fall under state purview, such as state Superfund, voluntary cleanup programs, Brownfields, and some dry cleaning sites. Information about such sites was gathered from a variety of sources, including state websites and databases, third-party websites, published literature, and conversations with state program managers.
The numbers in this chapter reflect the Committee’s best efforts to compile available data on the magnitude of the problem, but there is significant uncertainty associated with some of the data. First, some of the reported data reflect detailed analyses (e.g., DoD, CERCLA, RCRA) while other data are only estimates. Second, there are differences in accounting across the programs that make it difficult to assess the magnitude of the hazardous waste problem on a consistent basis. In particular, CERCLA and RCRA’s best available data are for facilities that could and often do contain many individual contaminated sites. To make matters even more confusing, the term “site” is used by the CERCLA and RCRA programs to mean an entire facility, while other programs use the term “site” to represent an individual contaminant release within a larger facility. In this report the term “site” refers to an individual area of contamination within a facility; to avoid confusion, the term “Superfund site” is not used when referring to a facility on the Superfund list. Finally, the statement of task requests information on the numbers of sites that have yet to reach “site closure”—a term that is defined differently by each of the large federal cleanup programs as well as by state agencies.
Considering these sources of uncertainty (estimates vs. real data, summing of facilities and individual sites, and the varying definitions of site closure), the overall total should be considered as a rough idea of the magnitude of the problem. Though it can be argued that there is limited
utility in tallying the numbers of sites given these sources of uncertainty, this is done at the end of the chapter to provide the reader with an order-of-magnitude estimate of the size of the country’s burden for cleanup of hazardous waste sites.
Department of Defense
The DoD environmental remediation program, measured by the number of facilities, is the largest such program in the United States, and perhaps the world. In budgetary terms, it is only exceeded by the U.S. Department of Energy’s Environmental Management Program. The Installation Restoration Program (IRP), which addresses toxic and radioactive wastes as well as building demolition and debris removal, is responsible for 3,486 installations containing over 29,000 contaminated sites at active, Base Relocation and Closure (BRAC), and Formerly Used Defense Site (FUDS) properties (see Table 2-1). The Military Munitions Response Program, which focuses on unexploded ordnance and discarded military munitions, is beyond the scope of this report and is not discussed further here, although its future expenses are greater than those anticipated for the IRP. Additionally, DoD has responsibility for sites that are not included in the IRP totals, including 67 properties (primarily private waste disposal sites) in 31 states (OUSD, 2011). In total, the DoD has 141 installations that have been listed on the
TABLE 2-1 DoD Installation Restoration Program Installations, Sites, Expenses to Date, and Cost to Completea
| IRP | Number of Installations | Number of Sites | Costs Through FY10 (1000s) | Cost to Complete (1000s) |
| Active | 1,622 | 21,528 | $19,693,452 | $7,230,071 |
| Base Realignment and Closure(BRAC) | 228 | 5,127 | $8,085,265 | $2,706,374 |
| Formerly Used Defense Site (FUDS) | 1,636 | 2,921 | $3,136,362 | $2,820,145 |
| Total | 3,486 | 29,576 | $30,915,079b | $12,756,590 |
a According to the DERP Annual Report to Congress for FY 2010, the cost to complete (CTC) is derived from site-level funding information and can be impacted by prioritization, input from regulators and other stakeholders, the complexity of the cleanup, and the technologies that are available and chosen (DoD, 2012). The cost numbers are not adjusted for inflation.
b An additional $97.9 million was spent on remediation of sites not included in the Installation Restoration Program through 2010 (OUSD, 2011, p. E9-1).
SOURCE: OUSD (2011).
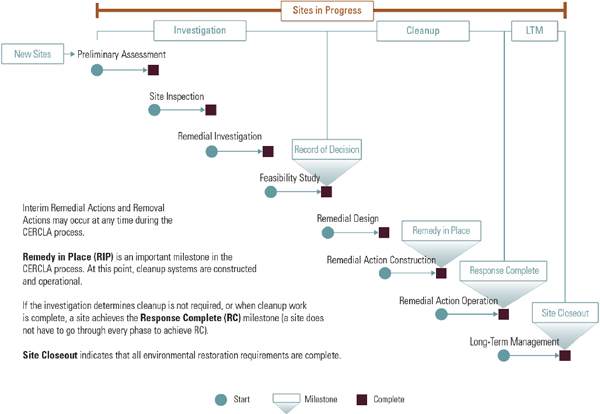
FIGURE 2-1 DoD CERCLA environmental restoration phases and milestones.
SOURCE: Adapted from OUSD (2011).
National Priorities List (NPL) because they contain at least one very contaminated site, thus qualifying the entire installation for the NPL.
The phases and milestones used by the DoD to measure progress are shown in Figure 2-1. The DoD has established a performance goal for active and BRAC installations to achieve either the remedy-in-place or the response-complete milestone by 2014.2 FUDS are supposed to achieve those milestones by 2020. As shown in Table 2-2, 79 percent of Installation Restoration Program sites have met that goal as of FY 2010. While impressive, these numbers should not be taken to imply that the remaining sites will be remediated at the same pace. This is because the bulk of the response-complete sites to date have been “low-hanging fruit,” completed with little remediation activity. Indeed, at least 62 percent of the Installation Restoration Program sites that have achieved response complete (14,302 sites) did so without reporting a remedy in place (Deborah Morefield, DoD, personal communication, January 2011). Furthermore, in July 2011 DoD established more demanding goals based upon moving sites from remedy in place to response complete (Conger, 2011), such that success has been redefined within the agency to mean that 95 percent of Installation Restoration Program sites must achieve response complete by 2021.
The Defense Department’s task is formidable because the remaining
__________________
2 2015 for Legacy BRAC sites.
site portfolio consists primarily of the largest and most complex sites, such as groundwater plumes containing difficult-to-remediate substances such as chlorinated solvents that can be present in the subsurface as dense nonaqueous phase liquids (DNAPLs). In the Committee’s experience, these account for many of the 1,933 Installation Restoration Program sites where remedies are in place but which have not achieved response complete (Table 2-2), as well as many of the sites still undergoing study. DoD counts nearly 1,400 sites in the Long-Term Management phase, when the active response is complete, but where residual contamination remains above levels allowing for UU/UE. These sites may be subject to land use restrictions, periodic reviews, monitoring, and/or maintenance. Thus, the known number of DoD Installation Restoration Program sites with residual contamination in place is 4,329 (2,931 + 1,398). (Sites with a remedy in place or which are response complete are not included in this total because it would be impossible to know whether they contain residual contamination without considering each site.)
A snapshot of the DoD’s contaminated sites is provided by a 2006 survey of occurrence data of hazardous contaminants at 440 installations for which the armed services had electronic records (Hunter, 2006). These installations accounted for about two-thirds of the total Installation Restoration Program’s sites. The researchers reported that trichloroethene (TCE) has been found in groundwater at concentrations above the preliminary remediation goal at 69 percent of those installations. Another volatile solvent, tetrachloroethene (PCE), was found above its preliminary remediation goal at 57 percent of the 440 installations. Naphthalene, a key component of jet fuel, was found above its preliminary remediation goal at 48 percent of the installations. They also reported the widespread presence of toxic metals such as lead, arsenic, and nickel at high levels, but noted that most of those concentrations were consistent with naturally occurring background concentrations.
TABLE 2-2 DoD Installation Restoration Program Sites by Select Cleanup Phases or Milestones (see Figure 2-1)
| IRP | Cleanup Planned or Under Way | Remedy in Place | Response Complete | Long-Term Management Under Way |
| Active | 2,083 | 1,530 | 17,053 | 905 |
| BRAC | 529 | 396 | 4,065 | 403 |
| FUDS | 319 | 7 | 2,110 | 50 |
| Total | 2,931 | 1,933 | 23,228 | 1,398 |
Note: Remedy in Place is a subset of Cleanup Planned or Under Way and Long-Term Management Under Way is a subset of Response Complete.
SOURCE: OUSD (2011).
CERCLA
The CERCLA program was established to address hazardous substances at abandoned or uncontrolled hazardous waste sites. Through the CERCLA program, the EPA has developed the National Priorities List (NPL), which is periodically updated to reflect facilities with the highest priority hazardous waste sites.3 The remedial actions at most nongovernmental CERCLA facilities are implemented by potentially responsible parties (PRPs) through legally enforceable administrative orders or settlement agreements, with EPA being the main agency responsible for enforcing the program. Where there are no viable nongovernmental PRPs, EPA performs the remediation pursuant to federal funds (i.e., the so-called Superfund, a term that has come to define the entire program). At governmental facilities, other federal agencies such as the DoD and DOE are responsible for cleaning up their sites in accordance with CERCLA requirements. States can also take the lead in determining remedial alternatives and contracting for the design and remediation of a site. Table 2-3 shows the phases of the CERCLA program, including the major milestones.
There are 1,723 facilities that have been on the NPL, including 59 that have been proposed by the EPA and are currently awaiting final agency action. Table 2-4 below shows a breakdown of these by status and milestone. As of June 2012, 359 of the 1,723 facilities have been “deleted” from the NPL, which means the EPA has determined that no further response is required to protect human health or the environment; 1,364 remain on the NPL. About 80 of those deleted facilities had contaminated groundwater and were evaluated more extensively by the Committee (see later section on closed sites and Appendix C). Facilities that have been deleted from the NPL are eligible for future Superfund-financed remedial action in the event of future conditions warranting the action. To provide some temporal perspective on these numbers, in 2004 there were 1,244 NPL facilities. At that time, 274 had been deleted from the NPL or referred for response to another authority.
Statistics from EPA (2004) illustrate the typical complexity of hazardous waste sites at facilities on the NPL. Volatile organic compounds (VOCs) are present at 78 percent of NPL facilities, metals at 77 percent, and semivolatile organic compounds (SVOCs) at 71 percent. All three contaminant groups are found at 52 percent of NPL facilities, and two of the groups at 76 percent of facilities (but not necessarily in the same matrix, i.e., soil, groundwater, sediment). In 1993, EPA (1993) reported that
__________________
3 See http://www.epa.gov/superfund/programs/npl_hrs/nplon.htm for a description of how facilities are placed on the NPL. Note that CERCLA refers to facilities/installations as “sites” and smaller units within those facilities as “operable units”—terminology which is not used in this report unless an EPA CERCLA source is being cited, like Tables 2-3 and 2-4.
TABLE 2-3 Definition of CERCLA Milestones
|
|
|
| PA/SI | Preliminary Assessment/Site Inspection Investigations of site conditions. If the release of hazardous substances requires immediate or short-term response actions, these are addressed under the Emergency Response program of CERCLA. |
| NPL Listing | National Priorities List (NPL) Site Listing Process A list of the most serious sites identified for possible long-term cleanup. |
| RI/FS | Remedial Investigation/Feasibility Study Determines the nature and extent of contamination. Assesses the treatability of site contamination and evaluates the potential performance and cost of treatment technologies. |
| ROD | Records of Decision Explains which cleanup alternatives will be used at a given NPL facility. When remedies exceed $25 million, they are reviewed by the National Remedy Review Board. |
| RD/RA | Remedial Design/Remedial Action Preparation and implementation of plans and specifications for applying site remedies. The bulk of the cleanup usually occurs during this phase. |
| Construction Completion | Construction Completion Identifies completion of physical cleanup construction, although this does not necessarily indicate whether final cleanup levels have been achieved. |
| Post Construction Completion | Post Construction Completion Ensures that CERCLA response actions provide for the long-term protection of human health and the environment. Included here are long-term response actions, operation and maintenance, institutional controls, five-year reviews, and remedy optimization. |
| NPL Deletion | National Priorities List Deletion Removes a site from the NPL once all response actions are complete and all cleanup goals have been achieved. |
| Reuse | Site Reuse/Redevelopment Information on how the CERCLA program is working with communities and other partners to return hazardous waste sites to safe and productive use without adversely affecting the remedy. |
|
|
|
SOURCE: Adapted from http://www.epa.gov/superfund/cleanup/index.htm.
DNAPLs, which commonly include TCE and PCE, were observed directly in the subsurface at 44 of 712 NPL facilities examined. EPA (1993) also concluded that approximately 60 percent of NPL facilities at that time (1991) exhibited a medium-to-high likelihood of having DNAPL present as a source of subsurface contamination. Of the facilities on the NPL as of
TABLE 2-4 National Priority List Site Status
| Status | Non-Federal | Federal | Total |
| Proposed Sites | 55 | 4 | 59 |
| Final Sites | 1,147 | 158 | 1,305 |
| Deleted Sites | 344 | 15 | 359 |
| Total | 1,546 | 177 | 1,723 |
| Milestonesa | Non-Federal | Federal | Total |
| Partial Deletionsb | 40 | 17 | 57 |
| Construction Completionsc | 1,053 | 70 | 1,123 |
a Sites that have achieved these milestones are included in one of the three NPL status categories (i.e., proposed, final, deleted).
b Partial deletion reflects the deletion from the NPL of specific operable units within a larger CERCLA facility. The EPA recognizes partial deletions to “communicate the completion of successful partial cleanups” and “help promote the economic redevelopment of Superfund sites” (60 FR 55466).
c “Construction completions” indicates completion of the physical construction of the remedy, although this does not necessarily indicate whether final remedial objectives have been achieved.
SOURCE: Modified from EPA’s list of NPL Site Totals by Status and Milestone, as of June 1, 2012. http://www.epa.gov/superfund/sites/query/queryhtm/npltotal.htm
2004, 83 percent require remediation of groundwater, 78 percent soil, 32 percent sediment, and 11 percent sludge (EPA, 2004).
CERCLA uses additional metrics than those in Tables 2-3 and 2-4 to describe the program’s progress. According to the Superfund National Accomplishments Summary Fiscal Year 2010 (http://www.epa.gov/superfund/accomp/numbers10.html), the program has controlled potential or actual exposure risk to humans at 1,338 NPL facilities and has controlled the migration of contaminated groundwater at 1,030 NPL facilities. At 66 NPL facilities all long-term protections necessary for anticipated use, including institutional controls, are in place and 475 facilities are classified as ready for anticipated reuse.
RCRA Corrective Action Program
Among other objectives, the Resource Conservation and Recovery Act (RCRA) governs the management of hazardous wastes at operating facilities that handle or handled hazardous waste. RCRA assigns the facility owners and operators the responsibility for corrective action, and it delegates oversight authority to the states (for those states that the EPA has authorized to implement the program). Because the RCRA program also
TABLE 2-5 Universe of RCRA Facilities
| RCRA Milestone | Number of Facilities |
| CA 725 - Current Human Exposures Under Control | 2,821 |
| CA 750 - Groundwater Releases Controlled | 2,465 |
| CA 550 - Remedy Constructed | 1,506 |
|
CA 900 - Corrective Action Performance Standards Attained (Controls Required or No Controls Necessary) |
903 |
| or | |
|
CA 999 - Corrective Action Process Terminateda |
|
a CA 900 is the newer RCRA metric for corrective action complete. It is a voluntary reporting element, however, and not all EPA regions are using this metric at this time. CA 999 was used by some EPA regions in the past, but with differing definitions. This, too, was voluntary and has not been used for all facilities that meet its criteria. The cumulative number of CA 900 and CA 999 is 903.
Source: Sara Rasmussen, EPA RCRA Office, personal communication, August 11, 2011 and September 7, 2011. CA denotes “corrective action.”
governs waste generation and management, remediation to unlimited use and unrestricted exposure is not necessarily the focus as it is in CERCLA (although remediation under RCRA corrective action or CERCLA will substantively satisfy the requirements of both programs [EPA, 1996a]). Furthermore, RCRA remedies are not statutorily bound to comply with the nine criteria of the National Contingency Plan. Rather, EPA has emphasized the need to protect human health and the environment by dealing expeditiously with those sites that present the greatest risks.
Beginning in the late 1990s, the program emphasized achievement of two interim milestones: (1) the human exposures environmental indicator “ensures that people near a particular site are not exposed to unacceptable levels of contaminants,” and (2) the groundwater environmental indicator “ensures that contaminated groundwater does not spread and further contaminate groundwater resources.”4 These indicators have now been satisfied at most of the highest-priority sites (see Table 2-5). Note that the points of compliance where cleanup objectives must be met at operating RCRA facilities may be defined by the property boundaries. The program has recently expanded its focus to include implementing more permanent solutions, and has created the milestone of final remedy construction, which is similar to the CERCLA milestone construction complete.
Although tens of thousands of waste handlers are potentially subject to RCRA, currently EPA has authority to impose corrective action on 3,747
__________________
4 See also http://www.epa.gov/epawaste/hazard/correctiveaction/programs.htm.
RCRA hazardous waste facilities in the United States (deemed the “2020 Universe”).5 Federal facilities (primarily DoD or DOE) represent 5 percent of the 2020 Universe. The 2020 Universe contains a wide variety of facilities, including heavily contaminated properties yet to be cleaned up, others that have been cleaned up, and some that have not been fully investigated yet and may require little or no remediation. Multiple hazardous waste sites, designated as solid waste management units (SWMUs), may exist inside RCRA facilities, but numbers of SWMUs are not compiled by EPA headquarters.
Table 2-5 presents the national accomplishments and status of these facilities as of August 11, 2011. In terms of the number that have reached “closure,” 903 RCRA facilities are categorized as either “Corrective Action Performance Standards Attained (Controls Required or No Controls Necessary) or “Corrective Action Process Terminated,” leaving 2,844 needing additional remediation efforts.
Underground Storage Tank Program
In 1984, Congress recognized the unique and widespread problem posed by leaking underground storage tanks by adding Subtitle I to RCRA. This led to the creation of EPA’s Office of Underground Storage Tanks (OUST) and the development and implementation of a regulatory program for UST systems. UST contaminants are typically light nonaqueous phase liquids (LNAPLs) such as petroleum hydrocarbons and fuel additives. Responsibility for the UST program has been delegated to the states (or even local oversight agencies such as a county or a water utility with basin management programs), which set specific cleanup standards and approve specific corrective action plans and the application of particular technologies at sites. This is true even for petroleum-only USTs on military bases, a few of which have hundreds of such tanks.
At the end of 2011, there were 590,104 active tanks in the UST program (EPA, 2011a). Active tanks are registered with the state subject to the Subtitle I regulations, but they do not necessarily have releases. Currently, there are 87,983 leaking tanks that have contaminated surrounding soil and groundwater, the so-called “backlog.” The backlog number represents the cumulative number of confirmed releases (501,723) minus the cumulative number of completed cleanups (413,740). Since the mid-1990s the number of open releases has been declining, yet the pace at which the EPA cleans up the backlog has also slowed (EPA, 2009a). In a study of unaddressed confirmed releases from USTs in 14 states, EPA (2011b) reported that almost
__________________
5 See http://www.epa.gov/osw/hazard/correctiveaction/facility/index.htm#2020.
half the releases in the backlog are over 15 years old, and that 78 percent of the releases in the backlog have groundwater contamination.
Department of Energy
The DOE faces the task of cleaning up the legacy of environmental contamination from activities to develop nuclear weapons during World War II and the Cold War. Contaminants include short-lived and long-lived radioactive wastes, toxic substances such as chlorinated solvents, “mixed wastes” that include both toxic substances and radionuclides, and, at a handful of facilities, unexploded ordnance. Much like the military, a given DOE facility or installation will tend to have multiple sites where contaminants may have been spilled, disposed of, or abandoned that can be variously regulated by CERCLA, RCRA, or the UST program. The DOE Environmental Management program, established in 1989 to address several decades of nuclear weapons production, “is the largest in the world, originally involving two million acres at 107 sites in 35 states and some of the most dangerous materials known to man” (DOE, 2012a). Since 1989, DOE has also operated an office to develop scientific and technological advancements to meet environmental management challenges, called the Office of Engineering and Technology. In 2003, the Office of Legacy Management was established to focus on long-term care of legacy liabilities from former nuclear production areas following cleanup at each site.
Given that major DOE sites tend to be more challenging than typical DoD sites, it is not surprising that the scope of future remediation is substantial (NRC, 2009). Furthermore, because many DOE sites date back 50 years, contaminants have diffused into the subsurface matrix, considerably complicating remediation. Several previous NRC reports have summarized the nature and extent of contamination at DOE sites (for example, NRC, 1999). There are examples of success stories, such as the 2005 decommissioning of the Rocky Flats Site, arguably once the nation’s most highly contaminated plutonium site.
DOE’s Environmental Management has historically been responsible for restoration at 134 installations that have about 10,000 release sites, although 21 installations were transferred to the U.S. Army Corps of Engineers in 2004 and one installation was added in 2001 (EPA, 2004). EPA (2004) reported that DOE had completed active remediation at about half of its release sites, leaving about 5,000 sites where cleanup had not been completed. More recent reports suggest that about 7,000 individual release sites out of 10,645 historical release sites have been “completed,” which means at least that a remedy is in place (DOE, 2011, pp. 52 ff), leaving approximately 3,650 sites remaining. In 2004, DOE estimated that almost all installations would require long-term stewardship (EPA, 2004).
Since 1998, the U.S. Army Corps of Engineers has managed the Formerly Used Sites Remedial Action Program (FUSRAP), established by DOE in 1974 to remediate nuclear weapons program sites formerly operated by the Manhattan Project and the Atomic Energy Commission. As of 2011, there are 24 active FUSRAP properties in ten states.
Other Federal Sites
Sites operated by civilian federal agencies include all federal agencies except for DOE and DoD. Federal agencies must comply with CERCLA and RCRA in the same manner as private parties and are liable for remediation at current or previously owned properties. As of April 1995, over 3,000 contaminated sites on 700 facilities, distributed among 17 non-DoD and non-DOE federal agencies, were potentially in need of remediation. The Department of Interior (DOI), Department of Agriculture (USDA), and National Aeronautics and Space Administration (NASA) together account for about 70 percent of the civilian federal facilities reported to EPA as potentially needing remediation (EPA, 2004).
EPA (2004) estimates that many more sites have not yet been reported, including an estimated 8,000 to 31,000 abandoned mine sites, most of which are on federal lands, although the fraction of these that are impacting groundwater quality is not reported. The Government Accountability Office (GAO) (2008) determined that there were at least 33,000 abandoned hardrock mine sites in the 12 western states and Alaska that had degraded the environment by contaminating surface water and groundwater or leaving arsenic-contaminated tailings piles.
State Sites
A broad spectrum of sites is managed by states, local jurisdictions, and private parties, and thus are not part of the CERCLA, RCRA, or UST programs. These types of sites can vary in size and complexity, ranging from sites similar to those at facilities listed on the NPL to small sites with low levels of contamination. A gross classification of such sites is (1) those covered under state programs that mandate remediation and (2) state voluntary cleanup programs and/or Brownfields sites.
The mandated programs, which are roughly patterned after the CERCLA program, generally include enforcement authority and state funds to finance the remediation of waste sites. Almost all states have such mandated hazardous waste programs, which generally include provisions for long-term remedial action, funding sources, enforcement authorities, staff to administer and oversee remediation, and efforts to ensure public participation (EPA, 2004). These sites are referred to as “state Superfund” sites
in this report. For example, Georgia’s state Superfund statute was enacted in 1992 and as of July 1, 2010, the list in Georgia had a total of 568 sites (Georgia Environmental Protection Division, 2010). It should be noted that a small and expensive part of the state Superfund caseload is likely to be the NPL facilities where no PRP was ever identified for which the responsibility for long-term operation and maintenance of the remedy is transferred from EPA to the state 10 years after a site remedy has been operational. These so-called orphan sites can create a substantial burden on state governments (see Box 2-1 for an example in Washington State).
Voluntary cleanup programs and Brownfields programs encourage private parties to remediate sites voluntarily rather than expend state resources on enforcement actions or remediation. Fifty states and territories have established voluntary cleanup programs, and 31 states have established separate Brownfields programs. States typically define Brownfields sites as industrial or commercial facilities that are abandoned or underutilized due to environmental contamination or fear of contamination. EPA (2004) postulated that only 10 to 15 percent of the estimated one-half to one million Brownfields sites have been identified.
Forty-one states have long-term stewardship programs for hazardous waste sites (EPA, 2004). The most common mechanisms used for long-term stewardship are educational materials, information systems such as signs, published notices, warnings about consumption of wildlife and fish, and government controls such as zoning. Scant funds have been committed to this effort (EPA, 2004). As of 2000, 40 states had a priority list or inventory of state sites (EPA, 2004), but the approach, definitions, and extent of these lists vary from state to state.
As of 2000, 23,000 state sites had been identified as needing further attention that had not yet been targeted for remediation (EPA, 2004). The same study estimated that 127,000 additional sites would be identified by 2030.
Dry Cleaner Sites
Active and particularly former dry cleaner sites present a unique problem in hazardous waste management because of their ubiquitous nature in urban settings, the carcinogenic contaminants used in the dry cleaning process (primarily the chlorinated solvent PCE, although other solvents have been used), and the potential for the contamination to reach receptors via the drinking water and indoor air (vapor intrusion) exposure pathways. Depending on the size and extent of contamination, dry cleaner sites may be remediated under one or more state or federal programs such as RCRA, CERCLA, or state mandated or voluntary programs discussed previously, and thus the total estimates of dry cleaner sites are not listed separately in
BOX 2-1
Wyckoff/Eagle Harbor Orphan Superfund Site, Washington State
The Wyckoff-Eagle Harbor Superfund site, located on the east side of Bainbridge Island, Washington, in central Puget Sound, was added to the NPL in 1987. The site is considered an “orphan” site because the previous owner is defunct with no insurance coverage available to address the legacy contamination. The site includes a former wood-treating facility and shipyard, and contaminated sediments in Eagle Harbor adjacent to these former facilities. The Wyckoff wood-treating facility operated on the site for 85 years, and these operations resulted in soil and groundwater contamination (including creosote, pentachlorophenol, and various polycyclic aromatic hydrocarbons). The shipyard contaminated the harbor sediments with organic compounds and heavy metals, including lead, copper, and mercury.
EPA has divided the site into four operable units (OUs) one of which included groundwater beneath the Former Process Area. A Record of Decision (ROD) for the groundwater OU was signed in 2000 with the preferred remedy being physical containment combined with a pump-and-treat system to reduce groundwater discharges to Puget Sound.
Because of concerns about long-term containment of the groundwater OU, steam technology was pilot tested to achieve mass removal from the subsurface. The pilot study was determined to be unsuccessful, partly because of improper operation of the technology. Nonetheless, a 2005 Engineering Evaluation of Remediation Scenarios for the site concluded that any source depletion technology would not likely be sufficient to reduce groundwater concentrations to the levels specified in the ROD. An Explanation of Significant Differences published in 2007 modified some details of the remedy, but containment remained the remedy for the groundwater OU. As of 2007, the on-site groundwater extraction system, which
Table 2-6. However, dry cleaner sites are discussed here because of the high prevalence of active and inactive dry cleaner sites across the nation, their frequent proximity to residential neighborhoods, the highly recalcitrant and toxic nature of the contaminants released, and the importance of the vapor intrusion pathway. Thirteen states6 have legislation specific to dry cleaner sites including earmarked funds for site investigation and remediation. Cu-
__________________
6 These states—Alabama, Connecticut, Florida, Illinois, Kansas, Minnesota, Missouri, North Carolina, Oregon, South Carolina, Tennessee, Texas, and Wisconsin—are members of the State Coalition for Remediation of Drycleaners (SCRD). California, Maryland, New Jersey, New York, and Virginia are also represented within the coalition as being active in the area of dry cleaner remediation, although they do not have dry cleaner-specific programs. Established in 1998, the Coalition’s primary objectives are “to provide a forum for the exchange of information and the discussion of implementation issues related to established state dry cleaner programs; share information and lessons learned with states without dry cleaner-specific pro-
has been in operation since 1993, had removed approximately 100,000 gallons of nonaqueous phase liquid (NAPL) and treated over 475 million gallons of contaminated groundwater. It is estimated that the volume of NAPL in the subsurface of the Former Process Area is approximately 1.2 million gallons. Costs to date for the remedy are not readily available, but are estimated to be more than $130 million.
There is uncertainty about the Washington Department of Ecology’s (WDOE) ability to effectively carry out long-term stewardship of the site consistent with the current ROD/Explanation of Significant Differences, given that the remedy must be maintained for hundreds of years. The two primary concerns include (1) the long-term environmental consequence of leaving large amounts of mobile contamination beneath the Former Process Area, given its sensitive location on the shores of Puget Sound, and (2) the financial burden that this action places on Washington State—an in-perpetuity and federally mandated obligation for the State to maintain active operation and maintenance of the remedy, including periodic rebuilding of the containment components such as the groundwater extraction system and perimeter sheet pile wall. The WDOE estimates that life-cycle costs are in excess of hundreds of millions of dollars.
As a result of these concerns, the WDOE has not yet entered into a long-term Superfund State Contract with the EPA for the long-term operations and maintenance for the soil and groundwater OUs. In 2010, WDOE undertook an assessment of alternatives that could potentially decrease or eliminate the need for long-term stewardship. No decision has yet been made regarding the implementation of a new remedy for the groundwater OU as of June 2012.
The lessons learned from this site are a significant concern nationwide, given the expected large number of orphan sites under the CERCLA program and the difficult financial conditions currently facing state governments, who will ultimately be responsible for these orphan sites.
mulative statistics of remediation for these states provides an illustration of the state of progress in remediating U.S. dry cleaner sites (SCRD, 2010a):
• 3,817 sites in dry cleaning programs,
• 2,177 sites where contamination assessment work has been initiated,
• 1,221 sites where contamination assessment work has been completed,
• 574 sites where remediation has been initiated,
• 205 sites where remediation has been completed, and
• 693 sites closed.
grams; and encourage the use of innovative technologies in dry cleaner remediation” (http://www.drycleancoalition.org). Approximately one-third of the nation’s dry cleaners are located in states participating in the SCRD (EPA, 2004).
In 2004, there were an estimated 30,000 commercial, 325 industrial, and 100 coin-operated active dry cleaners in the United States (EPA, 2004). Despite their smaller numbers, industrial dry cleaners produce the majority of the estimated gallons of hazardous waste from these facilities (EPA, 2004). As of 2010, the number of dry cleaners has grown, with an estimated 36,000 active dry cleaner facilities in the United States—of which about 75 percent (27,000 dry cleaners) have soil and groundwater contamination (SCRD, 2010b).
In addition to active sites, dry cleaners that have moved or gone out of business—i.e., inactive sites—also have the potential for contamination. Unfortunately, significant uncertainty surrounds estimates of the number of inactive dry cleaner sites and the extent of contamination at these sites. Complicating factors include the fact that (1) older dry cleaners used solvents less efficiently than younger dry cleaners thus enhancing the amount of potential contamination and (2) dry cleaners that have moved or were in business for long amounts of time tend to employ different cleaning methods throughout their lifetime. EPA (2004) documented at least 9,000 inactive dry cleaner sites, although this number does not include data on dry cleaners that closed prior to 1960. There are no data on how many of these documented inactive dry cleaner sites may have been remediated over the years. EPA estimated that there could be as many as 90,000 inactive dry cleaner sites in the United States.
In addition to tracking the number of hazardous waste sites that have not yet reached closure, the Committee sought information on the cleanup costs expended to date and cost estimates for reaching closure (including estimates for remediation efforts and for long-term management, within the next 30 to 50 years) for each of the programs discussed in the previous section. This information was available for some of the programs but not all (as summarized in Table 2-6). Cost estimates to reach closure (i.e., where no further action is required) are notoriously uncertain and subject to change whenever new contamination is discovered, technology performance and its cost becomes better known, and regulatory perspectives or requirements change. Some cost estimates may be based on unrealistic expectations of remediation performance, particularly in situations with recalcitrant contaminants in complex geologic settings. Also, cost-to-complete estimates frequently underestimate the cost of long-term management. Thus, the Committee, based on its experience, has low confidence in the following cost projections.
Department of Defense
The Installation Restoration Program reports that it has spent approximately $31 billion through FY 2010, and estimates for “cost to complete” exceed $12 billion (Table 2-1). The program’s cost to complete actually rose by more than $587 million between 2009 and 2010, despite an annual expenditure totaling nearly $1.3 billion (OUSD, 2011, p. E-9; DEPARC, 2010, p. C-1-1). DoD has collected almost $578 million from non-DoD parties as cost-sharing for IRP projects. The lion’s share, over $548 million, has been Shell Oil’s payment for remediation at the Rocky Mountain Arsenal in Colorado, where Shell produced pesticides after the Army stopped manufacturing chemical weapons (OUSD, 2011, p. D-6).
CERCLA
Implementation costs for the CERCLA program are difficult to obtain because most remedies are implemented by private, nongovernmental PRPs and generally there is no requirement for these PRPs to report actual implementation costs. PRPs have historically paid for 70 percent of costs associated with facilities on the NPL. EPA (2004) estimated that the cost for addressing the 456 facilities that have not begun remedial action is $16-$23 billion.7 A more recent report from the GAO (2009) suggests that individual site remediation costs have increased over time (in constant dollars) because a higher percentage of the remaining NPL facilities are larger and more complex (i.e., “megasites”) than those addressed in the past. Additionally, GAO (2009) found that the percentage of NPL facilities without responsible parties to fund cleanups may be increasing.
When no PRP can be identified, the cost for Superfund remediation is shared by the states and the Superfund Trust Fund. The Superfund Trust Fund has enjoyed a relatively stable budget—e.g., $1.25 billion, $1.27 billion, and $1.27 billion for FY 2009, 2010, and 2011,8 respectively—although recent budget proposals seek to reduce these levels. States contribute as much as 50 percent of the construction and operation costs for certain CERCLA actions in their state. After ten years of remedial actions at such NPL facilities, states become fully responsible for continuing long-term remedial actions.
__________________
7 This total is based on an average cost per operable unit of $1.4 million for RI/FS, $1.4 million for remedial design, $11.9 million for remedial action, and $10.3 million for long-term remedial action (EPA, 2004).
RCRA Corrective Action Program
EPA headquarters has no information on either costs expended or costs to closure because RCRA regulations do not require responsible RCRA parties to provide cost information (Sara Rasmussen, EPA, personal communication, February 24, 2010). In 2004, EPA estimated that remediation of the remaining RCRA sites will cost between $31 billion and $58 billion, or an average of $11.4 million per facility (EPA, 2004) (hence, the estimate of $11.4 × 2,844 = $32.4 billion in Table 2-6). It is unclear whether this cost estimate represents only capital costs for the remedy or also includes long-term management costs.
Underground Storage Tank Program
There is limited information available to determine costs already incurred in the UST program. EPA (2004) estimated that the cost to close all leaking UST (LUST) sites could reach $12-$19 billion or an average of $125,000 to remediate each release site (this includes site investigations, feasibility studies, and treatment/disposal of soil and groundwater). Based on this estimate of $125,000 per site, the Committee calculated that remediating the 87,983 backlogged releases would require $11 billion. The presence of the recalcitrant former fuel additive methyl tert-butyl ether (MTBE) and its daughter product and co-additive tert-butyl alcohol could increase the cost per site. Most UST cleanup costs are paid by property owners, state and local governments, and special trust funds based on dedicated taxes, such as fuel taxes.
Department of Energy
To gain an understanding of the DOE costs that would be comparable to other federal programs, the Committee reviewed the Department’s FY 2011 report to Congress, which shows that DOE’s anticipated cost to complete remediation of soil and groundwater contamination ranges from $17.3 to $20.9 billion. The program is dominated by a small number of mega-facilities, including Hanford (WA), Idaho National Labs, Savannah River (SC), Los Alamos National Labs (NM), and the Nevada Test Site. Given that the cost to complete soil and groundwater remediation at these five facilities alone ranges from $16.4 to $19.9 billion (DOE, 2011), the Committee believes that the DOE’s anticipated cost-to-complete figure is likely an underestimate of the Agency’s financial burden; the number does not include newly discovered releases or the cost of long-term management at all sites where waste remains in the subsurface.
Data on long-term stewardship costs, including the expense of operat-
ing and maintaining engineering controls, enforcing institutional controls, and monitoring, are not consolidated but are likely to be substantial and ongoing. The Office of Legacy Management, which is responsible for managing non-operational facilities once the Environmental Management program has completed its work, had a $38.8 million annual budget for FY 2012 for “long-term surveillance and maintenance” (DOE, 2012b). Stewardship costs for just the five facilities managed by the National Nuclear Security Administration (Lawrence Livermore National Laboratory, CA, Livermore’s Site 300, Pantex, TX, Sandia National Laboratories, NM, and the Kansas City Plant, MO) total about $45 million per year (DOE, 2012c).
Through 2010, the FUSRAP program had spent $2.03 billion, and the annual budget normally ranges from $130 million to $140 million. No cost data are available on estimated costs to complete remedial actions for this program.
Other Federal Sites
EPA (2004) reports that there is a $15-$22 billion estimated cost to address at least 3,000 contaminated areas on 700 civilian federal facilities, based on estimates from various reports from DOI, USDA, and NASA.
States
EPA (2004) estimated that states and private parties together have spent about $1 billion per year on remediation, addressing about 5,000 sites annually under mandatory and voluntary state programs. If remediation were continued at this rate, 150,000 sites would be completed over 30 years, at a cost of approximately $30 billion (or $20,000 per site).
IMPACTS TO drinking water supplies
The Committee sought information both on the number of hazardous waste sites that impact a drinking water aquifer—that is, pose a substantial near-term risk to public water supply systems that use groundwater as a source. Unfortunately, program-specific information on water supply impacts was generally not available. Therefore, the Committee also sought other evidence related to the effects of hazardous waste disposal on the nation’s drinking water aquifers.
Program-Specific Reports of Groundwater Impacts
Despite the existence of several NPL and DoD facilities that are known sources of contamination to public or domestic wells (e.g., the San Fernando
and San Gabriel basins in Los Angeles County—Land et al., 2011), there is little aggregated information about the number of CERCLA, RCRA, DoD, DOE, UST, or other sites that directly impact drinking water supply systems. None of the programs reviewed in this chapter specifically compiles information on the number of sites currently adversely affecting a drinking water aquifer. However, the Committee was able to obtain information relevant to the groundwater impacts from some programs:
• DoD. The Army informed the Committee that public water supplies are threatened at 18 Army installations (Laurie Haines, U.S. Army Environmental Command, 2010, personal communication). Also, private drinking water wells are known to be affected at 23 installations. A preliminary assessment in 1997 showed that 29 Army installations may possibly overlie one or more sole source aquifers (based on simply comparing the general aquifer locations from EPA maps to Army installation locations). Each of the other armed services is also responsible for groundwater contamination that has affected drinking water supplies. Some of the best known are Camp Lejeune Marine Corps Base (NC), Otis Air National Guard Base (MA), and the Bethpage Naval Weapons Industrial Reserve Plant (NY) (see Appendix B).
• CERCLA. Each individual remedial investigation/feasibility study (RI/FS) and Record of Decision (ROD) should state whether a drinking water aquifer is affected, although this information has not been compiled. Canter and Sabatini (1994) reviewed the RODs for 450 facilities on the NPL. Their investigation revealed that 49 of the RODs (11 percent) indicated that contamination of public water supply systems had occurred. “A significant number” of RODs also noted potential threats to public supply wells. Additionally, the authors note that undeveloped aquifers have also been contaminated, which prevents or limits the unrestricted use (i.e., without treatment) of these resources as a future water supply.
The EPA also compiles information about remedies implemented within Superfund. EPA (2007) reported that out of 1,072 facilities that have a groundwater remedy, 106 specifically have a water supply remedy, by which we inferred direct treatment of the water to allow potable use or switching to an alternative water supply. This suggests that 10 percent of NPL facilities adversely affect or significantly threaten drinking water supply systems. This estimate is further bolstered by EPA (2010b), which reports that of the 311
decision documents from FY 2005–2008 with “groundwater other” remedies, 8 percent of these (26) include water supply remedies.
• RCRA. Of the 1,968 highest priority RCRA Corrective Action facilities, EPA (2008) reported that there is “unacceptable migration of contaminated groundwater” at 77 facilities. Also, 17,042 drinking water aquifers have a RCRA facility within five miles (Roger Anzzolin, EPA, personal communication, 2010), but without additional information, it is impossible to know if these facilities are actually affecting the water sources.
• UST. In 2000, 35 states reported USTs as the number one threat to groundwater quality (and thus indirectly to drinking water) (EPA, 2000). However, more specific information on the number of leaking USTs currently impacting a drinking water aquifer is not available.
Other Evidence That Hazardous Waste Sites Affect Water Supplies
The U.S. Geological Survey (USGS) has compiled large data sets over the past 20 years regarding the prevalence of VOCs in waters derived from domestic (private) and public wells. VOCs include solvents, trihalomethanes (some of which are solvents [e.g., chloroform], but may also arise from chlorination of drinking water), refrigerants, organic synthesis compounds (e.g., vinyl chloride), gasoline hydrocarbons, fumigants, and gasoline oxygenates. Because many (but not all) of these compounds may arise from hazardous waste sites, the USGS studies provide further insight into the extent to which anthropogenic activities contaminate groundwater supplies (although it should be remembered that it was not the goal of these studies to uniquely identify the source of the contamination). The following paragraphs do not discuss metals and other inorganic groundwater contaminants described in the USGS studies, because of the many other possible natural sources for these constituents.
Zogorski et al. (2006) summarized the presence of VOCs in groundwater, private domestic wells, and public supply wells from sampling sites throughout the United States. Using a threshold level of 0.2 μg/L—much lower than current EPA drinking water standards for individual VOCs (see Table 3-1)—14 percent of domestic wells and 26 percent of public wells had one or more VOCs present. The detection frequencies of individual VOCs in domestic wells were two to ten times higher when a threshold of 0.02 μg/L was used (see Figures 2-2 and 2-3). In public supply wells, PCE was detected above the 0.2 μg/L threshold in 5.3 percent of the samples and TCE in 4.3 percent of the samples. The total percentage of public supply wells with either PCE or TCE (or both) above the 0.2 μg/L threshold is 7.3
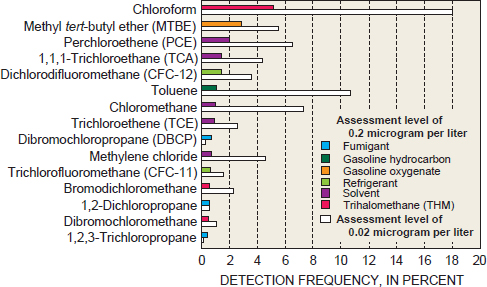
FIGURE 2-2 Detection frequencies in domestic well samples for 15 most frequently detected VOCs at levels of 0.2 and 0.02 μg/L.
SOURCE: Zogorski et al. (2006) with illustration provided by USGS National Water Quality Assessment program.
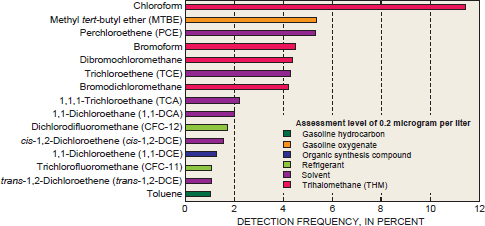
FIGURE 2-3 The 15 most frequently detected VOCs in public supply wells.
SOURCE: Zogorski et al. (2006) with illustration provided by USGS National Water Quality Assessment program.
percent. The following conclusions were drawn in the Zogorski et al. study: (1) public wells are more vulnerable to contamination than private domestic wells, (2) public wells had higher concentrations of VOCs (50 percent of public wells had total VOC concentrations > 1 μg/L), and (3) public wells were more likely to have mixtures of VOCs than domestic wells. These effects were attributed, by the authors, to the larger withdrawal rates and closer proximity to urban areas of many public supply wells.
Further analysis of domestic wells by DeSimone et al. (2009) showed that organic contaminants were detected in 60 percent of 2,100 sampled wells. Wells were sampled in 48 states in parts of 30 regionally extensive aquifers used for water supply. Aquifers were randomly selected for sampling and there was no prior knowledge of contamination. Seventeen VOCs were detected in more than 1 percent of wells at concentrations greater than 0.02 μg/L (see Figure 2-4 below, VOCs are in black). TCE was detected above the maximum comtaminant level (MCL) of 5 μg/L in 0.1 percent of wells. PCE was detected above the MCL of 5 μg/L in 0.05 percent of wells.
Rowe et al. (2007) compiled data for 2,400 domestic wells sampled from 1985 until 2002. Sixty-five percent of domestic wells had a VOC detection 0.02 μg/L or greater (31 percent had a single VOC, 34 percent had more than one VOC). The top five VOCs detected were chloroform (25.6 percent), toluene (17.9 percent), 1,2,4-trimethylbenzene (15.2 percent), PCE (11 percent), and chloromethane (9.7 percent). PCE, TCE, and chloromethane were the compounds with the largest fraction of samples at 0.1 × MCL or greater. The presence of a LUST site within 1 km of the sampled well strongly correlated with MTBE detections, and the presence of an RCRA site (as determined by the EPA Envirofacts database) within 1 km of the well strongly correlated with the detections of PCE, TCE, and 1,1,1-TCA.
Toccalino and Hopple (2010) and Toccalino et al. (2010) focused on 932 public supply wells across the United States. The public wells sampled in this study represent less than 1 percent of all groundwater that feeds the nation’s public water systems. The samples, however, were widely distributed nationally and were randomly selected to represent typical aquifer conditions. Overall, 60 percent of public wells contained one or more VOCs at a concentration of ≥ 0.02 μg/L, and 35 percent of public wells contained one or more VOCs at a concentration of ≥ 0.2 μg/L. The percentages are higher than those reported by Zogorski et al. (2006), but this study focused on a larger suite of VOCs (85 vs. 55 compounds). Overall detection frequencies for individual compounds included 23 percent for PCE, 15 percent for TCE, 14 percent for MTBE, and 12 percent for 1,1,1-TCA (see Figure 2-5). PCE and TCE exceeded the MCL in approximately 1 percent of the public wells sampled. About 70 percent of VOC detections were from sand and gravel aquifers. Public wells in sand and gravel aquifers more often
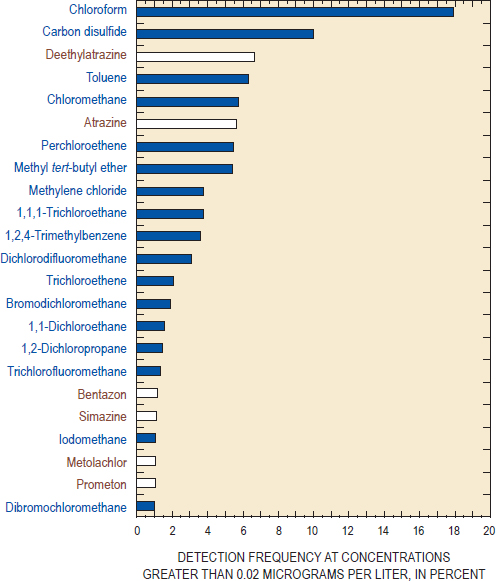
FIGURE 2-4 VOCs (in black) and pesticides (in white) detected in more than 1 percent of domestic wells at a level of 0.02 μg/L.
SOURCE: DeSimone et al. (2009).
withdraw water from shallower unconfined aquifers than from deeper confined aquifers. Thus, VOCs were detected more frequently in samples from unconfined aquifers than from confined aquifers, highlighting the vulnerability of shallow unconfined aquifers. Overall, the detection frequencies of some VOCs were 2-fold to 6-fold greater in public wells than domestic
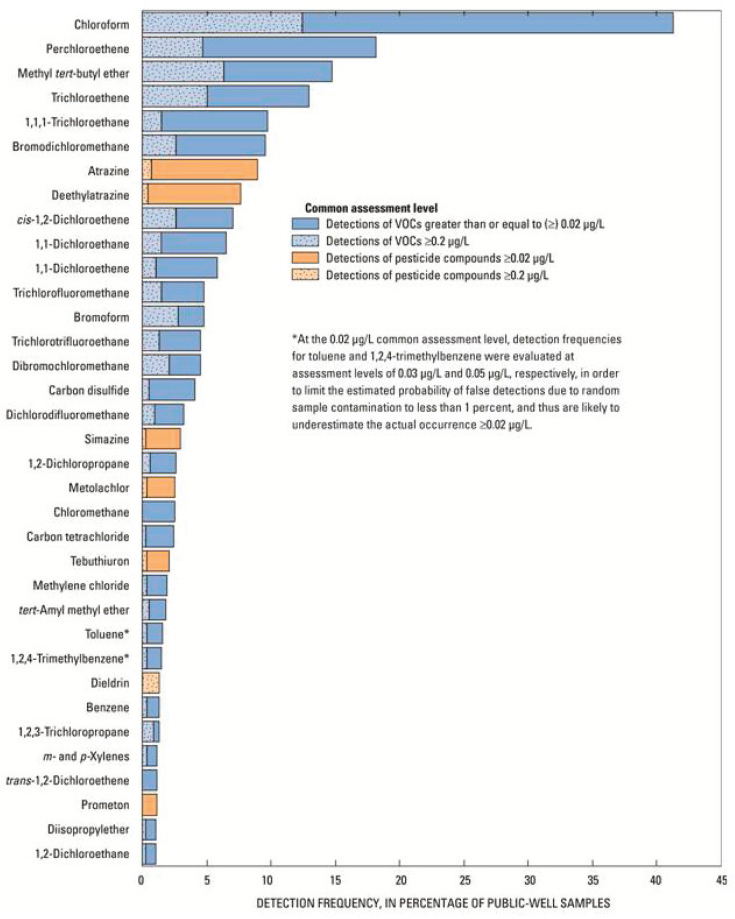
FIGURE 2-5 VOCs and pesticides with detection frequencies of 1 percent or greater at assessment levels of 0.02 μg/L in public wells in samples collected from 1993–2007.
SOURCE: Toccalino and Hopple (2010) and Toccalino et al. (2010)
wells—again, likely because of proximity of public wells to developed areas and higher pumping rates used for public wells versus domestic wells.
Overall, the USGS studies show that there is widespread, very low level contamination of private and public wells by VOCs, with a reasonable estimate being 60 to 65 percent of public wells having detectable VOCs. According to the data sets of Toccalino and Hopple (2010) and Toccalino et al. (2010), approximately 1 percent of sampled public wells have levels of VOCs above MCLs. Thus, water from these wells requires additional treatment to remove the contaminants before it is provided as drinking water to the public. EPA (2009b) compiled over 309,000 groundwater measurements of PCE and TCE from raw water samples at over 46,000 groundwater-derived public water supplies in 45 states. Compared to the USGS data, this report gives a lower percentage of water supplies being contaminated: TCE concentration exceeded its MCL in 0.34 percent of the raw water samples from groundwater-derived drinking water supply systems.
There are other potential sources of VOCs in groundwater beyond hazardous waste sites. For example, chloroform is a solvent but also a disinfection byproduct, so groundwater sources impacted by chlorinated water (e.g., via aquifer storage/recharge, leaking sewer pipes) would be expected to show chloroform detections. Another correlation seen in the USGS data is that domestic and public wells in urban areas are more likely to have VOC detections that those in rural areas. This finding is not unexpected given the much higher level of industrial practices in urban areas that can result in releases of these chemicals to the subsurface.
Another way to estimate the number of public water supplies affected by contaminated groundwater is to consider the number of water supply systems that specifically seek to remove organic contaminants. The EPA Community Water System Survey (EPA, 2002) reports that 2.3 to 2.6 percent of systems relying solely on groundwater have “organic contaminant removal” as a treatment goal. For systems that use both surface water and groundwater, 10.3 to 10.5 percent have this as a treatment goal. While it is possible that this range (2 to 10 percent) may be the fraction of water supplies impacted by groundwater contamination, this is at best only a rough estimate and highly uncertain. A water utility could (or may be forced to) use an alternative water supply, rather than treat a contaminated source, which would make this a lower estimate. On the other hand, the category “organic contaminants” includes pesticides, which may come from nonpoint sources rather than contaminated sites, meaning this range could be an overestimate.
In summary, it appears that the following conclusions about the contamination of private and public groundwater systems can be drawn: (1) there is VOC contamination of many private and public wells (upwards of 65 percent) in the United States, but at levels well below MCLs; the origin
of this contamination is uncertain and the proportion caused by releases from hazardous waste sites is unknown; (2) approximately one in ten NPL facilities is impacting or significantly threatening a drinking water supply system relying on groundwater, requiring wellhead treatment or the use of alternative water sources; and (3) public wells are more susceptible to contamination than private wells, due their higher likelihood of being in urban areas and their higher pumping rates and hydraulic capture zones.
In considering the size of the nation’s hazardous waste problem, one question that has arisen is the definition of the term “closure” as it relates to these sites. Does a closed site mean no residual contamination above regulatory limits or is the definition flexible depending on the risk environment in which the regulatory decision to close a site is made? Indeed, there is confusion about the definition of “site closure”—not only to the public, the regulated community, and between regulatory agencies, but even within EPA’s own closure guidance (EPA, 2011c). For example, EPA (2011c) on page 1-2 states that “site completion typically occurs when it is determined that no further response is required at the site, all cleanup levels have been achieved, and the site is deemed protective of human health and the environment.” It goes on to say that “site completion signifies the end of all response actions at a site” and “it is anticipated that no further Superfund response is necessary to protect human health and the environment.” However, it then states on page 4-3 that “operation and maintenance are not defined as a response action by the NCP, and may continue after site completion and deletion.” Furthermore, the guidance states that the final closure must explain whether a five-year review is appropriate. However, a five-year review is only required when contaminants are left in place above UU/UE levels, such as the drinking water standards. It is no wonder that stakeholders are confused by the site closure metric, as operation and maintenance of a remedy may continue for many decades after “closure.”
To better understand the status of “closed” sites and whether these sites could in fact demand future resources for monitoring, reporting, or additional remediation, the Committee reviewed an Interstate Technology and Regulatory Council (ITRC)9 survey of “closed” underground storage tanks, EPA cleanup success stories, and 80 facilities delisted from the NPL
__________________
9 The ITRC, which consists of states, federal agencies, industry, and other stakeholders, “develops guidance documents and training courses to meet the needs of both regulators and environmental consultants, and it works with state representatives to ensure that ITRC products and services have maximum impact among state environmental agencies and technology users” (http://www.irtcweb.org/aboutIRTC.asp).
where groundwater was contaminated. This review revealed that these sites vary widely in the extent to which they contain contaminant levels that are actually higher than MCLs or other levels that would allow for unlimited use and unrestricted exposure. The Committee found that there was no publicly available mechanism for tracking these sites subsequent to closure, nor do the federal programs maintain a central repository of information about their closed sites (except for NPL-delisted facilities). Thus, little quantitative data or information are available to assess such sites.
It is clear that the definition of site closure varies from program to program, such that a site closed under one program would not necessarily be closed under another, even for the same type of waste site. Perhaps the most prominent example of this is the way that the states have defined site closure for underground storage tanks. Cleanup goals for tanks have often been expressed as removal of contaminants “to the maximum extent practicable,” which, as discussed earlier in the context of UST remediation, can be interpreted many different ways—from no interpretation at all to a maximum allowable LNAPL thickness in a monitoring well (e.g., sheen or 1/8-inch thickness). The ITRC’s recent survey of state UST programs (ITRC, 2009) revealed that many states rely solely on best professional judgment of maximum extent practicable (which would obviously vary from site to site within the state), while a few others are starting to consider site-specific risk. Still other states close USTs when contaminant levels are no longer “detectable.”
The potential for misunderstanding in the labeling of sites as “successes” is illustrated by an EPA (2009c) review of 13 DNAPL sites—some CERCLA, one RCRA, and some state sites. These sites were chosen because they are examples of where source reduction has contributed to a site meeting remedial objectives (such as groundwater MCLs). However, closer inspection of the 13 sites by this Committee revealed that five of the sites reported only soil contamination and thus the Committee could not determine if they were examples of the more intractable problems found at groundwater sites. Of the remaining eight sites with contaminated groundwater, EPA’s report states that only three sites were “able to achieve MCLs onsite” although two others achieved MCLs at an offsite point of compliance [see EPA (2009c), Table D-1 in Appendix D].
This Committee conducted a more in-depth analysis of 80 Superfund facilities (identified by EPA personnel) that had groundwater contamination that were eventually deleted from the NPL. For each of the 80, the Committee analyzed five-year review reports, site closure documents, RODs, and fact sheets produced by EPA; the full analysis can be found in Appendix C. Sixty percent were industrial facilities, 22 percent were landfills, and the rest were potable well fields, military bases, or other facility types. As would be expected of complex Superfund facilities, almost all of the 80 had
groundwater contaminated by VOCs, SVOCs, metals, or some combination thereof.
The Committee first determined what the remedial action objectives were for each delisted NPL facility. Of the 80, 45 had remedial objectives that specified a contaminant concentration goal for groundwater, either MCLs or some other level. For seven, the stated objectives involved some other specific metric (such as prevention of contaminated groundwater migration, exposure prevention, etc.). Finally, 28 had no explicitly stated objective other than the goal of “protecting human health and the environment.” This broad goal statement was most typical of NPL facilities delisted early in the program; indeed, for many of these early delisted facilities a later ROD amendment, consent decree, or five-year review report appears to establish that there were numeric concentration goals for groundwater. For the Committee’s subsequent analysis (see below), for any facility where groundwater contaminant concentrations were compared to MCLs in five-year review reports, the facilities were categorized as either meeting or not meeting MCLs, even if this was not an original goal of the ROD.
The primary objective of the Committee’s analysis was to determine the extent to which the 80 delisted facilities had actually met MCLs in groundwater. According to information that could be easily gleaned from EPA’s CERCLIS database, 37 of the 80 reported achieving MCLs prior to deleting the facility from the NPL (see Figure 2-6). Of this subgroup, 14 achieved MCLs after some length of time operating an active remedy (like pump and
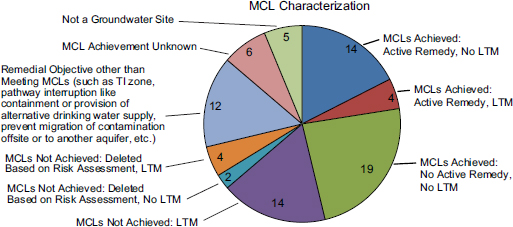
FIGURE 2-6 Pie chart of 80 groundwater facilities delisted from the NPL categorized by whether they reached MCLs and whether long-term monitoring is in place. LTM = long-term monitoring.
treat or thermal treatment) and no longer require long-term monitoring. Four facilities deleted from the NPL have achieved MCLs and still have long-term monitoring in place. At 19 the MCLs were achieved without an active remedy (thus, no long-term monitoring is in place), suggesting that either there was no substantial groundwater contamination when the facility was added to the NPL or that natural attenuation occurred during the RI/FS process to significantly reduce contaminant concentrations.
More interesting are the 20 facilities with contaminated groundwater that were deleted from the NPL where MCLs have not been met (as of August 2011 and as related in readily accessible EPA documents). Fourteen of these have been shown to have contaminant concentrations that are trending downward, and thus must continue to do five-year reviews. Six were deleted after a site-specific risk assessment demonstrated that the risks were below an acceptable threshold, even if contaminant concentrations were above MCLs, and four of the six must do long-term monitoring.
Twelve of the 80 were delisted after successfully installing containment or another protective remedy and thus could not be considered as having met or not met MCLs, because that was not the goal of the remedy. For example, at Schofield Barracks in Hawaii, the Army was able to delist the facility after providing an alternative source of water to local residents and determining that the contamination present in the subsurface was no longer presenting a human health risk (see Box 2-2). Because contamination remains in place, the facility must undergo five-year reviews in perpetuity, but this facility is anecdotally referred to as “closed.” Also included in this category are facilities that were granted a Technical Impracticability waiver for some portion of the facility (at which MCLs are waived). Thus, it would be impossible to consider the sites as having achieved MCLs or not.
For six facilities there was insufficient information in the documentation available from EPA to determine if MCLs were met or not. Presumably, these six could have been binned into one of the other categories if further information had been sought from EPA regional offices.
Finally, five facilities did not appear to have ever had groundwater contamination.
The Committee cautions that there is some amount of uncertainty associated with this analysis due to the uneven and sparse nature of the documentation available on delisted NPL facilities from the EPA website. In particular, frequently found statements such as “a site is meeting health-based standards” were difficult to interpret as having met MCLs or not. The documents for a given facility were not necessarily consistent with one another, especially with respect to the statement of remedial goals. For the purposes of the analysis, the most recent documents were weighted more heavily. Despite these uncertainties, only half of groundwater-contaminated facilities deleted from the NPL, which are considered success stories for
BOX 2-2
Schofield Barracks, HI, Case Study
This site is an example of a delisted NPL facility at which restoration was considered not practical and that will require long-term management and monitoring. Schofield Barracks is a U.S. Army post located in the City and County of Honolulu and in the Wahiawa District of the island of Oahu, Hawaii. Established in 1908, the 17,725-acre facility served as a major support facility during World War II and is the largest Army base outside the contiguous United States.
The hydrogeology at Schofield is complex, including a highly fractured basalt aquifer that causes extreme heterogeneity on a local scale. Depth to groundwater is 500–600 feet from the surface. Contaminated sites include a former landfill on 35 acres that contains solid, domestic waste; industrial waste from vehicle equipment and maintenance, solvents, and sewage sludge; medical waste; explosives (both ordnance and unexploded); and construction and demolition waste from various military installations. Contaminants detected at levels above MCLs in the groundwater system beneath the landfill were TCE and carbon tetrachloride (CCl4), antimony, and manganese. Other chlorinated VOCs such as PCE were detected at low levels (less than MCLs). The precise source for these contaminants in the groundwater remains unidentified.
In 1985, high levels of TCE (as much as 100 ppb) were found to be contaminating wells that supplied water to about 25,000 people living at Schofield Barracks, which was the catalyst for the site being listed on the NPL (EPA, 2010a; U.S. Army Environmental Command, 2007). As a result, there was a temporary switch from well water to city and county water supplies. In 1986, an air stripping treatment unit was established to treat water from the four existing production wells to reduce concentrations of TCE in the drinking water used at the base. Public drinking water wells that serve 55,000 people are located within three miles of the base, but they do not appear to have been affected by the contamination.
The Army divided the site into four Operable Units (OU2 is the groundwater plume and OU4 is the former landfill), for which a ROD was signed in 1996 (EPA, 1996b). Because of the difficult hydrogeologic conditions and the inability to conclusively locate the source of contamination, the Army applied for and received a Technical Impracticability waiver for the site. Treatment for the drinking water wells has maintained an average concentration of TCE below 5 μg/L since air strippers were installed in 1986. The installation was delisted from the NPL in 2000. The Army is conducting the five-year reviews, the second of which was completed in 2007. Site inspection shows that the remedies (for both contaminated groundwater and the landfill) are functioning properly (U.S. Army Environmental Command, 2007).
site closure, have actually achieved MCLs. Of course, at all of the deleted facilities, human health and the environment are currently protected. What is also clear from this analysis is that many site-specific, pragmatic factors come into play when decisions are made on the future of the facility (i.e., no further action or some kind of long-term management).
As discussed further in Chapter 3, the cleanup goals of the federal programs range from preventing or minimizing exposure, to meeting engineering milestones (such as remedy selection, design completion, completing construction, completing the active remedy), to attaining the ultimate goal of achieving UU/UE conditions at a site. The military’s primary goal is to achieve remedy in place or response complete at its sites by 2014, with little mention of site closure or attaining unrestricted use of the site.
All of these issues suggest that there can be no generalizations about the condition of sites referred to as “closed,” particularly assumptions that they are “clean,” meaning available for unlimited use and unrestricted exposure. Indeed, the experience of the Committee in researching “closed sites” suggests that many of them contain contaminant levels above those allowing for unlimited use and unrestricted exposure, even in those situations where there is “no further action” required. Rather, site closure may simply mark the beginning of a long-term operation and maintenance phase involving oversight of institutional controls. Furthermore, it is clear that states are not tracking their caseload at the level of detail needed to ensure that risks are being controlled subsequent to “site closure.” Thus, reports of cleanup success should be viewed with caution.
CONCLUSIONS AND RECOMMENDATIONS
The Committee’s rough estimate of the number of sites remaining to be addressed and their associated future costs is presented in Table 2-6, which lists the latest available information on the number of facilities (for CERCLA and RCRA) and contaminated sites (for the other programs) that have not yet reached closure, and the estimated costs to remediate the remaining sites. The Committee used these data to estimate the total number of complex sites with residual contamination, as described below.
At least 126,000 sites across the country have been documented that have residual contamination at levels preventing them from reaching closure. This number is likely to be an underestimate of the extent of contamination in the United States for a number of reasons. First, for some programs data are available only for contaminated facilities rather than individual sites; for example, RCRA officials declined to provide an average number of solid waste management units per facility, noting that it ranged from 1 to “scores.” CERCLA facilities frequently contain more than one individual release site. The total does not include DoD sites that have reached remedy in place or response complete, although some such sites may indeed contain residual contamination. Finally, the total does not include sites that likely exist but have not yet been identified, such as dry cleaners or small chemical-intensive businesses (e.g., electroplating, furniture refinishing) that
TABLE 2-6 Rough Estimate of the Total Number of Currently Known Facilities or Contaminated Sites That Have Not Reached Closure and Estimated Costs to Complete
| Program/Agency | Number of Contaminated Facilities | Number of Contaminated Sites | Estimated Cost to Completea |
| DoD | 4,329 | $12.8 billion | |
| CERCLA | 1,364 | $16–23 billion | |
| RCRA | 2,844 | $32.4 billion | |
| UST | 87,983 | $11 billion | |
| DOE | 3,650 | $17.3–20.9 billion | |
| Other Federal Sites | > 3,000 | $15–22 billion | |
| State Sites | >23,000 | $5 billionb | |
| Total | >126,000 | $110–127 billionc | |
NOTE: Munitions were excluded from the DoD numbers, but some munitions are found under RCRA.
aCost figures are undiscounted 2010 dollars. The Committee’s cost-to-complete estimate is lower than EPA (2004) because some activities were excluded by the Committee (e.g., MMRP).
bFor State sites, assumed $20K/site.
cData presented as a range to reflect ranges presented in the original data sets. However, many programs simply provided a single estimate.
have not been investigated for possible contamination. There is overlap between some of the categories (e.g., some sites are counted under both the CERCLA and DoD or DOE categories), but in the Committee’s opinion this overlap is not significant enough to dismiss the conclusion that the total number of 126,000 is an underestimate. If more accurate numbers were desired, consistent information would need to be collected on the number of contaminated sites across the various programs.
No information is available on the total number of sites with contamination in place above levels allowing for unlimited use and unrestricted exposure, although the total is certainly greater than the number of sites tallied in Table 2-6. For the CERCLA program, many facilities have been delisted with contamination remaining in place at levels above unlimited use and unrestricted exposure (as much as half according to the Committee’s analysis of 80 delisted NPL facilities with groundwater contamination). Depending on state closure requirements, USTs are often closed with contamination remaining due to the biodegradability of petroleum hydrocarbons. Most of the DOE sites, including those labeled as “completed,”
contain recalcitrant contamination that in some cases could take hundreds of years to reach UU/UE levels.
A small percentage (about 12,000 or less than 10 percent) of the 126,000 sites are estimated by the Committee to be complex from a hydrogeologic and contaminant perspective. This total represents the sum of the remaining DoD, CERCLA, RCRA, and DOE sites and facilities, based on the assumption that many of the simpler sites in these programs have already been dealt with. Although the complexity of the typical RCRA facility can be debated, there are undoubtedly some UST, state, and other federal sites with complex hydrogeologic conditions or contaminants that were not included. This estimate is admittedly uncertain and based largely on the Committee’s experience with a wide range of hazardous waste sites. Data on the complexity of sites has not been tallied by any of the programs, and can only be gathered accurately through site-specific data from a random sampling of sites.
Approximately 10 percent of CERCLA facilities affect or significantly threaten public water supply systems, but similar information from other programs is largely unavailable. Surveys of groundwater quality report that 0.34 to 1 percent of raw water samples from wells used for drinking water (including public supply and private wells) contain mean VOC concentrations greater than the MCL, although there are no data linking these MCL exceedances to specific hazardous waste sites. The percentage of drinking water wells with samples containing low-level VOC concentrations is likely to be higher for areas in close proximity to contaminated sites, for urban rather than rural areas, and in shallow unconfined sandy aquifers.
Information on cleanup costs incurred to date and estimates of future costs, as shown in Table 2-6, are highly uncertain. Despite this uncertainty, the estimated “cost to complete” of $110-$127 billion is likely an underestimate of future liabilities. Remaining sites include some of the most difficult to remediate sites, for which the effectiveness of planned remediation remains uncertain given their complex site conditions. Furthermore, many of the estimated costs (e.g., the CERCLA figure) do not fully consider the cost of long-term management of sites that will have contamination remaining in place at high levels for the foreseeable future.
The nomenclature for the phases of site cleanup and cleanup progress are inconsistent between federal agencies, between the states and federal government, and in the private sector. Partly because of these inconsistencies, members of the public and other stakeholders can and have confused the concept of “site closure” and NPL deletion with achieving UU/UE goals
for the site, such that no further monitoring or oversight is needed. In fact, many sites thought of as “closed” and considered “successes” will require oversight and funding for decades and in some cases hundreds of years to remain protective. CERCLA and other programs have reduced public health risk from groundwater contamination by preventing unacceptable exposures in water or air, but not necessarily by reducing contamination to levels allowing for unlimited use and unrestricted exposure for every contaminant throughout the affected aquifers.
More consistent and transparent terminology that simply and clearly differentiates the discrete phases of remediation and facilitates logical tracking of progress would improve communication with the public. Improvements in terminology among state and federal regulators and PRPs are particularly important in the later stages of remediation. For example, once a remedy has been implemented and operated for some time, classifying the site as a “long-term management site,” rather than deleting it from the NPL or classifying it as “closed,” would more accurately communicate its status. Sites that attain contaminant concentrations consistent with unlimited use and unrestricted exposure could be classified as “unrestricted-use sites.” These classifications would directly reflect progress toward the goals of most state and federal groundwater cleanup programs.
Canter, L. W., and D. A. Sabatini. 1994. Contamination of public ground water supplies by Superfund sites. International Journal of Environmental Studies 46(1):35-57.
Conger, J. 2011. Memo: New goals for DERP. July 18, 2011.
DEPARC. 2010. Fiscal Year 2009 Defense Environmental Programs Annual Report to Congress, April. Page C-1-1.
DeSimone, L. A., P. A. Hamilton, and R. J. Gilliom. 2009. Quality of water from domestic wells in principal aquifers of the United States, 1991–2004. Overview of major findings. U.S. Geological Survey Circular 1332, 48 pp.
DoD (Department of Defense). 2012. Manual Number 4715.20. Defense Environmental Restoration Program (DERP) Management.
DOE (Department of Energy). 2011. FY2011 Budget Vol. 5 (pages 60-71).
DOE. 2012a. FY2012 Budget Vol. 5 (page 12).
DOE. 2012b. FY2012 Budget Vol. 2 (page 74).
DOE. 2012c. FY2012 Budget Vol. 1 (page 282).
EPA (U.S. Environmental Protection Agency). 1993. Evaluation of the Likelihood of DNAPL Presence at NPL Sites: National Results. EPA 540R-93-073. Washington, DC: EPA Office of Solid Waste and Emergency Response.
EPA. 1996a. Memorandum from Steven A. Herman, Assistant Administrator, Office of Enforcement and Compliance Assurance, and Elliot Laws, Assistant Administrator for Solid Waste and Emergency Response, to EPA Regions. Re: Coordination between RCRA Corrective Action and Closure and CERCLA Site Activities at 2 (September 24, 1996).
EPA. 1996b. EPA Superfund Record of Decision for Schofield Barracks.
EPA. 2000. National Water Quality Inventory: 2000 Report. http://www.epa.gov/305b/2000report/.
EPA. 2002. Community Water System Survey 2000. EPA 815-R-02-005B. Washington, DC: EPA Office of Water.
EPA. 2004. Cleaning up the Nation’s Waste Sites: Markets and Technology Trends. Washington, DC: EPA Office of Solid Waste and Emergency Response.
EPA. 2007. Technologies for Site Cleanup: Annual Status Report (Twelfth Edition). EPA-542-R-07-012. Washington, DC: EPA Office of Solid Waste and Emergency Response.
EPA. 2008. Facilities on the RCRA 2008 GPRA Corrective Action Baseline. http://www.epa.gov/epawaste/hazard/correctiveaction/pdfs/base08fc.pdf. Accessed August 16, 2012.
EPA. 2009a. Semi-Annual Report of UST Performance Measures End of Fiscal Year 2009. http://www.epa.gov/oust/cat/ca_09_34.pdf.
EPA. 2009b. The Analysis of Regulated Contaminant Occurrence Data from Public Water Systems in Support of the Second Six-Year Review of National Primary Drinking Water Regulations. EPA 815-B-09-006. Washington, DC: EPA.
EPA. 2009c. DNAPL Remediation: Selected Projects Where Regulatory Closure Goals Have Been Achieved. EPA 542/R-09/008. Washington, DC: EPA Office of Solid Waste and Emergency Response.
EPA. 2010a. Region 9 Online Site Description. http://yosemite.epa.gov/r9/sfund/r9sfdocw.nsf/7508188dd3c99a2a8825742600743735/1818fba2414310dc88257007005e9452!OpenDocument#descr. Accessed August 2010.
EPA. 2010b. Superfund Remedy Report, Thirteen Edition. EPA 542-R-10-004. Washington, DC: EPA Office of Solid Waste and Emergency Response.
EPA. 2011a. Semi-Annual Report of UST Performance Measures End of Fiscal Year 2011. http://www.epa.gov/oust/cat/ca_11_34.pdf.
EPA. 2011b. The National LUST Cleanup Backlog: A Study of Opportunities. Washington, DC: EPA OUST.
EPA. 2011c. Close Out Procedures for National Priorities List Sites at 1-2. OSWER Directive 9320.222. http://epa.gov/superfund/programs/npl_hrs/closeout/pdf/2011guidance.pdf.
GAO (Government Accountability Office). 2008. Hardrock Mining. Information on Abandoned Mines and Value and Coverage of Financial Assurances on BLM Land. GAO-08-574T. Washington, DC: GAO.
GAO. 2009. Superfund: Litigation Has Decreased and EPA Needs Better Information on Site Cleanup and Cost Issues to Estimate Future Program Funding Requirements. GAO-09-656. Washington, DC: GAO.
Georgia Environmental Protection Division. 2010. Hazardous Site Inventory Introductory Information. http://www.georgiaepd.org/Files_PDF/gaenviron/hazwaste/intro.pdf.
Hunter, P. 2006. DoD-Wide Occurrence of Emerging COCs in Groundwater & Soil. SERDP-ESTCP Partners Symposium 2006, Washington, DC, November.
ITRC (Interstate Technology and Regulatory Council). 2009. Evaluating LNAPL Remedial Technologies for Achieving Project Goals. Washington, DC: ITRC.
Land, M., J. T. Kulongoski, and K. Belitz. 2011. Status of Groundwater Quality in the San Fernando–San Gabriel Study Unit, 2005. California GAMA Priority Basin Project. Scientific Investigations Report 2011–5206. U.S. Geological Survey.
NRC (National Research Council). 1999. Groundwater and Soil Cleanup. Washington, DC: National Academy Press.
NRC. 2009. Advice on the Department of Energy’s Cleanup Technology Roadmap. Washington, DC: The National Academies Press.
OUSD (Office of the Under Secretary of Defense for Acquisition, Technology and Logistics). 2011. FY10 Defense Environmental Programs Annual Report to Congress: Final Report, July 2011.
Rowe, B. L., P. L. Toccalino, M. J. Moran, J. S. Zogorski, and C. V. Price. 2007. Occurrence and potential human-health relevance of volatile organic compounds in drinking water from domestic wells in the United States. Environmental Health Perspectives 115(11):1539-1546.
SCRD (State Coalition for the Remediation of Dry Cleaners). 2010a. May 2010 newsletter. http://www.drycleancoalition.org/download/news0510.pdf.
SCRD. 2010b. December 2010 newsletter. http://drycleancoalition.org/download/news1210.pdf.
Toccalino, P. L., and J. A. Hopple. 2010. The Quality of Our Nation’s Waters—Quality of Water from Public-Supply Wells in the United States, 1993–2007—Overview of major findings. U S. Geological Survey Circular 1346, 58 pp.
Toccalino, P. L., J. E. Norman, and K. J. Hitt. 2010. Quality of Source Water from Public-Supply Wells in the United States, 1993–2007. U.S. Geological Survey Scientific Investigations Report 2010-5024, 206 pp.
U.S. Army Environmental Command. 2007. Second Five-Year Review Report for Operable Units 2 and 4, Schofield Army Barracks, Sites 12 and 19.
Zogorski, J. S., J. M. Carter, T. Ivahnenko, W. W. Lapham, M. J. Moran, B. L. Rowe, P. J. Suillace, and P. L. Toccalino. 2006. The Quality of Our Nation’s Waters—Volatile Organic Compounds in the Nation’s Ground Water and Drinking-Water Supply Wells. U.S. Geological Survey Circular 1292, 101 pp.


