
3
Who Breastfeeds in the United States?
Although this volume focuses on the physiologic process of lactation, lactation occurs only in the context of the behavior breastfeeding. Virtually all mothers are physiologically capable of lactation, but not all of them decide to breastfeed their infants; those who breastfeed do so with varying degrees of intensity and continue for different lengths of time. The subcommittee examined the distribution of mothers who breastfeed in order to determine whether or not findings on nutrition during lactation apply equally across the population. It also examined trends over the past several decades and relationships between the demographics of breastfeeding and maternal diet (see Chapter 4) to identify those segments of the population for which information on nutrition during lactation is most crucial. These demographic data can also suggest the best ways to present information on nutrition during lactation to reach target audiences as a part of a national effort to increase rates of breastfeeding in the United States (DHHS, 1984).
In this discussion, the incidence of breastfeeding in the hospital or within the first week of life is used to indicate the percentage of women who initiated breastfeeding.
HISTORY OF BREASTFEEDING IN THE UNITED STATES
Before 1970
During the twentieth century, infant-feeding practices have undergone dramatic changes that reflect shifts in values and attitudes in the U.S. society as
a whole. They have tended to occur first among those women at the forefront of changes in dominant social values and among those with the resources (whether it is time, energy, or money) to permit adoption of new feeding practices.
Examples of alternative feeding practices, such as the use of wet nurses or human milk substitutes, occur throughout recorded history (Fildes, 1986). The early twentieth century was marked, however, by an unprecedented increase in formula feeding, in part because the development of nutrition science coincided with a pervasive increase in the value placed on scientific products and processes (Rosenberg, 1976; Starr, 1982). As women asserted their rights for self-determination in public life, those who were wealthy enough and sufficiently in tune with contemporary values were adopting formula feeding for their infants.
A corresponding and consistent decline in breastfeeding is evident in data from U.S. fertility surveys (Hendershot, 1980, 1981; Hirschman and Hendershot, 1979), specific studies of infant feeding (Meyer, 1958, 1968), and market research surveys conducted by Ross Laboratories, 1 a manufacturer of infant formula (Martinez and Krieger, 1985; Martinez and Nalezienski, 1979, 1981; Martinez et al., 1981). Seventy-seven percent of the infants born between 1936 and 1940 were breastfed; the incidence declined during the subsequent decades to about 25% by 1970 (Hendershot, 1980, 1981; Hirschman and Hendershot, 1979; Meyer, 1958, 1968). Duration of breastfeeding declined as well, dropping from a mean of 4.2 months in the early 1930s to 2.2 months in the late 1950s.
Because this decline in breastfeeding was not uniform in all segments of the U.S. population, the demographic characteristics of the group of mothers who breastfed changed substantially (Table 3-1). Ethnic differences in rates of decline are especially striking. Rates fell sharply among blacks; there was a less pronounced decline among whites and Hispanics (Hirschman and Hendershot,
1979). Before 1960, black mothers were more likely than white mothers to breastfeed. After 1960, the reverse was true because of the more rapid decline among black mothers.
The trends are somewhat more complex for mothers with different educational levels. In the 1950s breastfeeding rates were lower for women with a high school education than for those with more or less education, but by 1970, these rates varied directly with education (Hendershot, 1981; Hirschman and Hendershot, 1979). According to some observers (Meyer, 1968; Salber et al., 1958), the differences in trends for women with different educational levels represent the trickling down of values and behaviors from economically and socially advantaged women to less advantaged women. Those observers conclude that women with less education adopted formula feeding as the culmination of a trend initiated by better educated mothers earlier in the century.
Turnaround in the 1970s
The overall downward trend in breastfeeding incidence reached its nadir at 22% in 1972 (Hendershot, 1981) (Figure 3-1). The subsequent increase was not uniform across the population. Breastfeeding incidence rose among white and black mothers, although the increase was greater among whites (Hendershot, 1981). Although data on Hispanic mothers are incomplete, there are indications that their breastfeeding incidence remained stable or even continued to fall (Smith et al., 1982). The incidence rose in all education groups (Hendershot, 1981; Martinez and Nalezienski, 1981; Martinez et al., 1981). There are few data on the association between breastfeeding and income. Those from the National Survey of Family Growth indicate that breastfeeding rates remained unchanged among low-income mothers but increased among those with middle and higher incomes (Hendershot, 1981).
Duration of breastfeeding increased after 1972 as well. Approximately 10% of breastfeeding mothers continued the practice for at least 3 months in 1972, whereas approximately 20% did so in 1975 and 37% did so in 1984 (Hendershot, 1981; Martinez and Krieger, 1985; Martinez and Nalezienski, 1981; Martinez et al., 1981).
Ironically, this return to breastfeeding in the 1970s parallelled its decline in the early twentieth century. Once again, women of higher socioeconomic status were the first to adopt a "new" feeding method (breastfeeding), and their rationale was couched in scientific language, this time, focused on such issues as immunologic factors and maternal-infant bonding. Reflecting broader cultural values, many women adopted natural childbirth and, with it, what they considered natural infant feeding.
The upward trend in breastfeeding after 1972 appeared to peak in 1982 at about 61% for initiation and 40% for the percentage of mothers breastfeeding 3 months or longer. The exact zenith of the trend is difficult to pinpoint, because
TABLE 3-1 Percentages of First-Born Infants Breastfed Between 1951 and 1970 in the United States, by Ethnic Group and Educationa
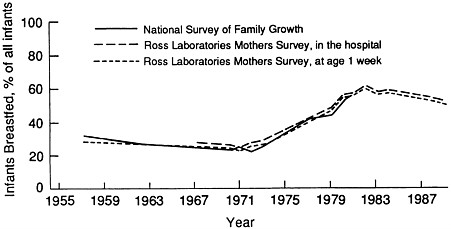
FIGURE 3-1 Percentage of infants breastfed, by survey and year, based on data from the National Survey of Family Growth (Hendershot, 1981; Pratt et al., 1984) and A. Ryan, Ross Laboratories, personal communication, 1990. Both government and market survey data are presented to show the similarity in trends found. Government data are not available after 1981. The subcommittee considers the Ross Laboratories data to be the more reliable source. Those data are collected quarterly, and annual rates are computed from a nationally representative sample of mothers of 6-month-old infants. The government data were derived from three surveys of women aged 15 to 44 who were ever married or who were single with coresident children at the time of the interview. Data on breastfeeding were gathered for all infants born to the respondents. Because no women aged 45 or older were interviewed, data for the earliest years are biased toward the practices of women who were young at the time. Hendershot (1980) reviews the strengths and weaknesses of these data sources in detail.
Ross Laboratories changed its weighting procedures to obtain a better reflection of the socioeconomic makeup of the U.S. population (Martinez and Krieger, 1985), and data for the 1980s from the National Survey of Family Growth were not yet available for the subcommittee's use. The evidence from Ross Laboratories suggests a gradual, persistent decline in breastfeeding during the 1980s.
CURRENT STATISTICS FOR BREASTFEEDING IN THE UNITED STATES
1989 Data
The initiation of breastfeeding by women delivering in 1989 was reported to be 52.2% (Table 3-2) (A. Ryan, Ross Laboratories, personal communication, 1990). By age 5 or 6 months,2 only 19.6% of the infants were still breastfed. Of the three ethnic groups compared, white mothers initiated breastfeeding at the highest rates and black mothers did so at the lowest rates. Forty percent of white mothers who initiated breastfeeding were still breastfeeding at 5 or 6 months, compared with approximately 30% of black or Hispanic mothers. A breakdown of these data by parity indicates that, except among Hispanics, primiparous and multiparous women initiate breastfeeding at about the same rates, but the former breastfeed for a shorter duration. The data also show that married mothers are much more likely than unmarried mothers to breastfeed and that they experience a far lower rate of attrition by 5 to 6 months. This difference is especially pronounced among black mothers.
Higher percentages of older mothers initiate breastfeeding, and they continue for a longer duration than younger mothers do. Breastfeeding both in the hospital and at 5 or 6 months is positively associated with maternal education and family income. Mothers with any college education are especially likely to initiate breastfeeding. Black mothers with a high school education or less initiate breastfeeding only about half as often as college educated black mothers do.
A breakdown of breastfeeding by census region shows distinct regional trends. The highest rates for initiating breastfeeding (Figure 3-2 [in the hospital]) and at 5 or 6 months post partum (Figure 3-3) are found in the Mountain and Pacific regions; rates in the East South Central region are the lowest. Ethnic differences within census regions are the same as those seen in national data.
The Ross Laboratories data on participants in the Special Supplemental Program for Women, Infants, and Children (WIC) indicate that 34% breastfeed
TABLE 3-2 Percentage of Mothers Breastfeeding Newborn Infants in the Hospital and Infants at 5 or 6 Months of Age in the United States in 1989,a by Ethnic Background and Selected Demographic variablesb
|
|
Total |
White |
Black |
Hispanicc |
||||
|
Category |
Newborns |
5–6 mo Infants |
Newborns |
5–6 mo Infants |
Newborns |
5–6 mo Infants |
Newborns |
5–6 mo Infants |
|
All mothers |
52.2 |
19.6 |
58.5 |
22.7 |
23.0 |
7.0 |
48.4 |
15.0 |
|
Parity |
||||||||
|
Primiparous |
52.6 |
16.6 |
58.3 |
18.9 |
23.1 |
5.9 |
49.9 |
13.2 |
|
Multiparous |
51.7 |
22.7 |
58.7 |
26.8 |
23.0 |
7.9 |
47.2 |
16.5 |
|
Marital status |
||||||||
|
Married |
59.8 |
24.0 |
61.9 |
25.3 |
35.8 |
12.3 |
55.3 |
18.8 |
|
Unmarried |
30.8 |
7.7 |
40.3 |
9.8 |
17.2 |
4.6 |
37.5 |
8.6 |
|
Maternal age |
||||||||
|
<20 yr |
30.2 |
6.2 |
36.8 |
7.2 |
13.5 |
3.6 |
35.3 |
6.9 |
|
20–24 yr |
45.2 |
12.7 |
50.8 |
14.5 |
19.4 |
4.7 |
46.9 |
12.6 |
|
25–29 yr |
58.8 |
22.9 |
63.1 |
25.0 |
29.9 |
9.4 |
56.2 |
19.5 |
|
30–34 yr |
65.5 |
31.4 |
70.1 |
34.8 |
35.4 |
13.6 |
57.6 |
23.4 |
|
≥35 yr |
66.5 |
36.2 |
71.9 |
40.5 |
35.6 |
14.3 |
53.9 |
24.4 |
|
Maternal education |
||||||||
|
No college |
42.1 |
13.4 |
48.3 |
15.6 |
17.6 |
5.5 |
42.6 |
12.2 |
|
Colleged |
70.7 |
31.1 |
74.7 |
34.1 |
41.1 |
12.2 |
66.5 |
23.4 |
|
Family income |
||||||||
|
<$7,000 |
28.8 |
7.9 |
36.7 |
9.4 |
14.5 |
4.3 |
35.3 |
10.3 |
|
$7,000–$14,999 |
44.0 |
13.5 |
49.0 |
15.2 |
23.5 |
7.3 |
47.2 |
13.0 |
|
$15,000–-$24,999 |
54.7 |
20.4 |
57.7 |
22.3 |
31.7 |
8.7 |
52.6 |
16.5 |
|
≥$25,000 |
66.3 |
27.6 |
67.8 |
28.7 |
42.8 |
14.5 |
65.4 |
23.0 |
|
Maternal employment |
||||||||
|
Full time |
50.8 |
10.2 |
54.8 |
10.8 |
30.6 |
6.9 |
50.4 |
9.5 |
|
Part time |
59.4 |
23.0 |
63.8 |
25.5 |
26.0 |
6.6 |
59.4 |
17.7 |
|
Not employed |
51.0 |
23.1 |
58.7 |
27.5 |
19.3 |
7.2 |
46.0 |
16.7 |
|
U.S. census region |
||||||||
|
New England |
52.2 |
20.3 |
53.2 |
21.4 |
35.6 |
5.0 |
47.6 |
14.9 |
|
Middle Atlantic |
47.4 |
18.4 |
52.4 |
21.8 |
30.6 |
9.7 |
41.4 |
10.8 |
|
East North Central |
47.6 |
18.1 |
53.2 |
20.7 |
21.0 |
7.2 |
46.2 |
12.6 |
|
West North Central |
55.9 |
19.9 |
58.2 |
20.7 |
27.7 |
7.9 |
50.8 |
22.8 |
|
South Atlantic |
43.8 |
14.8 |
53.8 |
18.7 |
19.6 |
5.7 |
48.0 |
13.8 |
|
East South Central |
37.9 |
12.4 |
45.1 |
15.0 |
14.2 |
3.7 |
23.5 |
5.0 |
|
West South Central |
46.0 |
14.7 |
56.2 |
18.4 |
14.5 |
3.8 |
39.2 |
11.4 |
|
Mountain |
70.2 |
30.4 |
74.9 |
33.0 |
31.5 |
11.0 |
53.9 |
18.2 |
|
Pacific |
70.3 |
28.7 |
76.7 |
33.4 |
43.9 |
15.0 |
58.5 |
19.7 |
|
a Mothers were surveyed when their infants were 6 months of age. They were asked to recall the method of feeding the infant when in the hospital, at age 1 week, at months 1 through 5, and on the day preceding completion of the survey. Numbers in the columns labeled "5–6 mo Infants" are an average of the 5-month and previous day responses. b From A. Ryan, Ross Laboratories, personal communication, 1990. c Hispanic is not exclusive of white or black. d College includes all women who reported completing at least 1 year of college. |
||||||||
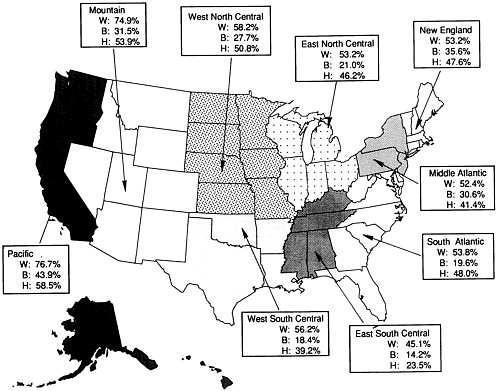
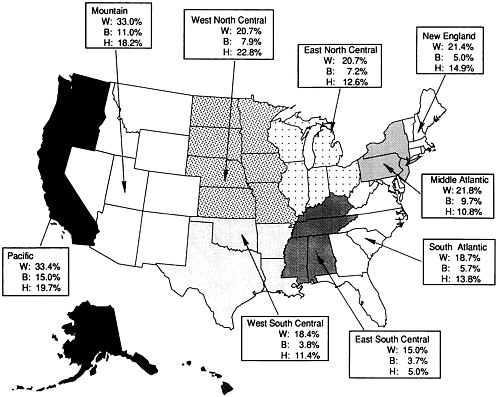
TABLE 3-3 Percentage of Mothers Breastfeeding Newborn Infants in the Hospital and at 5 or 6 Months of Age in 1989,a by Participation in the Special Supplemental Food Program for Women, Infants, and Children (WIC) and Selected Demographic Variablesb
|
|
WICc |
Non-WIC |
||
|
Category |
Newborns |
5–6 mo Infants |
Newborns |
5–6 mo Infants |
|
All mothers |
34.2 |
9.2 |
62.9 |
25.7 |
|
Ethnic group |
||||
|
White |
41.3 |
11.2 |
65.0 |
27.1 |
|
Black |
17.9 |
4.8 |
36.7 |
12.3 |
|
Hispanic |
39.1 |
10.7 |
58.9 |
19.8 |
|
Maternal age |
||||
|
<20 yr |
26.2 |
4.2 |
40.8 |
10.9 |
|
20–24 yr |
34.2 |
8.0 |
55.8 |
16.9 |
|
25–29 yr |
40.3 |
13.3 |
64.8 |
25.9 |
|
30–34 yr |
42.3 |
18.1 |
70.2 |
34.0 |
|
≥35 yr |
42.5 |
19.2 |
71.5 |
39.6 |
|
Maternal education |
||||
|
No college |
31.1 |
7.8 |
52.5 |
18.4 |
|
College |
50.7 |
16.5 |
74.6 |
33.9 |
|
a See footnote a of Table 3-2. b From A. Ryan, Ross Laboratories, personal communication, 1990. c Includes all mothers who reported that either they or their infant had participated in the WIC program since the birth of that infant. |
||||
and 9% continue the practice for at least 5 or 6 months (Table 3-3). The demographic patterns observed in this group are the same as those in the general population: higher rates of breastfeeding are reported for white women, older women, and those with some college education. Except for the Ross Laboratories data, there are only sparse data on breastfeeding rates among the national WIC population. A comparison of WIC and non-WIC respondents in the Ross Laboratories surveys shows consistently lower rates of breastfeeding among WIC mothers. However, these differences are likely due to differences in income and other sociodemographic variables. Rush et al. (1988) found no difference between WIC and non-WIC women in the rates of breastfeeding when women with similar levels of socioeconomic status were compared.
Limitations of the Data
There are no data on the total length of breastfeeding (actual duration) and the ages at which other milk or foods are added to the infant's diet. For example, it is not known how much longer the 20% of women in the Ross Laboratories survey still breastfeeding their 5- to 6-month old infants will
continue breastfeeding. Neither is it known how many of the breastfed infants are exclusively breastfed and how many are partially breastfed. The lack of these data makes it difficult to calculate the amounts of nutrients delivered to the infant in human milk as well as the nutritional cost of milk synthesis to the mother. The increased incidence of breastfeeding from 1969 to 1980 (Forman et al., 1985) appears to be accounted for primarily by women who chose exclusive breastfeeding (and not partial breastfeeding) over bottle feeding. Thus, the total amount of nutrients delivered in human milk to the infant would have been different on average for lactating women in 1969 and 1980.
At present, data are inadequate for documenting breastfeeding rates among several subgroups of the U.S. population of particular interest to health care providers. These include Hispanics, Southeast Asians, and working mothers.
Hispanic Mothers
There are no nationwide data on recent trends in breastfeeding incidence and duration among Hispanic women because, until recently, the percentage of Hispanic women in nationwide surveys has been too small for analysis. For example, Ross Laboratories first published data on Hispanic women in their 1986 survey (Ryan and Martinez, 1987). Furthermore, the Hispanic population in the United States is heterogeneous; it includes people who trace their origin or descent from Cuba, Puerto Rico, Mexico, other Latin American countries, and Spain. The incidence of breastfeeding in this population has been reported in different studies to range from 10 to 60% (Bryant, 1982; Dungy, 1989; John and Martorell, 1989; Kokinos and Dewey, 1986; Rassin et al., 1984; Romero-Gwynn and Carias, 1989; Samuels et al., 1985; Scrimshaw et al., 1987; Seger et al., 1979; Smith et al., 1982; Young and Kaufman, 1988). These large differences may reflect the ethnic heterogeneity, the area of the United States in which the women now reside, time since migration to the United States, or research design differences in the surveys.
Perhaps the best data for Hispanic women exist for Mexican-American mothers. John and Martorell (1989) analyzed data from the Mexican-American component of the Hispanic Health and Nutrition Examination Survey conducted between 1982 and 1984. The investigators noted a substantial recent increase in breastfeeding incidence—from 30.7% in 1970 to 1974, to 38.1% in 1975 to 1978, and to 47.6% in 1979 to 1982. When all years in which births were reported were combined, breastfeeding incidence was higher for those with higher annual household incomes, advanced maternal age, infants with birth weights greater than 2.5 kg, and a choice of Spanish as the interview language. Education of the household head has a curvilinear relationship to breastfeeding incidence: incidence is highest among those with more than 12 years of education, lowest for those with 9 to 12 years, and intermediate for those with less than 9 years.
Southeast Asian Mothers
With the influx of Southeast Asian immigrants into the United States, there has been increasing concern about their nutrition and their infant-feeding practices. Although the number of Southeast Asian mothers has been too small to produce definitive data in national surveys, the experience of health care professionals in areas where these mothers are highly concentrated indicates that (1) the incidence of breastfeeding has dropped in the years since the first Southeast Asian immigrants arrived and (2) rates are now lower for Southeast Asians than they are for other minority groups in the same geographic areas of the country (Fishman et al., 1988; Romero-Gwynn, 1989). Although this may reflect in part the changing composition of the Southeast Asian population in the United States over time, virtually all mothers in these studies reported breastfeeding their children born in Southeast Asia. This suggests that the apparent decline in breastfeeding is real.
Employed Mothers
There are no statistics that adequately compare the incidence and duration of breastfeeding by mothers who work outside the home and those who do not. Ryan and Martinez (1989) attempted to make this comparison by using the Ross Laboratories data for 1987, but their analysis provides only limited information about the infant-feeding practices of women in the labor force (see Table 3-4). In that study, mothers were classified as "employed full time" or "not working" based on their response to a question on employment status when their infants were 6 months of age. Mothers working part time were excluded. The investigators determined the rates of breastfeeding for these two groups both when their infants were newborns (in the hospital) and when they were 6 months old. From these data, they calculated a breastfeeding continuance rate, that is, the percentage of women who initiated breastfeeding who were still breastfeeding when their infants reached 6 months of age.
Ryan and Martinez (1989) reported that identical proportions (54.5%) of women in both employment categories initiated breastfeeding. By 6 months, however, 10% of the employed mothers were still breastfeeding compared with 24.3% of those who were not working. When these data are broken down by sociodemographic variables, trends generally follow those seen in the population as a whole. As described above, women in the Mountain and Pacific regions were more likely to initiate breastfeeding than were those living in other regions, regardless of their employment status.
One intriguing finding is that at 6 months post partum, more black mothers in the "employed full time" category than in the "not working" category had initiated breastfeeding (32.7% compared with 21.2%, respectively). This contrasts with whites, who initiated breastfeeding at similar rates (58.9 and
62.3%, respectively) whether or not they would be employed outside the home at 6 months post partum.
At 6 months after delivery, sociodemographic differences were not associated with breastfeeding continuance rates among employed mothers. At this stage, employed black mothers breastfed at the same rate as white mothers; this was higher than expected for black mothers, considering their generally shorter duration of breastfeeding.
There are no data relating breastfeeding to prenatal employment or prenatal intentions to breastfeed. Ryan and Martinez (1989) did not include the 15% of mothers employed part time in their sample; many of these women may use part-time employment as a strategy to accommodate breastfeeding.
Kurinij and colleagues (1989) examined the effect of intention to return to work outside the home on breastfeeding among mothers in Washington, D.C. Among blacks, but not whites, more mothers who intended to return to work part time initiated breastfeeding than those who intended to return full time. In examining duration of breastfeeding, they found that professional women returning to work breastfed longer than women working in other occupations did, and those employed part time breastfed longer than those in full-time work did. Among white women only, the later the return to work, the longer the duration of breastfeeding. In general, they found breastfeeding duration to be shorter among blacks than whites. This finding may differ from that of Ryan and Martinez (1989) because of the high socioeconomic status of the whites studied by Kurinij and associates (1989).
DETERMINANTS OF BREASTFEEDING DISTRIBUTION
Wide variation in research designs limits the extent to which the subcommittee could separate determinants of the types of infant feeding. As was clear from the results of Ryan and Martinez (1989) for working mothers, it is difficult to attribute causation from observed associations (Simopoulos and Grave, 1984; Winikoff, 1981). Because ethnic origin is strongly associated with income and education, it is difficult to differentiate the effects of socioeconomic status from ethnic origin. Ethnographic, marketing, and other qualitative methods can be useful for eliciting mothers' own reasons for choosing breast or formula feeding. Much of this work consists of single case studies in a particular population. Thus, there is a need to validate such results.
Ethnic Groups
Black Mothers
The reason why black mothers breastfeed less often than whites is not apparent from the results of correlation studies that relate marital status, parity, and income—variables known to be associated with infant feeding in the general
TABLE 3-4 Newborn Infants Breastfed in the Hospital and at 6 Months of Age, and Breastfeeding Continuance Rate, Among Mothers Employed Full Time and Mothers Not Employeda,b
|
|
Newborn Infants Breastfed in the Hospital, % |
Infants Breastfed in the Hospital at Age 6 mo, % |
Breastfeeding Continuance Rate, %c |
|||
|
Variable |
Mothers Employed Full Time |
Mothers Not Employed |
Mothers Employed Full Time |
Mothers Not Employed |
Mothers Employed Full Time |
Mothers Not Employed |
|
All mothers |
||||||
|
Maternal age |
54.5 |
54.5 |
10.0 |
24.3 |
18.3 |
44.6 |
|
<20 yr |
38.4 |
33.4 |
4.5 |
7.5 |
11.7 |
22.5 |
|
20–24 yr |
47.9 |
49.6 |
5.8 |
17.7 |
12.1 |
35.7 |
|
25–29 yr |
57.5 |
63.2 |
9.7 |
31.0 |
16.9 |
49.1 |
|
30–34 yr |
61.1 |
68.4 |
14.5 |
39.3 |
23.7 |
57.5 |
|
≥35 yr |
61.1 |
66.1 |
20.0 |
40.4 |
32.7 |
61.1 |
|
Family income |
||||||
|
<$7,000 |
34.3 |
31.0 |
5.6 |
8.3 |
16.3 |
26.8 |
|
$7,000–$15,000 |
40.5 |
49.4 |
6.4 |
19.2 |
15.8 |
38.9 |
|
$15,001–$25,000 |
49.7 |
62.4 |
8.1 |
29.1 |
16.3 |
46.6 |
|
>$25,000 |
63.1 |
72.9 |
12.5 |
38.2 |
19.8 |
52.4 |
U.S. population—to the breastfeeding practices of blacks (Kurinij et al., 1988; Rassin et al., 1984). Ethnic background and education are highly correlated; their independent effects on breastfeeding practices are difficult to distinguish.
In a study of economically disadvantaged women delivering in Texas, Baranowski et al. (1986) found that issues of personal convenience and benefits for infants differentiated black mothers who intended to breastfeed from those who intended to bottle feed. Breastfeeders were more likely to agree that breastfeeding is best for infant health, is more nutritious, and brings mother and infant closer together. They were more likely to disagree with statements that breastfeeding ties a mother down and that bottle feeding is more convenient.
Comparing black and white mothers, Baranowski et al. (1986) found that attitudes toward issues of social convenience predicted whether or not white but not black women breastfed. In particular, white women who breastfed disagreed with statements that breastfeeding in public is embarrassing and that it would make it difficult for the mother to see friends, while white women who bottle fed agreed with them. These statements did not differentiate the black breastfeeders and bottle feeders. Bailey (1990) obtained similar results when comparing black and white WIC clients from a variety of sites in the southeastern United States. Compared with black mothers, white mothers were more likely to identify embarrassment and offending others who might observe their breastfeeding as issues in the decision of whether or not to breastfeed.
Hispanic Mothers
Most surveys exploring the determinants of breastfeeding among Hispanic mothers have linked higher breastfeeding rates to immediate postnatal factors, such as early initiation of breastfeeding, extended maternal-infant contact, and vaginal rather than cesarean delivery (Romero-Gwynn and Carias, 1989; Scrimshaw et al., 1987). Mothers born in Mexico are more likely to breastfeed than are those born in the United States, especially those with previous infants born in Mexico (Kokinos and Dewey, 1986; Romero-Gwynn and Carias, 1989). Romero-Gwynn and Carias (1989) and Scrimshaw et al. (1987) found that mothers who did not intend to work were more likely to breastfeed than were those who intended to work.
Using qualitative ethnographic strategies to study breastfeeding determinants among Hispanic mothers, Bryant (1982) found that positive attitudes of kin and friends toward breastfeeding were associated with increased initiation of breastfeeding among mothers of Cuban and Puerto Rican descent. Using qualitative market research techniques in a study in California, Weller and Dungy (1986) reported similar responses from white and Hispanic mothers asked to characterize infant feeding practices, except that Hispanic women believed that (1) anger and other emotions can be transferred to the infant through the milk and cause damage to the infant and (2) the breastfeeding baby consumes a part
of the mother, thus causing the mother to age faster and deteriorate. Mothers were asked to rank the responses they used to characterize infant feeding in order of importance. When the responses were compared within groups defined by ethnic affiliation and feeding practices (white breastfeeders, white bottle feeders, Hispanic breastfeeders, and Hispanic bottle feeders), white mothers (especially breastfeeders) were very similar to each other, indicating a strongly consistent set of values attributed to breastfeeding and bottle feeding. Hispanic mothers differed far more among themselves. These findings indicate the existence of different underlying cultural patterns. Weller and Dungy (1986) suggest that the lack of a clear preference pattern in Hispanics may be characteristic of an ethnic group in transition.
Southeast Asian Mothers
Research to explain breastfeeding rates among Southeast Asian immigrants has been limited. Romero-Gwynn (1989) reported that receiving formula samples at hospital discharge was the only one of several predictors significantly associated with the decision to breastfeed or use formula. Anthropological investigation, however, shows the complexity of the issues surrounding the decision of whether or not to breastfeed (Fishman et al., 1988). Many women of Cambodian, Chinese, and Vietnamese descent subscribe to variations of a humoral ethnomedical system, derived from a philosophy of balance between such fundamental qualities of nature as hot and cold or wet and dry. Attempts to maintain or restore the body's equilibrium in these qualities often involves regulation of both maternal diet and postpartum behaviors. Foods consumed by the mother are believed to transmit particular qualities to a vulnerable breastfed infant. In the traditional context and environment of Southeast Asia, mothers reported that they frequently consumed foods that they believed could pass on harmful properties to their infants in their breast milk. However, because such foods were usually chosen and prepared by other family members, such conflicts between food beliefs and eating behavior were not considered important threats to infant well-being. With many of the elements of traditional social support absent, some immigrants to the United States exhibit a heightened sense of the importance of particular foods and their potential impact on the infant. Their dilemma is solved by feeding formula to the infant, allowing the mother the freedom to eat whatever she wishes. In addition, Southeast Asian women were reported to perceive bottle feeding as the U.S. norm and associate it with the general good health of U.S. infants (Fishman et al., 1988; Romero-Gwynn, 1989).
Employed Mothers
Few studies have been conducted to examine the effects of working outside the home on breastfeeding. On the whole, the demographic characteristics of
breastfeeding mothers employed outside the home are the same as those of breastfeeding mothers in the general population. However, the overall rate of breastfeeding is lower among employed mothers and the duration is shorter.
Mothers employed outside the home face special problems when breastfeeding their infants. A survey of employed breastfeeding mothers by Auerbach and Guss (1984) shows that excessive fatigue, the logistics of pumping and storing milk, the excessive time spent traveling to and from the baby during the workday, and concern about having an adequate milk supply were common problems in this group. These problems were compounded by lack of time to complete work duties and to eat properly.
These findings are not surprising in light of a survey of policies and practices to support breastfeeding mothers in the workplace (Moore and Jansa, 1987). The survey sought responses from 100 of the most profitable Fortune 500 companies and an additional 12 companies that were known to have breastfeeding support programs. All the Fortune 500 companies responding had maternal leave policies and guaranteed a return to an equivalent job. However, only about 33% offered flex-time or part-time work, only 14% allowed breastfeeding at work, and fewer than 5% allowed job sharing or provided day care. Most of the 12 companies known to support breastfeeding allowed flex time, part-time schedules, and job sharing. However, fewer than half provided a place for mothers to breastfeed, and none provided day care or permitted mothers breaks for breastfeeding.
In another study, Barber-Madden and colleagues (1987) reviewed published research as well as policy statements of professional groups such as the American Academy of Pediatrics (AAP, 1982) and identified six types of barriers to breastfeeding for employed mothers. They include (1) lack of child care at or near the workplace, (2) work environments that do not provide a place for pumping and storing milk, (3) restrictive employer policies that fail to provide adequate maternity leave and job security, (4) social attitudes of employers and coworkers toward breastfeeding that result in disapproval and harassment, (5) inadequate maternal knowledge about breastfeeding, and (6) lack of knowledge concerning breastfeeding on the part of health professionals, especially those in occupational health. These authors suggest both short- and long-term strategies for dealing with such barriers that would require economic commitments by employers or governments as well as the development of educational materials on breastfeeding targeted specifically at the problems of employed mothers.
Adolescent Mothers
The few small studies conducted on pregnant adolescents or adolescent mothers indicate that these adolescents may not differ substantially from older mothers in their selection of infant-feeding methods. In a survey of pregnant inner-city adolescents aged 12 to 19 years, investigators found that those
intending to breastfeed were likely to perceive more benefits of breastfeeding, desired more information about it, had supportive environments, had been breastfed themselves, and perceived relatively fewer barriers to breastfeeding than those who did not intend to breastfeed (Joffee and Radius, 1987; Radius and Joffee, 1988). Overall, perceived differences in benefits differentiated the potential breastfeeders from nonbreastfeeders better than did perceived barriers.
Baisch and associates (1989) found that 13- to 20-year-old low-income adolescents intending to breastfeed had more positive attitudes about breastfeeding than those who did not intend to breastfeed, especially if they had been breastfed themselves. Prenatal intentions were highly predictive of actual postnatal feeding practices.
Neifert and associates (1988b) found that among 129 breastfeeding mothers less than 18 years of age in Denver, 35% nursed for less than 1 month, 22% nursed for 1 to 2 months, and 43% nursed for 2 months or longer. The most common reason given for weaning in the first month was the ''inability of the infant to grasp the maternal nipple and nurse effectively" (Neifert et al., 1988b, p. 472). These infants were said to have had this problem in the hospital and continued to have it at home. Although 75% of these teenage mothers persevered by expressing milk and feeding it to the infant in a bottle, all weaned their infants by 1 month. None of the social and demographic variables studied (mother's age, ethnic group, intended duration of breastfeeding, social support) predicted the duration of breastfeeding. In a companion study, Neifert et al. (1988a) reported that gift packs containing formula presented upon hospital discharge had no observed effect on breastfeeding duration.
These results suggest that decisions on the timing of weaning are probably highly individual; the reasons for the decisions cannot accurately be determined from surveys.
Determinants of Breastfeeding Common to Different Subgroups
Some of the determinants of breastfeeding may be specific to selected segments of the U.S. population, whereas others are common to all. For example, maternal education is a common correlate of breastfeeding initiation and duration among blacks (Kurinij et al., 1988), whites (Rassin et al., 1984), and Hispanics (John and Martorell, 1989) and among mothers employed outside the home (Kurinij et al., 1989). Maternal education is also strongly related to attitudes toward breastfeeding (e.g., Dusdieker et al., 1985). However, the reasons for these associations are not clear. Formal education may be a measure of enculturation, since it provides exposure to, and promotes adoption of, major social values.
The studies reviewed above suggest that two categories of determinants influence the selection of the infant-feeding method: infant-feeding ideology and external constraints. Infant-feeding ideology includes beliefs about the efficacy
of different feeding methods and values placed on breastfeeding as compared with bottle feeding. Such ideology has idiosyncratic components based on personal experience, but it also has more general components derived from affiliation with a particular ethnic group or membership in other subcultures. External constraints include factors such as separation from the infant resulting from commitments outside the home and the demands of household and family responsibilities. Particular combinations of these constraints may be common to groups that cut across ethnic boundaries, for example, mothers working outside the home, adolescent mothers, and economically disadvantaged mothers.
CONCLUSIONS
-
Rates of breastfeeding have changed markedly during the twentieth century. Incidence and duration of breastfeeding in the United States fell during the 1950s and 1960s and then rose during the 1970s. In the early 1980s, rates peaked, and they have steadily decreased since then. Among groups who recently immigrated to the United States (such as Southeast Asians and some Hispanics), breastfeeding rates are declining even more rapidly.
-
Women who choose to breastfeed are not randomly distributed across the population. Such demographic variables as ethnic group affiliation, maternal age, and maternal education can largely account for variations in breastfeeding rates at the population level. However, infant-feeding practices reflect both personal and culture-specific ideologies as well as situational constraints. Thus, some breastfeeding mothers are found even among groups where breastfeeding is uncommon.
-
Clinicians may need to direct special attention to women at risk of possible nutritional problems associated with sociodemographic factors. For example, some adolescent mothers may have the same inadequate dietary status or eating disorders as other members of their age cohort. Economically disadvantaged mothers may have income levels that act as barriers to optimal nutrition during breastfeeding. Members of some ethnic groups may have culturally based restrictions on maternal diet or behavior that run counter to clinical advice. The ability of clinicians to identify and accommodate such potential obstacles may help ensure lactation that is nutritionally sound for both mothers and infants.
REFERENCES
AAP (American Academy of Pediatrics). 1982. The promotion of breastfeeding: policy statement based on task force report. Pediatrics 69:654-661.
Auerbach, K.G., and E. Guss. 1984. Maternal employment and breastfeeding. Am. J. Dis. Child. 138:956-960.
Bailey, D.F.C. 1990. Cultural Models of Infant Feeding: A Comparison of Euro- and African-American Mothers in the Southeastern United States. Thesis, M.S. University of Kentucky, Lexington, Kentucky. 156 pp.
Baisch, M.J., R.A. Fox, and B.D. Goldberg. 1989. Breastfeeding attitudes and practices among adolescents. J. Adol. Health Care 10:41-45.
Baranowski, T., D.K. Rassin, C.J. Richardson, J.P. Brown, and D.E. Bee. 1986. Attitudes toward breastfeeding. Dev. Behav. Pediatr. 7:367-372.
Barber-Madden, R., M.A. Petschek, and J. Pakter. 1987. Breastfeeding and the working mother: barriers and intervention strategies. J. Public Health Policy 8:531-541.
Bryant, C.A. 1982. The impact of kin, friend and neighbor networks on infant feeding practices. Soc. Sci. Med. 16:1757-1765.
DHHS (Department of Health and Human Services). 1984. Report of the Surgeon General's Workshop on Breastfeeding & Human Lactation. DHHS Publ. No. HRS-D-MC 84-2. Health Resources and Services Administration, Public Health Service, U.S. Department of Health and Human Services, Rockville, Md. 93 pp.
Dungy, C.I. 1989. Breastfeeding preference of Hispanic and Anglo women 1978-1985. Clin. Pediatr. 28:92-94.
Dusdieker, L.B., B.M. Booth, B.F. Seals, and E.E. Ekwo. 1985. Investigation of a model for the initiation of breastfeeding in primigravida women. Soc. Sci. Med. 20:695-703.
Fildes, V. 1986. Breast, Bottles and Babies: A History of Infant Feeding. University of Edinburgh Press, Edinburgh. 200 pp.
Fishman, C., R. Evans, and E. Jenks. 1988. Warm bodies, cool milk: conflicts in post partum food choice for Indochinese women in California. Soc. Sci. Med. 26:1125-1132.
Fomon, S.J. 1987. Reflections on infant feeding in the 1970s and 1980s. Am. J. Clin. Nutr. 46:171-182.
Forman, M.R., K. Fetterly, B.I. Graubard, and K.G. Wooton. 1985. Exclusive breastfeeding of newborns among married women in the United States: the National Natality Surveys of 1969 and 1980. Am. J. Clin. Nutr. 42:864-869.
Hendershot, G.E. 1980. Trends in Breast-Feeding. DHEW Publ. No. 80-1250. National Center for Health Statistics, Public Health Service, U.S. Department of Health, Education, and Welfare, Hyattsville, Md. 7 pp.
Hendershot, G.E. 1981. Trends and Differentials in Breast-Feeding in the United States, 1970-75. Working Paper Series No. 5. Family Growth Survey Branch, National Center for Health Statistics, Public Health Service, U.S. Department of Health and Human Services, Hyattsville, Md. 28 pp.
Hirschman, C., and G.E. Hendershot. 1979. Trends in Breast-Feeding Among American Mothers. Vital and Health Statistics, Series 23, No. 3. DHEW Publ. No. (PHS) 79-1979. National Center for Health Statistics, Public Health Service, U.S. Department of Health, Education, and Welfare, Hyattsville, Md. 39 pp.
Joffe, A., and S.M. Radius. 1987. Breast versus bottle: correlates of adolescent mothers' infant-feeding practices. Pediatrics 79:689-695.
John, A.M., and R. Martorell. 1989. Incidence and duration of breastfeeding in Mexican-American infants, 1970-1982. Am. J. Clin. Nutr. 50:868-874.
Kokinos, M., and K.G. Dewey. 1986. Infant feeding practices of migrant Mexican-American families in northern California. Ecol. Food Nutr. 18:209-220.
Kurinij, N., P.H. Shiono, and G.G. Rhoads. 1988. Breastfeeding incidence and duration in black and white women. Pediatrics 81:365-371.
Kurinij, N., P.H. Shiono, S.F. Ezrine, and G.G. Rhoads. 1989. Does maternal employment affect breastfeeding? Am. J. Public Health 79:1247-1250.
Martinez, G.A., and F.W. Krieger. 1985. 1984 Milk-feeding patterns in the United States. Pediatrics 76:1004-1008.
Martinez, G.A., and J.P. Nalezienski. 1979. The recent trend in breastfeeding. Pediatrics 64:686-692.
Martinez, G.A., and J.P. Nalezienski. 1981. 1980 Update: the recent trend in breastfeeding. Pediatrics 67:260-263.
Martinez, G.A., D.A. Dodd, and J.A. Samartgedes. 1981. Milk feeding patterns in the United States during the first 12 months of life. Pediatrics 68:863-868.
Meyer, H.F. 1958. Breastfeeding in the United States: extent and possible trend. A survey of 1,904 hospitals with two and a quarter million births in 1956. Pediatrics 22:116-121.
Meyer, H.F. 1968. Breastfeeding in the United States: report of a 1966 national survey with comparable 1946 and 1956 data. Clin. Pediatr. 7:708-715.
Moore, J.F., and N. Jansa. 1987. A survey of policies and practices in support of breastfeeding mothers in the workplace. Birth 14:191-195.
Neifert, M., J. Gray, N. Gary, and B. Camp. 1988a. Effect of two types of hospital feeding gift packs on duration of breastfeeding among adolescent mothers. J. Adol. Health Care 9:411-413.
Neifert, M., J. Gray, N. Gary, and B. Camp. 1988b. Factors influencing breastfeeding among adolescents. J. Adol. Health Care 9:470-473.
Radius, S.M., and A. Joffe. 1988. Understanding adolescent mothers' feelings about breastfeeding: a study of perceived benefits and barriers. J. Adol. Health Care 9:156-160.
Rassin, D.K., C.J. Richardson, T. Baranowski, P.R. Nader, N. Guenther, D.E. Bee, and J.P. Brown. 1984. Incidence of breastfeeding in a low socioeconomic group of mothers in the United States: ethnic patterns. Pediatrics 73:132-137.
Romero-Gwynn, E. 1989. Breastfeeding pattern among Indochinese immigrants in northern California. Am. J. Dis. Child. 143:804-808.
Romero-Gwynn, E., and L. Carias. 1989. Breastfeeding intentions and practice among Hispanic mothers in southern California. Pediatrics 84:626-632.
Rosenberg, C.E. 1976. No Other Gods: On Science and American Social Thought. Johns Hopkins University Press, Baltimore, Md. 273 pp.
Rush, D., N.L. Sloan, J. Leighton, J.M. Alvir, D.G. Horvitz, W.B. Seaver, G.C. Garbowski, S.S. Johnson, R.A. Kulka, M. Holt, J.W. Devore, J.T. Lynch, M.B. Woodside, and D.S. Shanklin. 1988. The National WIC Evaluation: evaluation of the Special Supplemental Food Program for Women, Infants, and Children. V. Longitudinal study of pregnant women. Am. J. Clin. Nutr. 48:439-483.
Ryan, A.S., and G.A. Martinez. 1987. Incidencia de la lactancia materna en la población hispanoamericana de los Estados Unidos, 1986. Médico Interamericano 6:52-53, 57.
Ryan, A.S., and G.A. Martinez. 1989. Breastfeeding and the working mother: a profile. Pediatrics 83:524-531.
Salber, E.J., P.G. Stitt, and J.G. Babbott. 1958. Patterns of breastfeeding. I. Factors affecting the frequency of breastfeeding in the newborn period. N. Engl. J. Med. 259:707-713.
Samuels, S.E., S. Margen, and E.J. Schoen. 1985. Incidence and duration of breastfeeding in a health maintenance organization population. Am. J. Clin. Nutr. 44:504-510.
Scrimshaw, S.C.M., P.L. Engle, L. Arnold, and K. Haynes. 1987. Factors affecting breastfeeding among women of Mexican origin or descent in Los Angeles. Am. J. Public Health 77:467-470.
Seger, M.T., C.E. Gibbs, and E.A. Young. 1979. Attitudes about breastfeeding in a group of Mexican-American primigravidas. Tex. Med. 75:78-80.
Simopoulos, A.P., and G.D. Grave. 1984. Factors associated with the choice and duration of infant-feeding practice. Pediatrics 74:603-614.
Smith, J.S., C.G. Mhango, C.W. Warren, R.W. Rochat, and S.L. Huffman. 1982. Trends in the incidence of breastfeeding for Hispanics of Mexican origin and Anglos on the US-Mexico border . Am. J. Public Health 72:59-61.
Starr, P. 1982. The Social Transformation of American Medicine. Basic Books, New York. 514 pp.
Weller, S.C., and C.I. Dungy. 1986. Personal preferences and ethnic variations among Anglo and Hispanic breast and bottle feeders. Soc. Sci. Med. 23:539-548.
Winikoff, B. 1981. Issues in the design of breastfeeding research. Stud. Fam. Plann. 12:177-184.
Young, S.A., and M. Kaufman. 1988. Promoting breastfeeding at a migrant health center. Am. J. Public Health 78:523-525.


