
6
Prevention of Disability Associated with Chronic Diseases and Aging
Disease prevention and health promotion have been a strong focus of interest among policymakers, researchers, and practitioners in recent years. Demographers and epidemiologists have documented convincingly one significant outcome of disease prevention and health promotion: the revolutionary change in average life expectancy during the past two centuries. The first revolution in public health occurred when the basic principles of sanitation were understood and implemented and when basic nutritional needs could be met reliably in modernizing societies. In the eighteenth and nineteenth centuries, coping with acute bacterial and virus-related diseases ultimately led medical practitioners to better understand the importance of sanitation, adequate nutrition, and, eventually, medical immunization.
This first revolution has had at least two consequences: the age structure of modern society shifted as a result of increased average life expectancy, and acute disease was joined by chronic disease as a focus of public health attention. Chronic disease and its related disabling conditions, however, have not been responsive to the traditional public health interventions that were so successful in the first revolution. The continuing challenge of coping with chronic disease sets the stage for the second revolution in public health, which focuses on behavior and lifestyle modification as key components in health promotion and disease prevention.
The Canadian Lalonde report (1974) and the U.S. surgeon general's reports (U.S. Department of Health, Education, and Welfare, 1979; U.S. Department of Health and Human Services, 1980a) were notable public statements of a belief in the modifiability of risk factors with a specific focus on the potential benefits of behavioral and lifestyle modifications. The surgeon general's reports used the life course approach to set specific health objectives to be achieved by the year 1990 among children, adolescents, adults,
and older persons. These reports noted the relevance of genetics, medical care, and toxic factors in the environment; however, behavior and lifestyle change were clearly the major foci. The reports were notable for their inclusion of older adults in the health objectives, affirming that although age and disease are associated, the association is conditional and modifiable.
Recent federal initiatives have focused on the older population as a target group for preventive care and health promotion activities. For example, the surgeon general sponsored a Workshop on Health Promotion and Aging (U.S. Department of Health and Human Services, 1988b), which documents the benefits of several interventions to lower existing risks among the elderly (see the discussion later in this chapter). The recent Healthy People 2000: National Health Promotion and Disease Prevention Objectives (U.S. Department of Health and Human Services, 1990) employs the life course approach in setting objectives, including goals to increase average life expectancy to 78 years, to reduce disability caused by chronic conditions to a prevalence of no more than 6 percent of all people, and to increase years of healthy life to at least 65 years. In the area of research, the National Institute on Aging is supporting studies to understand the aging process; to improve the diagnosis, treatment, and prevention of diseases that affect older people; and to improve their quality of life (National Institute on Aging, 1989).
There are several reasons for adopting a health promotion and disease prevention approach for older adults. Life expectancy is increasing, and it is desirable to enhance health status during these additional years of life. In addition, there is increasing evidence that some harmful habits and behaviors are amenable to modification or reversal when interventions occur in later years. This capacity for modifying physiological or pathological conditions has been referred to as the plasticity of the aging process (National Research Council, 1988). Finally, the high incidence of chronic disease and disabling conditions among the elderly and the burden disease places on individuals and society dictate the need for effective methods to ameliorate the deleterious effects of illness and disabling conditions that require costly medical care services.
The public perceives aging as a process of steady deterioration, which results in subtle discrimination that is sometimes referred to as ageism. The perception that age, chronic disease, and disability are equivalent conditions prevents our society from realizing the potential benefits of a disability-free life even among older persons. This perception has also influenced the social policies and social support networks developed in our society.
The public needs to be educated about the potential for modifying the aging processes through individual lifestyle change and through social policies ensuring adequate income, educational opportunities, and social support during a person's life course.
MAGNITUDE OF THE PROBLEM
The magnitude of disability associated with chronic conditions and aging can be measured from a variety of perspectives. Three of these perspectives—prevalence of chronic conditions and their risk of disability, prevalence of multiple chronic conditions, and limitation in basic life activities—will be discussed here. Because some chronic diseases occur before age 65, and because a life course perspective is important for considering chronic disease, aging, and disability, the data presented are not limited to the elderly.
Prevalence of Chronic Conditions
Although the prevalence of chronic illness increases with age and is a major cause of disabling conditions, many elderly persons are healthy and function independently. In 1988, 33.1 million people in the United States, or 13.7 percent of the noninstitutionalized population, reported some limitation of their activities as a result of chronic disease or impairment; 4.3 percent were limited, but not in their major activity; 5.4 percent were limited in the amount or kind of their major activity, and 4 percent—''the most severely disabled"—were unable to carry on their major activity (Table 6-1) (National Center for Health Statistics, 1989a). The prevalence of all three levels of activity limitation increases with age except for those with "severe disabilities," for whom the rates rise from less than one-half of 1 percent for those under 18 years to 16.2 percent for the 65- to 69-year-olds. For those 70 years and older, however, the prevalence rate falls to 7.6 percent. This reduction may be the result of the oldest old population entering institutions when they become severely disabled.
The prevalence of most chronic health conditions varies by age group. Table 6-2 presents estimates from the 1988 National Health Interview Survey (NHIS) of the number of chronic conditions and the rate per 1,000 persons for all noninstitutionalized persons and for the population aged 65 and older. The conditions are ranked according to their prevalence in the total population. The five most prevalent chronic conditions for all ages are chronic sinusitis, arthritis, high blood pressure, deformity or orthopedic impairment, and hay fever. For the elderly population, arthritis ranked highest with almost half (49 percent) reporting this condition, followed in rank order by high blood pressure (37 percent), hearing impairment (32 percent), heart disease (30 percent), and chronic sinusitis (12 percent) (Figure 6-1). The relative ranking of conditions depends on how the conditions are grouped. For example, if deformities of the back were shown separately, they would rank eighth for all ages and eleventh for the elderly. When combined with deformities or orthopedic impairments of the upper extremities, as shown in Table 6-2, they rank fourth for all ages and seventh for the
TABLE 6-1 Number and Distribution of Persons by Degree of Activity Limitation Due to Chronic Conditions and Age, 1988
|
Age |
All Persons |
With No Activity Limitation |
With Activity Limitation |
Limited But Not in Major Activity |
Limited in Amount or Kind of Major Activity |
Unable to Carry on Major Activity |
|
Number (in thousands) |
||||||
|
Under 18 years |
63,569 |
60,175 |
3,394 |
898 |
2,235 |
261 |
|
18-44 |
103,066 |
94,230 |
8,835 |
2,772 |
3,562 |
2,502 |
|
45-64 |
45,573 |
35,347 |
10,225 |
2,518 |
3,806 |
3,901 |
|
65 yrs and over |
28,683 |
18,080 |
10,602 |
4,118 |
3,466 |
3,018 |
|
65-69 |
9,801 |
6,305 |
3,496 |
744 |
1,167 |
1,585 |
|
70 yrs and over |
18,882 |
11,775 |
7,107 |
3,374 |
2,299 |
1,433 |
|
Total |
240,890 |
207,833 |
33,057 |
10,305 |
13,069 |
9,682 |
|
Percent distribution |
||||||
|
Under 18 years |
100.0 |
94.7 |
5.3 |
1.4 |
3.5 |
0.4 |
|
18-44 |
100.0 |
91.4 |
8.6 |
2.7 |
3.5 |
2.4 |
|
45-64 |
100.0 |
77.6 |
22.4 |
5.5 |
8.4 |
8.6 |
|
64 yrs and over |
100.0 |
63.0 |
37.0 |
14.4 |
12.1 |
10.5 |
|
65-69 |
100.0 |
64.3 |
35.7 |
7.6 |
11.0 |
16.2 |
|
70 yrs and over |
100.0 |
62.4 |
37.6 |
17.9 |
12.2 |
7.6 |
|
Total |
100.0 |
86.3 |
13.7 |
4.3 |
5.4 |
4.0 |
|
Percent distribution by age |
||||||
|
Under 18 years |
26.4 |
29.0 |
10.3 |
8.7 |
17.1 |
2.7 |
|
18-44 |
42.8 |
45.3 |
26.7 |
26.9 |
27.3 |
25.8 |
|
45-64 |
18.9 |
17.0 |
30.9 |
24.4 |
29.1 |
40.3 |
|
65 yrs and over |
11.9 |
8.7 |
32.1 |
40.0 |
26.5 |
31.2 |
|
65-69 |
4.1 |
3.0 |
10.6 |
7.2 |
8.9 |
16.4 |
|
70 yrs and over |
7.8 |
5.7 |
21.5 |
32.7 |
17.6 |
14.8 |
|
Total |
100.0 |
100.0 |
100.0 |
100.0 |
100.0 |
100.0 |
|
SOURCE: National Center for Health Statistics, 1989a. |
||||||
TABLE 6-2 Chronic conditions with highest prevalence in noninstitutionalized population, all ages and 65 years and older, 1988
|
|
All Ages |
65 Years and Older |
||||
|
Condition |
Rank |
Number of Conditions (thousands) |
Rate per 1,000 Persons |
Rank |
Number of Conditions (thousands) |
Rate per 1,000 Persons |
|
Chronic sinusitis |
1 |
33,658 |
140 |
5 |
4,961 |
173 |
|
Arthritis |
2 |
31,292 |
130 |
1 |
13,930 |
486 |
|
High blood pressure |
3 |
29,257 |
122 |
2 |
10,698 |
373 |
|
Deformity or orthopedic impairment |
4 |
26,878 |
112 |
7 |
4,621 |
161 |
|
Hay fever or allergic rhinitis without asthma |
5 |
22,413 |
93 |
12 |
2,047 |
71 |
|
Hearing impairment |
6 |
21,864 |
91 |
3 |
9,040 |
315 |
|
Heart disease |
7 |
20,258 |
84 |
4 |
8,484 |
296 |
|
Chronic bronchitis |
8 |
11,894 |
49 |
13 |
1,859 |
65 |
|
Hemorrhoids |
9 |
11,031 |
46 |
14 |
1,849 |
65 |
|
Asthma |
10 |
9,934 |
41 |
21 |
1,188 |
41 |
|
Migraine headache |
11 |
9,222 |
38 |
41 |
529 |
18 |
|
Dermatitis |
12 |
9,025 |
38 |
32 |
781 |
27 |
|
Visual impairment |
13 |
8,365 |
35 |
9 |
2,602 |
91 |
|
Varicose veins of lower extremities |
14 |
7,632 |
32 |
11 |
2,301 |
80 |
|
Tinnitus |
15 |
6,361 |
26 |
10 |
2,407 |
84 |
|
Diabetes |
16 |
6,221 |
26 |
8 |
2,649 |
92 |
|
Cataracts |
17 |
6,105 |
25 |
6 |
4,810 |
168 |
|
SOURCE: National Center for Health Statistics, 1989b. |
||||||
FIGURE 6-1 Prevalence to top 10 chronic conditions, age 65 and over, 1988.
Source: National Center for Health Statistics, 1989a.
elderly (National Center for Health Statistics, 1989a). As noted in Chapter 2, however, one limitation of the NHIS data is that they are self-reported with no objective measurements.
Because of the large and significant contribution that chronic disease and aging make to disability, an in-depth study of this relationship is warranted. It should focus on disability prevention, health promotion, quality of life, and implications for public health.
Chronic Conditions Causing Disability
The higher-ranking prevalent chronic health conditions are not necessarily those that cause the most disability (defined here in terms of activity limitations). For example, a recent analysis by LaPlante (1989b), based on four years (1983-1986) of the NHIS, showed an inverse relationship between the prevalence of chronic health conditions and the risk of disability. As shown in Figure 6-2, conditions with high prevalence have low risks of disability, whereas conditions low in prevalence have high risks of disability. For example, sinusitis ranks highest in prevalence for all ages, but less than one-half of 1 percent of the persons with this condition report being limited in activity. By contrast, the three least prevalent conditions—absence of arms and/or hands, multiple sclerosis, and lung or bronchial cancer—have significantly higher risks of disability. Three-fourths of those with lung or bronchial cancer report being limited in activity.
Current data on chronic and disabling conditions are restricted to national
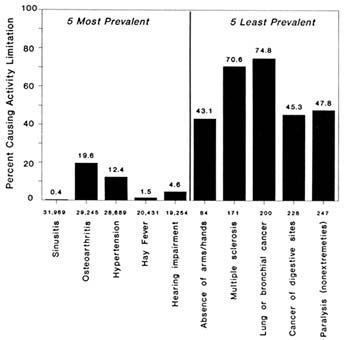
FIGURE 6-2 Percent of specific chronic conditions causing activity limitation for the five most prevalent and five least prevalent conditions, 1983-86.
Source: LaPlante, 1989b. Reprinted with permission.
samples derived from cross-sectional surveys and provide only basic measures of activity limitation. Because most health and social service programs are coordinated at the state level, the lack of state-specific data hampers planning of services. Existing data systems are insensitive to changes in the prevalence of impairment and disability over time, and they do not measure the degree of limitation and disability that results from specific chronic diseases and mental illnesses, also undermining planning of prevention strategies.
Data collection reflects this nation's emphasis on acute care. It is episodic, and fixed on single points in time. In contrast, chronic diseases, by definition, are long-term conditions, and their impacts change over time.
Surveillance methods do not permit us to track the series of changes in health status, functional capacity, and quality of life that people with chronic disease are likely to experience. National and state systems of surveillance of disabling conditions should be refined so
that functional limitation and disability resulting from chronic diseases and mental disorders can be measured and changes in the prevalence of these conditions can be monitored over time.
Multiple Chronic Conditions
Multiple chronic conditions have a significant impact on disability status. Many people, especially the elderly, have multiple chronic and potentially disabling conditions. Data from the NHIS for the three-year period from 1979 to 1981 indicate that multiple chronic conditions causing limitation of activity increase with age. For example, among those who report chronic conditions that cause limited activity, only 15 percent of the group under age 17 reported more than one condition; this proportion increased to 40 percent for those aged 75 and older (Rice, 1989).
In recent years, more people are reporting that they have chronic conditions that limit their activities. Analysis and comparison of the NHIS data from two three-year periods, 1969-1971 and 1979-1981, showed that the prevalence rate of limitations in activity increased significantly (Rice and LaPlante, 1988a). The rate increased more than one-fifth, from 119 to 145 per 1,000 persons, for the entire noninstitutionalized population, with greater increases for women than for men. The largest increases occurred for children and youth and for middle-aged persons, 45 to 64 years of age, especially for the "most disabled"—those unable to carry on their major activity. The prevalence rate of limitation declined slightly in later years (ages 75 and over), indicating that the health of the very old living in the community may have improved slightly. Comparison of health indicators over time for the very old, however, must account for changes in institutionalization, and this factor was not addressed in that report.
People with disabling conditions reported more chronic conditions and more days of restricted activity over the ten-year period 1969-1971 to 1979-1981. The number of chronic conditions per person causing limitation of activity increased 12.5 percent, from 1.32 to 1.48 per person with increases reported for all ages (Rice and LaPlante, 1988a). The greatest increase was for noninstitutionalized persons aged 85 and older, suggesting worsening health as the probable explanation. In general, the more severely limited population reported the greatest increases in multiple chronic conditions, which suggests that persons may be living longer with severely limiting chronic conditions.
Other researchers have found similar trends. Verbrugge (1984) analyzed past trends in specific chronic conditions, in disability (as defined by activity limitation), and in mortality for middle-aged and older persons reported in the NHIS over a 23-year period, 1958 to 1981. For middle-aged people, 10 of the 11 chronic diseases with high mortality rates had become more
prevalent; over the same period, however, mortality rates declined for 8 of those diseases. Increased morbidity and declining mortality trends in chronic conditions for the elderly were similar. Verbrugge also noted an increase since the late 1960s in limitation of activity. She suggests that these increases may be caused by a variety of factors: there may be changes in "true" incidence and survival rates, individuals may be more accepting of and accommodating to their conditions, and they may be more likely to adopt the sick role than in the past.
Using data for nine commonly reported chronic conditions from the 1984 Supplement on Aging of the NHIS, Guralnik and colleagues (1989b) showed that the prevalence of comorbidity (multiple conditions) is substantial among the population aged 60 and older. High rates of comorbidity were reported for women, with prevalence rates rising from 45 percent in the age group 60 to 69 years to 70 percent in those 80 years and older. For those 60 years of age and older who had no chronic conditions, only 2.1 percent of men and 2.3 percent of women required assistance in performing one or more activities of daily living (ADLs). These rates increased to 8.6 percent for men and 6.9 percent for women who had 2 chronic conditions and to 22 percent for men and 15.7 percent for women who had 4 chronic conditions. In addition, there was a clear association between the number of conditions and the proportion of people with disability as assessed by inability to perform activities or self-care. The authors found that, for the most commonly reported pairs of comorbid conditions (i.e., high blood pressure and arthritis), the observed coprevalence was consistently higher than expected. Possible explanations for this finding include (1) detection bias (those with one condition may have more contacts with the medical care system and a greater likelihood of being diagnosed with a second condition); (2) response patterns (people who report one disease may be more likely to report having other diseases); and (3) biological basis (genetic and environmental factors may increase susceptibility to disease).
Limitation in Basic Life Activities
Measures of functioning in basic life activities, including ADLs and instrumental activities of daily living (IADLs), are important indicators of health status and disability. Analysis of data from the 1979 and 1980 Home Care Supplement to the NHIS shows 5.4 million persons who reported needing assistance in ADLs or IADLs; of this total, 43 percent were under age 65 (LaPlante, 1989b). Middle-aged adults who need assistance are somewhat more likely than either children or older adults to use equipment and to be less dependent on help from others. Children and people aged 85 and older are also more likely to need assistance in multiple activities and to need help from others more often.
Nonelderly and elderly persons with assistance needs living in the community have very similar levels of disability and use of health services. Of persons who need help in basic life activities, however, the elderly are more likely than the nonelderly to need someone with them at home all or most of the time. LaPlante (1989a) concludes that if rates of assistance needs are not reduced in successive age cohorts during the next several decades, the population with assistance needs will grow as these cohorts become older.
LIFE COURSE PERSPECTIVE ON DISABILITY AND ITS PREVENTION
The life course provides a useful framework for considering disabling conditions and their prevention. For persons 60 years of age and older, 8 out of 10 have one or more chronic diseases or impairments (Guralnik et al., 1989b). Roughly 40 percent of the elderly population have some activity limitation, and about 17 percent need assistance in basic life activities (LaPlante, 1989b).
The age gradient for assistance in basic life activity measures (ADLs and IADLs) is particularly evident from age 55 onward. By age 85, the risk of significant disablement approaches 50/50. The older population, therefore, constitutes a particularly important group for studying the potential limits of preventing or minimizing disability. Not only is the risk of disability in late life great, but the population aged 65 and older is also large and growing. An estimated 12.7 percent of the total U.S. population in 1990, 31.7 million persons, are 65 years of age or older; this population group is forecast to grow by the year 2020 to 51.4 million, or 17.3 percent of the total population, and to 67 million persons, 21.7 percent of the total, by 2040 (U.S. Bureau of the Census, 1984). Thus the incidence and prevalence of disability will rise significantly in the foreseeable future.
A Dynamic View of Disability as a Process
During the past two decades, the potential for modifying some processes of aging and for reducing disabling conditions in older populations has been identified in both research and practice. Gerontological and geriatric research and practice have laid a solid foundation for therapeutic optimism regarding the prevention of excessive disability and the rehabilitation of older individuals. Indeed, the notion that prevention or reduction of disability is relevant only early in the life course can no longer be defended (Maddox, 1985; Rowe and Kahn, 1987; Riley and Riley, 1989). Research on disability as a dynamic process, not just a static condition, has contributed greatly to the emergence of an optimistic perspective on reducing disablement during adulthoods. For example, in a longitudinal study of disabiling conditions in a large sample
of people 65 years of age and older with ADL and IADL impairments (the National Long-Term Care Survey), the stereotypical view of age-related monotonic decline in functional capacity was clearly contradicted (Manton, 1988). In the first two years of this continuing study (1982-1984), 81.6 percent of the older adults who in 1982 did not have disabling conditions remained free of them two years later. Of the persons who had chronic disabling conditions in 1982, notable proportions were significantly improved two years later. For example, 22.2 percent of the persons who were most limited (5 to 6 ADL impairments) and 23.7 percent of those who were moderately limited (3 to 4 ADL impairments) showed an improvement in functional status two years later.
Research evidence is accumulating that a broad range of interventions have demonstrable beneficial effects in reducing the risk of disability associated with aging. Riley and Riley (1989) provide an excellent collection of relevant articles that review the research documenting the modifiability of some aging processes. Some cognitive loss, for example, typically described as an inevitable concomitant of aging, is known to be reversible under a variety of conditions. Conceptions of self can be improved, as can an individual's sense of empowerment to take interest in, and some responsibility for, self-care, even in very old institutionalized individuals with severe limitations. In addition, the capacity of older adults to benefit physically from systematic exercise has been repeatedly demonstrated (Fries, 1988). Older adults constitute, in sum, an interesting case of the modifiability of disablement from chronic diseases and impairment over the entire life course through risk factor reduction. A related question to be pursued in future research is the effect of not sustaining previously developed healthy lifestyles in later years. Without further evidence, old age cannot be assumed to provide immunity from the risks of unhealthy lifestyles.
Some of the beneficial interventions to prevent or reduce disability are self-initiated, such as adopting and maintaining healthy lifestyles. Research indicates that healthy lifestyles are as characteristic of older adults as they are of adults generally (Berkman and Breslow, 1983; Kaplan and Haan, 1989). Health professionals, however, can and do play an important complementary role in limiting or reversing the consequences of potentially disabling disease or impairment. Timely access to geriatric assessment with appropriate follow-up services has, in randomized controlled trials, proved to be beneficial in improving both functional capacity and more effective use of health resources among older patients (Chernoff and Lipschitz, 1988). The ultimate supporting evidence of improving functional status through systematic intervention is found in geriatric rehabilitation. Even difficult problems in later life, such as those related to incontinence and osteoporosis, have in many instances proven to be amendable to skilled rehabilitative intervention. Beneficial outcomes are known to be more likely in geriatric rehabilitation
when attention is given to the psychosocial variables of personal and social resources (Riley and Riley, 1989).
The widely varying needs of persons with disabling conditions demand a multidisciplinary collaborative approach among many professionals and organizations. The interventions should be determined by the needs of each individual rather than by rigid definitions of disabilities.
Collaborative projects involving primary care providers, public health agencies, voluntary associations, and the community should be developed to coordinate disability prevention programs that implement interventions centered on individual needs with a goal of improving an individual's physical, mental, and social well-being over the life course.
Aging Differently
Research has demonstrated the error in thinking that older adults are all alike or that they become more alike as they age (Maddox and Lawton, 1989; Rowe and Kahn, 1987). For example, among those 65 years of age and older, the risk of acquiring a disabling illness differs significantly among the categories of the younger old (65-74), the old (75-84), and the oldest old (85 and older). Patterns of disability, morbidity, and mortality also differ significantly between males and females, and the risk of disabling conditions among older adults is known to be associated with poverty, inadequate education, and social isolation (see Chapter 2). The increased awareness of the diversity of health status in later life has had a salutary effect on health and welfare professionals who are increasingly less likely to use "being older" (i.e., over 65) as an explanation of disability or as a justification for failing to intervene in the interest of improving the quality of life among impaired older adults.
DEVISING APPROACHES TO PREVENTION
Disease prevention and health promotion must be pursued throughout life. It is now well recognized that chronic conditions often can be prevented. For example, it has been estimated that 70 percent of all cancer cases are preventable through changes in lifestyles (e.g., cessation of smoking). Nonetheless, it would be naively optimistic to assume that all chronic disease can be prevented, even though the risk of developing these conditions can be reduced. Mounting evidence clearly indicates, however, that adopting healthful behaviors even late in life can be beneficial, perhaps preventing the progression of impairments to functional limitations and disability. In addition, it is clear that existing knowledge points the way to effective approaches to averting or mitigating the potentially debilitating consequences of some
chronic diseases. For example, much can be done to reduce the risk of disabling conditions for people with diabetes, but as the box entitled Preventing Diabetes-Related Disability explains, the disease persists as one of the leading causes of disabling conditions.
Thus, although much is known about the prevention of certain chronic diseases and associated disabling conditions, sometimes the preventive and rehabilitative interventions that are used are not underlain by sufficient understanding, and their effectiveness has not been thoroughly evaluated. Moreover, prevention efforts are hampered by limited understanding of the natural histories of many chronic diseases, of the aging process, and of the relationships among chronic disease, aging, and functional outcomes. Thus it must be recognized that our knowledge has limits and that we often fail to translate existing knowledge into practice.
The limitations of care delivery systems must also be recognized. The needs of people with long-term conditions mesh poorly with a health care system that is oriented toward the treatment of acute conditions, where care is akin to crisis management. People with chronic conditions require continuity of care and their needs are diverse, encompassing more than medical treatment. If, for example, social support is lacking, a person's well-being may deteriorate despite the availability of adequate health care. Unfortunately, systems for the delivery of social services are fragmented and fail to achieve the continuity that people with chronic conditions often require.
The remainder of this section describes an approach for conceptualizing disability prevention during the life course among people with chronic disease, summarizes some opportunities for prevention, and discusses shortcomings in current systems for the delivery of health care and social services. Much of the discussion focuses on the prevention and management of chronic disease in the elderly.
Perspective on Preventing Disability Among People with Chronic Disease
Unlike acute conditions and injuries, chronic diseases often do not have an identifiable point of onset, and they frequently entail gradually progressive declines in functional capacity. In terms of the committee's model of the disabling process (see Chapter 3), people with chronic diseases are usually first identified when their condition is at the impairment stage (i.e., with a loss or abnormality of physiological, psychological, or anatomical structure or function).
People with chronic disease are at increased risk of functional limitation and disability, and, absent effective preventive measures, the quality of their lives is also likely to decline. In the minds of many—layman and professional alike—the aging processes during the later stages of adulthood are virtually synonymous with chronic disease, and prospects for improvement
|
PREVENTING DIABETES-RELATED DISABILITY Diabetes is a leading cause of disability, particularly among the elderly. Approximately 7 million people in the United States have been diagnosed with diabetes, and an additional 5 million may unknowingly have the disease. The prevalence rate of diabetes increases with age; about 10 percent of persons 65 years or older have been diagnosed with diabetes. Disability from diabetes result from the major complications of the disease—cardiovascular disease, peripheral vascular disease, and neuropathy, blindness, and kidney failure. These conditions are largely preventable (Herman et al., 1987). Most people with diabetes have non-insulin-dependent, or type II, diabetes. The disorder usually appears after age 40 and is frequently associated with obesity. Prevention and control of obesity may be effective in the primary prevention of diabetes; however, a successful strategy for primary prevention has not yet been demonstrated. Existing approaches to reducing disabling conditions and premature mortality caused by diabetes rely on secondary and tertiary prevention of complications. Cardiovascular disease is a leading cause of mortality among people with diabetes, accounting for half of all diabetes-related deaths. Reducing the rest of cardiovascular disease among diabetic persons primarily entails eliminating or reducing the traditional risk factors associated with the disease, such as cigarette smoking and hypertension. About half of people with diabetes have uncontrolled hypertension, and 27 percent smoke cigarettes. Elimination of these risk factors could decrease deaths due to cardiovascular disease by more than one-fourth (Centers for Disease Control, 1989a). About half, or 50,000, of all nontraumatic amputations in the United States are performed on people with diabetes. Half of all lower-extremity amputations can be prevented through proper foot care and by reducing risk factors for peripheral vascular disease and neuropathy. These risk factors include hyperglycemia, cigarette smoking, and uncontrolled hypertension (Herman et al., 1987). Diabetes is the leading cause of new cases of adult blindness. Clinical trials have demonstrated that approximately 60 percent of diabetes-related blindness can be prevented with early detection and treatment (Herman et al., 1987). Since 1983, the number of patients initiating treatment for end-stage renal disease (ESRD) attributable to diabetes has been increasing by about 10 percent per year. About 20,000 people with diabetic ESRD are sustained through maintenance dialysis. Control of hyperglycemia and hypertension are recommended for preventing and slowing the progression of diabetes-associated renal disease (Herman et al., 1987). Blacks, Hispanics, and Native Americans are at increased risk for diabetes and many of its complications, making these groups prime targets for preventive efforts. To reduce disability from diabetes, all people with the disease must have access to sustained preventive care. Access to qualified health care providers and referral to appropriate facilities with adequate resources must be improved, particularly for minority populations. |
are dismissed as highly doubtful. The elderly are viewed as being in a state of inevitable physical and mental decline, resulting in a deteriorating quality of life and, eventually, total dependence. Indeed, about 80 percent of people age 60 and older have at least one chronic disease (Guralnik et al., 1989b), and about 40 percent of those age 65 and older have an activity limitation, including the 17 percent who require assistance in performing some basic life activities (LaPlante, 1989b). Yet to view people in late adulthood as being in an irreparable state of decline is to ignore the tremendous diversity among individuals who are collectively identified as the elderly.
As the committee's model of the disabling process suggests, there are numerous opportunities for intervening and modifying the risk factors that predispose people with chronic diseases to disability. Obviously, the goals of preventing, or at least delaying, the onset of disability and of minimizing the severity of its consequences become more challenging as the age of the target population increases and as the risks of chronic disease, comorbidity, and functional limitation also increase. As mentioned earlier, from age 55 onward, the risk of requiring assistance in basic life activities rises sharply, and by age 85 the risk of disability approaches 50 percent. Still, disability is not a fait accompli even among the oldest of the elderly.
At issue is not whether preventive interventions are beneficial but rather what those interventions should be and how they should be evaluated. Traditionally, the evaluative standard has been improvement in health status. But this standard, borrowed from acute care, is too confining to guide development and assess the effectiveness of prevention measures for chronic disease and disability. A more appropriate standard is quality of life, of which health status is one component. Even when functional capacity cannot be restored, it is indeed possible to improve well-being and to facilitate personal autonomy by addressing factors in an individual's social situation.
The fields of gerontology and geriatrics recognize the importance of interventions to achieve the broader goal of improving quality of life. In these fields, the concept of successful aging has been advanced to expand the focus of practitioners beyond health status to include assessments of the quality of day-to-day life. Successful aging, or aging well, does not imply freedom from disabling conditions. One is aging well when one maintains a satisfying sense of continuity and can fulfill expectations of personal independence and social participation. Despite the physiological and psychological stresses that can accompany advancing age, many older adults have the vitality and resilience to function at a high level. Moreover, frailty and dependence need not preclude a reasonable quality of life. Conversely, a low quality of life can affect the likelihood of developing a disability. Just as among younger age groups, the risk of disability among the elderly is associated with poverty, inadequate education, poor housing, and social isolation.
Therefore, effective management of chronic disease requires an approach
that comprehensively addresses not only the individual's health condition but also his or her total social situation. Indeed, beneficial outcomes have been shown to be more likely when personal and social variables are taken into account in geriatric rehabilitation programs (Riley and Riley, 1989).
The concept of quality of life requires considerable refinement before it can become a widely accepted methodological construct. Nevertheless, even if formulated only in general terms, quality of life as an evaluative standard provides a cohesive, transcending concept that can guide the composition, organization, and integration of prevention services for people with chronic disease and for the elderly.
Needs and Opportunities
Although the past 25 years have seen considerable progress in health promotion and the prevention of chronic disease, the need remains for further development and critical evaluation of primary, secondary, and tertiary prevention efforts. Health promotion and other primary prevention efforts that begin at the earliest stages of life are among the most effective and are applicable not only to those who are free of disease or impairment but also to those with disease and disabling conditions. Moreover, risk-reducing, health-promoting activities are important for the elderly with chronic disease because they are already predisposed to functional limitation and disability. In this regard, it should be noted that the Health Care Financing Administration is currently conducting several Medicare prevention demonstration projects. The second interim report on these projects is due to Congress in the spring of 1991, with the final report scheduled for 1993.
Secondary prevention measures, which seek to halt, reverse, or at least retard the progress of a condition, and tertiary prevention measures, which concentrate on restoring function and increasing personal autonomy in people who are already limited in functional capacity, are especially important for people with chronic disease. Combined with appropriate health promotion efforts, these measures constitute the building blocks of chronic disease management. Although the particular elements are dictated by the type and number of conditions present and their predicted course and by the features of an individual's social and environmental surroundings, the management of chronic disease focuses on quality of life, not just health status, and involves self-care, measures to prevent disease complications, counseling and other measures to foster psychosocial coping, and modification of the environment to accommodate functional limitations.
Researchers and service providers have little epidemiological data to guide their efforts to identify effective interventions on which to build chronic disease management plans. The information that is available describes the
prevalence of disabling conditions but does not yield insights into the factors that underlie the results. Nor is it useful in identifying population groups that have a higher-than-average risk of developing disability. Greatly needed is longitudinal epidemiological research that tracks the progression to disability and identifies the contributing risk factors.
Longitudinal studies are needed to help define the dynamic nature of pathology, impairment, functional limitation, and disability, and to describe the natural history of chronic diseases and aging in terms of these conditions.
Given the paucity of epidemiological analysis, it is not surprising that many secondary and tertiary interventions have evolved without rigorous scientific evaluation of their effects on functioning and on quality of life. There is a pressing need for studies of the effectiveness and outcomes of disability prevention measures. An associated need is to incorporate existing knowledge and the results of evaluative studies into consensus guidelines and protocols for preventive health care services.
Despite the serious weaknesses in the foundation upon which disability prevention strategies are built, recent research points to many important opportunities for prevention. Several studies contradict the stereotypical view of age-related monotonic physical and mental decline. An analysis of data from the National Long Term-Care Survey, one of the few longitudinal studies of disabling conditions, clearly documents the dynamic nature of the disabling process and thus suggests opportunities for intervention. In addition, the potential for older adults to benefit from regular exercise, good nutrition, and smoking cessation has been reported in several studies (Berkman and Breslow, 1983; U.S. Department of Health and Human Services, 1988b; Hermanson et al., 1988). A partial summary of conditions amenable to prevention is presented in Table 6-3 (German and Fried, 1989).
Concurrent with this committee's study, another committee of the Institute of Medicine reviewed research on the prevention of disability after age 50. The IOM Committee on the Prevention of Disability in the Second Fifty has focused on specific chronic diseases and on specific behavioral and social risk factors that predispose individuals to disability (Institute of Medicine, 1990b). Topics investigated by the committee include hypertension, medications, infection, osteoporosis, sensory loss, oral health, cancer, nutrition, cigarette smoking, depression, physical inactivity, social isolation, and falls. Based on that committee's report, Table 6-4 presents a summary of what is known about the prevention of disability in each of these areas and of what must be learned to improve the effectiveness of disability prevention efforts.
Even though Table 6-4 is only a partial listing, it suggests several potential
TABLE 6-3 Areas Potentially Amenable to Preventive Health Care in the Elderly
|
Primary |
Secondary |
Tertiary |
|
Health habits |
Screening for |
Rehabilitation |
|
Smoking |
Hypertension |
Physical deficits |
|
Alcohol abuse |
Diabetes |
Cognitive deficits |
|
Obesity |
Periodontal disease |
Functional deficits |
|
Nutrition |
Dental caries |
|
|
Physical activity |
Sensory impairment |
|
|
Sleep |
Medication side effects |
Caretaker support |
|
|
Colorectal cancer |
Introduction of |
|
Coronary heart disease risk |
Breast cancer |
support necessary |
|
factors |
Cervical cancer |
to prevent loss |
|
|
Prostatic cancer |
of autonomy |
|
Immunization |
Nutritionally induced |
|
|
Influenza |
anemia |
|
|
Pneumovax |
Depression, stress |
|
|
Tetanus |
Urinary incontinence |
|
|
|
Podiatric problems |
|
|
Injury prevention |
Fall risk |
|
|
Iatrogenesis prevention |
Tuberculosis (high risk) |
|
|
Osteoporosis prevention |
Syphilis (high risk) |
|
|
|
Stroke prevention |
|
|
|
Myocardial infarction |
|
|
SOURCE: German and Fried, 1989. Reproduced with permission from the Annual Review of Public Health, Vol. 10. Copyright, 1989, by Annual Reviews, Inc. |
||
targets for disability prevention. For example, inappropriate prescribing of medications by physicians and improper use of drugs among the elderly pose serious risks to physical and mental health. Certain medications can cause drowsiness or impair coordination, increasing the likelihood of falls and injuries; they can also reduce appetite, resulting in nutritional deficiencies. Thus improved education and training of physicians that places greater emphasis on prescribing and drug-monitoring practices that are tailored to the elderly would be beneficial in preventing these conditions. Also needed are public education programs and drug labeling practices that foster greater awareness of proper use of medications, particularly when multiple drugs are involved (Montamat et al., 1989).
Injury prevention is especially important for the elderly. The incidence of falls increases greatly after age 65. Combined with the high prevalence of osteoporosis among the elderly, falls are responsible for a large portion
TABLE 6-4 Known vs. Needed Information on Preventing Chronic Disease and Disability Associated With Aging
|
Risk Factor |
Known/Available |
Unknown/Needed |
|
Hypertension |
Treatment of moderate to severe diastolic hypertension in older people is warranted, but treatment of mild diastolic hypertension may be of marginal benefit. |
Cost-effectiveness of anti-hypertension treatment. |
|
|
Systolic/diastolic hypertension and isolated systolic hypertension are important risk factors in persons 50 years of age and older. |
Data on effectiveness of treatment of isolated systolic hypertension, especially in persons aged 80 and older (the ''old" elderly). |
|
|
|
Toxicity of antihypertensive medication, particularly in the "old" elderly; effect of anti-hypertension therapy on quality of life. |
|
Medications |
The older the patient, the less a physician can predict optimal dose based on lab tests and clinical judgment. |
Drug testing in older persons; how the effects of medication are magnified by the physiology of normal aging. |
|
|
Many adverse drug effects can be eliminated through more judicious prescribing. |
Effect of drugs on quality of life and functional capacity in the elderly. |
|
|
|
Risks and benefits of individual prescription drugs for the elderly. |
|
Infection |
23-valent pneumococcal vaccine is effective in preventing pneumococcal diseases. |
Alternative influenza vaccines that provide protection that will last longer than current period of one year. |
|
|
Influenza vaccine is 70% effective in preventing influenza. |
Ways to reduce infection in long-term care facilities. |
|
|
|
Safer preventive therapy and better early case detection for tuberculosis. |
|
Osteoporosis |
Osteoporosis is responsible for a substantial portion of the 1.3 million hip fractures occurring annually, resulting in a 5-20% reduction in survival and increased dependence. |
Identification of populations at high risk of fractures through a surveillance system to monitor osteoporosis prevention efforts. |
|
|
|
More refined data on specific types and causes of injuries to develop effective interventions. |
|
Risk Factor |
Known/Available |
Unknown/Needed |
|
|
Identification of at-risk women can be achieved accurately using non-invasive tests: single-photon absorptiometry, dual-photon absorptiometry, dual-energy X-ray absorptiometry, and quantitative computed tomography. |
Better therapies to prevent postmenopausal bone loss and new drugs for osteoporosis prophylaxis that do not have estrogen replacement therapy (ERT) side effects or complications (biphosphonate, etc.). |
|
|
Estrogen replacement therapies (ERT) significantly retard bone loss; but once lost, before ERT, bone mass is irretrievable. |
|
|
Sensory loss |
Approximately one-third of the elderly population suffers hearing or vision loss of varied etiology. |
Association between sensory loss and physical limitation to determine risk factors for those with hearing and sight loss. |
|
|
Case studies of people with sensory loss show that there is a strong association with psychiatric illness. |
Extent to which hearing and sight loss cause emotional and social problems and how they can be avoided. |
|
|
|
Evaluation of rehabilitation techniques that can be effective for the elderly in reducing handicap due to sensory loss. |
|
Oral health |
Oral diseases in old age are exacerbated by medications, physical and financial limitations that restrict dental care, and systemic disease. |
Longitudinal data on the natural history and microbiology of oral diseases. |
|
|
Edentulous people face psychological, social, and physical problems: soft tissue lesions, speech limitations, chewing limitations, and prosthedontic limitations. |
Determination of effective secondary prevention and early detection of oral cancer. |
|
|
|
Prevalence, incidence, cohort differences, and risk factors of oral dysfunction in older adults (e.g., tooth loss, oral cancer, oral mucosal conditions, oral sequelae of systemic diseases, chronic orificial pain, trauma, salivary gland dysfunction, and aspects of caries and periodontal diseases). |
|
Risk Factor |
Known/Available |
Unknown/Needed |
|
Cancer |
Women aged 60-80 years benefit from cervical cancer screening as much or more than younger women. |
Efficacy of screening for cancer in the elderly. |
|
|
Hemoccult testing for colorectal cancer improves predictive value with increasing age. |
Assessment of elderly tolerance for hemoccult testing and for flexible sigmoidoscopy to 35 and 60 centimeters, and the rates of complication of endoscopy. |
|
|
New immunology-based tests may provide an alternative to sigmoidoscopy, which is variously tolerated in the elderly. |
Evaluation of recent modifications for specificity in fecal occult blood testing. |
|
|
With advancing age, there is a marked decline in the benign-to-malignant ratio of biopsies in screened women and an improvement in the positive predictive value of mammography, 45% to 85% in women over 65 years. |
Epidemiologically grounded methodologic research to incorporate nonmortality measures of screening efficacy that reflect impairment, disability, and handicap. |
|
Nutrition |
Poor nutrition is a risk factor for many common chronic diseases—coronary artery heart disease, hypertension, stroke, and certain cancers. |
Clarification of the associations between nutritional requirements and function. |
|
|
Nutritional requirement for energy decreases 6% from 51 to 75 years and another 6% thereafter. |
Optimal activity rate for those over 50 to preserve lean body mass and keep metabolic rates high, thereby maintaining high energy needs. |
|
|
|
Methods for maintaining independent functioning with respect to nutrition among individuals living at home participating in meals programs (e.g., Meals on Wheels and congregate dining). |
|
|
|
Methods for screening nutritional risk that are reliable, valid, and predictive of later maintenance of independent function. |
|
Risk Factor |
Known/Available |
Unknown/Needed |
|
Cigarette smoking |
21% of coronary heart disease, 82% of chronic obstructive lung disease, and 90% of cancer can be attributed to smoking. Smoking may also be a significant risk factor for stroke. |
Assessment of patients' motivation for smoking cessation. |
|
|
Cessation of smoking decreases risk of all these chronic diseases, particularly coronary heart disease, even after age 50. |
Effective means of smoking cessation and elimination of smoking initiation. |
|
|
Past age 50, smoking continues to diminish life expectancy and increase morbidity, and remains a good predictor of lung and other cancers. |
|
|
Depression |
Elderly who are physically ill are 4-5 times as likely to be depressed as nonill elderly. |
Criteria for the diagnosis and treatment of depression. |
|
|
Depression commonly manifests differently in the elderly than in the young. |
Data on prevalence, incidence, and symptom severity of depression in the elderly. |
|
|
Older people respond extraordinarily well to treatment of depression. |
Innovative psychosocial measures, particularly in the community, for the restoration and preservation of morale during stressful periods, such as bereavement. |
|
|
|
Assessment of the efficacy, safety, and indications for the use of electroconvulsive therapy in the elderly. |
|
Physical inactivity |
50% of the decline in physical activity in those over age 50 is due to disuse atrophy, not to physiological aging; physical activity is crucial to the ability to maintain independent function. |
Longitudinal studies that trace the determinants of exercise maintenance at particular stages. |
|
|
The elderly present a heterogeneous population and therefore require physical activity programs adapted to the individual. |
The relevance to the individual of cognitive, behavioral, and physical abilities; that is, the kind of interactions that are necessary for initiation, the perception of barriers, and the relationship of other health risks to physical inactivity interventions. |
|
SOURCE: Institute of Medicine, 1990b. |
||
of the 1.3 million hip fractures that occur annually. Hip fractures, in turn, often result in premature death or increased dependence. A number of age-related factors have been implicated in injuries among the elderly: poor eyesight and hearing, arthritis, neurological diseases, and poor coordination and balance. In addition, medications and preoccupation with personal problems may result in distractions or drowsiness that leads to injury. Environmental factors such as poor lighting, uneven floor surfaces, and lack of safety equipment also increase the risk of injury. Most of these risk factors can be reduced by modifying the home environment, monitoring drug usage, and training people to compensate for physical limitations.
Oral health is a neglected area of care for the elderly, even though loss of teeth and oral disease are among the most common impairments in late adulthood. The impact of these impairments on personal health and on psychological and social well-being often goes unappreciated. Difficulty in eating and speech limitations are two examples of how dental impairments can exacerbate existing physical and mental conditions. The importance of preventive dental care for the elderly warrants much greater consideration from service planners.
Although about two-thirds of nursing home residents have a mental disorder (National Center for Health Statistics, 1989b), the role that mental impairment plays in the occurrence of disability among the elderly, as well as among younger segments of the population, is an important area for continued investigation (box follows). The research conducted thus far suggests a strong correlation between physically disabling conditions and mental illness, especially depression. Wells and colleagues (1989) found that, compared with patients with physical disorders only, depressed patients reported greater bodily pain, had a lower perception of their health status, and performed more poorly in physical and social activities. Poor functioning attributed solely to depressive symptoms was comparable to the level of functioning associated with cancer, cardiovascular disease, and six other major chronic conditions. Given that the likelihood of depression is high among elderly people who have a physical illness, these findings underscore the potential health benefits that are likely to result from the provision of appropriate mental health services. Research strongly indicates that depressed older adults are very responsive to interventions, especially those that focus on fostering socially supportive contacts and activities (U.S. Department of Health and Human Services, 1988b).
As mentioned above and discussed in a recent IOM report (1990b), social isolation is considered an important risk factor in the development of disease and disability. A consideration of social isolation usually occurs in the context of social support, and both concepts are often used interchangeably.
Clearly, many simple interventions can have a broad, positive impact on the health of the elderly. Yet despite advances made in clinical research
|
DISABILITY FROM CHRONIC MENTAL DISORDER The causes of most of the serious mental disorders are not well understood. Substantial evidence suggests, however, that secondary conditions associated with these disorders can be prevented or at least reduced in severity through appropriate management and rehabilitation efforts. Appropriate medication and aggressive community treatment have been shown to limit the severity of limitations associated with major disorders, improve social functioning, and enhance the quality of patients' lives (Mechanic, 1989). Many of the conditions affecting motivation, behavior, and social participation seen among the mentally ill result from poor medication management, impoverished environments, social isolation, neglect, and homelessness. There is broad neglect of patients with mental illness at all levels of our health care system (Mechanic and Aiken, 1987). Patients with depression often go unrecognized and receive no treatment, resulting in needless disability. People with depression, however, typically respond favorably to treatment. Failure to recognize depression and provide treatment may result in alcohol and drug abuse, suicide, work absenteeism, and family disruption. Even in the case of schizophrenia, one of the most disabling mental illnesses, recent research suggests hopeful prognoses (Harding et al., 1987). Aggressive, sustained treatment can prevent deterioration, allowing many patients to lead constructive lives. Assertive community care has been demonstrated to promote function and make reasonable levels of social participation and satisfaction possible (Stein and Test, 1985). Fourteen studies, most with random assignment, show that organized alternatives to hospitalization result in superior outcomes across a range of patient populations (Kiesler and Sibulkin, 1987). Patients with chronic schizophrenic symptoms are commonly neglected, which may exacerbate their symptoms and lead to a variety of secondary conditions, including sometimes violent acting-out behavior, social isolation, withdrawal from everyday activities, malnutrition, substance abuse, imprisonment, and homelessness. A recent IOM report found that the proportion of homeless populations with an acknowledged history of prior psychiatric hospitalization ranged from 11.2 percent to 26 percent (Institute of Medicine, 1988a). Many more of the homeless without such a history suffer from serious mental disorders as well. The lack of adequate housing constitutes one of the most significant barriers to implementing appropriate mental health care, contributing to a continuing cycle of neglect and disability. Responsibility for the services necessary to prevent disability and secondary conditions among the mentally ill is distributed among a variety of categorical agencies at several levels of government and in the private sector. These programs suffer from fragmentation, lack of coordination, and large gaps in essential service components. It has been demonstrated repeatedly that the seriously mentally ill often require not only medical and psychiatric |
|
treatment but also assistance in obtaining welfare benefits, help in structuring daily activities, psychosocial education, vocational rehabilitation, and housing. Delivering such services requires a point of focused responsibility and accountability on a continuing basis, and the ability to direct funding to ensure that patients receive the care they need. An example of this type of service delivery is the Training in Community Living Model developed in Madison, Wisconsin, and adopted in other localities (Stein and Test, 1980a, 1980b, 1985). In most communities, however, responsibility and authority for mental health rehabilitation are diffused across many agencies, and many patients suffer from neglect and inappropriate care. |
and efforts to disseminate these results through consensus guidelines for preventive services, the standard practice of clinical medicine is slow to change and incorporate these approaches. Because of the complexity of chronic diseases and their interactions, optimal treatments that will lead to the highest levels of quality of life and functional outcome are not well standardized and evaluated.
Both standardized protocols for the management of chronic diseases and mental disorders, and guidelines for preventive services need to be developed and widely disseminated with the goal of preventing disability.
The increased life expectancy for persons with developmental disabilities, chronic diseases, or injury-related conditions, for example, mandates an emphasis on their inclusion in the national disabilities prevention program. For example, while most persons with Down syndrome used to die before age 40 only two decades ago, many now live into their sixties and seventies. These individuals have both social (residential, work, retirement) needs as well as health needs.
Additional study is needed of the relationship between chronic disease, disability, and aging in terms of health promotion, quality of life, and access to services. Such study should include issues related to age-related disability, as well as aging with a disability.
Composition and Organization of Services
The preceding discussion described some of the promising avenues leading to the goal of disability prevention among the elderly and among younger people with chronic disease. By themselves, however, individual preventive strategies—whether in health care or in social services—are not likely
to accomplish much. As in other areas of disability prevention, success will depend on the whole of the effort—on the composition of services, on the availability and organization of services, on the contributions of formal and informal caregivers, and on much, much more. Thus the execution and integration of services are as important as the composition of the particular range of services provided.
This is not meant to minimize the importance of individual service elements. For most people, the range of available preventive services is deficient. For example, accumulating research evidence clearly demonstrates the significant impact that mental health has on functional status and on quality of life. Yet mental health services are not available to many people, or the types of services that are available are inconsistent with their needs because of insurance restrictions or other factors. Similarly, many of the environmental modifications known to reduce the risk of falls and other injuries in the home do not qualify for reimbursement. More examples could be cited, but each has a common thread. Most of the needs of people with chronic disease fall outside the scope of a health care system oriented to the treatment of acute conditions.
Even with diagnostic-related groups, the Medicare system favors acute care treatment in hospitals. As Patricia P. Barry of the University of Miami School of Medicine has explained, "[P]rimary care practitioners struggle to receive adequate reimbursement for lengthy home visits, assessment, family counseling, and multidisciplinary teamwork, while their technologically oriented colleagues have no problem collecting for radiologic or laboratory studies, or invasive tests that may not only be uncomfortable but also pose risks to the patient" (Institute of Medicine, 1989b).
Today, much of the gap between needs and available services is being filled by informal caregivers. The committee recognizes the importance of personal responsibility in health care and of the contributions of family and friends in the provision of needed services; however, it also recognizes the dangers of abdicating total responsibility for care to individuals and informal caregivers, a situation that can result from current reimbursement systems that provide no other option.
The 1982 Long-Term Care Survey showed that approximately 2.2 million caregivers (age 14 or older) provided unpaid assistance to 1.6 million elderly people who required help with one or more basic life activities. The average age of the informal caregiver is 57; a quarter of these caregivers are between the ages of 65 and 74, and 10 percent are older than 75. Many of these caregivers make substantial commitments, which often preclude employment and reduce the time available for other responsibilities. Indeed, 80 percent of informal caregivers devote at least 4 hours a day, 7 days a week, to providing assistance (Stone et al., 1987).
Because of the post-World War II baby boom, the number of offspring available to provide care to parents will increase, but so will the number of
elderly. The ratio of people older than age 80 to children will peak in the year 2000, decline somewhat over the next two decades, and then soar to an even higher peak in the year 2030 (Institute of Medicine, 1989b).
These predicted trends and the mismatch between today's health and social service system and the needs of the elderly and of younger adults with chronic disease and disabling conditions should compel policymakers and service planners and providers to rethink current approaches to care. Driven by concerns about escalating expenditures, such a reappraisal is taking place, but too little attention is being paid to access to care and, in particular, to quality of care. As a result, changes implemented in the name of controlling costs are generating new issues in their aftermath. Health care practitioners, noting that the average hospital stay in the United States is shorter than in any other nation, complain that patients are being discharged from hospitals not only quicker but also sicker, although research on this issue has produced equivocal results. Also motivated largely by cost concerns, many people are placing greater emphasis on home and community care as an alternative to institutionalization. Although this shift is often viewed positively, lack of standards for home care, questions about the competency of providers, restrictions on reimbursement for services, and other concerns suggest considerable variability in the effectiveness of this approach.
Robert L. Kane contends that many of these new issues and problems are the product of an "alternatives mentality" (Institute of Medicine, 1989b). Home and community care, for example, has been advanced as a means of keeping the elderly and chronically ill out of nursing homes, but other than the goal of avoiding institutionalization, objectives have not been established for community care. "We have not addressed more fundamental questions," Kane maintains, "such as, Is community care a legitimate and important vehicle for providing care on a long-term basis" (Institute of Medicine, 1989b). Moreover, if avoiding institutionalization is the sole aim, then attention is distracted from improving the quality of care in nursing homes, which will continue to be needed.
If social and health care issues related to disability and its antecedent conditions are not addressed coherently at the policy level, it should not be surprising that current approaches to prevention lack necessary comprehensiveness, continuity, and coordination. An essential first step toward achieving the requisite "3 C's" is to redefine the standard by which we judge our efforts.
Quality of life, not just physical functioning, should guide the design, organization, and integration of services. Although quality of life is a subjective concept, valid measures exist for assessing many of its components, including physical, cognitive, psychological, and social functioning. By broadening our attention to embrace all of these determinants of individual well-being, we are more likely to
develop service delivery systems that prevent needless impairment and disability.
Overcoming the fragmentation, lack of coordination, and large gaps in essential service components that now characterize health care and social service programs will not be easy. However, effective delivery of services requires a focal point of continuing responsibility and accountability. It also requires freeing up funding from overly restrictive and overly rigid reimbursement schemes so that the particular service needs of individuals can be accommodated. For insurers and other third-party payers, this will necessitate determining how to work with providers of social support services and other services that are now excluded from the traditional medical model upon which most insurance coverage is based.
Thus it seems obvious that new funding arrangements are needed, as are new relationships among service providers. It is not clear what forms these new arrangements and relationships should take, although several models probably will be needed.
Primary care providers, public health agencies, private insurers, voluntary associations, and community organizations should undertake the development and evaluation of collaborative demonstration projects that are designed to provide comprehensive, coordinated disability prevention programs. Interventions should focus on individual needs, with the goal of improving quality of life and physical, mental, and social well-being.
Education
Stereotypes are slow to die. In the area of disability prevention, however, clinging to outdated service delivery models and to disproved notions about the chronically ill and the elderly makes the prospects for progress quite poor. New thinking is required, and this can be achieved only through public and professional education.
More must be done in schools and in the home to instill in the young the importance of healthful behaviors. Health promotion, however, is relevant to all stages of life, and the themes are often the same (e.g., regular exercise, proper diet, avoidance of substance abuse, and injury prevention). Reinforcing messages in the community, the school, the workplace, and the physician's office can help create a social context that promotes healthful lifestyles. The change in public attitudes toward cigarette smoking clearly demonstrates that such constant reinforcement can have a positive impact on individuals, resulting in benefits for all of society.
Public attitudes toward the aging process have fostered an unduly pessimistic
view of the late stages of adulthood. Attention has focused on the health risks associated with aging. It would be far more constructive for society to concentrate on preventable extrinsic factors that underlie these increasing health risks. The public must be made aware of the potential for modifying the aging process and of the physical, psychological, environmental, and social determinants of the quality of life in late adulthood.
The thrust of educational programs for health care and social service professionals should be similar with regard to disabling conditions. However, medical education and training continue to emphasize the diagnosis and treatment of acute diseases. Consequently, treatment is usually fixed on the short term, whereas the needs of people with chronic disease and of the elderly are long term, and rates of cure and survival are the primary gauges of the success of therapeutic interventions. Moreover, underappreciation of other aspects of personal well-being and of the contribution of psychological, social, and economic variables to health status can result in inappropriate care. As a consequence, high-technology medicine tends to be favored even when low-tech services are likely to be more beneficial, and providers of health care and social services operate in isolation rather than as multidisciplinary teams.
The potential exists for modifying the quality of life associated with aging and chronic disease processes through individual lifestyle change and through social policies that ensure adequate income, educational opportunities, and social support across a person's life course. Broader measures that are more relevant for the individual, such as functional limitation and quality of life, are not integrated into professional education programs. In addition, health financing systems do not reward counseling, chronic disease management, and preventive measures in clinical practice.
Professional education should foster a quality-of-life perspective, one that does not treat all needs as medical in nature. Geriatric assessments provide a useful model that should be incorporated into the training of all health care professionals. Such assessments evaluate a patient's total situation, considering a broad range of functional abilities and analyzing the availability of social support.
On the basis of this type of comprehensive appraisal, a physician, nurse, or social worker can determine the elements of a comprehensive long-term program of care. For many elements, several options are possible, and most are likely to qualify as low technology. In addition, geriatric assessments have a follow-up component that fosters continuity.
Finally, while integration and continuity imply complexity, new information technologies offer opportunities to simplify case management and ensure coordination. Lap-top computers and bar code readers, for example, can be used to create patient data bases that provide a continuing record of
the administration of medications, the type of services received, and other information relevant to the care and well-being of individuals. In addition, information technologies should make more accessible the guidelines for preventive services and clinical protocols that are emerging from ongoing research on the effectiveness and outcomes of interventions. If this information were compiled in easy-to-use data bases, adoption of these consensus guidelines and protocols by health care professionals would be accelerated.


