
2
Magnitude and Dimensions of Disability in the United States
Disability is a serious public health and social issue in the United States. About 35 million Americans experience activity limitations owing to chronic health problems or impairments, and many of them are deprived economically and socially because of these limitations. They incur high health care costs and have special problems in accessing health care. Despite the apparent magnitude of the problem, however, few comprehensive assessments of the prevalence and nature of disability in the United States are available (Rice and LaPlante, 1988a).
Data on disability come from a wide variety of data systems, each of which collects data for its own purposes, requiring different standards and definitions. These different purposes provide for a rich diversity of information on disability in the United States, but the resulting differences in definitions and statistical practices make it difficult to assess the full public health and social impacts of disability in a comprehensive way (National Research Council, 1990).
This chapter reviews data from several of these systems. Comparing and synthesizing those data, it presents an analysis of the dimensions of disability in the United States, now and in the past, and describes the prevalence of disability and its associated chronic health conditions in the population. The focus is on the broad dimensions of disability rather than on special problems or populations. Similarly, this analysis focuses on the prevalence of disabling conditions, not on the causes of these limitations. This is followed by a brief discussion of the economic costs of disability.
DATA SOURCES
Students of disability-related issues continue to debate the best statistical system for assessing and analyzing the dimensions of disability (National
Research Council, 1990). As defined and described throughout this report, much of "disability" is a social issue, going beyond biological or functional limitations and relating to people's ability to perform their expected social roles. This chapter, however, attempts to avoid the debate about how disability should be defined and measured, and simply reports on the data that are available.
The National Health Interview Survey (NHIS) is a population survey that has been conducted continuously by the National Center for Health Statistics for almost 30 years (National Center for Health Statistics, 1989a). The NHIS data, particularly the data on "activity limitation," provide a reasonably consistent national picture over a long period of time, and hence are used as the framework of the synthesis in this chapter. These data are supplemented, where appropriate, by data from other surveys described below.
The National Health Interview Survey (NHIS)
The NHIS is designed to collect representative data on the civilian noninstitutionalized population living in the United States. Among those excluded from the scope of the NHIS are residents of nursing homes, members of the armed forces, prisoners, and U.S. citizens living abroad. In 1988, the survey reached a sample of 122,310 persons in 47,485 households. The use of households to locate survey respondents means that the NHIS tends to underrepresent that portion of the population, the homeless, for example, that do not live in households. To the extent possible, adults are interviewed directly. Proxy respondents provide information for all children in the household and for those adults who cannot be interviewed in person (National Center for Health Statistics, 1989a).
The NHIS data on activity limitation are obtained through questions that establish whether an "impairment or health problem" prevents or limits activities and whether that impairment or health problem is chronic. Respondents are further classified according to the degree of activity limitation: (1) limited, but not in "major activity" (the least severely limited category); (2) limited in amount or kind of "major activity"; or (3) unable to carry out "major activity'' (the most severely limited category). "Major activity" is defined as the predominant social role expected of a person of a given age. According to the current definition, the major activities are "playing" for children under age 5, "attending school" for children ages 5-17, "working or keeping house" for adults ages 18-69, and "living independently" for adults age 70 and over. As discussed below in the section on trends, however, these definitions have changed over time (National Center for Health Statistics, 1989a).
A chronic condition is one that has existed for at least three months or
one such as arthritis or heart disease that would normally continue for at least three months. Respondents who have more than one limiting condition are asked to identify one of them as the main cause of their limitation. Identification of these causes depends on the respondents' understanding of their conditions, their perceptions of how limiting they are, and their willingness to report them. In a separate set of questions, the NHIS also collects data on the overall prevalence of specific chronic conditions, without regard to whether the condition causes any activity limitation (National Center for Health Statistics, 1989a). This distinction between presence of a condition and limitation caused by a condition is consistent with the distinction that has been made between impairments or functional limitations and disability (Nagi, 1965; World Health Organization, 1980; Haber, 1990).
The ICD Survey of Disabled Americans
In late 1985, Louis Harris and Associates conducted a telephone survey for the International Center for the Disabled (ICD) and the National Council on the Handicapped to assess the attitudes and experiences of people with disabilities. The survey was designed to reach a representative sample of the population age 16 and over with disabilities, living in households with telephones in all states except Alaska and Hawaii. Individuals were included if they met any one of three criteria: (1) having a health condition that prevented full participation in work, school, or other activities; (2) having a physical disability, a seeing, hearing, or speaking impairment, an emotional or mental disability, or a learning disorder; or (3) reporting that one considered oneself disabled or that others would consider one disabled. In addition to questions on the nature and severity of their disability, the survey asked respondents about the impact of disability on their social and working lives, barriers to entering the mainstream, disability benefits, and other matters. The survey's methodology permitted an estimate of the prevalence of disability in the United States (Louis Harris and Associates, 1986).
Survey of Income and Program Participation (SIPP)
Conducted by the Census Bureau since 1983, the SIPP is an ongoing panel study of the economic well-being of U.S. households. In 1984, during the third round of interviews with its first panel, SIPP collected data on the extent of disability in the civilian noninstitutionalized population. These data include information on: (1) functional limitations; (2) work limitations; and (3) receipt of Social Security or veterans disability benefits (U.S. Department of Health and Human Services, 1989d).
For adults, the degree of functional limitation was based on ability to perform activities of daily living (ADLs),1 three of the standard instrumental activities of daily living (IADLs)2 (Katz, 1983), and six other sensory and physical functions. Individuals needing assistance with ADLs were the most severely limited, followed by those needing assistance with IADLs. A broader category of limitation—a "substantial" limitation—included all of those needing assistance with ADLs or IADLs plus people who were unable to perform one or more of the sensory or physical functions, or who had difficulty with two or more of those functions. For children, functional limitation was based on the presence of either a physical condition that limits the ability to walk, run, or play, or a mental or emotional condition that limits the ability to learn or do school work. These limitations in children were considered equivalent to "substantial" limitations in adults. Questions on work limitations were asked of persons ages 16-72. Unlike the NHIS, limitations due to acute conditions were not excluded. The data on receipt of disability benefits cover the noninstitutional resident population ages 18-64.
National Long-Term Care Surveys (NLTCS)
In 1982 and again in 1984, the Health Care Financing Administration conducted surveys of the Medicare-eligible population aged 65 and over to assess the characteristics of persons with chronic disabilities. Both surveys defined disability as a current or expected limitation of 90 days or more in the ability to perform one or more ADLs or IADLs. For the 1982 survey, interviews were conducted only with people living in the community; residents of nursing homes were excluded (Manton, 1989; Macken, 1986). The 1984 survey reinterviewed survivors from the first study, including those who had moved into nursing homes, and conducted first-time interviews with new respondents (Manton, 1989).
Supplement on Aging (SOA) and Longitudinal Study of Aging (LSOA)
Each year the NHIS supplements its core questionnaire with additional questions on special topics. In 1984 the special topic portion of the NHIS, the Supplement on Aging (SOA), addressed the health status and living arrangements of people aged 55 and older. The SOA collected detailed data on subjects that included the respondents' ability to perform ADLs and
IADLs, the presence of specific health impairments, and the respondents' work histories and disability benefits. The SOA also served as the baseline of a longitudinal study, the Longitudinal Study of Aging (LSOA), intended to study the impact of changes in functional status and living arrangements on institutionalization. The LSOA used three forms of follow-up: the National Death Index was used to locate those SOA respondents who died; Medicare files were used to determine hospital use and costs for respondents who were 65 or older at the time of the SOA interview; and surviving respondents who were 70 or older at the time of the SOA were reinterviewed in 1986 and 1988 (National Center for Health Statistics, 1987b).
PREVALENCE OF DISABILITY
Based on the 1988 NHIS, 33.1 million people, or 13.7 percent of the civilian noninstitutionalized population, have some degree of "activity limitation" due to chronic conditions. When one takes into account the estimated 2.2 million people with disabilities who live in institutional facilities such as nursing homes or residential facilities for the mentally retarded or mentally ill (U.S. Department of Health and Human Services, 1989d), the total number of Americans with disabilities is about 35 million. To describe the composition of this population, we begin with data on activity limitation from the NHIS and then use data from other sources to provide different perspectives.
NHIS Activity Limitation Data
The 33.1 million noninstitutionalized people with activity limitations fall into three groups of roughly equal size. Some 10.3 million (4.3 percent of the population) experience limitations that do not interfere with their major life activities. Another 13.1 million (5.4 percent of the population) are limited in amount or kind of major activities that they can carry out. The remaining 9.7 million (4.0 percent of the population) are unable to carry on the major activity for someone their age (National Center for Health Statistics, 1989a).
The combined prevalence of all three levels of activity limitation increases substantially with age, as shown in Figure 2-1. In 1988, the prevalence of any activity limitation increased from 2.2 percent of children under age 5 to 37.6 percent of adults age 70 or older.
The severity of limitation also increases with age, as Figure 2-1 shows. Among people with activity limitations, an increasing proportion in each age group up to age 70 is unable to carry out their major activities (the most severely affected group). After age 70, however, the proportion unable to carry on their major activities decreases, corresponding to the shift in the
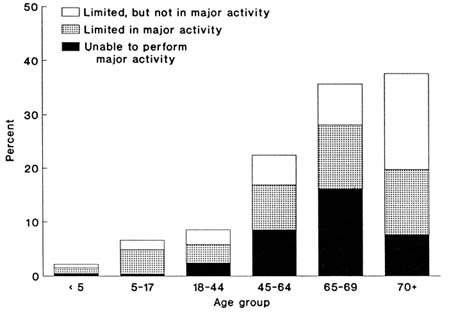
FIGURE 2-1 Prevalence of activity limitation due to chronic conditions by degree of limitation and age, 1988. Source: National Center for Health Statistics, 1989a.
definition of major activity from work to activities of daily living. Another factor in this pattern is that older people are more likely to reside in nursing homes and similar institutional facilities. Because nursing home residents tend to have more severe activity limitations, adding in the institutionalized population would amplify the trend toward increasing severity of disability with age.
Adjusting for the differences in their age distribution, women have slightly lower prevalence rates of activity limitation than men: 12.9 percent vs. 13.2 percent, respectively (National Center for Health Statistics, 1990a). Because women outnumber men in the population and because they have an older age distribution, however, women account for more than 53 percent of the people with activity limitations. Above age 70, women make up 62 percent of the population with activity limitations (National Center for Health Statistics, 1989a).
Blacks experience a higher prevalence of activity limitation than whites—16.3 percent for blacks vs. 12.8 percent for whites—when differences in age distributions are taken into account. Furthermore, blacks are likely to experience a greater degree of activity limitation: the proportion unable to carry out their major activities is substantially higher for blacks (6.6 percent) than for whites (3.5 percent) (National Center for Health Statistics, 1990a).
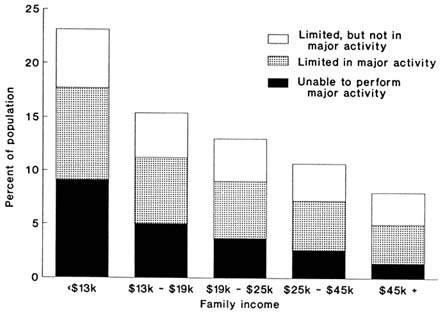
FIGURE 2-2 Prevalence of activity limitation due to chronic conditions, by degree of limitation and family income, 1988. Source: National Center for Health Statistics, 1990a.
Activity limitation is substantially more prevalent among people with lower family incomes, as Figure 2-2 shows. The prevalence of activity limitation decreases from 23.2 percent for people with incomes below $13,000 to 8.1 percent for people with annual family incomes above $45,000. The differential is larger for the most severe activity limitations: the proportion of people unable to carry out their major activities decreases from 9.1 percent in the lowest income group to 1.4 percent in the highest income group. Because the institutionalized population tends to have low incomes, adding this group to the NHIS sample would further amplify this differential (National Center for Health Statistics, 1990a).
It should be pointed out that the cause of these differentials is not clear. To some extent, people with lower socioeconomic status probably experience more disability just as they experience more injuries, higher mortality rates, less access to health care, and generally poorer health. On the other hand, some people have lower incomes because their disabling conditions restrict their ability to work. Cross-sectional survey data cannot provide any insight into the relative importance of these two very different explanations for the relationship between income and activity limitation.
In general, people with activity limitations are substantially older and poorer than those without limitations. With regard to age, 32 percent of people with activity limitation are over 65, compared with 9 percent of people without limitations. Only 10 percent of the population with activity limitations are under 18, compared with 29 percent of people without limitation. Furthermore, 22 percent of the population with activity limitations—compared with 10 percent of people without limitation—have incomes under $10,000, and 18 percent—compared with 33 percent—have incomes over $35,000.
Other Perspectives
The NHIS data (National Center for Health Statistics, 1989a) also provide perspectives on aspects of disability beyond activity limitation. For instance, respondents were restricted in activity for an average of 14.7 days in 1988 because of acute and chronic conditions, including an average of 6.3 bed-disability days. Furthermore, 39.1 percent of the respondents rated their own health as "excellent," 27.8 percent as "very good," and 23.2 percent as "good." Only 9.9 percent rated their health as "fair" or ''poor." This is smaller than the proportion—13.7 percent—that experience any activity limitation. As with activity limitation, the proportion of people who rate their health as fair or poor increases with age, decreases with income, and is higher for blacks than for whites.
As discussed below, a variety of other surveys and data systems generate estimates of the prevalence of disability. Tables 2-1, 2-2, and 2-3 present some of the measures available from the NHIS and other sources. The target population is usually the civilian noninstitutionalized population, but each study uses different criteria for identifying "disability." Without exception, however, people with disabilities tend to be older, to have less education, and to be poorer than the general population.
The ICD survey led to an estimate that about 27 million people, 15 percent of the population age 16 and over, had some disability. Broken down by age in Table 2-1, the prevalence rates are similar to those from the NHIS for the population under age 65. For people 65 and over, however, the NHIS rate is about a third higher. Even though the ICD criteria for disability could be expected to include more people than the NHIS, use of only telephone interviews may have tended to exclude older people with disabilities.
Among those included in the ICD survey, 8 percent reported that they experienced no limitation in their activities, and 50 percent did not consider themselves disabled even though they met at least one of the survey's "disability" criteria. However, 46 percent said that they were prevented completely from working, going to school, or keeping house. Two-thirds of the people under age 65 were not working, and two-thirds of the people who were not working reported wanting to work.
TABLE 2-1 Alternative Estimates of Functional and Activity Limitation by Age: United States
|
Survey |
Under 18 |
18-44 |
45-64 |
65 and Over |
|
Numbers (in thousands) |
|
|
|
|
|
Activity limitation |
|
|
|
|
|
National Health Interview Survey (1985) |
3,221 |
8,391 |
10,405 |
10,709 |
|
ICD-Louis Harris (1985) |
— |
8,800a |
10,200 |
8,000 |
|
Functional limitation |
|
|
|
|
|
Survey of Income and Program Participation (1984) |
2,326 |
11,139b |
10,541c |
15,466 |
|
Percent of population group |
|
|
|
|
|
Activity limitation |
|
|
|
|
|
National Health Interview Survey (1985) |
5.1 |
8.4 |
23.4 |
39.6 |
|
ICD-Louis Harris (1985) |
— |
8.2a |
22.7 |
28.0 |
|
Functional limitation |
|
|
|
|
|
Survey of Income and Program Participation (1984) |
3.7 |
10.1b |
31.9c |
58.7 |
|
Notes: Definition of disability differs for each survey. National Health Interview Survey: Unable to carry out major activity; limited in amount or kind of major activity; or limited, but not in major activity. International Center for the Disabled—Louis Harris Survey : Prevented from full participation in work, school, or other activities; having a physical disability, seeing, hearing, or speaking impairment, an emotional or mental disability, or a learning disorder; or considering oneself disabled or considered disabled by others. Survey of Income and Program Participation: For adults, needs assistance with ADLs or IADLS; inability or difficulty in at least one function. For children, having a physical condition that limits the ability to walk, run, or play, or a mental or emotional condition that limits the ability to learn or do school work. a Ages 16-44. b Ages 18-49. c Ages 50-64. SOURCES: National Center for Health Statistics, 1986; Louis Harris and Associates, Inc., 1986; calculated from Rice and LaPlante, 1988a; U.S. Department of Health and Human Services, 1989d. |
||||
The relationships among a number of different measures of disability are illustrated in Figure 2-3, from the 1984 SIPP. Each box represents a segment of the population (in thousands) meeting a particular combination of conditions. For example, in the bottom right corner 956,000 people are age 65 to 72 and have a work limitation but report no limitations in functioning.
TABLE 2-2 Alternative Estimates of Work Limitation Among Persons Ages 18 to 64: United States
|
Survey |
Any Work Limit |
Unable to Work |
|
Numbers (in thousands) |
|
|
|
National Health Interview Survey (1983-85) |
14,347 |
7,785 |
|
Survey of Income and Program Participation (1984) |
17,950 |
8,025 |
|
Current Population Survey (1985)a |
13,336 |
6,893 |
|
Disability benefit recipients (1984) |
4,400 |
— |
|
Percent of population group |
|
|
|
National Health Interview Survey (1983-85) |
10.1 |
5.5 |
|
Survey of Income and Program Participation (1984) |
12.5 |
5.6 |
|
Current Population Survey (1985)a |
8.8 |
4.5 |
|
Disability benefit recipients (1984) |
3.1 |
— |
|
Notes: Disability Benefit Recipients: Social Security Disability Insurance, Supplemental Security Income, or Veterans Administration benefits. a Ages 16-64. SOURCES: LaPlante, 1988; U.S. Department of Health and Human Services, 1989d; calculated from Haber, 1990, and U.S. Bureau of the Census, 1988. |
||
On the basis of functional limitations, the SIPP estimated that 39.5 million people, 17 percent of the noninstitutionalized population, had some degree of disability. (In Figure 2-3, this number is the sum of all numbers in boxes labeled "limitations in functioning," i.e., 2,326 + 9,677 + 8,422 + 3,443 + 118 + 11,310 + 4,157). Another example is work limitations, where the number of persons in the population ages 18-64 with any work limitation totals 17.95 million people (i.e., 8,442 + 3,443 + 549 + 5,515).
Table 2-1 shows that the SIPP produced a lower estimate of disability among children than the NHIS. Some of the difference may be due to different types of questions. The SIPP asks a general question on whether any children have limitations, and only with a positive response does it go on to ask which children, up to a total of three. The NHIS includes an individualized inquiry on the presence of activity limitation for each child in the household. For younger adults, the two surveys produce comparable results. At older ages, however, the SIPP shows much higher rates of disability than the NHIS. For people 65 and over, the SIPP rate is half again as high as the NHIS rate. The more extensive questions in the SIPP on the ability to perform specific functions may provide a greater opportunity for respondents to identify limitations.
The SIPP produces estimates of the prevalence of work limitation somewhat higher than those of the NHIS, 18.0 million vs. 14.4 million. Part of this difference may be due to the exclusion of acute conditions as causes of work disability in the NHIS. About 6.4 million of the people with work limitations in the SIPP report no functional limitations, however. Individuals with mental or emotional conditions that limit their ability to work may not have any difficulty with the physical activities that SIPP uses to define functional limitation (U.S. Department of Health and Human Services, 1989d).
TABLE 2-3 Alternative Estimates of Degrees of Functional Limitation Among Persons Age 65 and Over: United States
|
|
Degree of Limitation |
|||
|
Survey |
More |
Less |
Any |
|
|
Numbers (in thousands) |
|
|
|
|
|
National Health Interview Surveya (1983-1985) ADL/IADL |
1,507 |
2,862 |
4,369 |
|
|
Survey of Income and Program Participationb (1984) |
1,683 |
2,799 |
4,482 |
|
|
Long-Term Care Surveyc (1982) |
3,384 |
1,690 |
5,074 |
|
|
Long-Term Care Surveyc (1984) |
3,500 |
1,965 |
5,465 |
|
|
Percent of population group |
|
|
|
|
|
National Health Interview Surveya (1983-1985) ADL/IADL |
5.7 |
10.8 |
16.5 |
|
|
Survey of Income and Program Participationb (1984) |
6.4 |
10.6 |
17.0 |
|
|
Long-Term Care Surveyc (1982) |
12.7 |
6.4 |
19.1 |
|
|
Long-Term Care Surveyc (1984) |
12.9 |
7.2 |
20.1 |
|
|
Note: ADL = activities of daily living; IADL = instrumental activities of daily living. The activities related to a specific degree of limitation vary among the surveys. "Any" limitation is the sum of the two separate degrees of limitation. a National Health Interview Survey: Major Activity: More = unable to carry out major activity; Less = limited in amount or kind of major activity. ADL/IADL: More = needing assistance in any ADL; Less = needing assistance only in IADLs. b Survey of Income and Program Participation: More = needs assistance with ADLs; Less = needs assistance only with IADLs. c Long-Term Care Surveys: More = any limitations in ADLs; Less = limitations only in IADLs. SOURCES: Calculated from LaPlante, 1988; U.S. Department of Health and Human Services, 1989; Macken, 1986; Manton, 1989. |
||||
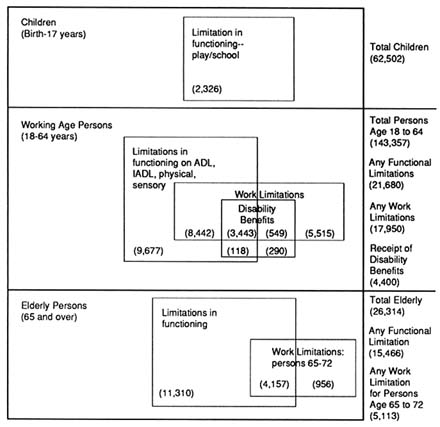
FIGURE 2-3 Illustration of conceptual relationships between disability measures in SIPP (population counts in thousands). Source: U.S. Department of Health and Human Services, 1989d.
The SIPP also provides estimates of persons receiving disability benefits from Social Security Disability Insurance, Supplemental Security Income, or the Veterans Administration. Among people ages 18-64, only 4.4 million are receiving benefits. The NHIS and the SIPP found three to four times as many people with some health condition or impairment that limited their ability to work, but specific eligibility requirements for these benefit programs will exclude many people.
Most efforts to measure disability among people age 65 and over make use of questions on the ability to perform ADLs and IADLs. Even when surveys seem to use similar approaches to identifying limitations, the results vary. Table 2-3 shows roughly similar estimates for any limitation in ADLs and IADLs in the noninstitutionalized population ranging from 16.5
percent in the NHIS to 20.1 percent in the 1984 National Long-Term Care Survey (NLTCS). When these estimates are broken down by degree of limitation, however, the two NLTCS surveys show a level of ADL limitations twice that of either the NHIS or SIPP.
Because the size of the population at age 65 and over is growing rapidly, even relatively small differences in the estimates from different surveys can translate into important differences in expected health care and insurance costs. The Interagency Forum on Aging-Related Statistics has made a detailed review of the sources of the variations among 11 national surveys conducted during the mid-1980s (Wiener et al., 1990). They identified several contributing factors, including differences in the lists and groupings of ADLs, in how limitations in these activities were established, in sampling frames, and in the use of proxy respondents.
TRENDS IN THE PREVALENCE OF DISABILITY
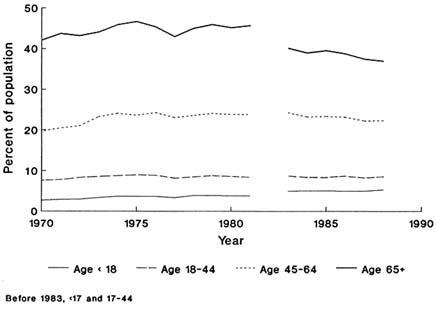
The number of people reporting any activity limitation in the NHIS increased from 24 million in 1970 to 33 million in 1988, as shown in Figure 2-4. The increase was greatest between 1970 and 1981, but the trend has been relatively unchanged since then. The proportion of the population with activity limitations has increased less rapidly over the same period, however, changing from 11.8 to 13.7 percent. As Figure 2-4 shows, adjusting for the changing age distribution of the population makes very little difference. The trends in the prevalence of limitation in major activity (not shown) are very similar to those for any limitation.
These trends need to be interpreted with caution because of changes that occurred in the NHIS between 1981 and 1983.3 At that time, the definition of "major activity" for people age 70 and above was changed from work or keeping house to the ability to carry on the activities of daily living. A second change allowed for all people ages 18-69 to report on limitations in their ability to work. Previously, women who did not work because of chronic conditions were not classified as limited in their major activity if they were able to keep house. A further change altered age ranges for specific major activities. The youngest group was changed from under age 6 to under age 5, and the school-age population shifted from ages 6-16 to ages 5-17 (National Center for Health Statistics, 1990b). With these various changes the proportion of people with any limitation in their major activity dropped correspondingly from 10.9 to 9.9 percent between 1981 and 1983. There was, however, essentially no change in the prevalence of any activity limitation: the proportion decreased from 14.4 to 14.3 percent.
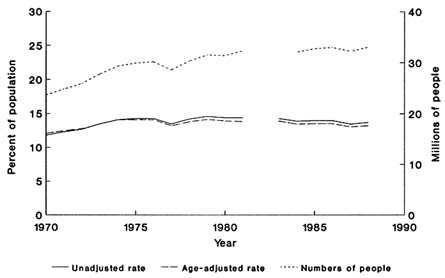
FIGURE 2-4 Trends in prevalence and numbers of people with any activity limitation.
Source: National Center for Health Statistics, 1970-1988.
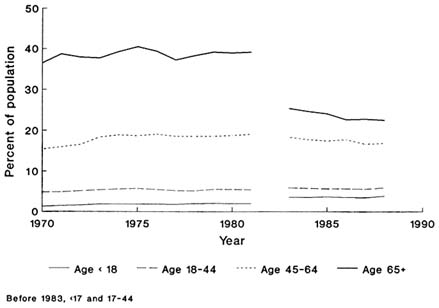
A more detailed picture of trends in prevalence emerges when the age-specific rates in Figures 2-5 and 2-6 are examined. Prevalence rates are relatively flat for most age groups over the entire period, but there is some increase in the prevalence of activity limitation in the early 1970s, especially for those age 45-64. The changes of definition clearly show up between 1981 and 1983 in Figure 2-6 as an increase in the proportion of children with limitation in major activity and a decrease in the proportion of people 65 and over with limitation in major activity. The differences are especially evident in the figures for people 65 and over with limitations in major activity, as one would expect. The steady overall prevalence of any limitation reflects the balancing of a substantial decrease in prevalence among people over 65 against a smaller proportional increase (in a larger population) among people under age 18.
Colvez and Blanchet (1981) note the increased prevalence of activity limitation in the NHIS data (between 1966 and 1976) and discuss a number of possible explanations. Because the increase is concentrated in men age 45-64 who report that they are unable to work, Wilson and Drury (1984) suggest that the increasing availability of health-related retirement benefits during that period, and perhaps decreasing stigma attached to "disability," could explain a large part of the increase in activity limitation during that period. They also suggest that increased access to health care (especially screening for hypertension and other asymptomatic chronic diseases) could result in physician-ordered activity reduction and improved awareness of
chronic conditions, thus contributing to the apparent increase in disability without any change in the population's health status. Wolfe and Haveman (1990), in their analysis of trends in work disability from 1962 to 1984, suggest that less stringent eligibility criteria for public disability assistance programs, together with increased willingness to report work limitations, may have acted to increase disability rates through the early 1970s. Subsequent tightening of eligibility criteria appear to have helped reduce the work disability rates from their 1970s peak.
Verbrugge (1984) compares this increase in disability to the decrease in mortality during the same period. After analyzing the possible explanations for these two apparently divergent trends on a disease-specific basis, she concludes that an emphasis on secondary prevention—early detection of chronic disease and intervention to slow its progress—is a major part of the explanation. Based on this analysis, she predicts that health statistics will continue to show increasing morbidity through the turn of the century. Whether this trend continues depends on the success of primary prevention programs to halt the incidence of disease in the future (Verbrugge, 1984).
Other analysts have concentrated on future changes in the prevalence of disability that can be expected due to demographic changes. Assuming that age- and sex-specific disability prevalence rates remain constant, Manton (1989) has estimated that the elderly population with chronic disabling conditions (living in the community and in institutions) could grow by 31 percent to 7.2 million between 1985 and 2000. This compares with a projected 20 percent increase in the nondisabled population. Manton also projects that the most severely disabled population (those with five to six ADL impairments) and the population in institutions could grow even faster. These trends are expected to continue well into the twenty-first century as the baby boom generation ages. In 2060, for instance, the number of people aged 65 or older with chronic disabling conditions could exceed 15 million (Manton, 1989). Schneider and Guralnik (1990) project similar increases in the number of older people requiring nursing home services and experiencing disabling conditions such as dementia and hip fractures.
CONDITIONS LEADING TO DISABILITY
A wide variety of chronic conditions are responsible for activity limitation in the United States. Looking at the single "main cause" of activity limitation as reported by respondents in the NHIS, orthopedic impairments account for 16.0 percent of activity limitations, arthritis for 12.3 percent, heart disease for 11.5 percent. The left half of Table 2-4 gives the 15 single
TABLE 2-4 Percentage of Persons with Activity Limitation Reporting Specified Causes of Limitation, All Ages: United States, 1983-1985
conditions most commonly cited by the respondents in 1983-1985 as the main cause of their activity limitations (LaPlante, 1989b).
Because there are many different kinds of conditions that can lead to activity limitation, grouping related conditions helps one to discern the relationship among them. Constrained by the available tabulations (LaPlante, 1988), the committee grouped the conditions as follows (the figures in parentheses are the proportion of people with limitations whose main cause of limitation is in that category):
-
mobility limitations (38 percent)
-
chronic diseases, namely respiratory, circulatory, cancer, and diabetes (32 percent)
-
sensory limitations (8 percent)
-
intellectual limitations, including mental retardation (7 percent)
-
other (15 percent).
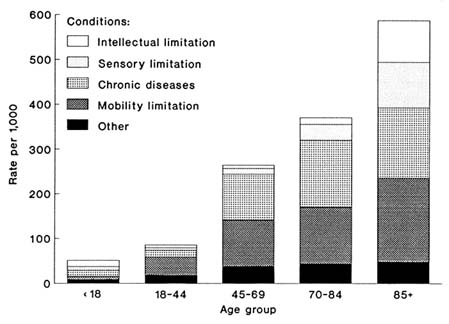
FIGURE 2-7 Prevalence of main causes of activity limitation, by age, 1983-1985.
Source: Calculated from LaPlante, 1988.
Figure 2-7 displays the age-specific prevalence rates for any activity limitation designated according to these five groups of causes. Figure 2-8 shows the proportion of activity limitation in each age group ascribed to each of these groups of conditions.
Figures 2-7 and 2-8 show that the main causes of activity limitation vary markedly with age. In children under 18, intellectual limitations (two-thirds of which are mental retardation and one-third mental illness) account for 27 percent and chronic diseases (two-thirds of which are asthma) account for 26 percent of all activity limitations. Sensory limitations, especially visual and hearing, also account for a relatively high fraction (16 percent), followed by mobility limitations (14 percent).
Above age 18 mobility impairments become more prevalent and are the leading major cause of activity limitation for all adult age groups. The prevalence of activity limitation caused mainly by mobility impairments increases from 40.5 per 1,000 at ages 18-44 to 188.4 per 1,000 at ages 85 and above. The components of this group change by age, however. For ages 18-44, back/spine injuries dominate at 48 percent, followed by orthopedic impairments at 29 percent. Arthritis accounts for 11 percent of the
mobility impairments in this age group. For older ages, arthritis becomes increasingly important; its share of the mobility limitation impairments rises from 40 percent at ages 45-69 to 58 percent at ages 85 and above. These increasing percentages are applied to an increasing base of people with mobility limitations, so the prevalence of people with limitations caused mainly by arthritis increases more than 20-fold from 4.6 per 1,000 at ages 18-44 to 109.3 per 1,000 at ages 85 and older.
The importance of chronic diseases (circulatory, respiratory, cancer, diabetes, etc.) as conditions causing activity limitation also increases with age. Taken together, the prevalence of limitation with a main cause in this group increases 10-fold from 15.5 per 1,000 at ages 18-44 to 156.2 per 1,000 at ages 85 and above. Diseases of the heart and circulatory system are the major contributors to this category, increasing from two-thirds of the category at ages 45-69 to three-fourths over age 85.
Verbrugge and colleagues (1989) note that the aggregate measures cited here are actually a function of two components: a condition's prevalence, and whether the condition becomes a disability. These aggregate measures are appropriate measures of public health impact. When comparing the causes of disability, however, it can be helpful to look at each condition's
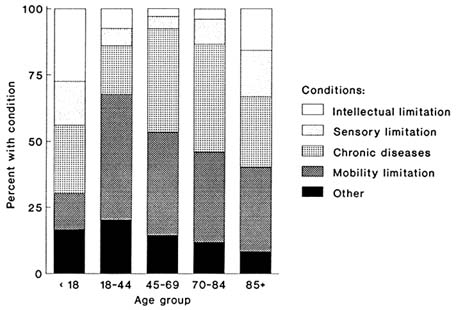
FIGURE 2-8 Percentage distribution of main causes of activity limitation, by age, 1983-1985. Source: Calculated from LaPlante, 1988.
''disability impact"—the probability or level of disability among people with a given condition.4 Using data from the 1984 Supplement on Aging, Verbrugge and colleagues find a negative relationship between the frequency of a condition and its disability impact. LaPlante (1988) finds a similar relationship in 1983-1985 NHIS data.
The foregoing analyses are based on only the "main" causes of the respondents' activity limitations. Many people who report activity limitations list more than one condition contributing to their limitations. Because there are so many possible combinations of conditions and relatively few people with any particular combination in any survey, analyses of the effect of multiple conditions on disability are limited.
The right half of Table 2-4 shows the prevalence of the 15 most commonly cited conditions responsible for activity limitations, regardless of whether the condition was listed as the main cause. This list is generally similar to the list of main causes. The most notable difference is that hypertension and diabetes move up from ranks 9 and 11 to ranks 4 and 6, respectively, as their prevalence more than doubles. This suggests that a more comprehensive listing of all of the contributing conditions would put more emphasis on chronic diseases than the analysis here of only main causes.
Verbrugge and colleagues have found that as the number of chronic conditions affecting an individual increases, "disability" increases rapidly. This is true when disability is measured in terms of physical or role limitations or by ADL/IADL measures. Only in rare instances, however, is there a synergism between conditions that produce more disability than the two alone would suggest (Verbrugge et al., 1989).
Grouping NHIS data from 1969-1971 and 1979-1981, Rice and LaPlante (1988a) found that the number of chronic conditions reported by those who are limited in their activities increases with age, and that the degree of limitation increases with the number of conditions. The researchers also found that, within every age group and limitation category, the number of conditions has increased over time. It is possible, however, that some of this increase reflects increasing awareness of conditions—perhaps due to improved access to medical care and screening opportunities—rather than a true increase in chronic conditions.
Because they are derived from a single survey, these data on the causes of activity limitation all refer to a cross-section of the population. The "causes"
listed are actually chronic conditions that may have had very different underlying causes earlier in life. Blindness, for instance, could be a congenital condition or the result of a developmental problem; it could also be due to an injury or a disease such as diabetes. The NHIS data cannot distinguish between these very different possibilities. Furthermore, disability is a dynamic process in which illness and injuries that occur in one life stage have serious implications for the quality of life in later stages. The life table calculations below are a first step toward putting disability in a life course perspective.
LIFE TABLE PERSPECTIVE
Just as one can calculate the average length of life in a population exposed to certain mortality rates, one can also calculate the total number of years a member of this population would spend with various levels of activity limitation. Ideally, this calculation would be carried out using age-specific transition rates among the various categories of activity limitation, just as age-specific mortality rates are used to describe transitions from life to death in ordinary life tables (Rogers, R.G., et al., 1989). Because the necessary transition data are not available for activity limitation, the committee has adopted a hybrid approach (Sullivan, 1971; McKinlay et al., 1989). First, standard life table methods were used to calculate the number of years of life experienced by a cohort in various age groups according to the 1987 U.S. life table (National Center for Health Statistics, 1990c). Second, within each age group for which LaPlante (1988) has tabulated the NHIS activity limitation data, a calculation was made of the number of years lived with various kinds of activity limitations. Based on these results, the committee then calculated the life expectancy without disability and in the various activity-limited states.5 Because the NHIS figures refer to only the noninstitutionalized population, the committee's calculations underestimate time with activity limitations.
Given current age patterns of activity limitation, an average of 12.8 years out of the current life expectancy at birth of 75.0 years would be spent with some degree of activity limitation. As shown in Figure 2-9, an average of 6.9 of the 16.9 years remaining at age 65 would be spent with some activity limitation. At age 75, the remaining 10.7 years would be expected to include 4.6 with some activity limitation. This analysis suggests that, if current patterns of mortality and activity limitation continue, the 3.8 million children born in 1987 can expect to experience a collective total of 49
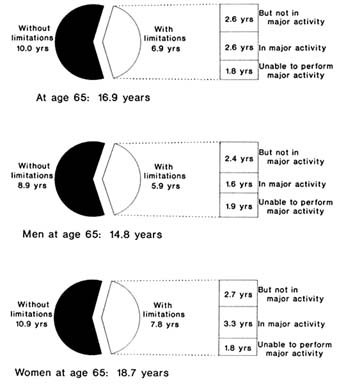
FIGURE 2-9 Expected years of life with activity limitation at age 65, by sex, 1987.
Source: LaPlante, 1988; National Center for Health Statistics, 1990c.
million disability years. Together, the roughly 2 million Americans who turn 65 each year can expect to experience more than 12 million disability years out of the 33.8 million years of life ahead of them.
As Figure 2-10 further shows, of the 12.8 years of activity limitation expected at birth, the population would average 3.6 years of being unable to carry out a major activity, 5.3 years with a limitation in major activity, and 4.0 years with some other activity limitation. At age 65, the expected years of activity limitation would consist of 1.8 years of being unable to carry out a major activity, 2.6 years with some limitation in major activity, and 2.6 years with a less severe limitation. The expected distribution at age 75 is similar to that at age 65.
Separate calculations for men and women reveal that, while women can expect at birth to live 6.9 years longer than men, both will spend a similar proportion of their lifetimes with some form of activity limitation (see Figure 2-10). At birth women can expect to experience 14.1 years of activity limitation

FIGURE 2-10 Expected years of life with activity limitation at birth, by sex.
Source: LaPlante, 1988; National Center for Health Statistics, 1990c
out of a total of 78.4 years. Men can expect 11.6 years out of 71.5. The degree of limitation appears to be more severe in men. For about one-third of their expected years of activity limitation, 4.0 years, men are unable to perform their major activity. Women expect only 3.1 years with this degree of limitation, less than a quarter of the years with activity limitation.
These patterns are similar at age 65. Activity limitation accounts for 40 percent of the expected 14.8 years of additional life for men and 42 percent of the 18.7 years expected for women. Inability to perform major activities continues to account for more limitation for men than for women. For men, however, the largest share of activity limitation, 2.4 years, or 41 percent, is in activities other than their major activity. Limitations in the amount and kind of major activity account for the largest share of women's years of limitation—3.3 years, or 42 percent. By age 75, however, women can expect a greater period of activity limitation than men in both absolute and relative terms: 47 percent of the years of life remaining for women vs. 42 percent for men.
Repeating the life table calculations for earlier years makes it possible to estimate the relative impact of changes in mortality and disability. Use of 1970 mortality (National Center for Health Statistics, 1974) and NHIS data (National Center for Health Statistics, 1972, 1986) shows that while life expectancy at birth increased 4.1 years from 70.9 to 75.0, the number of years with activity limitations increased by 2.4 years from 10.4 to 12.8 years. Thus more than half of the increase in life expectancy in the 1970s and 1980s was lived with some degree of activity limitation. Years of limitation in major activity increased by 2.8 years during this period, implying that there was a decrease in years with less severe limitation. During the same period, life expectancy at age 65 increased by 1.7 years, but less than half of this increase—0.5 years—was time with activity limitation. Taken together, these results show that the increase in activity limitation between 1970 and 1987 was concentrated in people under age 65 who were restricted in their major activities. This is consistent with the trend analysis discussed earlier.
A striking contrast emerges from this overall pattern when men and women are studied separately. For men, expectation of life at birth increased by 4.4 years from 1970 to 1987, and almost two-thirds of that increase, 2.8 years, was in life without activity limitations. Women, however, added only 3.6 additional years of life and nearly all of it, 3.3 years, was in life with limitations. The changes at older ages were more divergent. For men at age 65, the gain in years of life without limitation, 1.8 years, was greater by 0.1 year than the overall gain in expected years of life. By contrast, women at age 75 can expect 1.5 more years of life with limitations, 0.2 year more than the overall gain during the period.
This apparent worsening of the disability status of women probably reflects at least two factors not directly related to changes in health status. One is the 1982 change in how the NHIS assessed limitation in major activity. Prior to that time, women ages 17-64 who reported that they were able to keep house were not questioned about limitations in their ability to work outside the home. Thus limitation comparable to that experienced by men was missed. The second factor is the increasing number of women between 1970 and the mid-1980s who would define work as their major activity and, therefore, be at risk of limitations in their ability to perform that activity.
Crimmins, Saito, and Ingegneri (1989) have carried out similar calculations comparing 1970 and 1980 data, making use of information available for those years on the institutionalized population and more detailed age, race, and sex categories. Qualitatively, their results are similar to those in this section. Crimmins and colleagues add that, although whites had substantially longer life expectancies than blacks, blacks can expect more years of activity limitation. Furthermore, although life expectancy increased more
TABLE 2-5 Years of Expected Life with Activity Limitations Due to Specified Conditions at Birth, at Age 65, and at Age 75: United States, 1987
|
Condition |
Years at Birth |
Years at Age 65 |
Years at Age 75 |
|
All conditions |
12.8 |
6.3 |
4.6 |
|
Mobility limitations |
4.7 |
2.2 |
1.6 |
|
Intellectual impairments |
0.9 |
0.4 |
0.4 |
|
Sensory impairments |
1.0 |
0.6 |
0.6 |
|
Chronic diseases |
4.3 |
2.3 |
1.6 |
|
Other conditions or impairments |
1.8 |
0.7 |
0.5 |
|
SOURCE: Calculated from National Center for Health Statistics, 1990c, and LaPlante, 1988. |
|||
for blacks than for whites between 1970 and 1980, the expected number of activity-limited years also increased more for blacks. The researchers also note that, although the United States, Canada, and France had similar total life expectancies around 1980, Canadians and the French could expect 2 to 5 additional years free of activity limitation.
The life table perspective can also be used to determine the average impact of the conditions that are reported as the main cause of activity limitation. Table 2-5 shows the number of years of activity limitation expected at birth and at ages 65 and 75 that would be attributed to mobility limitations, intellectual impairments, sensory impairments, chronic disease, and other kinds of conditions and impairments. Mobility limitations and chronic diseases account for about 70 percent of the years of activity limitation expected at birth and at older ages. At birth, mobility limitations are a slightly more prominent cause of activity limitation than are chronic diseases (4.7 vs. 4.3 years, respectively), but at age 65 chronic diseases are slightly more prominent than are mobility limitations (2.3 vs. 2.2 years).
The conditions that lead to activity limitation differ substantially in the age at which they occur, and hence in the number of years that people live with disabilities associated with them. Disability that begins early in life is most commonly associated with developmental disabilities and mobility limitations caused by injuries. Disability that begins later in life is more commonly associated with chronic diseases and mobility limitations due to arthritis. The relative impact of different disabling conditions on the health of the public is clearly of interest in setting prevention priorities. Although the available data do not allow one to calculate the impact of different underlying causes, the life table analysis presented here can provide a rough approximation of the relative impact of disabilities acquired early
and late in life. For this analysis the committee defined "early in life" as occurring before age 45 and "late in life" as after age 45.6
The results of this calculation are that about 6.1 of the 12.8 years of activity limitation expected at birth—slightly less than half—are due to conditions that had their onset before age 45. Thus, although conditions acquired early in life lead to more years of disability per case, the number of individuals who acquire disabilities after age 45 is much greater. Comparing the two in a life course perspective suggests that, in the aggregate, more years of disability are experienced by people acquiring limitations later in life (after age 45). Thus, despite the length of time that people live with developmental disabilities and mobility limitations due to injuries at early ages, more disability years are experienced by people whose disability appears later in life (after age 45), primarily because of chronic diseases and mobility limitation due to arthritis.
The analyses in this section are based on a hybrid analytical approach that mixes current-status activity limitation data with dynamic mortality data. Rogers and colleagues have developed a more sophisticated approach to this issue that makes use of data on transitions into and out of disability, and from one degree of disability to another. Their approach allows them to go beyond general statistics for the population as a whole to estimates of the expected time with different degrees of disability for people who have (or do not have) a disability at a particular age (Rogers, R.G., et al., 1989; Rogers, A., et al., 1989). The method they developed, however, requires data from a panel study of individuals surveyed at two points in time.
Because disability data of this type for the general population are lacking, the method has only been applied to data on older adults.
To make their estimates, Rogers and colleagues used data on ADLs reported by individuals interviewed in both the 1984 Supplement on Aging of the NHIS and the 1986 Longitudinal Study of Aging (LSOA), and they defined "dependence" as requiring assistance with seven ADLs. The researchers found that individuals who were independent at age 70 could expect to live 13.4 years on average and had a life expectancy of 3.4 years in a dependent state (25 percent of their life expectancy). Individuals who were dependent at age 70 had a total life expectancy of 12.5 years and a dependent life expectancy of 6.1 years (49 percent). Rogers and his colleagues also found differences in the active life expectancies of men and women. Among those independent at age 70, men had a lower life expectancy than women (11.3 vs. 15.4 years) but a proportionally shorter dependent life expectancy (18 percent vs. 29 percent of total life expectancy). The same pattern held among people who were dependent at age 70. Men had a 9.9-year life expectancy, 40 percent of which was in a dependent state, and women had a 14.5-year life expectancy, 53 percent of which was in a dependent state (Rogers, R.G., et al., 1989).
ECONOMIC COST OF DISABILITY
Disability imposes an enormous economic cost on society. It is costly to the nation in terms of the medical resources used for care, treatment, and rehabilitation; in reduced or lost productivity; and in premature death. For example, persons with disabilities use more medical care services than those without them. In 1979, 15 percent of the noninstitutionalized population that was limited in activity due to chronic conditions made 29 percent of the visits to physicians and accounted for 40 percent of the hospitalizations. Persons with activity limitations made 9.5 physician visits per person, compared with about 3.9 visits for persons with no activity limitation (National Center for Health Statistics, 1981a). Those unable to carry on their major activities made 11.9 visits per person per year. The hospitalization rate for those with activity limitations is almost four times that for people with no activity limitations: 38.3 discharges per 100 persons compared with 9.8 per 100, respectively.
Not surprisingly, older persons with chronic and disabling conditions are high utilizers of medical resources. The elderly with activity limitation had 8.7 visits to physicians per year, in contrast with 4.3 visits for persons with no activity limitation. They had 41.2 hospitalizations per 100 elderly persons per year, in contrast with 14.8 hospitalizations per 100 people with no limitation of activity. The 46 percent of elderly people who were limited in activity because of a chronic condition accounted for 63 percent of physician
contacts, 71 percent of hospitalizations, and 82 percent of all the days that older people spent in bed because of health conditions (National Center for Health Statistics, 1981a). Among the 1.5 million nursing home residents in 1985, more than four-fifths (82.1 percent) were reported by their next of kin at the time of admission as being dependent in one or more activities of daily living. More than half (50.5 percent) were dependent in four or more ADLs (National Center for Health Statistics, 1989b).
In addition, current medical service, social services, and entitlement programs for persons with disabling conditions are not well coordinated at the national and state levels and offer uncertain benefits with regard to restoring persons with disabling conditions to their highest levels of functioning. Assessments of the effectiveness of these programs are largely unsatisfactory because the evaluations usually measure traditional medical outcomes (physiological and biochemical results) rather than quality of life.
Health services research is needed for the development and application of improved methodologies to measure the effectiveness of the health and social service systems on maintaining those persons with disabling conditions at maximal functional capacity and quality of life.
Several estimates of the high economic costs of disability in the United States are now available. Chirikos (1989) estimates aggregate economic disability losses at $176.8 billion in 1980, as shown in Table 2-6. Included are:
-
net consumption attributable to disability, that is, the difference in medical care utilization and costs before and after the disabling condition occurred. This amounts to $90.6 billion, 51 percent of the total, and includes expenditures for hospital, medical, and institutional care of people with disabilities, paid household work, and non-health-care spending;
-
primary market time, or the value of reduced productivity on the part of persons with chronic disability, valued at $68.4 billion, or 39 percent of the total; and
-
secondary market time, or the value of productivity losses for members of the households of persons with disabilities, valued at $17.7 billion, or 10 percent of the total.
Disability losses for males were significantly higher than for females—$115 billion and $62 billion, respectively. Losses for the working population were estimated at $112 billion; losses for dependents were estimated at $65 billion.
Berkowitz and Greene (1989) used a different approach for estimating the cost of disability. They estimated disability expenditures in 1986 for the
TABLE 2-6 Disability Losses (in millions of dollars) for the Population Aged 18-64 Years, by Sex and Age, 1980
|
Age Group |
Total |
Males |
Females |
|
Total |
$176,778 |
$115,140 |
$61,638 |
|
Working population |
111,605 |
82,680 |
28,925 |
|
15-24 |
6,726 |
4,198 |
2,528 |
|
25-44 |
32,117 |
23,102 |
9,015 |
|
45-64 |
72,762 |
55,380 |
17,382 |
|
Dependents |
65,173 |
32,460 |
32,713 |
|
Under 15 |
4,206 |
2,630 |
1,576 |
|
65-74 |
29,858 |
18,408 |
11,450 |
|
75 and over |
31,109 |
11,422 |
19,687 |
|
SOURCE: Adapted from Chirikos, 1989. |
|||
population aged 18 to 64 years to be $169.4 billion, comprising three types of expenditures:
-
transfer payments (transfer of funds from one payer to another in which no new goods or services are produced) amounted to $87.3 billion; included are social insurance programs, individual and employer programs, and income support;
-
medical care expenditures, which amounted to $79.3 billion in 1986; included are expenditures under public programs (Medicare, Medicaid, Department of Defense, Veterans Administration, and Workers' Compensation) and private insurance; and
-
direct service expenditures, which amounted to $2.8 billion; included are expenditures for rehabilitative services, veterans services, services offered to persons with specific impairments, general federal programs, and employment assistance programs (Table 2-7).
Berkowitz and Greene (1989) also present disability expenditure trend data. Disability expenditures rose almost ninefold, from $19.3 billion in 1970 to $169.4 billion in 1986; as a percentage of GNP, disability expenditures rose from 1.9 percent in 1970 to 4 percent in 1986 (Figure 2-11). In per capita terms, expenditures rose from $167 to $1,136 during this 16-year period. The largest growth was between 1970 and 1975, when real disability expenditures (adjusted for rising prices) rose 13 percent annually. The second half of the 1970s showed a slowing rate of increase in disability expenditures; the 1980s was a period of contraction in government spending, resulting in an average rate of real growth of 5 percent per year. Berkowitz and Greene conclude the following: "These fluctuations in disability expenditures are not matched by corresponding fluctuations in injuries or diseases.
TABLE 2-7 Disability Expenditures by Type of Expenditure, 1986
|
Type of Expenditure |
Amount (millions) |
Percent Distribution |
|
Total |
$169,407 |
100.0 |
|
Transfer payments |
87,319 |
51.6 |
|
Social insurance (OASDIa) |
22,474 |
13.3 |
|
Individual and employer-provided insurance |
10,840 |
6.4 |
|
Indemnity |
44,987 |
26.6 |
|
Income support |
9,018 |
5.3 |
|
Medical care expenditures |
79,315 |
46.8 |
|
Medicare |
8,828 |
5.2 |
|
Department of Defense |
108 |
0.0 |
|
Private health insurance |
46,043 |
27.2 |
|
Veterans medical care |
3,732 |
2.2 |
|
Workers' compensation |
4,540 |
2.7 |
|
Medicaid |
15,588 |
9.2 |
|
Medical vocational rehabilitation |
349 |
0.2 |
|
St. Elizabeth's Hospital |
127 |
0.1 |
|
Direct service expenditures |
2,773 |
1.6 |
|
Rehabilitative services |
1,654 |
1.0 |
|
Veterans |
423 |
0.2 |
|
Services to persons with specific impairments |
183 |
0.1 |
|
Social Services (Title XX) |
355 |
0.2 |
|
Employment assistance programs |
158 |
0.1 |
|
a OASDI = Old Age, Survivors, and Disability Insurance. SOURCE: Berkowitz and Greene, 1989. |
||
These changes then must be accounted for by demographic changes, changes in social and economic conditions, changes in public perception of disability, and the way that the benefit laws are administered.''
Newacheck and McManus (1988) analyzed data from the 1980 National Medical Care Utilization and Expenditure Survey to obtain data on the use, charges, and financing of medical care for children (under 21 years of age) with disabilities. Total charges for medical care services for children and youth with disabilities, defined as those limited in activity, amounted to $2.4 billion in 1980 and $3.9 billion in 1986 dollars. On a per capita basis, medical expenditures in 1980 amounted to $760 per person limited in activity, almost three times the amount spent by those without limitations. The 4 percent of children and youth who were limited in their activities accounted for 11 percent of total health care expenditures for the under-21 population.
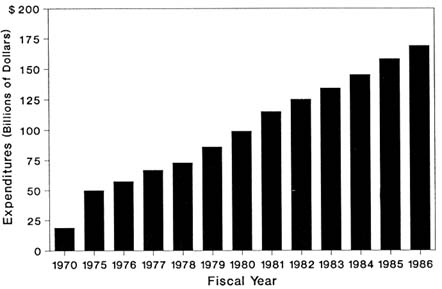
FIGURE 2-11 Estimated value of disability expenditures for 1970 and for 1975-1986. Expenditures in 1986 were more than $169.4 billion. Source: Berkowitz and Greene, 1989.
Rice and LaPlante (1988a) also analyzed the 1980 National Medical Care Utilization and Expenditure Survey, focusing on the costs of chronic comorbidity (i.e., more than one condition existing at the same time) for all ages. They estimated that total expenditures for medical care for persons limited in activity amounted to $63 billion in 1980, more than two-fifths of the total medical care expenditures for noninstitutionalized persons (Table 2-8). Persons limited in activity due to one condition incurred medical expenditures of $49.4 billion; for those with two or more conditions, expenditures amounted to $13.6 billion. Sixteen percent of the total noninstitutionalized population with a limiting chronic condition incurred 41 percent of total medical care expenditures (Figure 2-12). On a per capita basis, medical spending amounted to $1,620 per person for those individuals limited by one condition and $2,456 for those persons limited by two or more conditions, compared with $486 for those not limited in activity (Table 2-8). The distribution by age showed that per capita spending for medical care increases with age for those with and without disability. However, there are higher relative differentials in per capita spending between those with limiting conditions and those with none for the under-65 population.
Rice and LaPlante (1988b) inflated the 1980 costs of disability to 1987 dollars by the increase in per capita national health expenditures over the 7-year
TABLE 2-8 Total and Per Capita Medical Expenditures in the Noninstitutionalized Population of People With and Without Disability, by Number of Limiting Conditions and Age, 1980
|
|
|
|
|
|
Persons With Disabilities |
|||
|
|
All Persons |
Persons Without Disabilities |
One Condition |
Two or More Conditions |
||||
|
Age and Sex |
Amount (millions) |
Per Person |
Amount (millions) |
Per Person |
Amount (millions) |
Per Person |
Amount (millions) |
Per Person |
|
All ages |
$153,863 |
$691 |
$90,856 |
$486 |
$49,369 |
$1,620 |
$13,638 |
$2,456 |
|
Under 65 |
112,330 |
568 |
74,552 |
433 |
31,554 |
1,424 |
6,223 |
1,886 |
|
Under 19 |
21,705 |
319 |
19,468 |
300 |
2,202 |
734 |
35a |
267a |
|
19-44 |
50,911 |
591 |
36,543 |
482 |
12,925 |
1,371 |
1,444 |
1,637 |
|
45-64 |
39,713 |
911 |
18,542 |
588 |
16,427 |
1,687 |
4,744 |
2,075 |
|
65 and over |
41,533 |
1,650 |
16,303 |
1,116 |
17,815 |
2,144 |
7,415 |
3,290 |
|
a Indicates that the relative standard error exceeds 30 percent. SOURCE: Rice and LaPlante, 1988a. Reprinted with permission. |
||||||||
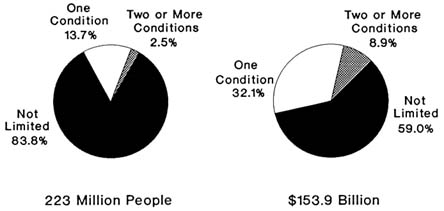
FIGURE 2-12 Distribution of population and medical care expenditures by number of limiting conditions, 1980. Source: Rice and LaPlante, 1988b. Reprinted with permission.
period and estimated that the medical care costs of disability totaled $117.6 billion in 1987. For those limited by one condition, medical care costs amounted to $92.2 billion; the remaining $25.4 billion are for those with two or more limiting chronic conditions. These cost estimates do not include losses in productivity due to disability (indirect costs), nor do they include transfer payments.
Although the above estimates of the costs of disability vary because of the different methodologies employed, it is clear that disability imposes a large economic cost on the public and private sectors of our society. The data show that the economic cost of multiple chronic conditions causing activity limitations is significant and high, a result that is not very surprising because the probability of disability and medical care use is greater for persons with multiple or comorbid conditions regardless of other factors. Thus targeting measures to prevent or reduce disability and its high economic toll is clearly in the nation's interest and should be given high priority.
CONCLUSION
Disability statistics rely on a wide variety of measures. The general-purpose NHIS data rely primarily on activity limitation as a measure of disability. Other data systems, designed for different purposes, use different measures: work disability, disability compensation, ability to perform particular tasks, and so on. The result is a patchwork of data that reflect the complexity of the concept of disability. Unfortunately, for technical reasons, it is often difficult to compare data from different sources.
Furthermore, unresolved conceptual difficulties in measuring disability can make it difficult to compare and comprehend the implications of existing data. Some clinical measures of functional status, for instance, which were developed to follow individual patients in the course of treatment, are too detailed and require too much medical expertise and/or equipment to be used in a broad-based population survey (Guralnik et al., 1989a). Some issues are difficult to measure through respondents. For instance there can be confusion between one's ability to carry out a specific task and whether one gets assistance in carrying it out (Wilson and Drury, 1984).
Just as role expectations influence whether a functional limitation becomes a disability (Nagi, 1965), statistical measures of functional limitation can be affected by what people expect or are expected to be able to do. For instance, if health promotion messages convince an older woman that she should walk more often, a mild case of arthritis that did not limit her activity before could interfere with walking on some days. Despite a probable improvement in health status, she would legitimately then be counted by the NHIS among those with activity limitations. A similar effect explains part of the apparent increase in disability in the 1970s among middle-aged men. Improved chronic disease screening, increased opportunities for disability compensation, and changing societal norms about early retirement allowed many men to enter medical treatment and to retire earlier than had been possible, probably increasing their health prospects and quality of life. In the official statistics, however, it appears that disability has increased (Wilson and Drury, 1984).
Given these limitations, it is clear that comprehensive measures of health status and quality of life are needed to understand the full complexity of disability and the factors leading up to it. Such measures have been developed, but they have been applied primarily in clinical studies. Research on their extension to population-based surveys is underway (Erickson et al., 1989).
As was apparent in the life table analyses, there are very few data extant on transitions in the disabling process. Although one can estimate on a cross-sectional basis the relationship between chronic conditions and activity limitation in the NHIS, and between different measures of activity limitation and disability in the SIPP, it is not possible to say much about the transitions from particular chronic conditions to particular functional limitations to different types of disability, for example, work disability. To develop efficient prevention programs it is critical to know the likelihood and rate of a large number of these transitions and their associated risk factors.
Finally, it is apparent that the available data focus on the chronic health conditions, not on the underlying processes and events that lead to these conditions and ultimately to disability. For instance, intentional and unintentional injuries are a major cause of the mobility limitations that are so
prevalent in young adults, but no data are available to directly tie particular kinds of injuries—motor vehicle accidents or firearm injuries, for instance—to functional limitations or disabilities. This kind of information is clearly needed to develop effective programs for the prevention of disability.
In summary, taking into account all of the data discussed above, it is clear that the number of persons with disabilities depends on the definition of disability. Combining the number of noninstitutionalized people with any activity limitation estimated in the NHIS and the population of all ages in nursing homes, it appears that 35 million people live with disabling conditions. SIPP data point to about 46 million people with some type of work or functional limitation. With definitions focused only on inability to work or to carry out other major activities, or on receipt of disability benefits, the number of people with disabilities is substantially smaller. By any definition, however, people with disabling conditions, on average, are older and have lower incomes than others.
Because disability has many dimensions, different measurement concepts are necessary. Data are needed on (1) the clinical conditions that lead to functional limitations, (2) the impact of these limitations on the activities that individuals are able to carry out, and (3) the social and economic impacts these individuals experience because of functional limitations. Each of these aspects of disability can legitimately be measured in different ways, and because social programs are tied to some measures of disability, different definitions to match eligibility requirements are necessary. Although it would be extremely costly and technically difficult for any single data system to deal with all of these concepts and measurement systems simultaneously, it is important that attention be paid to improving the quantity, quality, comprehensiveness, and relevance of data on disability in the United States for consumers and for setting policy.


