
How social connections form, how information is disseminated within social networks, and why people volunteer their time and knowledge to solve problems are all questions that have been examined by researchers in sociology and computing and experienced by those using social media to coordinate disaster response. Duncan Watts, at Yahoo! Research at the time of the workshop and since at Microsoft Research, discussed some of what researchers have learned about how people use social media and the implications for use of social media in disasters, drawing on research about Twitter users. Manuel Cebrian, University of California, San Diego, examined approaches for incentivizing participation in time-critical situations, drawing on lessons from two recent challenges sponsored by DARPA. Melissa Elliott, Standby Task Force, discussed the dynamics of social media during a crisis, drawing on experience with volunteer efforts to use social media for disaster management.
STUDYING TWITTER USE TO UNDERSTAND HOW PEOPLE COMMUNICATE
In the United States, hundreds of millions of people interact with media sources and each other via social media, making the number of nodes and connections in an entire social media network incredibly large. The enormous diversity in the subjects being discussed via social media and the range of effects are even harder to study. Social media, and the
data they yield about people’s interactions, have emerged as a valuable new lens through which to explore the full range of communication among individuals. Duncan Watts discussed work at the intersection of social science and computer science performed at Yahoo! that used a subset of Twitter user information and updates.1
Media research has tended to focus on two types of communication— individual organizations broadcasting to large, undifferentiated audiences, and individuals communicating with each other—but generally has not looked at anything that happens between these two extremes. Although most people think of Twitter as a social network, it can also be viewed as a full-spectrum media ecosystem.2 Twitter communications cover the spectrum between the two types of communication traditionally examined by media research; individuals as well as traditional mass media outlets are able to broadcast information. New forms of interaction have emerged, such as mass personal communication, in which “elite” individuals—celebrities, politicians, journalists, or recognized experts— not only broadcast information to large audiences but also engage in public conversations that are widely followed.
One of the biggest challenges to using social media, Watts noted, is the large number of accounts and the volume of data they generate. It is difficult to categorize the more than 200 million Twitter accounts as those associated, for example, with individuals or organizations. In 2009, Twitter introduced a new feature called lists, which provided users with a mechanism for filtering incoming feeds and other users, providing researchers with data (which is public by default) on how users classify each other.
Watts explained that the Yahoo! study drew on a collection of data originally used by Haewoon Kwak in his study of Twitter. Collected in 2009, the data included 42 million users and 1.5 billion individual connections. 3 (However, the focus of the work was on 260 million tweets that included a bit.ly URL, a URL-shortening service.)
One important finding from this work was that a small number of “elite” users were followed by half of all Twitter users. Yahoo! used the list feature to help separate out four categories of elite users: celebrities,
__________
1 Shaomei Wu, Jake Hoffman, Winter Mason, and Duncan Watts. Who Says What to Whom on Twitter. 20th Annual World Wide Web Conference, Association for Computing Machinery, Hyderabad, India, 2011. Available at http://research.yahoo.com/pub/3386.
2 Haewoon Kwak, Changhyun Lee, Hosung Park, and Sue Moon. What is Twitter, a social network or a news media? Available at http://product.ubion.co.kr/upload20120220142222731/ccres00056/db/_2250_1/embedded/2010-www-twitter.pdf.
3 Haewoon Kwak originally made the data public at http://an.kaist.ac.kr/traces/WWW2010.html. However, a change in Twitter’s terms of service resulted in the researchers being unable to share their original data set.
media outlets, organizations and corporations, and bloggers.4 Researchers put Twitter users into one of the elite categories based on how frequently they were categorized as such by individual users. For example, a Twitter handle labeled as that of a celebrity by 20,000 other users most likely did in fact belong to a celebrity. What was learned was that 50 percent of all attention was being paid to just 20,000 elite users. This is not to say that those elite users were producing half of all tweets, but rather that half of all the tweets that were read were updates provided by these elite users.
Focusing on the above four categories of elite users suggests an interesting corollary to what is known as the homophily principle in sociology. People who are connected are more similar than people who are not connected. Celebrities pay attention to other celebrities, the media follow the media, and so on. Only users in the organization category pay more attention to users in other categories than to users in their own category. Several corporations, non-governmental organizations, and government organizations are using Twitter to listen as much as to talk. With retweets, the pattern is ever more striking. Celebrities rarely retweet messages from anyone. Bloggers, on the other hand, do a tremendous amount of retweeting, which is consistent with the stereotype of a blogger as a synthesizer and distributer of information.
Another important finding cited by Watts was that a relatively large fraction of the population received information indirectly. To examine the flow of information, researchers studied the propagation of URLs that originated from the media category, which consisted of about 5,000 accounts. Approximately half of this information reaches users indirectly. A lot of information did not come directly from the media source but instead indirectly through other accounts, which were labeled opinion leaders by researchers. The number of opinion leaders was incredibly large. They were consuming much more content than normal users but also tweeting more and had a higher number of followers. These results suggest that many social media users will receive alerts from a non-authoritative source.
A related issue is what sources of information have the most influence. Watts and his team used retweets as a measure of influence; they assumed that an individual who was frequently retweeted was probably more influential. By tracking tweets and retweets, they were able to develop influence trees that described how a tweet was cascaded through the Twitter ecosystem. It turned out that most URLs included in Twitter messages were not retweeted by anyone and that the average number
__________
4 Shaomei Wu, Jake Hoffman, Winter Mason, and Duncan Watts. Who Says What to Whom on Twitter. 20th Annual World Wide Web Conference, Association for Computing Machinery, Hyderabad, India, 2011. Available at http://research.yahoo.com/pub/3386.
of retweets was around 1.2. This is a relatively small number, especially considering the vast literature on diffusion theory that predicts very large cascades. However, very large cascades were also observed. For example, the data examined by Watts et al. included at least one cascade of about 10,000 retweets. Another important factor is how many generations of retweets occur. Several cascades extended several generations, with information moving farther away from the source, but almost 90 percent of retweets went only one step away from their origin.
Two things about influence can be inferred from the Twitter data, Watts observed. First, someone with influence probably will continue to be influential, and second, the number of followers someone has increases his or her influence. No other factors were found to affect influence. For example, the content of the tweet was in general not predictive of how influential it was (or how many retweets it received)—although this finding may not hold true in particular contexts such as emergency events in which the value seen in sharing critical information may be higher.
PROBLEM SOLVING WITH SOCIAL MEDIA
In addition to seeing social media as a source of information in disasters, it is also natural to consider how social media can be used to engage people in solving problems. The essence of the question is how one can use social media and the right set of incentives to engage people to solve a set of tasks for which humans are well suited. Recent work by Manuel Cebrian in the context of two online challenges mounted by the Defense Advanced Research Projects Agency (DARPA)—the DARPA Network Challenge and the DARPA Shredder Challenge—has provided some empirical knowledge and further insights. The first contest, the 2009 DARPA Network Challenge, offered a $40,000 prize to the first team to find red weather balloons placed in 10 undisclosed locations in the continental United States.
A key design issue facing the teams, according to Cebrian, was how to recruit participants. The winning team, from the Massachusetts Institute of Technology, chose a variant of the query incentive network model, first developed by Jon Kleinberg and Prabhakar Raghavan in 2005.5 The individual who actually found a balloon would receive the largest award, but those who recruited that individual would also be awarded an amount equal to half of what the connected award winner received. For example, if Dave found a balloon, he would receive $2,000; Carol, who recruited Dave, would receive $1,000; Bob, who recruited Carol would receive $500;
__________
5 J. Kleinberg and P. Raghavan. Query incentive networks. Proceedings of the 46th IEEE Symposium on Foundations of Computer Science, 2005, pp. 132-141.
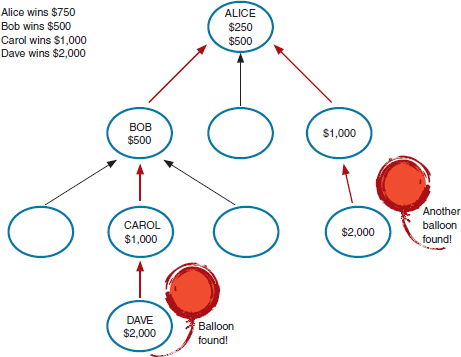
FIGURE 3.1 Recruitment and award distribution. SOURCE: Manuel Cebrian. Social mobilization under “the fog of war.” Presented at Workshop on Alerts and Warnings Using Social Media, February 28-29, 2012.
and Alice, who recruited Bob, would receive $250. Figure 3.1 illustrates how awards would be distributed in this scheme.
In roughly 8 hours, the MIT team recruited approximately 4,500 participants. Recruiting started in major cities and then spread into the suburbs, which the team believes ultimately played a role in finding some of the very-difficult-to-locate balloons. With such a large number of recruits, the team expected to simply locate the balloons and win. Recruits would submit possible locations, the team would examine the density of submissions, and the prominent 10 locations would coincide with balloon placement. However, in the first day of the competition, of the 400 submissions received, 85 percent were incorrect, and it became clear that people were attempting to sabotage the team’s effort. Initially the false locations were simply random, but later it became clear that some of the spoofing was being coordinated to provide multiple reports of the same location.
The MIT team developed several techniques to filter out the false reports. One was to question multiple identical locations; correct submissions were more likely to contain very close but not exactly identical locations. Another technique was to discount reports from someone located
far away from the reported site. The increased rate of incorrect reports also led the team to require a photograph for verification. Spoofers then began fabricating pictures, which led to a requirement that the photographs show the DARPA representative stationed at each balloon as well. That in turn led to someone dressing up as a DARPA official in order to submit misinformation.
Ultimately, the MIT team was able to win because it had a small number of highly motivated participants who physically visited sites to visually confirm the presence of a red balloon. Several questions arose from the challenges presented by intentional misinformation, and in an attempt to test a set of related hypotheses, the same research team attempted to design the incentive network for the next DARPA challenge in a similar way.
The DAPRA Shredder Challenge asked individuals or teams to reconstruct a progressively harder series of puzzles consisting of documents that had been shredded into fragments. The first puzzle had 200 pieces and the fifth had 6,000 pieces. By comparison, the best computer algorithms are able to solve a 400-piece puzzle, which meant that computational approaches alone could not be used to win the challenge. The first team to reconstruct the puzzle would win $50,000.
In an attempt to mimic the red balloon challenge incentive, MIT researchers decided that each of the pieces for all five puzzles in the challenge would correspond to a $1.00 award for correctly placing the piece. Once again, the network of the individual correctly placing a piece would also be rewarded. If an individual received $50.00 for assembling 50 pieces, the person who recruited the individual would receive $25.00. Over 2 weeks, 3,500 people joined the team. Within those 2 weeks numerous teams had already solved the first two puzzles. After 4 days the MIT team rose to third place in the competition by solving the first three puzzles.
In the first three puzzles, steady progress was made toward a solution, but starting with puzzle four there were slowdowns in progress owing to intentional sabotage. Notably, those responsible for sabotaging the effort were also the same individuals who earlier had contributed solutions to hard pieces of the problem, making it difficult to filter out the bad actors.
One saboteur contacted Cebrian, confessed to damaging the puzzle, and provided a summary of the techniques used to create the damage. The individual first enlisted the help of members of an online bulletin board to disconnect puzzles. In response, Cebrian locked correctly placed pieces in place and banned certain Internet Protocol (IP) addresses. The malicious individual then began using a virtual private network and open wireless networks to appear from a new IP address and was able to again
damage the puzzles. Other users quickly began noticing that the malicious individual was simply stacking pieces; the individual then simply began moving pieces off the virtual workspace. As for motivation, his claimed rationale was that the shredder puzzle was intended to be a computing/programming challenge and that crowdsourcing was “cheating.”
Cebrian’s team approached the problem of saboteurs in several ways, most of which turned out to be mistakes. First, it attempted to police what was happening and to find the saboteurs. Although the team was able to determine that a group in San Francisco and a group in Amsterdam were coordinating the attacks, this information did not contribute to solving the puzzle. A second mistaken approach was to restrict participation in an attempt to block malicious people—initially, the virtual table had been available to everyone to move pieces at will. An additional step was to limit new users to moving one piece every 3 minutes. Ultimately, when the team reached the fifth puzzle, only the top 20 performers were allowed to participate. However, the fifth puzzle was simply too complicated for even the best performers to solve, and the team received no points for puzzle four and puzzle five and ultimately placed sixth place in the competition.
Both the red balloon and the shredder challenges demonstrated that one can recruit a large crowd to solve a very hard problem, and the analytical tools to understand how that can happen do exist, observed Cebrian. However, when competitive forces arise, it can be very difficult to determine the origin of those forces and what others’ goals are. During time-critical situations, there is little leeway to contemplate the best way to thwart the impact of malicious individuals, and it becomes easy to feel paranoid and limit participation. The combinatorial nature of the shredder challenge as compared with the red balloon challenge (solve versus search) made social mobilization much more problematic. Searching for a single balloon has no impact on the search for a second balloon; however, in the puzzle challenge, each step built on a previous step, and the usefulness of crowdsourcing appears to have degraded.
STANDBY TASK FORCE: VOLUNTEER NETWORKS DURING DISASTERS
Melissa Elliott is a core team member of the Standby Task Force and is also a member of both Crisis Mappers and Crisis Commons. All three of these volunteer organizations work to coordinate volunteers who develop information-sharing tools and provide information to relief organizations during a disaster.
One of the most difficult aspects of using social media during the 2010 Haitian earthquake, according to Elliot, was the lack of processes and
systems to coordinate information. Essentially, the disaster management teams, both non-government organizations and officials, were receiving multiple messages from multiple people. The repeating of old distress messages became a significant problem. Verification of shared information presented a growing challenge.
In response, the Standby Task Force was launched at the 2010 International Conference of Crisis Mappers in Boston. The purpose of the task force was twofold: to provide predictable crisis-mapping support to humanitarian organizations and to create a model for volunteer engagement according to a set of processes so as to maximize efficiencies and minimize redundancies. Today, the Standby Task Force comprises almost 800 volunteers representing 60 different countries. Not every volunteer will participate in a deployment (although the organization is looking for ways to increase volunteers’ involvement). Many have joined the group as observers to understand how the task force works, ideally before participating more actively.
In January 2012, the Standby Task Force used a survey to help determine what motivates its volunteers and found that 45 percent participate because they are generally concerned about the people they help. Another 35 percent volunteer for the experience and to gain skills in technology use and hands-on crisis response. Several became involved to gain visibility outside their immediate geographical area.
The task force is divided into several teams, each of which focuses on a particular task, including analysis, geolocation, humanitarian aid, media monitoring, reports, satellite imagery, mobile text messaging, translation, verification, and technology support. The teams find, map, verify, curate, and analyze different forms of social media to improve the situational awareness of responding organizations. Volunteers join particular teams but often cross-train in multiple teams. Training and coordination are done online via a closed platform, Ning,6 and using Skype videoconferencing. During deployments, a wide variety of tools are used; however, 80 to 85 percent of deployments are done using Ushahidi. Google Maps and Apps and Open Street Maps are also used.
Over the last 2 years, the organization has had 18 deployments. Deployments are incredibly time intensive for volunteers, especially the coordinators. Volunteers’ work schedules are created and managed very closely to ensure that volunteers do not work continuously and that they take appropriate breaks from the work. The schedules also provide a way for participants to take ownership of their deployments.
The beginning of each deployment is fairly chaotic, Elliott observed. Volunteers are eager to get started; however, coordinators need to ensure
__________
6 See http://launch.ning.com/.
that they are all moving forward on the same path. Before beginning, teams establish workflows, schedules, and team-specific technology platforms to manage the process (mostly via Skype).
Initially the chat window fills up with brainstorming. Workflows, the process by which the task force filters information through the team, will not change. However, during a deployment, the way in which data is gathered may shift as volunteers leverage their contacts, share data sets, or use a specialized skill or tool for data visualization that the task force might not have thought to use. Maintaining flexibility continually reinforces a sense of ownership. However, coordinators are also continually reinforcing the workflow process by which the information is filtered.
Training is an ongoing process. Volunteers may have joined the task force between formal training sessions. In this case they receive extra support and, if time permits, may receive a one-on-one speed training session on whatever tool is being used during a deployment. Within hours of a deployment, members of the group begin stepping into leadership roles by providing direction and mentorship to new volunteers just joining. This approach allows coordinators to take a step back because they no longer need to be online constantly answering questions and reinforcing the process.
The deployment teams are composed of digital volunteers who all want to support one another during the challenge of deployments. As this support builds, more trust develops within the group. A self-correcting process begins as well. For example, if the media-monitoring team (which is the largest team and does much of the data mining of social networks) creates a report in Ushahidi and the geolocation data is incorrect, this error can quickly be recognized and corrected by other volunteers. In addition, if an individual submits several erroneous reports, he or she is able to receive additional training immediately. Sharing the burden of ensuring correct information creates another avenue for giving ownership to the crowd for that information and continues to reinforce a need to mentor and help others who may submit data incorrectly.
The large amount of data that arrives via Twitter, for instance, requires some initial sorting and then verification. Approximately 80 percent of the information the organization receives from Twitter is removed. Although retweets do provide redundant information, they can also be very valuable. Retweets highlight interest in a certain area. The task force can provide this information to humanitarian organizations, and further analysis can be done to determine why there is particular interest in the information being retweeted.
Verifying incoming data is an important task.7 The Standby Task Force takes several steps to maintain quality control. The most important quality control step is performed by the verification team, which compares incoming reports with other similar reports. Typically, if the verification team can find two or three similar reports from different users, the organization considers that a more verifiable report. In addition, other tools are used to verify information, including contacting individuals with Twitter direct messages or by email if an email address is available.
Gathering information in conflict areas poses even more significant risks of misinformation and the dangers that misinformation may create, Elliott cautioned. Partnerships with those stationed in the area can help. During the Libyan crisis, the Standby Task Force was asked to support the United Nations Office for the Coordination of Humanitarian Affairs (OCHA) to provide it with on-the-ground contacts that could help in assessing the unfolding situation. Although the Standby Task Force partnered with Amnesty International for conflict mapping of Syria, the task force decided to suspend this activity until it could further examine credential and validity questions. A recurring question for the task force is whether it is possible to ensure that the information it is providing is accurate and is not putting anyone in harm’s way.
More recently the Standby Task Force established the Human Resource team to monitor volunteers for burnout and to help resolve any conflicts that arise. Unfortunately, the task force has had a few instances of volunteers being disruptive. Made up of a small, devoted group whose membership is by invitation only, the human resource team works with closed communication technologies. In addition, the Standby Task Force has engaged a psychologist to look for signs of post-traumatic stress disorder (PTSD) among deployed volunteers. A few years ago, few might have felt that PTSD could be experienced by digital volunteers who may be geographically far from a disaster site. However, volunteers do suffer from the emotional and mental impacts of disaster volunteer work, and further research is needed to determine how prevalent PTSD might be, how it can be prevented, and how organizations can monitor their volunteers for it.
The Standby Task Force has also learned, reported Elliot, that it is important to continually provide feedback on how data generated by volunteers is being used. By learning how their work is benefiting others,
__________
7 For example, during the 2010 Haiti earthquake, locations would ask for resources, stating that they had no food or water, and when teams arrived at the location with supplies, they found that the location did in fact have food and water. The location was stocking supplies because there was concern about when another distribution of resources might occur.
volunteers begin to appreciate the significance of their work. This feedback is one of the primary motivation tools during a deployment.
OBSERVATIONS OF WORKSHOP PARTICIPANTS
Observations on the dynamics of social media offered by workshop panelists and participants in the discussion that followed the panel session included the following:
• Comparing the dynamics of social media use during non-emergency situations with those of emergency situations can be incredibly complicated. Each emergency situation involves unique factors that affect how social dynamics develop. For example, during a terrorist attack one can anticipate a more adversarial climate and the potential for terrorists to exploit misinformation as part of their attack, whereas during a natural disaster there is less incentive to provide misinformation. During natural disasters, misinformation typically stems from constant rereporting of old news, although there is a possibility that awareness of limited resources could create an incentive and a desire to share misinformation so as to provide oneself with supplies before others.
• An important factor in the use of social media tools and sites is the motivation of participants. As with the DARPA challenges, a financial incentive to participate can lead to a large sensor network, but can also create an inducement to interfere with others’ work. If the stakes are lower, so also are the incentives to participate as well as to cause harm, thus reducing the concerns about significant interference. A question is how to use incentives to increase participation without also increasing interference. This problem is a primary reason that the Standby Task Force does not use financial incentives.
• Another option for preventing distribution of poor data is to limit the participation of anonymous workers. However, requiring that participants be non-anonymous would increase the effort required to register as a volunteer and would slow participation.
• The use of identity systems, even a readily available one such as Facebook’s, also requires additional lead time, which is limited during disasters. Online identity structures are discussed further in the next chapter.
• A system that uses a hierarchy of social media users may be helpful for ensuring that information is accurate prior to its dissemination during a crisis. An example of an online hierarchy of users is Wikipedia, which provides a classic example of how increased popularity changes the dynamics of a social Web site. Wikipedia was initially very egalitarian: everyone could contribute and everyone had basic editing rights. As
Wikipedia became popular, this flat organization no longer worked, and a hierarchy of editors was created who could lock articles and exclude certain edits. But creating this sort of hierarchical system during a crisis would be quite difficult, given the time constraints of disasters and crises, which provides an incentive to be as open as possible.


