
6
Benefits and Costs of Design Changes
The preceding chapter narrowed the field of conceivable tank vessel designs to those that appear, from an engineering perspective, to warrant further consideration. This chapter identifies ways to address qualitative and quantitative information on the likely economic and environmental effects of these design alternatives. The data that are presented have many limitations, and much more work is needed on both benefits and costs of designs. Cost estimates are sensitive to assumptions about future traffic patterns as well as construction costs. Benefit estimates are even more elusive, depending on judgments about design effectiveness and spill consequences. Hence, the numerical findings should be taken as indicative at best.
THE ANALYTICAL APPROACH
If it were possible to place credible dollar values on all economic and environmental effects, a monetized benefit-cost analysis could be developed to show (1) how the present values of the alternatives' net benefits compare, and (2) how these comparisons would be affected by plausible changes in underlying assumptions (that is, by a sensitivity analysis). For two basic reasons, such precision is not possible. First, many of the major effects can be characterized only qualitatively, at best. Second, even where information is sufficient to allow quantitative estimates of the magnitude of a particular effect, the value of this effect in dollars is open to debate. For example, even if the number of miles of shoreline that would be spared
from pollution by a particular design could be estimated, the dollar value related to this benefit is debatable.
Dollar values can be assigned, however, to most costs related to the various designs, and the resulting benefits can be expressed in non-monetary fashion, namely, as tons of oil not spilled. This permits cost-effectiveness analysis, which highlights the cost that would be incurred per unit of benefit achieved, that is, per ton of oil spillage likely averted. The fundamental challenge here is to quantify the reduction in spillage achievable with each design. One method for attempting to quantify the reduction is presented in the latter half of Chapter 5; the numbers will be summarized again in the appropriate section of this chapter. Again, the numbers derived from this exercise are not intended to be conclusive, but rather to provide indicative examples. Therefore, the results of the forthcoming cost-benefit analysis are by nature tentative, as they rely upon the use of numbers that could vary significantly given the application of different assumptions.
This economic analysis can be viewed from different angles, to gain additional perspective on the various design alternatives. For example, as benefit estimates are more conjectural than the cost estimates, the latter can be presented in a form of ''societal insurance" analysis : that is, how much a design alternative will add to the delivered price of oil in exchange for some added (but unmeasurable) degree of protection against spills, much like an insurance premium. The ranking of designs that emerges, shown later in this chapter, still requires judgment about their relative effectiveness. But a societal insurance cost ranking can help (1) identify cost ranges, and (2) indicate designs with such similar costs that the choice should turn on other factors.
To put these costs in context, the committee gathered information on how society has valued past oil spills. Available data, while by no means comprehensive, will be presented to help in judging how "reasonable" the cost of the various designs may be. Also considered are the possible worldwide effects of design changes, in the form of dislocations in the oil transportation network.
Identifying the Base Case
Any analysis of benefits and costs of design changes must start with the identification of a base case, the situation likely to prevail if none of the contemplated changes are made. Each design alternative is intended to lessen the number and severity of oil spills; if effective, fewer of the casualties that occur will lead to oil spillage, and spills that do occur will be smaller.
The base case needed to evaluate design benefits, then, is some charac-
terization of the spills that can be expected in the absence of mandated design changes.
Each design alternative also entails compliance costs, and, correspondingly, the base case needed for discussion of design costs is some characterization of existing tanker construction and operating costs. The base case for costs rests on an assumption that the oil tanker trade will be dominated for the foreseeable future by single-skin MARPOL vessels. Of course, the Oil Pollution Act of 1990 (OPA 90) requirement for double hulls, once implemented, will mean substantial changes in ship construction. Because such implementation has not yet occurred, for purposes of this analysis double hulls will be viewed as simply one of several design alternatives.
The base case for design benefits is drawn from data on accidents over the past decade (reviewed in Chapter 1). Of course, the future accident record cannot be predicted with certainty, but the historical record provides at least some indication. On one hand, historical oil spill data may overstate future risks, since some important risk-reduction measures have not yet been implemented fully. On the other hand, continued growth in tanker shipping of petroleum may increase the risk.
The volume of oil spilled annually from accidents larger than 10,000 gallons (or approximately 30 metric tons, for world spills) during the ten years 1980 through 1989 is shown in Table 6-1. To place these spills in perspective, they can be compared to total volumes shipped annually of roughly 600 millions tons in U.S. waters and 1,500 million tons worldwide.1 These data represent the dimensions of the oil spill problem, or the base case for evaluation of design benefits.
Environmental Damages
The nature and extent of environmental damages arising from oil spills vary significantly, depending on the type of oil involved, the location and size of the spill, weather conditions during the spill, clean-up activities, and the efficacy of clean-up (National Research Council, 1985).
The assessment of environmental damage in economic terms remains a developing science. Historically, cost estimates have been based on clean-up and legal liability expenses. Less obvious costs related to restoration of natural resources, replacement of species, ecological damage, socioeconomic and other effects remain difficult to measure. While such costs historically have been excluded from estimates, there is a growing trend to include them.
The EXXON VALDEZ is likely to set a record as the most costly oil spill to date. Clean-up costs alone have exceeded $2 billion. The government effort to assess natural resource damages cost $35 million in the first year of an anticipated five-year effort.2
TABLE 6-1 Tons of Oil Spilled Annually,* 1980-1989—Spills over 10,000 Gallons or Approximately 30 Tons
The previous record for the most costly spill was held by the AMOCO CADIZ, but this litigation continues and final damages are uncertain. In 1988, a decade after that spill, a U.S. court awarded damages of 720 million French francs (about $143 million), including interest (Gundlach, 1989). The AMOCO CADIZ litigation is further noteworthy for its length; 12 years after the incident occurred, and the appeals process has just begun.
Natural Resource Damage and Recovery
The major difficulty in assessing natural resource costs is that many of the more subtle effects of oil spills are neither well understood nor well documented. Short-term effects can be obvious; it is widely recognized that a major spill in a biologically rich area will result in the immediate deaths of marine mammals, seabirds, plankton, and fish. Other, chronic impacts presumably will persist for many years, affecting the reproductive success of some species as well as food sources.
Petroleum impact often has been judged based on either circumstantial or insufficient evidence, making unequivocal assessment of the effects of spills nearly impossible (National Research Council, 1985). However, the most important natural resource damages generally are placed in two categories: habitat loss or alteration, and loss of species. The ecological effects of oil on marine organisms are caused by either physical contamination (smothering or fouling) or chemical toxicity. For example, aromatic hydrocarbons are known carcinogens; they can cause cancerous lesions in the liver, lungs, and mammary glands of animals. Exposure to oil also causes reproductive failure in mammals and fish. Organisms throughout the marine food web, starting with the phytoplankton at the very bottom of the food chain, are subject to the effects.
Measuring the exposure of organisms and subsequent effects requires the expenditure of significant resources and time, and, with respect to certain aspects of the ecosystem, still may fail to reach conclusions of any certainty. At minimum, several years are needed to assess the full extent of environmental damage; the process may take decades. For example, 20 years after the spill of 16,000 tons of oil by the S.T. ARROW off Nova Scotia, much of the now-weathered oil still is believed to permeate shoreline strata. Whether this residual oil is biologically innocuous remains in contention. The local fishing industry reportedly rebounded within three years; however, populations of soft-shelled clams from oiled sites were still stressed six and seven years after the spill (National Research Council, 1985).
Recovery depends on population dynamics and ecological interactions of replacement species. Recovery in the water column appears to be very rapid, but oil and its residue may remain in sediment and shore substrate for many decades. Toxicity and malformation of fish eggs and larvae also have been observed over long periods of time. Repopulation by original species may be slow; near-shore benthic communities may not experience full recovery from a major crude oil spill for several years or more. Damages to wetlands may persist for decades if extensive erosion has taken place, or if there have been significant physical or biological effects.
In addition to the impact of oil itself on the environment, various spill clean-up methods may have adverse ecological effects.
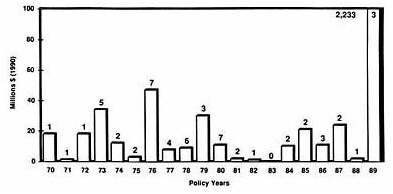
FIGURE 6-1 Major persistent oil spills by tankers—annual claims amounts. Source: Temple, Barker & Sloane, Inc. Note: The numbers of claims are shown above the columns; specific claim information is proprietary.
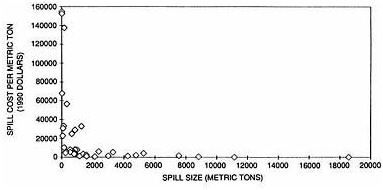
FIGURE 6-2 Major U.S. spills: claim estimates per metric ton versus spill size. Source: Temple, Barker & Sloane, Inc. [Analysis of a sample of 38 major persistent oil tanker spills (of a total of 64) in U.S. waters during the 1970-1980 period, resulting in clean-up plus damage and restoration costs in excess of $1 million each.]
Placing Dollar Values on the Cost of Spills
As noted earlier, an accurate translation of effects or damages from spills into monetary terms is a very complex task, if not impossible. Estimating the total cost is limited by uncertainties with respect to (1) effects on the marine environment, (2) validity of valuation techniques, and (3) the difficulty in valuing intrinsic benefits.
While not a complete representation of costs, legal claims payments are one example of how costs in practice are assigned to spills. Figures 6-1 and 6-2 show the claims pattern for major spills in U.S. waters over the past two decades. An analysis of 38 large spills (Temple, Barker & Sloane, Inc., unpublished data, 1990) found that, in 1990 dollars, claims have clustered at around $28,000 per ton of oil spilled; the startling exception, of course, is the EXXON VALDEZ case, in which costs could reach $90,000 per ton. It should be noted that the claims amounts paid are determined under international and domestic laws and, as such, reflect policy decisions and generally do not represent the full cost of a spill.
An example of covered costs is provided by the International Oil Pollution Compensation Fund (IOPC Fund), established in 1978 pursuant to a 1971 international convention. (The United States is not a party to this convention.) The fund generally covers claims for clean-up costs, consequential losses for owners or users of contaminated or damaged property, and claims for economic losses suffered by persons such as fishermen who
depend directly on earnings from coastal or sea-related activities. The fund has not, however, accepted claims for damage to fishing grounds due to the after-effects of oil on fisheries, because the claimants have not been able to prove with sufficient data actual economic damage. Similarly, the fund does not cover claims for damage to the marine environment, unless the damage can be translated into direct market value.
The claims situation under federal law in the United States is governed by the OPA 90, which vastly increases spiller liability and penalties. 3 Claims under state law are governed by widely varying statutes of the several states, as well as common law. OPA 90 expressly does not preempt state laws in this regard. Prior to this legislation, claims for oil spill removal costs were made under Section 311 of the Federal Water Pollution Control Act (FWPCA), and claims for damages were made under general maritime law and common law. Regulations for determining damages to natural resources were promulgated by the Department of the Interior (DOI).
The DOI regulations favored estimating losses in "use values,"4 as opposed to valuing injured or dead creatures or plants. The DOI excluded the cost of intrinsic values5 (such as non-commercial marine mammals), unless there were no use values to measure. This approach, in effect, overlooked what may be a significant portion of total damage; a recent study by the American Petroleum Institute (API) found that "ignoring non-use (including intrinsic) values would lead to measures of damages that understate the true social losses." One empirical study cited by API suggests that intrinsic values comprise about half of the value of a resource (API, 1989).
In general, the DOI regulations took a more restrictive view of costs than is consistent with current economic practice. A recent decision by the U.S. Court of Appeals struck down the part of the DOI rule that generally limited natural resource recovery to "the use values" (State of Ohio et al. v. U.S. Department of the Interior, 880 F.2d 432. 1989). The Court found that Congress had established a distinct preference for restoration costs as a measure of recovery. The Court also found that lost use and non-use values (such as intrinsic values) generally must be compensated, in addition to restoration costs. The decision is expected to raise the costs of spills for liable parties.
As the foregoing implies, the benefits from design improvements have two primary components (apart from increased employee safety, for which estimates do not exist, and from the commercial value of the oil not lost). Limited data on each component exist.
Clean-up costs avoided. This is the reduction in spending for clean-up costs, including spending by both public and private sectors. Available estimates for spills prior to the EXXON VALDEZ put the average clean-up cost savings in the range of $1,500 to $38,000 per ton not spilled (adjusted to 1989 dollars).6 The committee believes that past and present estimates of costs probably understate possible future costs of oil spill clean-up.
Environmental damages avoided. This is the decrease in environmental
damages that either occur between the date of a spill and the date on which clean-up efforts cease, or continue after the completion of clean-up. Included within this category are commercial (especially fishing) and recreational benefits. While both "use values" and "non-use values" (existence, option, and bequest values) are relevant, measurement of these values is complex and difficult. Two studies (Cohen, 1986; Farrow, 1990), again for spills prior to EXXON VALDEZ, put the environmental benefits (other than clean-up savings) at $1,500 to $10,500 per ton (adjusted to 1989 dollars); the lower estimate comes from M. A. Cohen of Vanderbilt University, who did not attempt to take all environmental effects into account. Cohen postulates that a full accounting of environmental effects now would produce estimates in the range of $10,000 to $20,000 per ton, particularly in light of increasing public concern about environmental degradation and nonuse values; indeed, one government analyst believes a $30,000 per ton upper-bound figure now would be credible. In addition, some speculation exists that the figure for the EXXON VALDEZ could range from $30,000 to $90,000 per ton spilled.7
As emphasized earlier, estimates of these benefits are quite difficult to pin down, even in one given situation after all the details are known. Even more speculative are judgments about decreases in environmental impact due to design changes. It is not possible to characterize in the abstract the environmental benefits from, say, reducing by half (compared to by 3/4) the size of spills that now are occurring. Similarly, there is no obvious consistent link between the amount of clean-up costs and the size of an oil spill. The development of a more reliable benefit-cost analysis requires further research to assess and value natural resource damages. Specifically, a better understanding of the environmental effects of oil spills and the feasibility and cost of restoration, as well as the development of an accepted methodology for valuing environmental benefits, is required. Therefore, at this time, cost-effectiveness analysis appears more feasible and promising than monetized benefit-cost analysis.
Spill Reduction Analysis
The extent to which various design alternatives would lessen the risk of oil spills cannot be known with certainty. However, as discussed in Chapter 5, the committee used one available methodology to assess the probable relative effectiveness of eight designs and design combinations. The resulting estimates of oil outflow reduction were shown in Tables 5-5 and 5-6. In each case, the reduction in oil spilled is relative to the base case of a tanker meeting current MARPOL requirements (with protectively located segregated ballast tanks, or PL/SBT). While the data are a plausible and carefully derived set of estimates, they are by no means definitive. Further work is needed to explore alternative assumptions about accident profiles.
TABLE 6-2 Oil Spill Performance
|
Design alternatives |
Oil outflow relative to MARPOL tanker for composite accident** |
|
|
|
Small tanker (40,000 DWT) |
Large tanker (VLCC) |
|
Double bottom |
66 % |
40 % |
|
Double sides |
133 |
109 |
|
Double hull |
56 |
29 |
|
Hydrostatic control-passive |
43* |
51 |
|
Smaller tanks |
72* |
64 |
|
Int. oil-tight deck (IOTD) w/DS |
47* |
28* |
|
Double sides w/hydro-passive |
57* |
27* |
|
Double hull w/hydro-passive |
50* |
26* |
|
* These figures represent committee judgments; the other figures were derived by DnV. See Tables 5-5 and 5-6. ** The composite accident is a weighted average of experience with collisions (40%) and with groundings (60%). The groundings are assumed to be evenly divided between low-energy (5 knots) and high-speed (10 knots) incidents. |
||
The data from those two tables are merged in Table 6-2. To simplify the following analysis, this table assumes that half of the total tonnage of oil spilled from collisions and groundings occurs in low-energy accidents (5 knots) and half in high-energy accidents (10 knots). The numbers indicate, for each new design, how much oil is likely to spill in a standardized casualty, compared to the quantity spilled by a MARPOL ship. The assumption about accident energy levels is just that—an assumption—because data on actual casualty patterns do not exist.
The oil spill data from Table 6-1 now can be combined with the oil outflow reduction percentages from Table 6-2, to obtain an indication of the magnitudes of spillage that these design alternatives could avert. It should be stressed that data have many shortcomings, and the results must be viewed with skepticism.
The average amount of oil spilled annually in U.S. waters is roughly 9,000 tons of oil. However, there is a large variation from year to year, from a low of 300 tons to a high of 40,000 tons to date. This suggests the need for an analysis of a major spill year, in addition to a "typical year" analysis, at least for U.S. waters. The committee has not undertaken a "worst case" analysis, which would involve the total loss of cargo from one or more ships.
Several simplifying assumptions are made. The spill reduction data reflect only groundings and collisions; the committee does not have comparable
data for explosions and structural accidents. Some of the design alternatives might have differing effects on, and perhaps even exacerbate, these other casualties. This caveat is important. However, in U.S. waters, over 80 per cent of oil spillage is due to groundings and collisions (65 percent due to groundings and 17 percent to collisions), so it seems worth proceeding. The analysis assumes that the listed design alternatives will have no net effect on spills from explosions or structural casualties—that only groundings and collisions will benefit.
The outflow reduction estimates assume the accident incident pattern is 60 percent groundings and 40 percent collisions, the ratio in the worldwide database used to develop the methodology. This world ratio of grounding to collision incidents (60 to 40) is approximately the same for major spills in U.S. waters; however; the ratio of spillage from groundings is closer to 80 and collisions 20, as noted in Table 6-1. Therefore, the following results unavoidably are skewed, giving somewhat greater weight to collision avoidance than appears warranted.
Finally, the designs and design combinations are assessed as potential improvements to a tanker fleet that is coming gradually into compliance with MARPOL requirements. Of course, much of the existing fleet predates the MARPOL convention and so does not have PL/SBT. To the extent that gradual replacement of pre-MARPOL tankers (even if no further design changes had been mandated) lessens future oil spills, these data overstate the problem. On the other hand, the data understate the problem to that extent that oil shipping increases in the future, and to the extent that MARPOL tankers increase risks associated with explosions and structural failures (all possibilities established earlier in this report).
The annual achievable reductions in oil spills are shown in Tables 6-3 and 6-4, for a typical year and for a major spill year, respectively. For each design, a spill-reduction range is indicated. The first number assumes that all accidents will occur in small tankers, and the second number assumes that all accidents will occur in large tankers.
These numbers indicate the extent of risk reduction delivered by the various designs. This is one aspect of risk assessment. Another key aspect is the acceptability of the residual risks, which turns in part on cost considerations, to be discussed in the following pages. (An additional factor is attitudes toward risk, discussed in general terms in Chapter 1.)
Cost Analysis: Economic Effects of Design Alternatives
A key task faced by the committee was to estimate the cost of pollution-resistant tanker designs. The economic effects can be measured as the increase in oil transportation costs due to changes in tanker capital and operating charges stemming from the structural design enhancements.
TABLE 6-3 Typical Year Performance
|
Design alternative |
Oil spills averted in typical year |
|
|
Tons of oil saved (small tanker-large tanker) |
|
Double bottom |
2,600 - 4,500 |
|
Double sides |
none-none |
|
Double hull |
3,300 - 5,300 |
|
Hydrostatic control-passive |
4,300 - 3,700 |
|
Smaller tanks |
2,100 - 2,700 |
|
Int. oil-tight deck w/DS |
4,000 - 5,400 |
|
Double sides w/hydro |
3,800 - 5,500 |
|
Double hull w/hydro |
3,800 - 5,600 |
|
SOURCE: Tables 6-1 and 6-2. Rounded to nearest 100 tons. The typical year collision-grounding spill total is 7,500 tons. The first number in each pair shown assumes that all accidents will occur in small tankers, and the second assumes that all accidents will occur in large tankers. |
|
Methodology
A simple microcomputer spreadsheet model was developed to help estimate these economic effects. The approach involves relating annualized vessel capital and operating costs to the annual volume of oil transported over a given trade lane. This results in an estimated unit transportation cost, such as $10 per ton of oil carried. Once the framework of the model was established for several sizes of "base case" single-hull tankers, variations were developed to reflect the cost impacts of the alternative designs.
The model groups tanker cost elements, with key assumptions as follows:
-
Capital Cost. The acquisition cost of a newly built tanker is spread over 20 years at an assumed 12 percent cost of money, to arrive at an annualized capital charge or amortization amount.8
-
Non-Voyage Operating Costs. These include all operating costs that do not vary with the particular voyage undertaken. These costs are for manning, stores, engine lubricants, insurance (both on the hull and engine, and for liability of all kinds), maintenance and repairs, and administration.
-
Voyage Costs. These costs—essentially fuel and port charges—are developed on the basis of typical vessels' daily fuel consumption, speed, voyage distance, and port calls.
The sum of these three cost categories is the total cost for a tanker on the selected route over a year's time. Cargo delivered annually then is computed on the basis of voyage information. Total cost divided by oil volume transported yields the tanker transportation cost, measured in dollars per metric ton or cents per gallon.
TABLE 6-4 Major Spill Year Performance
|
Design alternative |
Oil spills averted in major spill year |
|
|
Tons of oil saved (small tanker-large tanker) |
|
Double bottom |
13,600 - 24,000 |
|
Double sides |
none-none |
|
Double hull |
17,600 - 28,400 |
|
Hydrostatic control-passive |
22,800 - 19,600 |
|
Smaller tanks |
11,200 - 14,400 |
|
Int. oil-tight deck w/DS |
21,200 - 28,800 |
|
Double sides w/hydro |
17,200 - 29,200 |
|
Double hull w/hydro |
20,000 - 29,600 |
|
SOURCE: Tables 6-1 and 6-2. Rounded to nearest 100 tons. The largest spill year that occurred over the last decade is 40,000 tons. The first number in each pair shown assumes that all accidents will occur in small tankers, and the second assumes that all accidents will occur in large tankers. |
|
The data used were chosen to realistically represent the costs of moving oil at the present time, using a newly built, foreign-flag tanker. Representative capital costs were drawn from a recent study by a major oil company and estimates developed by the committee. No attempt was made to optimize each design from a cost perspective. The committee also assumed there were no dimensional constraints on tanker design that would affect specific alternatives. Operating costs were based primarily on the results of a broad survey of tanker industry experience. In general, conservative and generally accepted values were employed.
Key assumptions that differentiate the alternative tanker designs are as follows:
-
Capital costs are specified for each design. The designs are for equal cargo carrying capacity (deadweight tonnage), so those with greater ballast capacity may be somewhat larger in external dimensions or involve more internal steel, thus giving rise to differing initial costs.
-
Maintenance and repair (M&R) costs are higher for alternative designs due to two reasons: (1) the higher capital cost will require M&R costs to be proportionally higher as well; and (2) the greater extent of (salt water) ballast tanks will mean increased corrosion, inspection, and steel replacement costs.
-
Insurance will vary slightly in that hull and machinery (H&M) insurance is proportional to capital cost, while liability (P&I) insurance may decline slightly due to more favorable pollution experience with alternative designs.
-
Fuel consumption is slightly higher for designs involving hydrostatic balance, due to the greater ship size involved.
TABLE 6-5 Oil Transport Costs, Per Ton
|
Size DWT × 103 |
40 |
80 |
240 |
|
Voyage nm |
2,000 |
8,000 |
4,000 |
|
Alternative |
|
|
|
|
MARPOL ship |
$4.33 |
$10.30 |
$3.65 |
|
Double bottom |
4.77 |
11.31 |
4.06 |
|
Double sides |
4.69 |
11.02 |
3.97 |
|
Double hull |
5.01 |
11.87 |
4.26 |
|
MARPOL + hydro |
5.34 |
12.71 |
4.51 |
|
Small tanks |
4.74 |
11.25 |
4.01 |
|
IOTD w/DS |
5.19 |
12.23 |
4.35 |
|
DS w/hydro |
5.34 |
12.76 |
4.56 |
|
DH w/hydro |
5.76 |
15.19 |
4.93 |
|
SOURCE: See calculations in Appendix G. |
|||
Other major operating factors, such as crew size, port costs, and load/discharge times, are assumed constant across design alternatives for each deadweight tonnage category. In fact, the operating cost elements subject to variation generally represent only 20 to 25 percent of total annualized cost. As the variations in these operating costs do not exceed 5 percent of total cost, it is fair to say that the cost differential associated with pollution-resistant tankers lies mainly in capital costs. The most expensive design costs an estimated 60 percent more to build than the base case MARPOL tanker.
Transport cost data were developed for the MARPOL tanker and eight alternative designs and design combinations. For each design, costs were developed for three vessel sizes. Table 6-5 shows that costs range from 7 to 47 percent more than the base case transport cost, depending on vessel size and alternative design. (Detailed calculations for this table and other calculations using the model are provided in Appendix G.)
From these data, the double hull with hydrostatic balance appears consistently to be the most costly solution. Double sides, double bottoms, and smaller tanks result in the lowest additional transport cost above the MARPOL design.
Vessel sizes and voyage distances then were combined to arrive at an overall indication of the transport cost implications of design alternatives. Assumptions were as follows:
U.S. seaborne oil increments of approximately 600 million tons per year were divided into three categories:
|
Imports: |
350 m or 58 % of total |
|
Coastal: |
150 m or 25 % |
|
Alaska: |
100 m or 17 % |
|
|
100 % |
Average vessel size and voyage lengths were assigned to each trade segment:
|
Imports: |
80,000 DWT, 8,000 nautical miles round trip |
|
Coastal: |
40,000 DWT, 2,000 nautical miles round trip |
|
Alaska: |
240,000 DWT, 4,000 nautical miles round trip |
RESULTS
Weighing the transport costs for each segment, and computing the results on the basis of 600 million tons of oil carried per year, generates a dollar figure for the increased transport cost associated with each design alternative. (See Table 6-6.) The incremental costs range from $340 to $2,050 million per year. The following conclusions can be drawn:
-
Double sides, smaller tanks, and double bottoms are at the low end of the scale, in the $340 to $460 million range.
-
The double hull with hydrostatic balance is most expensive, adding $2.05 billion to the U.S. annual oil transportation bill.
-
Double hulls, double sides with either mid-height deck or hydrostatic balance, and MARPOL with hydrostatic balance are of intermediate expense, ranging from $710 to $1,100 million per year, or increments of 15 to 24 percent over the base case.
This analysis permits an estimate of the impact of design changes on consumers. The most expensive option, if universally adopted, would add less than two cents to the cost of a gallon of delivered crude oil. The impact on the price of gasoline at the pump might be roughly the same, although it could be more or less, depending on market factors. The moder
TABLE 6-6 Incremental Transport Cost for Design Alternatives
|
Design alternative |
Incremental Cost, in millions of dollars per year |
|
MARPOL ship |
$0 |
|
Double bottom |
462 |
|
Double sides |
339 |
|
Double hull |
712 |
|
MARPOL w/hydro |
1,080 |
|
Small tanks |
430 |
|
IOTD w/DS |
872 |
|
DS w/hydro |
1,102 |
|
DH w/hydro |
2,047 |
|
SOURCE: Table 6-5 and calculations in Appendix G. |
|
ately expensive design options would add, at most, a cent to the cost of a gallon of delivered oil or gasoline.
These results should be viewed as indicative examples rather than as precise, due to several analytical limitations. First, foreign-flag vessel costs have been assumed throughout. This tends to underestimate the incremental capital and operating costs of U.S.-flag vessels. This assumption is one of convenience, based on the fact that no U.S.-flag tankers currently are under construction or on order. Second, the vessel sizes and route distances employed are representative only. A more precise analysis would utilize a more detailed mix of vessel sizes on a greater number of actual tanker routes. For example, the 4,000-mile round-trip distance assumed for all VLCCs underestimates the average round-trip distance for all VLCC traffic to the United States.
Third, the analysis deals with new construction only and ignores existing vessels, for which the transport economics are more complicated. Essentially, over the long term required to construct a new fleet, freight rates presumably will be based on economic costs. For design alternatives affecting the current fleet, such as a requirement for hydrostatic loading, the freight rate reaction may not be parallel to the cost change, for the following reasons. (1) If there is an oversupply of vessels, then shipowners may absorb some or all of the increased costs over the short run without passing them on in the form of higher freight rates. (2) If requirements result in a supply shortage, then transport charges may skyrocket, because transport demand is fixed in the short run. The history of tanker shipping is replete with short-term rate spikes that subside as supply and demand move into balance, with supply typically slightly exceeding demand. (3) Existing freight rates are based to a considerable degree on fully depreciated (older) vessels, so that base rates are lower than the economic values calculated here on the basis of new building costs.
In summary, the transport cost increases associated with each vessel design are indicative only. They relate to the long-term impacts of changes in new vessel construction and operation, and they are based on foreign-flag vessels. The economic effects of changes directed at the existing fleet have not been estimated; they could be either greater than or less than the new building impacts.
Cost-Effectiveness Analysis
At this point, the oil spill reduction data can be combined with the cost information to produce a cost-effectiveness analysis of design alternatives. This entails a comparison of the alternatives in terms of cost per ton of oil saved. The results are summarized in Table 6-7 and in more detail in Table 6-8.
TABLE 6-7 Summary of Cost-Effectiveness Results
|
|
Shipping cost increase per ton of oil spill avoided in thousands of dollars |
|
|
|
Typical year |
Major spill year |
|
Highest cost designs to lessen oil spills |
|
|
|
Double sides |
(no oil saved) |
|
|
Double hull with hydrostatic control |
$366-539 |
$69-102 |
|
Medium cost designs to lessen oil spills |
|
|
|
Double sides with hydrostatic control |
200-344 |
38-64 |
|
MARPOL with hydrostatic control |
250-292 |
47-55 |
|
Lowest cost designs to lessen oil spills |
|
|
|
IOTD with double sides |
161-218 |
30-41 |
|
Double hull |
134-216 |
25-40 |
|
Small tanks |
159-205 |
30-38 |
|
Double bottom |
103-178 |
19-34 |
|
SOURCE: Table 6-8. |
||
In brief, the eight alternative designs and design combinations fall into three groups:
-
The most costly ways to prevent oil spills are double sides, and double hulls with hydrostatic balance.
-
Two alternatives could be described, in relative terms, as medium cost: Double sides with hydrostatic balance, and MARPOL ships using hydrostatic balance.
-
The other four alternatives save oil in less costly fashion and cannot be distinguished on a cost basis: double hulls, small tanks, double sides with intermediate oil-tight deck, and double bottoms.
As shown earlier, in a typical year 7,500 tons of oil is spilled from groundings and collisions; costs for this case are shown in Column A of Table 6-8. Column B shows comparable costs for a year with 40,000 tons spilled, the major spill scenario. The first number in each column assumes all spills were from small tankers; the second number assumes all spills were from large tankers (VLCCs).
Selection of the most practical design—or even evaluation of any one design—depends on the yardstick chosen. Estimates of environmental/clean-up costs or claims data provide two such measures. If a design could save oil at a lower cost than either cleanup and environmental costs
TABLE 6-8 Added Transportation Costs Per Ton of Oil Saved
|
|
Added yearly transport cost per ton of oil saved |
|
|
Design alternative |
A Typical year* |
B Year of major spills* |
|
Double bottom |
$178,000 - 103,000 |
$34,000 - 19,000 |
|
Double sides |
(no oil saved) |
(no oil saved) |
|
Double hull |
216,000 - 134,000 |
40,000 - 25,000 |
|
MARPOL w/hydro |
251,000 - 292,000 |
47,000 - 55,000 |
|
Small tanks |
205,000 - 159,000 |
38,000 - 30,000 |
|
IOTD w/DS |
218,000 - 161,000 |
41,000 - 30,000 |
|
DS w/hydro |
344,000 - 200,000 |
64,000 - 38,000 |
|
DH w/hydro |
539,000 - 366,000 |
102,000 - 69,000 |
|
* The first number in each column assumes all spills are from small tankers; the second number assumes all spills are from large tankers (VLCCs). The incremental shipping costs shown in Table 6-6 for each design are divided by the amount of oil each design prevents from being spilled (shown in Tables 6-3 and 6-4). The smaller tanker number exceeds the large tanker number in all cases except MARPOL with hydrostatic control, which reflects the pattern of effectiveness results shown in Table 6-3. |
||
or claims payments, this would constitute a strong argument for adoption of the design. However, data gathered by the committee suggest that none of the alternatives stand out as low-cost by these measures, if the future pattern of accident spills resembles that of the past. As noted previously, environmental and clean-up benefits from oil spill reductions, in the limited studies now available, range from $12,000 to $68,000 per ton saved. Alternatively, claims experience suggest figures of around $30,000 per ton saved, with the EXXON VALDEZ case possibly hitting $90,000 per ton.9
As noted previously, another way of viewing the cost of design alternatives is the societal insurance approach. For this, one merely divides the aggregate compliance costs by the quantity of delivered oil. In 1988-89, total oil imports (crude and refined) amounted to roughly 7.5 million barrels per day,10 or 115 billion gallons per year. The most costly design—double hull plus hydrostatic balance—adds $2.047 billion to shipping costs, or 1.8 cents per gallon. The cost is lower if it is spread over the entire 600 million tons of oil moving annually through U.S. waters, and still lower for all the other design alternatives under consideration. This approach makes virtually every design appear quite inexpensive. Yet each of these alternatives also could be described, just as accurately, as creating hundreds of millions of dollars of extra shipping costs annually. Whether these costs are reasonable, given the related potential reduction in oil spills is a matter of opinion.
EXPERT JUDGMENT TECHNIQUE
Given the incomplete state of technical knowledge related to most of the design options, and the imprecise nature of the economic analysis, the committee was faced with the classic problem of decision making in the presence of uncertainty. Recognizing the deficiencies of the present study, the committee nevertheless reached general agreement on the conclusions and recommendations drawn from this chapter and the technical evaluations.
As a check on the consensus, the committee decided to employ a rating method to aggregate individual ''expert judgments" on the various tank vessel design options. The rating method used a matrix to relate alternative designs and design combinations to important performance attributes.
Each committee member (expert) contributed a set of ratings, assigning a value for each attribute of each design. Each expert also assigned a weighting factor to each attribute, according to its judged importance. For each expert, attribute ratings were combined to estimate an overall rating for each design option. All of the judgments then were aggregated by arithmetic averaging, facilitated by the use of spreadsheet software. (The method and results are described in more detail in Appendix H.)
The rating method, it should be emphasized, was not a decision-making tool, but rather a means for confirming or clarifying consensus ideas. The principal conclusions to be derived from this exercise are as follows:
-
None of the designs was judged to be clearly superior.
-
The lowest-rated design was the reference (MARPOL) design, indicating that it is possible to improve upon this standard.
-
The design options tended to cluster into three groupings. The most desirable overall were the double hull with hydrostatic control, the double hull, double sides with intermediate oil-tight deck, and double sides with hydrostatic control.
-
The differences within each grouping were marginal. However, when applying the weighting factors, a slight preference for the two double-hull designs was evident. Of these, the double hull with hydrostatic control was viewed as the most desirable.
In sum, the rating method confirmed the consensus view that the current design standard (MARPOL) could be surpassed, that the double hull is an attractive alternative, and that the intermediate oil-tight deck with double sides holds promise.
POSSIBLE DISLOCATIONS TO WORLD SYSTEM OF OIL TRANSPORT
In recommending new regulations for tank vessel design, the effects of the new designs are compared with those of the existing vessel. Implicit in
this comparison is the assumption that the new designs will be built or retrofitted throughout the fleet. This section considers factors that might invalidate such an assumption. These factors can be thought of as "legal loopholes": that is, means by which commercial interests can continue to operate legally while avoiding part or all of the expected cost of the new regulations—thus nullifying the corresponding benefits.
Changing from Oil to an Alternative Energy Source
A dramatic change would occur if new design regulations increased tank vessel costs so much that it became less expensive to use coal or natural gas as energy sources rather than oil. But such a change would require energy users to have equipment that could burn coal or natural gas, and heavy use of these fuels would involve a range of different impacts, environmental and otherwise. Moreover, for the design alternatives considered by the committee, the added transportation costs are less than one to two cents per gallon. This additional cost would not be sufficient to alter significantly the fuel balance between oil and other alternatives.
Diversion of Cargo from Tankers to Barges
If the difference in transportation costs of tankers and barges changed dramatically, cargo might be diverted to the latter, less expensive type of vessel. Again, there might be an environmental impact associated with such a change. But as long as any regulatory changes apply similarly to tankers and barges, there should not be significant diversion of cargo between these two types of vessels.
Trend to Less-regulated Vessel Sizes
If new regulations dramatically changed capital or operating costs, there might be an incentive to change to vessels just under the regulated size. For example, if vessels of 10,000 DWT or more required costly design improvements, operators might favor vessels of 9,999 DWT or smaller, which could have a less environmentally favorable design. However, given the economies of scale in vessel construction and operations, no major diversion of cargo to smaller-sized vessels should occur.
Lightering, LOOP, and Transshipment in a Foreign Port
To avoid complying with design regulations in OPA 90, until 2015, an oil importer can lighter more than 60 miles from shore or use the Louisiana Offshore Oil Terminal (LOOP) in the U.S. Gulf of Mexico. Or, an oil
importer could send the oil to a Caribbean island, where it could be transhipped directly or indirectly (via a storage tank) to a small tanker, which could unload at a U.S. port. Smaller vessels entering U.S. ports, whether from lightering or transshipment operations, would be required to comply with the new law.
Lightering Outside of U.S. Jurisdiction
Rather than buy new vessels or retrofit to meet double-hull requirements, after 2015 an operator might choose to lighter from single-hull tankers outside U.S. waters. Such a pattern might subject lightering operations to the rougher weather of open seas, possibly increasing the risk of a spill.
Replacement of Jones Act Movements with Imports
In domestic trade, oil must be carried in U.S.-built vessels manned by U.S. citizens. These "Jones Act" vessels have higher costs than foreign vessels. Because design changes will increase the difference between U.S. and foreign costs, a possible result would be greater use of foreign-flag tankers to import product (rather than moving product within the United States). However, there is a much more significant factor already driving such a trend: U.S. refinery capacity. Because it is difficult to obtain a permit to build a new U.S. refinery, once existing capacity is fully utilized, additional demand for refined products will be met by imports. An additional factor is the depletion of Alaskan oil fields, and, if additional arctic oil reserves are not developed, the consequent reduced need for U.S.-flag tankers.
Creation of a Two-Tier Market
New U.S. design standards could bring about the creation of two distinct segments in the foreign-flag oil tanker market. This would occur if other major nations do not follow the lead of the United States. In this case, safer but more expensive vessels would serve the U.S. oil import trades, while traditional ships would continue to serve other trade lanes at lower freight rates.
The significance of this market segmentation would be two-fold. First, U.S. consumers would pay more for oil transportation (though perhaps less for spill cleanup) than would their foreign counterparts. Second, the operating flexibility of international tanker owners would be reduced, as traditional tankers would not be allowed in U.S. waters. Nearly 50 percent of the world tanker fleet now calls at U.S. ports in any given year (see Chapter 1). A two-tier market would create scheduling and other inefficiencies that would raise the cost of transportation for U.S. oil imports further.
If this scenario actually develops, the impact will not be significant for several years, until OPA 90 drives a meaningful number of vessels from U.S. waters. Any future regulatory actions should take into account the possibility of exacerbating the potential two-tier market effect.
Extending the Life of Existing Tank Vessels
Owners of older tank vessels are reluctant to spend money on replacements if the old vessels can be altered to provide adequate service at minor investment. To the extent that new regulations would increase the cost difference between buying new vessels and maintaining older ones, owners would be more inclined to extend the life of the older vessels. A key issue is the ability of regulatory agencies and classification societies to keep unsafe vessels out of U.S. waters.
The tendency of owners to extend the life of older vessels requires continuous monitoring by regulatory agencies and classification societies. Further regulatory actions should take into account the effect on this situation. A multi-faceted program to improve pollution control for existing vessels should be evaluated; the program should guard against encouraging retention of older vessels, although vessels that are well maintained and operated should not be prejudged based solely on age.
SUMMARY
The practical merit of the eight design alternatives analyzed depends on the contribution each could make in reducing oil spills, relative to the impact on oil transportation costs. This chapter illustrates the type of analysis that should be undertaken by policymakers as part of the decision-making process. The numerical findings reported here are less important than the nature of the analysis; reasonable people differ in their assessment of the probable oil outflow from each design, and, similarly, projections of actual cost effects are a matter of judgment.
This chapter identifies ways to characterize available evidence on both outflow and costs from a variety of perspectives. Further research is needed to explore the sensitivity of the numerical results to assumptions about benefits and costs of the designs.
One perspective focuses on oil transport costs. Based on the limited data available to the committee, none of the alternatives would add more than two cents to the cost of transporting each gallon of oil; in the aggregate, however, this would increase annual U.S. oil transport costs from $170 million to about $2.0 billion. A double hull with hydrostatic balance would be by far the most costly of the eight alternatives. Double sides, smaller tanks, and double bottoms appear to be the lowest cost alternatives.
A second perspective is that of cost-effectiveness. Each design can be characterized by combining relevant transport cost estimates with available data on oil spillage the design could avert. Substantial uncertainty surrounds estimates of the latter; this chapter relies on one set of results based on certain assumptions, and the results are at best indicative. Different assumptions would produce different results; the committee encourages more extensive investigations of these effects.
In the absence of other risk reduction measures, and assuming that the historical record of accidental oil spills is indicative of what may lie ahead, a double-hulled fleet might save 3,300 to 5,300 tons of spillage in U.S. waters in an average year. The double hull is among the four most cost-effective designs; the others are smaller tanks, double bottoms, and the intermediate oil-tight deck with double sides.
Whether the cost of implementing any new design is money well spent depends on the yardstick chosen for comparison. The actual costs of oil spills, including natural resource damages, would provide a logical basis for judgment, but available data on such damages are even less adequate than estimates of design costs. The major difficulty is that the effects of oil spills are neither well understood nor well documented. In addition, translating effects or damages into monetary terms is limited by uncertainties concerning the validity of valuation techniques, and the difficulty in valuing intrinsic benefits. At the same time, as the EXXON VALDEZ experience suggests, the cost of cleanup and natural resource damages is increasing dramatically. Thus, the reasonableness of costs remains a matter of opinion.
The uncertainties associated with estimates both of costs and, even more so, the benefits associated with design changes, led the committee to explore an additional approach to appraising the evidence. Judgmental rankings on a variety of design features were gathered from committee members, and the results indicated considerably more favorable assessment of four designs (double hull, intermediate oil-tight deck with double sides, and hydrostatic balance with either double hull or double sides) than of the other designs; no single design appeared superior in all respects. However, the rating method confirmed that it should be possible to improve upon the current design standard (MARPOL), that the double hull is an attractive alternative, and that the intermediate oil-tight deck with double sides potentially holds promise.
Additional factors that warrant concern are the possibilities that unilateral U.S. requirements could create a two-tier tanker market, and that requirements focusing on new vessels only could result in extended life for older vessels with adverse environmental consequences.
The available data suggest that the best of the design changes examined could prevent perhaps half of accident-related oil spills, which in sum comprise about one-fifth of maritime oil pollution. That is, some 10 percent of
the total oil pollution problem might be eliminated by such a design change. This would increase transport costs by some $700 million annually, which translates into one or two cents, or less, per gallon. How reasonable this cost may be, even for the best design change, cannot be determined in the absence of some judgment about its effectiveness and cost relative to alternative risk-reduction measures, such as improvements in operations or enforcement, which are beyond the purview of the present study.
NOTES
|
1. |
The total quantity of oil moving in world waters in 1989 was 1,478 million metric tons, including 1,176 million tons crude and 392 million tons product. The total quantity of oil moving in U.S. waters in 1989 was 585 million tons, including 403 million tons crude and 182 million tons product. The total figures for 1989 are about the same as they were in 1980; shipments were somewhat lower during the intervening years but never fell below 450 million tons. [Source: Temple, Barker and Sloane, Inc., and U.S. Army Corps of Engineers (coastal petroleum movement).] |
|
2. |
Charles Ehler, National Oceanic and Atmospheric Administration, and Eric Olsen, Na-tional Wildlife Foundation, presentations to the committee, June 6, 1990. |
|
3. |
For tank vessels, liability limits under OPA 90 are eight times higher than previous limits under FWPCA, and now stand at $1,200 per gross ton. Limits do not apply if the spill resulted from gross negligence or willful misconduct of the responsible party (vessel owner, operator, or demise charterer), violation of applicable federal safety, construction, or operating regulations by the responsible party, or his employee, agent, or contractor, or if he (or his agent) fails to report the spill, cooperate in its removal, or comply with an order under Section 311 of FWPCA. |
|
4. |
Gains to those whose livelihoods and recreation depend on actual use of the resource at risk. |
|
5. |
Intrinsic benefits include such values as the loss of non-commercial biomass or non-commercially valued marine mammals or seabirds, as well as the value of the potential that species (especially those yet undiscovered) may be found useful for human consumption as food, medicine, genetic material, or other raw material. |
|
6. |
Sources: The International Maritime Organization (1988, chapter 11) reports an average of $4,000 per ton, with a range of $71 to $21,000 per ton, in 1985 dollars. R. S. Farrow (1990, p. 69, Table 4-2) reports DOI estimates of roughly $2,000 per ton, in 1987 dollars. M. A. Cohen (1986, p. 185) put the average at roughly $1,100 per ton, in 1981 dollars. Somewhat lower estimates are reported by J. E. Mielke (1990). A range of $5 to $30,000 per ton (1983 dollars) was reported by I. C. White and J. A. Nichols (1983), and cleanup costs for the EXXON VALDEZ have been put as high as $60,000. |
|
7. |
Farrow reports DOI estimates of roughly $9,600 per ton, in 1987 dollars. Cohen put the average at roughly $900 per ton, in 1981 dollars (1986, p. 185). His current view was obtained by telephone on January 10, 1991. The government analyst's view was obtained by telephone on October 23, 1990; his named cannot be cited because of pending litigation. Some believe the environmental damages figure for the EXXON VALDEZ could substantially exceed this range. |
|
8. |
Estimates vary, especially for the intermediate oil-tight deck with double sides (IOTD w/ DS). Values in Appendix G, Table 6-5, reflect capital cost of roughly 17 percent over base for a double hull, but 22 percent over base for the IOTD w/DS. A definitive study, however, of the IOTD w/DS showed that the estimated capital cost differential over base |
REFERENCES
American Petroleum Institute. 1989. Measuring Natural Resource Damages: An Economic Appraisal. API Publication 4490, Health and Environmental Services Department, Washington, D.C.
Cohen, M. A. 1986. The Costs and Benefits of Oil Spill Prevention and Enforcement. Journal of Environmental Economics and Management 13(2):167-188.
Farrow, R. S. 1990. Managing the Outer Continental Shelf Lands: Oceans of Controversy. New York: Taylor & Francis.
Gundlach, E. R. 1989. Amoco Cadiz Litigation: Summary of the 1988 Court Decision. Proc. 1989 Oil Spill Conference (Prevention, Behavior, Control, Cleanup) . Washington, D.C.: API. pp. 503-508.
International Maritime Organization. 1988. Manual on Oil Pollution, Section IV, Combating Oil Spills. London: IMO.
Mielke, J. E. 1990. Oil in the Ocean: The Short- and Long-Term Impacts of a Spill. Report prepared by Congressional Research Service, Library of Congress, Washington, D.C. 90-356 SPR.
Mitsubishi Heavy Industries, Ltd. 1990. Mid-Deck Tanker. Design study received by the Committee on Tank Vessel Design, NRC, Washington, D.C., November 1990. Tokyo.
National Research Council. 1985. Oil in the Sea. Washington, D.C.: National Academy Press.
Temple, Barker & Sloane, Inc. 1990. Analysis of a Sample of 38 Major Persistent Oil Spills. Internal study conducted by TBS, Lexington, Massachusetts.
White, I. C. and J. A. Nichols. 1983. The Cost of Oil Spills. Proc. 1983 Oil Spill Conference (Prevention, Behavior, Control, Cleanup). Washington, D.C.: API. pp. 541-544.
U.S. Bureau of the Census. 1990. Statistical Abstract of the United States. Washington, D.C.: U.S. Department of Commerce.


