
Appendix A— Restoration Case Studies
The following case studies were written by several members of the Committee on Restoration of Aquatic Ecosystems, a National Research Council (NRC) consultant, and NRC staff to give the reader more details of specific restoration efforts: Lake Michigan, Lake Apopka, the Atchafalaya Basin, the Upper Mississippi River, the Illinois River, the Willamette River, the Mattole River Watershed, the Merrimack River, the Blanco River, the Kissimmee Riverine-Floodplain System, the Bottomland Hardwood Wetland Restoration in the Mississippi Drainage, the Prairie Potholes, and the Hackensack River Meadowlands. The committee made site visits to the Kissimmee River Restoration Project, the Blanco River Restoration, the Prairie potholes regions in Minnesota, and the Bottomland hardwood wetlands in the Mississippi drainage.
Several case studies show that citizen participation (through either private citizen groups or public interest groups) in restoration activity was instrumental in beginning and continuing the restoration effort (i.e., Merrimack River, Upper Mississippi River, Hackensack Meadowlands, and Illinois River). Other case studies feature cooperative participation by citizens, industry, and the state, local, and federal governments working together to return an aquatic ecosystem to a superior condition, such as the Merrimack River, the Kissimmee River, and the Atchafalaya River. One case study (Lake Apopka) shows the problems that can occur over many years to render a restoration activity ineffective.
LAKES
LAKE MICHIGAN
Claire L. Schelske and Stephen R. Carpenter
General Description
Restoration measures have been instituted as the result of a series of environmental problems that have occurred in Lake Michigan (Figure A.1) since the drainage basin was settled by Europeans. In the late nineteenth century, drinking water for the city of Chicago was contaminated with human and other wastes. In 1900, sewage was diverted from the lake to the Mississippi River drainage via the newly constructed Chicago Sanitary and Ship Canal. The diversion controlled waterborne vectors for diseases, including typhoid and cholera. More recently, water quality problems in the lake have resulted from accelerated nutrient enrichment. The fisheries of the lake have also been affected by changes that followed European settlement. Populations of commercially important fish have been eliminated sequentially from the combined effects of environmental degradation, overfishing, and eutrophication (Christie, 1974). In addition, the fish community has been altered by introductions and invasions of exotic species. Potentially toxic chlorinated hydrocarbons, which have been manufactured in the last four or five decades, have entered the food chain and now pose serious problems for the fish community.
Historical management strategies for Lake Michigan illustrate some of the consequences of attempts to restore degraded water quality and fishery resources. The main lesson is that management is imperfect and can remediate only some problems. Therefore, whenever possible, we should try to preserve natural systems and avoid having to restore them. Five examples can be cited. First, seriously contaminated water supplies were restored at great expense in 1900 by diverting sewage from Lake Michigan to a river basin (see Illinois River case study, Appendix A). (The cost of constructing the Chicago Sanitary and Ship Canal was $36 million; this was the largest channelization project prior to construction of the Panama Canal.)
Second, although problems of nutrient enrichment were alleviated initially by the Chicago sewage diversion, continued nutrient loading from sewage probably would have had severe environmental impacts
pacts because Chicago is located at the shallow end of the long culde-sac of Lake Michigan, where loading effects would have been magnified. Ironically, diversion would not have been needed if modern sewage treatment facilities had been available at the time. The diversion undoubtedly provided benefits for water quality long after there was a need to control waterborne diseases. Some estimate of the importance of diversion can be obtained by extrapolating the rapidly increasing loadings from human waste in the late nineteenth century. These would have continued if sewage from Chicago had not been diverted in 1900 (Figure A.2). However, these benefits of diversion caused serious water quality problems in the Illinois River (see Illinois River case study, Appendix A) and undoubtedly contributed to degraded water quality in the Mississippi River (Turner and Rabalais, 1991).
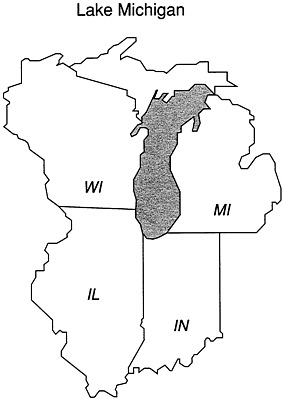
FIGURE A.1 Lake Michigan, the third largest of the Laurentian Great Lakes, is the only one to lie completely within the United States. The lake is bordered by four states: Illinois, Indiana, Michigan, and Wisconsin. Its length is 491 km, and its width is 190 km. The lake is divided into two distinct basins. The southern basin is gently sloping and has a maximum depth of 175 m. The northern basin has an irregular profile and a maximum depth of 288 m.
Third, problems of nutrient enrichment were controlled in the 1970s by strategies to reduce phosphorus loading, particularly from sewage treatment plants. These sources of nutrients had become especially important beginning in the 1940s. Improved water quality that resulted from better sewage treatment was obtained at a cost of $10 billion. Benefits other than reduced nutrient loading that may accrue in the future from improved sewage treatment include reduced loadings of potentially toxic materials and vectors for waterborne diseases.
Fourth, although water quality has improved, two examples can be cited to show that the chemical condition of the water in Lake Michigan has not been restored to pristine conditions. One example is that silica has been depleted as a result of phosphorus enrichment and consequent increased growth of diatoms, which require silica for growth (Figure A.2). With a shortage of this essential nutrient, the natural phytoplankton assemblages of the lake and the dependent
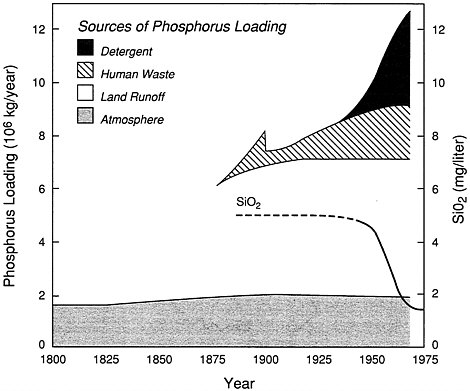
FIGURE A.2 Computer simulation of total phosphorus loads to Lake Michigan from 1800 to 1970 (adapted from Chapra, 1977). Source: Reprinted, by permission, from Schelske (1988). Copyright © by Akademie-Verlag Berlin, Leipziger Strasse Berlin, FRG.
trophic interactions cannot be restored. Because of the large volume of Lake Michigan, the reduction in silica concentration, a consequence of eutrophication, amounts to a loss of 15 million tons of silica from the lake. It is not likely that silica will be added to the lake because the cost of even partial restoration is prohibitive. The other example is that fish from the lake may not be safe to eat because they have accumulated high levels of potentially toxic chlorinated hydrocarbons. These materials are dispersed throughout the system and apparently are being renewed by atmospheric inputs.
Fifth, native fish stocks have been either decimated or severely depleted, and exotic species have invaded or have been introduced into the lake. Some of the ecosystem function attributed to fish has been restored by stocking and by other forms of management. The fish community (Figure A.3) is now largely dominated by exotic species, however, and this and other parts of the original biological community have been lost. The artificial fish community is susceptible to perturbations such as hatchery-transmitted diseases of exotic salmonids, the potential evolution of lampreys resistant to 3-trifluormethylnitrophenol (TFM), and invasions of exotic species. The Lake Michigan food web is a caricature of the ancestral one and lacks the stability of a self-sustaining natural community.
In summary, the case history for Lake Michigan provides important lessons about the limitations of restoration and other types of remedial action. Benefits resulting from restoration efforts include improved water quality and rehabilitation of fishery resources. An unanticipated benefit of remedial action may have been improvements in water quality that resulted from the diversion of sewage from Chicago to the Mississippi River drainage. However, this diversion of sewage undoubtedly contributed to degradation of water quality in downstream receiving waters, including the Mississippi River. Several examples show that corrective measures to restore ecosystem function were obtained only at very high costs, that some attributes can be maintained only with continuous management, and that certain losses in the ecosystem were irreversible.
Types of Disturbances
EUTROPHICATIONS AND NUTRIENT LIMITATION
Nutrient control in the Lake Michigan basin is devoted to phosphorus reduction because experimental studies of effects of nutrient limitation on phytoplankton have clearly established that Lake Michigan is a phosphorus-limited system (Schelske et al., 1986). In addition,
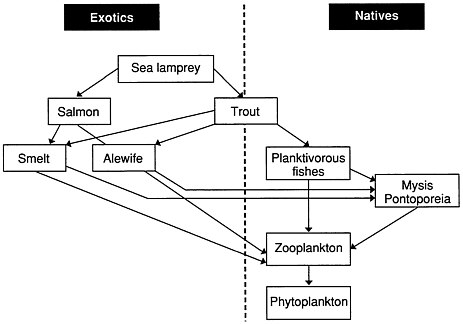
FIGURE A.3 Major exotic and native components of the food web of Lake Michigan. Source: Reprinted, by permission, of Kitchell and Crowder (1986). Copyright (c) 1986 by Kluwer Academic Publishers.
these studies also have provided evidence that silica limitation for diatom production can be induced with increased phosphorus loading (Schelske and Stoermer, 1971). The demand for silica, an essential nutrient for diatom growth, increases as diatom production is stimulated by increased phosphorus supplies. Some proportion of the increased diatom production is sedimented, leading to silica depletion in the water column. Under these conditions, phosphorus supplies that would normally be used for diatom production can be used for production of other types of phytoplankton, including blue-green and green algae. Silica depletion and a shift in species composition of phytoplankton, therefore, are expected consequences of eutrophication. Anthropogenic nutrient loadings of phosphorus have increased rapidly, whereas loadings of silica have not increased proportionately to meet the elevated silica demand for diatom production.
PHOSPHORUS LOADING
Profiles of historical phosphorus loading have been obtained by computer simulation for 1800 to 1970 (Chapra, 1977). Until the 1970s, these simulations provide the main source of information about phosphorus loading to the lake (see Figure A.2). Prior to the beginning of
European settlement in the mid-1800s, nearly 50 percent of the phosphorus loading was from atmospheric sources. After 1850, phosphorus loading increased, first as the result of forest clearance and associated soil erosion, and later as a result of added human waste from a rapidly increasing human population along the lake shore. The contribution from human waste increased rapidly until 1900, when sewage from Chicago was diverted to the Mississippi drainage by the Chicago Sanitary and Ship Canal. Without this diversion, phosphorus loading to and phosphorus concentration in Lake Michigan probably would have increased exponentially, following the pattern observed in Lake Erie and Lake Ontario. In Lake Michigan, the rapid, exponential increase did not occur until phosphate detergents were introduced after World War II. Phosphorus loads to Lake Michigan have decreased as a result of the 1972 Water Quality Agreement between Canada and the United States. (Although Lake Michigan is entirely within the United States, its water quality is pertinent in the international agreement because outflow from the lake enters Lake Huron, where it can affect the quality of international waters.) No detectable trend in total phosphorus loading occurred from 1974 to 1980, when loads ranged from 6,000 to 7,500 metric tons per year, with the exception of a load of 4,670 metric tons in 1977. Loads were much lower from 1981 to 1985, ranging from 3,500 to 4,500 metric tons annually. The effectiveness of phosphorus control programs is evident because loads from 1981 to 1985 were well below the target load of 5,600 metric tons per year established in the 1972 Water Quality Agreement (Rockwell et al., 1989).
Response to Phosphorus Loads
Long-term studies of phytoplankton standing crop, which have been restricted to nearshore sites, have shown that the annual standing crop of algae (measured either as counted cells or calculated biomass) increased from 1927 to 1965 and then decreased markedly until levels in 1976 to 1978 were essentially equal to those in the late 1920s (Makarewicz and Baybutt, 1981). Data on monthly average cell counts showed a slightly different pattern. The population density was 50 percent lower in the period 1972 to 1975 than in the preceding 4 years and lower than any 4-year period since 1953 to 1956 (Danforth and Ginsburg, 1980). The change in 1972 to 1975 resulted largely from decreases in the spring and fall maxima of diatoms. Both studies showed that the recent decreases in algal abundance were accompanied by increases in blue-green algae. Although decreases in algal standing crop occured before the implementation of nutrient reduction
programs in 1972, both studies suggest that the effect may be attributable at least partly to the reversal of eutrophication.
The trends in the data set for 1972 to 1984 are complicated by several factors. The first of these is the inherent problem of obtaining a representative sample from a lake the size of Lake Michigan (22,400 square miles). The second is that the trend apparently is confused by climatic factors, particularly the unusually cold winter of 1976-1977. As a result of the cold winter, when ice cover was 90 percent, compared to 20 to 50 percent under normal conditions, winter and spring resuspension of sedimented materials was minimal and the total concentration of phosphorus mean decreased from 8 to 5 µg per liter from 1976 to 1977. The third is that trends may be difficult to measure because concentrations of both total phosphorus and chlorophyll are relatively low. The final difficulty is variability introduced by biological factors. Water clarity increased dramatically in 1983, when the abundance of Daphnia pulicaria increased marked ly (Scavia et al., 1986). The increase in water clarity was attributed to increased grazing pressure from this filter feeder and to the cascading trophic effect of decreased predation on Daphnia by alewife (Scavia and Fahnenstiel, 1988).
Evidence for cultural eutrophication has been obtained from the study of diatoms in a sediment core from the northern basin (Stoermer et al., 1990). These results indicate that the diatom community responded relatively little to nutrient enrichment from 1885 to 1925, with an accelerating trend between 1925 and 1954 and the most rapid change between 1954 and 1965. The reversal in trends in diatom species abundance after 1965 attributed to silica limitation was also inferred previously from trends in accumulation rates of biogenic silica in sediment cores (Schelske et al., 1983). This phasing of the effects of phosphorus loading on diatom production agrees well with historical changes in silica concentration in the water mass. Rapid silica depletion from 1955 to 1970 has been attributed to increased diatom production and sedimentation (Schelske, 1988). During these 15 years, silica concentrations decreased from approximately 4.5 to 1.5 mg per liter during the annual water maximum and from approximately 2.0 to 0.1 mg per liter in epilimnetic waters during summer stratification. Whether this rapid change in silica concentration (see Figure A.2) in the open waters of Lake Michigan can be substantiated from long-term data that were collected from nearshore waters at the Chicago Water Filtration Plant has been questioned by Shapiro and Swain (1983). In the case of Lake Michigan, several independent lines of evidence were available to document an historical decrease in silica concentration (see Schelske, 1988). The important reason
here is that it may be impossible to establish the accuracy of historical data and that historical data, therefore, must be evaluated carefully. It has recently been documented that silica concentrations in the Mississippi River also decreased after 1950 (Turner and Rabalais, 1991).
All the responses to phosphorus loading that have been summarized above share a common temporal feature. Large responses that have been attributed to nutrient enrichment occurred after the introduction of phosphate detergents in the period from 1955 to 1970. Although these effects are correlated with increases in phosphate detergents, it should be pointed out that this source of phosphorus increased concomitantly with increased population growth and sewage.
EXOTIC SPECIES FOR LAKE MICHIGAN
In this century, the food web of Lake Michigan has been almost completely reconfigured by a combination of exotic species invasions and deliberate stocking of sport fishes (Christie, 1974). The ancestral offshore fish stocks were dominated by lake char and coregonines, although 114 native fish species representing 21 families were known from the lake. Waves of introductions of exotic species and collapses of native species began in the 1940s.
The collapse of lake char populations between 1946 and 1952 was correlated with an expansion of sea lamprey populations and an increase in harvest rates (Christie, 1974). Populations of the exotic, parasitic sea lamprey peaked between 1950 and 1957. Between 1950 and 1955, the gillnet fisheries of the lake converted from cotton and linen to nylon nets, which achieved at least a threefold increase in fishing efficiency. Selective harvesting of the largest lake char may have forced the lampreys to feed on smaller individuals, which are more likely to die from lamprey attacks (Kitchell, 1990). The relative importance of overfishing and of sea lamprey increases in the collapse of the lake char stock continues to be debated. Since the early 1960s, the sea lamprey has been successfully controlled by the regular additions of TFM, which kills the sedentary ammocoetes in the breeding streams.
The exotic rainbow smelt was first reported in Lake Michigan in 1923 and by the 1930s had attained sufficient numbers to support a fishery (Christie, 1974). Fishery yield peaked between 1953 and 1960. It is not certain when the exotic alewife entered Lake Michigan, but populations began to increase in 1949 and reached nuisance levels by 1957. The lake char was probably an important predator of both
smelt and alewife, and collapse of the lake char likely contributed to the population growth of both of these forage fish. Expansion of rainbow smelt and alewife populations corresponded with the collapsing stocks of native lake herring, and the causal mechanisms of these changes in forage fish communities continue to be debated. After 1960, smelt populations declined, whereas alewife populations boomed, culminating in the infamous die-offs that littered Lake Michigan beaches in the late 1960s.
Control of the sea lamprey was followed by highly successful stocking of exotic coho and chinook salmon in Lake Michigan. By the 1980s, stocked salmonids formed the basis of a sport fishery valued in excess of a billion dollars per annum (Kitchell and Crowder, 1986). By 1978, careful analyses of salmonid diets and bioenergetic requirements indicated that heavy predation was likely to trigger a collapse of the alewife stock (Stewart et al., 1981). By 1983, it was evident that a severe decline in alewife abundance was under way (Kitchell and Crowder, 1986). It is ironic that ''Save the Alewife" tee-shirts could be purchased in Milwaukee less than 20 years after massive die-offs fouled water intakes and beaches.
Lake Michigan cannot be viewed as a pristine, natural system. Ecosystem dynamics are determined mainly by nonnative species and decisions made by managers. At present, the food web's keystone species are exotic fish whose population dynamics are determined by management policies and are uncoupled from typical ecological feedbacks (Figure A.3). A substantial share of the variability in lower trophic levels is determined by the predatory effects of these fish (Kitchell and Crowder, 1986). Though the species composition of the community is dramatically different from the ancestral one, the extent to which ecosystem functions and trophic structure resemble those that existed prior to disturbance remains an open question. At present, fish biomass at all trophic levels is around twice as large as it was before collapse of the native stocks (J. F. Kitchell, Center for Limnology, University of Wisconsin, personal communication, June 1990).
The management of Lake Michigan's fish stocks must be judged a success by several criteria. An extremely successful sport fishery has created and sustained public interest in the resource while controlling the nuisance alewife. However, the ecosystem is an artificial one. The exotic salmonids are susceptible to outbreaks of disease, such as the current epidemic of bacterial kidney disease, exacerbated by complete dependence on hatcheries. Restoration of native species has not occured and in many cases seems unlikely. It has proved very difficult to establish reproducing populations of lake char. Ironically,
the native lake char is less respected as a game fish, and has far greater concentrations of organochlorine contaminants, than the other salmonids. High contaminant levels may contribute to low egg viability of the lake char.
Lake Michigan is also vulnerable to further invasions of exotic species, with consequences that are largely unpredictable. The recent invasion of the exotic zooplankter Bythotrephes cederstroemii has had a profound effect on the planktonic community structure of Lake Michigan (Lehman, 1988). Other potentially more significant invaders are already present in other Laurentian Great Lakes: zebra mussels (also in Lake Michigan), river ruff, and white perch. One prediction can be made with relative certainty: continual vigilance and management of Lake Michigan's food web will be essential to sustain the favorable conditions that currently prevail.
ORGANOCHLORINE CONTAMINANTS
In Lake Michigan, organochlorine contaminants have been a major environmental concern because of their potentially deleterious effects on wildlife and humans who eat fish. Because these lipophilic compounds tend to accumulate in higher concentrations at higher trophic levels, fish-eating organisms, such as ospreys, eagles, gulls, otter, mink, and humans can be exposed to chemicals at concentrations that far exceed those in the water (International Joint Commission, 1989). Dichlorodiphenyltrichloroethane (DDT) and polychlorinated biphenyls (PCBs) provide contrasting examples of efforts to reduce organochlorine contaminant levels in fish (U.S. FWS, 1989).
Until it was banned in 1970, DDT was used commonly as an insecticide. After the ban, concentrations in fish declined exponentially (Figure A.4). From a human health standpoint, concentrations reached acceptable levels by the mid-1970s and have continued to decline since then. In the case of DDT, point source reduction of inputs successfully restored concentrations to acceptable levels.
Polychlorinated biphenyls were used for a variety of industrial applications until a voluntary reduction was effected in 1972, followed by a ban on manufacture of the compounds in 1976. After the ban, concentrations in fish dropped significantly (Figure A.4) and have been stable since the early 1980s, although water column concentrations have continued to decline (Swackhamer and Armstrong, 1985; Anders Andren, Sea Grant Institute, University of Wisconsin, personal communication, June 1990). Concentrations in several exploited fish stocks remain above the Food and Drug Administration action level of 2 mg/kg (De Vault et al., 1985; Masnado, 1987). Why
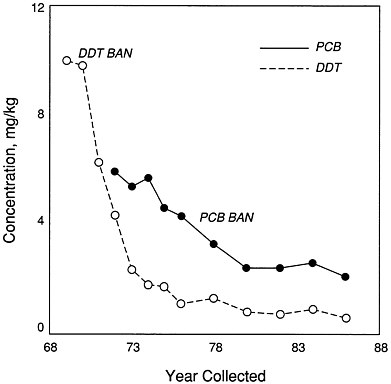
FIGURE A.4 Trends in levels of organoclorine contaminants DDT and PCB in bloater chubs (Coregonous hoyr) in Lake Michigan. Source: U.S. Fish and Wildlife Service, 1989.
has the PCB ban failed to reduce concentrations in fish to acceptable levels? First, nonpoint source inputs are relatively high. The atmosphere is a major source of PCBs to the ecosystem, and atmospheric concentrations of PCBs in the Lake Michigan airshed did not decline during the 1980s (Manchester-Neesvig and Andren, 1989). Also, poorly contained waste materials continue to add PCBs to ground water and surface water systems draining into Lake Michigan. Annual inputs from atmospheric and fluvial sources exceed total losses, which include those to the atmosphere, outflow to Lake Huron, and sedimentation (Andren, 1983; Swackhamer and Armstrong, 1985). Second, recycling of PCBs within the ecosystem appears to be relatively efficient and stabilizes concentrations in the biota. Diet and growth rate are among the major factors that determine PCB concentrations in fish (Thomann, 1989a,b). It may be possible to reduce PCB concentrations by restructuring the fishery around species that tend to have lower PCB concentrations. Recycling from sediment may be another process that can be manipulated in some areas to reduce PCB flux
into the biota. Because nonpoint inputs of PCBs are hard to control, research on internal cycling mechanisms has become increasingly important. Further efforts to reduce PCB concentrations in Lake Michigan fish will evidently require new scientific and institutional efforts. Research and management efforts must address not only point source reductions but also nonpoint and atmospheric inputs that now dominate the mass balance. New efforts are needed to understand the internal cycling of PCBs through the food web, and the interfaces between the food web and PCBs in water and sediments.
Institutional and Educational Issues
Restoration of Lake Michigan requires cooperation among water chemists, fisheries biologists, and wildlife ecologists—researchers in disciplines that traditionally have had very little interaction. No single agency is responsible for the Lake Michigan ecosystem. Responsibilities for water quality, fisheries, and wildlife are divided piecemeal among several state and federal agencies. Effective management of the ecosystem requires institutional collaborations that involve the U.S. Environmental Protection Agency, the U.S. Fish and Wildlife Service, and the water quality and fisheries management agencies of Illinois, Indiana, Michigan, and Wisconsin. The next decade will reveal whether the interdisciplinary and interagency efforts needed to reduce PCB levels in Lake Michigan fish can be implemented.
References
Andren, A. W. 1983. Processes determining the flux of PCBs across the air/water interface. Pp. 127-140 in D. MacKay, S. Paterson, S. J. Eisenreich, and M. Simmons, eds., Physical Behavior of PCBs in the Great Lakes. Ann Arbor Science, Ann Arbor, Mich.
Chapra, S. C. 1977. Total phosphorus model for the Great Lakes. J. Environ. Eng. Div., Am. Soc. Civ. Eng. 103:147-161.
Christie, W. J. 1974. Changes in the fish species compositions of the Great Lakes. J. Fish. Res. Bd. Can. 31:827-854.
Danforth, W. F., and W. Ginsburg. 1980. Recent changes in the phytoplankton of Lake Michigan near Chicago. J. Great Lakes Res. 6:307-314.
De Vault, D. S., W. A. Willford, and R. J. Hesselberg. 1985 Contaminant trends in lake trout (Salvelinus namavcush) of the Upper Great Lakes. U.S. Environmental Protection Agency Report 905/3-85-001.
International Joint Commission. 1989. Report on Great Lakes Water Quality. Windsor, Ontario, Canada N9A 6T3.
Kitchell, J. F. 1990. The scope for mortality caused by sea lamprey. Trans. Am. Fish. Soc. 119:642-648.
Kitchell, J. F., and L. B. Crowder. 1986. Predator-prey interactions in Lake Michigan: Model predictions and recent dynamics. Environ. Biol. Fish. 16:205-211.
Lehman, J. T. 1988. Algal biomass unaltered by food-web changes in Lake Michigan. Nature 332:537-538.
Makarewicz, J. C., and R. I. Baybutt. 1981. Long-term (1927-1978) changes in the phytoplankton community of Lake Michigan at Chicago. Bull. Torrey Bot. Club 108:240-254.
Manchester-Neesvig, J. B., and A. W. Andren. 1989. Seasonal variation in the atmospheric concentration of polychlorinated biphenyl congeners. Environ. Sci. Technol. 23:1138-1148.
Masnado, R. G. 1987. Polychlorinated biphenyl concentrations of eight salmonid species from the Wisconsin waters of Lake Michigan: 1985. Wis. Dep. Nat. Resour. Fish Manage. Rep. 132:55.
Rockwell, D.C., Salisbury, D.K., and Lesht, B.M. 1989. Water Quality in the Middle Great Lakes: Results of the 1985 U.S. EPA Survey of Lakes Erie, Huron and Michigan. U.S. Environmental Protection Agency, Great Lakes National Program Office, Chicago, IL. EPA-905/689-001, GLNPO Report No. 4. 207 p. and appendices.
Sandgren, C. D., and J. T. Lehman. 1990. Response of chlorophyll a, phytoplankton, and microzooplankton to the invasion of Lake Michigan by Bythotrephes. Ver. Int. Ver. Limnol. 24:386-392.
Scavia, D., and G. L. Fahnenstiel. 1988. From picoplankton to fish: Complex interactions in the Great Lakes. Pp. 85-97 in S. R. Carpenter, ed., Complex Interactions in Lake Communities. Springer-Verlag, New York.
Scavia, D., G. L. Fahnenstiel, M. S. Evans, D. J. Jude, and J. T. Lehman. 1986. Influence of salmonine predation and weather on long-term water quality in Lake Michigan. Can. J. Fish. Aquat. Sci. 43:435-443.
Schelske, C. L. 1988. Historic trends in Lake Michigan silica concentrations. Int. Rev. Ges. Hydrobiol. 73:559-591.
Schelske, C. L., and E. F. Stoermer. 1971. Eutrophication, silica depletion, and predicted changes in algal quality in Lake Michigan. Science 173:423-424.
Schelske, C. L., E. F. Stoermer, D. J. Conley, J. A. Robbins, and R. M. Glover. 1983. Early eutrophication in the lower Great Lakes: New evidence from biogenic silica in sediments. Science 222:320-322.
Schelske, C. L., E. F. Stoermer, G. L. Fahnenstiel, and M. Haibach. 1986. Phosphorus enrichment, silica utilization, and biogeochemical silica depletion in the Great Lakes. Can. J. Fish. Aquat. Sci. 43:407-415.
Shapiro, J., and E. B. Swain. 1983. Lessons from the Silica "decline" in Lake Michigan. Science 221:457-459.
Stewart, D. J., J. F. Kitchell, and L. B. Crowder. 1981. Forage fishes and their salmonid predators in Lake Michigan. Trans. Am. Fish. Soc. 110:751-763.
Stoermer, E. F., J. A. Wolin, C. L. Schelske, and D. J. Conley. 1990. Siliceous microfossil succession in Lake Michigan. Limnol. Oceanogr. 35:959-967.
Swackhamer, D. L., and D. E. Armstrong. 1985. Distribution and characterization of PCBs in Lake Michigan water . J. Great Lakes Res. 13:24-36.
Thomann, R. V. 1989a. Bioaccumulation model of organic chemical distribution in food chains. Environ. Sci. Technol. 23:699-707.
Thomann, R. V. 1989b. Deterministic and statistical models of chemical fate in aquatic systems. Pp. 245-277 in S. A. Levin, M. A. Harwell, J. R. Kelly, and K. D. Kimball, eds., Ecotoxicology: Problems and Approaches. Springer-Verlag, New York.
Turner, R. E., and N. N. Rabalais. 1991. Changes in Mississippi River water quality in this century. Bioscience 41:140-147.
U.S. Fish and Wildlife Service (FWS). 1989. National Fisheries Research Center-Great Lakes. Biannual Report 87/88. Ann Arbor, Mich. 10 pp.
CAN LAKE APOPKA BE RESTORED?
Claire Schelske and Patrick Brezonik
General Description and Type of Disturbance
Lake Apopka prior to the late 1940s was well known as an outstanding sport fishing lake with exceptionally clear water (Clugston, 1963). With an original surface area of 18,000 ha, it was the second largest lake in Florida (Schneider and Little, 1973). However, draining the marshlands along the northern shore in the 1940s reduced the surface area to 12,500 ha. This shallow lake with an average depth of less than 2.0 m is located in Orange and Lake counties, 20 km west of Orlando. The change in water quality in this lake was reported to have been dramatic in 1947 (Clugston, 1963). At the time, the lake was characterized as having abundant rooted aquatic vegetation and very clear water until rooted aquatic plants were uprooted by a hurricane. A week after the hurricane the first plankton bloom was reported. Aquatic plants have never been reestablished. The lake is now a classic hypereutrophic lake, with chlorophyll concentrations that exceed 100 µg per liter, and has changed from a highly regarded sport fishing lake to a lake with few desirable sport fish.
According to Schneider and Little (1973), human influence on the lake was evident by 1920, when citrus groves were being planted in central Florida. The well-drained southern shoreline was an excellent site for groves, but the marshland on the northern shore was not developed. In 1920, the town of Winter Garden constructed a sewerage system and two large septic tanks, permitting waste products to enter the lake directly. Nutrients from municipal waste and runoff from the citrus groves seemed at first beneficial to a popular sport fishery. Grass beds that covered the lake bottom provided cover for young fish and tied-up nutrients. The marshlands were used as spawning grounds. Sport fishing for largemouth bass, speckled perch, bluegill, and other pan fish provided record-size fish and a half-million-dollar annual income for 13 fishing resorts and camps. A thriving commercial fishery yielded more than 3 million kilograms (dressed weight) of catfish in one 8-month period.
The lake was altered severely in the 1940s (Schneider and Little, 1973). A plan for draining and farming part of the marshland was formulated in 1942. This resulted in the construction of a dike along the north shore and draining of about 6,000 ha of fertile lake bottom so it could be used for muck farms. Thus, fertile muck land and availability of lake water enabled several crops to be grown and harvested each year. During dry periods, lake water could be used for
irrigation, in wet periods, agricultural water from the farms could be back-pumped from the drainage canals into the lake. The opening of Beauclair Canal in 1948 permitted better drainage of Lake Apopka to a downstream chain of lakes and lowered the lake level. This alleviated concerns of muck farm owners that future storms would weaken or destroy the dikes and reflood their croplands. In 1946 the lake waters were still clear. However, in the fall of 1947, soon after a severe hurricane had uprooted large quantities of aquatic plants, the first plankton bloom was observed. The dense beds of rooted aquatics were never reestablished, probably because they could not compete with planktonic algae in the nutrient-rich waters.
Clugston (1963) did not discuss the effects of the hurricane but stated that a combination of external factors probably increased the fertility of the lake that led to the first algal bloom in 1947. First, a water hyacinth control program resulted in large amounts of decaying vegetation. Second, a citrus-processing plant at Winter Garden increased its capacity considerably between 1946 and 1950 and its release of waste products. Third, muck farms at the north end of the lake were expanded greatly in the 1940s. Water pumped out of the farming areas may have added nutrients and contributed to siltation in the lake. Fourth, citrus groves located along the eastern and western shores may have contributed nutrients. Finally, a sewage treatment plant at Winter Garden was pumping effluent into the lake.
The game fish population comprised 35 percent of the species present, and gizzard shad made up 20 percent of the total fish population by weight in 1947 when the plankton bloom was first noted (Clugston, 1963). As the plankton bloom persisted, the gizzard shad probably increased greatly in numbers but were small in size, providing excellent forage for game species. As a result, game fish constituted 69 percent of the total population in 1950. From 1947 to 1950 the estimated weight of the total fish population increased tenfold. By 1956-1957, however, the game fish population had dropped to 18 percent of the total. Shad, which made up most of the remaining 82 percent, are thought to have become too large and numerous to be cropped by game species. In an effort to alleviate the shad problem, the Game and Fresh Water Fish Commission treated the lake with rotenone in three successive years; 1957, 1958, and 1959. An estimated 9 million kilograms of gizzard shad were killed with the three treatments. These fish were left in the lake to decompose and release nutrients. In May 1963, 1.4 million kilograms of fish were reported killed by gas (oxygen or nitrogen) embolism (Schneider and Little, 1973).
State Intervention
This series of environmental problems led the governor of Florida on April 4, 1967, to appoint a technical committee to evaluate the restoration of the lake. Sixteen agencies, including the Federal Water Pollution Control Administration (FWPCA), agreed to participate in the project (Schneider and Little, 1973). An FWPCA study begun in 1968 revealed that 90 percent of the bottom was covered with unconsolidated bottom sediment (muck) averaging 1.5 m thick. These sediments and peat sediments found along the shoreline were anaerobic and provided limited suitable substrate for desirable biota. Only 5 percent of the bottom was covered with sand, clay, and shell. The top meter of lake sediment contained 225 million kilograms of total nitrogen and 2 million to 4 million kilograms of total phosphorus. Chemical oxygen demand in the muck samples (dry weight) was 1,100 mg/g. The FWPCA also made a crude nutrient budget and emphasized that restoration of the lake must include reduction of nutrient input. Although direct rainfall on the lake and high nutrient input from citrus grove runoff were important, the principal controls on inputs emphasized by the FWPCA were point sources such as agricultural runoff pumped directly into the lake from muck farms, and municipal and industrial wastes.
In addition to control of external nutrient sources, several solutions for improving lake water quality were listed by Schneider and Little (1973). These include:
-
dredging to remove nutrient-rich unconsolidated bottom sediments to increase lake depth and reduce internal nutrient recycling;
-
using lake drawdown to expose and subsequently consolidate large areas of lake bottom by oxidation and compaction;
-
adding an inert sealing material to stabilize bottom sediments;
-
engaging in hydroponic farming to remove dissolved nutrients;
-
harvesting to remove algae by flotation, filtration, precipitation (not within the lake), or centrifugation (recovered algae could be used as a feed supplement); and
-
harvesting fish to remove nutrients "on a large scale." Harvested fish could be used as a protein supplement.
"Other bizarre schemes were considered but not seriously," according to Schneider and Little (1973). The governor of Florida assigned complete responsibility for a 1970 restoration of Lake Apopka to the Florida Air and Water Pollution Control Commission. This agency decided to proceed with the lake drawdown approach by allowing gravity drainage to lower the lake
level 60 cm beginning in December 1970. The effect of this lowering was to be evaluated, and the lake would then be drained further by pumping to 25 percent of its original area. This final drawdown would occur in the spring of 1971. It was anticipated that two beneficial effects would result from the drawdown. First, nutrient recycling would be reduced or eliminated from dried, compacted sediments. Second, suitable substrate for rooted aquatic vegetation would also be a result. This plan to lower the lake about 7 ft below normal water level was not implemented, however, because of the projected cost ($20 million) and because of concern about environmental and economic impacts (Lowe et al., 1985). For example, the loss of lake volume would minimize the freeze protection citrus growers received from the large heat capacity of the lake.
In the 1970s, additional studies were conducted on water quality problems and on restoration of Lake Apopka (Brezonik et al., 1978; Lowe et al., 1985). Studies of techniques that might be used to restore the lake have continued. Biomanipulation of algal standing crops with gizzard shad may actually increase standing crops of undesirable algae (Crisman and Kennedy, 1982). A multimillion-dollar feasibility study on growing and harvesting water hyacinths to remove nutrients from the lake was launched (Amasek, Inc., 1985). The field test of this project in Lake Apopka was abandoned when the enclosure that was to have been used for the experiment was destroyed by water movements in the lake.
A project on a smaller scale will be tested in a small lake. Many experts believe this approach will fail because of problems in harvesting water hyacinths, which have a very high water content; because nutrients, including nitrogen, would have to be added to lake water to obtain projected growth rates; and finally, because water hyacinths require high phosphorus concentrations for growth and do not reduce phosphorus to low levels under any conditions.
Currently, the Saint Johns Water Management District is beginning a feasibility study on using marsh restoration to improve water quality in the lake (Lowe et al., 1989; Lowe et al., in press). The water management district has purchased muck farmland that will be flooded to restore the wetland by using the wetland as a filter to remove nutrients. The hydrology of the wetland will be manipulated so that highly nutrient-enriched water will flow from the lake into the wetland and nutrient-depleted water from the wetland will be directed back to the lake. If successful, this project will result in both a restored wetland and a restored lake.
Overall Evaluation
There seem to be two divergent views about Lake Apopka. One group contends that the lake can be restored. This viewpoint is supported by the need to reduce nutrient inputs to prevent accelerated eutrophication. Schneider and Little (1973) commented that the history of Lake Apopka "is not atypical" because other lakes in Florida and reservoirs all over the South were being subjected to similar attacks. They stated that the lake could be restored, but only with great expense and difficult decisions (e.g., the extent to which a $10 million plus marginal muck farming operation could expend money for nutrient removal). "The technical capabilities to prevent accelerated eutrophication are and have been available for some time. The planning and foresight needed to prevent the early demise of our lakes, however, has come into being only lately. Today, we must consider the full ecological impact of all our resource development activities if we are to eliminate the Lake Apopka syndrome from our aquatic environment," they emphasized.
At the other extreme is the viewpoint that restoration should not be attempted because it will meet with failure or it is too expensive. This viewpoint can be supported to a certain extent with results of studies on Lake Tohopekaliga (Lake Toho), Florida. A number of restoration measures have been instituted on Lake Toho since 1971, with little evidence of improvement in water quality (Dierberg et al., 1988). In this lake, nutrient inputs have been reduced by sewage treatment and by storm water detention and filtration. In addition, drawdown has been used as a restoration measure. What is not known is whether water quality would have been degraded even more if remedial measures had not been instituted. Dierberg et al., (1988) point out that evaluation of restoration practices in Florida lakes has been hampered by the lack of long-term data and the consequent limitation on the use of robust statistical approaches in evaluating effectiveness.
References
Amasek, Inc. 1985. A Practical Concept for the Restoration of Lake Apopka. Report by Amasek, Inc., Cocoa, Fla. 38 pp.
Brezonik, P. L., C. D. Pollman, T. C. Crisman, J. N. Allenson, and J. L. Fox. 1978. Limnological and water quality studies on Lake Apopka and downstream lakes in the Upper Oklawaha River Basin. Historical trends and current status. Report to Florida Department of Environmental Regulation. Rept. No. Env-07-78-01. Department of Environmental Engineering Science, University of Florida, Gainesville. 283 pp.
Clugston, J. P. 1963. Lake Apopka, Florida; A changing lake and its vegetation. Q. J. Fla. Acad. Sci. 26:168-174.
Crisman, T. L., and H. M. Kennedy. 1982. The role of gizzard shad (Dorosoma cepedianum) in eutrophic Florida lakes. Publ. No. 64, Water Resources Research Center, University of Florida, Gainesville. 83 pp.
Dierberg, F. E., V. P. Williams, W. H. Schneider. 1988. Evaluating water quality effects of lake management in Florida. Lake Reservoir Manage. 4:101-111.
Lowe, E. F., J. Adams, J. Bateman, C. Fell, D. Graetz, J. Hulbert, W. Ingram, W. Johnson, P. Muller, L. Nall, R. Reddy, L. Snyder, and V. Williams. 1985. Proposed scope of work for the Lake Apopka pilot project. Unpublished Draft report. 55 pp.
Lowe, E. F., D. L. Stites, and L. E. Battoe. 1989. Potential role of marsh creation in restoration of hypereutrophic lakes. Pp. 710-717 in D. A. Hammer, ed., Constructed Wetlands for Wastewater Treatment: Municipal, Industrial and Agricultural. Lewis Publishers, Chelsea, Mich.
Lowe, E. F., L. E. Battoe, D. L. Stites, and M. F. Coveney. In press. Particulate phosphorus removal via wetland filtration: An examination of the potential for hypertrophic lake restoration. Environmental Management.
Schneider, R. F., and J. A. Little. 1973. Rise and fall of Lake Apopka: A case study in reservoir mismanagement. Pp. 690-694 in W. C. Ackerman, ed., Man-Made Lakes: Their Problems and Environmental Effects. American Geophysical Union, Washington, D.C.
Rivers
The Atchafalaya Basin
Richard E. Sparks(1)
Introduction
The 217-km Atchafalaya River and its basin comprise North America's largest river overflow swamp (5,700 km(2)), excluding the fresh marshes south of the Gulf Intracoastal Waterway (Glasgow and Noble, 1974) (Figure A.5). The Atchafalaya begins at the confluence of the Red River with a distributary that receives about 30 percent of the flow from the Mississippi River and the Red River. Habitat types range from dry bottomland hardwoods in the Morganza and West Atchafalaya
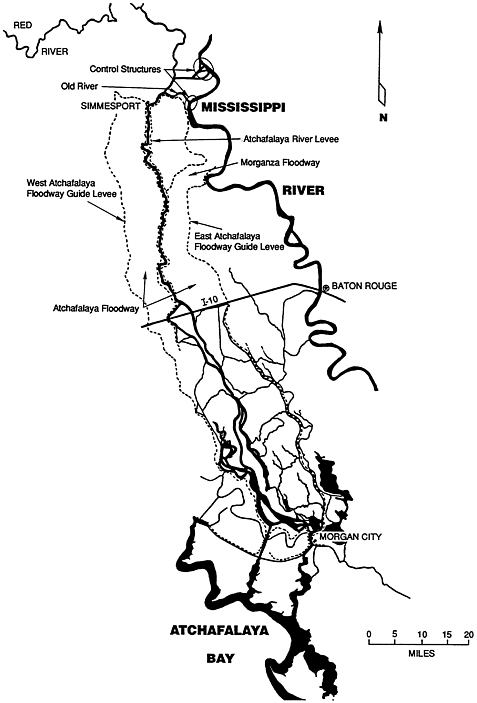
Basin floodways through cypress-tupelo swamps, to fresh and brackish marshes south of Morgan City and in the emerging delta in Atchafalaya Bay. The area is exceedingly rich in fish and wildlife resources. An acre of water can support up to 1,000 pounds of fish. The crawfish harvest averages 15 million pounds per year. Hunters, fishermen, and canoeists use the area extensively for recreational purposes.
The Delta Cycle
The problems of the Atchafalaya Basin can only be understood in the context of the dynamics of the much larger natural system of which it is a part, the Mississippi Delta. The Mississippi River builds, then abandons, deltaic lobes in an orderly cycle: six lobes in the last 8,000 years (Penland and Boyd, 1985). If left to itself, the Mississippi River would have switched most of its water and sediment flow from its present course to the Atchafalaya River, which is 307 km closer to the sea and therefore a much more hydraulically efficient channel (van Heerden and Roberts, 1980). The new Atchafalaya deltaic lobe would be building at a much faster rate than it is, and the old Plaquemines-Balize delta complex south of New Orleans would be regressing due to the combined effects of coastal erosion, sea level rise, and land subsidence as the delta sediments were compressed under their own weight (Penland and Boyd, 1985). Humans have intervened in this natural process of delta switching, thereby forestalling, or at least slowing, some of these events, in an attempt to protect an enormous investment in existing cities, port facilities, and waterways.
Problems
TOO MUCH AND TOO LITTLE WATER
From the point of view of New Orleans' citizens, many of whom live below the mean low-water elevation of the Mississippi River (and are sinking still farther), the dilemma is how to maintain enough flow to keep salt water from intruding on the city's water intakes and sediment from closing their deep-water connection to the sea. The engineering response has been to use both the Atchafalaya and the Bonnet Carre Spillway above New Orleans to divert high flows before they reach the city, and to prevent the switching of the Mississippi into the Atchafalaya by using several dams called the Old River Control Structures. The entire floodway on the Atchafalaya was enclosed
within levees that were set well back from the river channel on the floodplain.
EROSION AND SEDIMENTATION
The ability of the floodway to convey floods was rapidly diminished by sedimention. The U.S. Army Corps of Engineers (COE) responded by increasing the cross-sectional area of the main channel by dredging, although the geologically young river was also naturally enlarging and deepening its channel. Twenty-two distributaries were closed, which accelerated the natural erosive action in sections of the main channel. The dredge spoil was used on the upper 80 km to build mainstem levees set close to the river, which reduce inundation of adjacent floodplains except for record floods. Floodplain sedimentation, leveeing, and channel deepening together caused lakes, bayous, and seasonally flooded forests to dry out.
CONVERSION AND OCCUPATION OF FLOODPLAIN
Most of the bottomland hardwood forest in the lower basin has been cleared and much of the land converted to agriculture in the areas protected by the mainstem leaves. Houses have been constructed within the West Atchafalaya Floodway because no easements were acquired to prevent construction, but such easements are now being purchased in the central and lower portions of the basin. These easements should forestall wholesale clear-cutting and agricultural development (Robert Campos, Project Manager, New Orleans District Office, U.S. Army Corps of Engineers, personal communication, May 7, 1990 to C. Frederick Bryan).
FLOOD PULSE ALTERATION AND BACKWATER STAGNATION
The ongoing natural and engineered enlargement of the main channel apparently will reduce the frequency of flooding in the adjacent swamps from approximately once every 1.5 years to once every 2.3 years (Wells and Demas, 1977), which could reduce fish production by reducing the frequency of access to backwater spawning and nursery areas (Bryan and Sabins, 1979; Fremling et al., 1989). Moderate floods function to purge the back swamps of accumulated organic debris but also bring inorganic sediments that fill back swamps and lakes (Bryan et al., 1974, 1975, 1976). Reduction of flood frequency may increase water stagnation and the potential for fish kills from anoxia (Bryan et al., 1974, 1975; Bryan and Sabins, 1979).
Impact of the National Environmental Policy Act
In 1969, the National Environmental Policy Act (NEPA) became law, and in the early 1970s, the COE started preparing an Environmental Impact Statement (EIS) on its plan to raise the levees and increase flow capacity by enlarging the main channel. The newly emerging environmental community was afraid that the deeper channel would hasten the drying out of the swamp. An agreement was reached between Thomas Kimball of the National Wildlife Federation and General Frederick Clark of the COE that levee raising could continue without an EIS, but that all other work would stop until the EIS was completed. The agreement stated that the COE would involve numerous agencies and individuals in this EIS effort.
The planning group was called the Steering Committee in the early 1970s and later evolved into the Agency Management Group (AMG). By 1981, the draft EIS, with a complex plan, was out for public review. The AMG plan, among other things, involved the purchase of greenbelts along numerous waterways in the basin for both forest preservation and public access.
A Public Relations Failure and a Political Reprieve
Just as the EIS was published, the U.S. Fish and Wildlife Service, also a member of the AMG, made public its own plan to purchase the entire lower basin for the Atchafalaya National Wildlife Refuge. The five public meetings, instead of focusing comments on all facets of the AMG plan, degenerated into protests against the ''land grab." The public meetings were attended by 1,000 people and generated more than 4,000 written responses. Most complained about the proposed refuge or asked that the floodwaters be carried safely past Morgan City.
In 1982, Governor David Treen of Louisiana worked out a compromise plan that appeared in the Final EIS. The Treen plan called for purchase of 50,000 acres in fee for public access and purchase of flood control and environmental easements for over 367,000 acres of the lower basin to prevent construction of permanent houses and clearing for agriculture. The comprehensive plan, authorized in 1982, also included several features that restored wetlands or slowed their rate of degradation. These features are described below.
Inducing Flow, Reducing Sediment
Low "channel-training" banks will reduce the rate at which sediment spills over banks and fills back swamps, although these structures
will also reduce the frequency and duration of flooding. The benefits of retaining the near-annual flood pulse have to be traded against the benefits of reducing the rate of overbank sedimentation in the floodplain and backwaters, because this system is in disequilibrium (due to both natural and man-made causes) and is rapidly aggrading to a new steady state. Another method of extending the life of the swamps is to reduce the amount of riverine bed-load sediment (the heavier sediment skidding along the bottom of the river, rather than in the water column) that enters the major distributaries by realigning the angle at which two major distributaries leave the main channel of the Atchafalaya River, thereby causing the main channel to retain and convey most of its bed load.
The banks will be lowered ("bank shaving") in selected areas to allow headwater flow, but not bed-load sediments, into the swamps and lakes. The openings also provide access to the backwaters for anglers. The combination of these actions does not restore the backwaters, but does slow the rate at which the aquatic habitat of lakes and swamps becomes willow thicket.
Habitat Management Units
If nothing further is done, 125,000 acres of swamp and bottomland hardwoods that flood annually today will no longer flood by the year 2030. The flooded wetlands are vital to the fishery in the basin because they provide feeding, spawning, and hiding areas for fish. As the basin dries out, the fishery will be reduced by 40 percent for both finfish and crawfish (U.S. Army Corps of Engineers, 1982).
In 1990, COE and the U.S. Fish and Wildlife Service updated earlier plans to modify management units in 11 hydrologically distinct areas within the Atchafalaya floodway. In the Buffalo Cove Management Unit, the existing canal system admits large amounts of sediment during floods, but during low summer flows the spoil banks of the canal prevent water circulation, thus causing anoxic conditions and excessive water temperature (more than 100 °F). Plans are to plug one of the canal entrances to reduce sediment loading, but also to breach the spoil banks in several upstream locations to increase water flow through the entire unit, thereby reducing or eliminating stagnant areas. Downstream weirs will be set at levels to preserve the historical flooding regime and still keep water moving. Water may be kept on bottomland hardwoods about 2 weeks longer than now, which will probably slow the growth of ground cover, but increase timber growth and mast (the fruit of oak, pecan, and other trees used by wildlife) production. Similar concepts and techniques
will be applied to Sherburne Wildlife Management Area and the Atchafalaya National Wildlife Refuge, where river leeves keep floodwater from inundating and nourishing approximately 5,000 acres of bottomland forest. The management units can slow the rate of change, but not arrest or reverse it: the most realistic estimates are that the crawfish harvest, for example, will still drop by 28 percent by 2030 (U.S. Army Corps of Engineers, 1982).
Marsh Formation
The Corps of Engineers maintains a navigation channel through the new delta that is forming in Atchafalaya Bay. New procedures have been adopted to reduce the negative effects of the dredging that is required to maintain the channel. Instead of being piled into relatively high banks, the dredged spoil material is placed either in a distributary where currents carry it off to form new marsh, or at a height such that when it settles and compacts, it will be at the same height as the adjacent marshes. Marsh vegetation covers the spoil within one growing season, and the plant biomass, species diversity, and nursery function generally are the same as in the naturally formed marsh.
Summary
The Atchafalaya is an example of a fluvial system in disequilibrium from both natural and man-made causes. The Mississippi River is at a critical juncture in the natural delta switching cycle: if left alone, it would rapidly shift its flow of sediment and water to its Atchafalaya distributary, which provides a shorter and hydraulically more efficient route to the sea than does the present main channel past New Orleans. As a result, the Atchafalaya is enlarging its channel, filling its existing floodplain and backwaters with sediment, and building a new delta at the downstream end. The rate of sedimentation probably has been accelerated by floodway leeves, which constrict the floodplain and tend to concentrate sedimentation on the remaining floodplain. Man-made canals can introduce sediments from the main channel into biologically productive backwaters, thereby filling them. The spoil banks associated with the canals prevent circulation of water and cause stagnation during low-flow periods. If left alone, the existing vegetative zones probably would migrate downstream over a period of decades to centuries due to the death of salt-and flood-tolerant species and their replacement by species adapted to fresh water or drier soil. Because the boundaries of refuges, nature preserves,
and fish and wildlife management areas are fixed, a refuge that was originally an estuarine, intertidal wetland could in time become a forested wetland of the Atchafalaya River. The refuge would have to migrate downstream, keeping pace with the advancing delta, if it were to remain an intertidal wetland.
The existing and planned channel-training works, bank shaving or breaching, and wetland management units, where the inflow and outflow of water are controlled, are attempts to slow this process and are not really restoration. Instead of merely slowing the inevitable, additional attention ought to be directed to the natural reclamation or creation of wetlands from the sea that is now being performed by the river. For example, the COE is already employing a dredged material placement technique that augments, rather than disrupts, the natural formation of new marsh. Perhaps a decision could be made now that substantial portions of the new lands will be managed as natural areas or refuges, because virtually all of the existing Atchafalaya Delta is already a state wildlife management area, and the new land out to the 3-mile state limit will be too prone to flooding to be of use for development. The Atchafalaya Basin offers an opportunity to develop and test management concepts and techniques that are as dynamic as the system; habitats could be conserved as they are formed. In this case, restoration involves allowing spatial scope for a dynamic equilibrium to occur, where delta regression in one location is balanced by delta expansion in another.
References
Bryan, C. F., and D. S. Sabins. 1979. Management implications in water quality and fish standing stock information in the Atchafalaya River Basin, Louisiana. Pp. 293–316 in J. W. Day, Jr., et al., eds., Third Coastal Marsh and Estuary Management Symposium for Louisiana State University Press, Baton Rouge, La.
Bryan, C. F., F. M. Truesdale, D. S. Sabins, and C. R. Demas. 1974. A Limnological Survey of the Atchafalaya Basin. First Annual Report. U.S. Fish and Wildlife Service, U.S. Department of the Interior. 208 pp. and annotated bibliography.
Bryan, C. F., F. M. Truesdale, D. S. Sabins. 1975. A Limnological Survey of the Atchafalaya Basin. Second Annual Report. U.S. Fish and Wildlife Service, U.S. Department of the Interior. 203 pp. and appendix.
Bryan, C. F., D. J. DeMont, D. S. Sabins, and J. P. Newman, Jr. 1976. A Limnological Survey of the Atchafalaya Basin. Third Annual Report. Louisiana Cooperative Fisheries and Resources Unit, U.S. Fish and Wildlife Service. 285 pp.
Fremling, C. R., J. L. Rasmussen, R. E. Sparks, S. P. Cobb, C. F. Bryan, and T. O. Claflin. 1989. Mississippi River fisheries: A case history. Pp. 309–351 in D. P. Dodge, ed., Proceedings of the International Large River Symposium. Canadian Special Publication Fisheries and Aquatic Sciences 106.
Glasgow, L. L., and R. E. Noble. 1974. The Atchafalaya Basin. School of Forestry and Wildlife Management, Louisiana State University, Baton Rouge, La. 12 pp.
Penland, S., and R. Boyd, eds. 1985. Transgressive Depositional Environments of the Mississippi River Delta Plain: A Guide to the Barrier Islands, Beaches, and Shoals in Louisiana. Guidebook Series No. 3. Louisiana Geological Survey, B, Baton Rouge, La. 233 pp.
Sager, D. R., and C. F. Bryan. 1981. Temporal and spatial distribution of phytoplankton in the lower Atchafalaya River Basin, Louisiana. Pp. 91–101 in L. A. Krumholz, C. F. Bryan, G. E. Hall, and G. T. Pardue, eds., The Warmwater Streams Symposium. American Fisheries Society, Bethesda, Md.
U.S. Army Corps of Engineers, New Orleans District. 1982. Atchafalaya Basin Floodway System Louisiana, Environmental Impact Statement. Vol. 3, Appendix G. 250 pp.
van Heerden, I. L., and H. H. Roberts. 1980. The Atchafalaya delta—Louisiana's new prograding coast. Trans. Gulf Coast Assoc. Geol. Soc. 30:497–506.
Wells, F. C., and C. R. Demas. 1977. Hydrology and water quality of the Atchafalaya River Basin. Technical Report No. 14. Louisiana Department of Transportation and Development, Office of Public Works. 53 pp.
THE UPPER MISSISSIPPI RIVER
Richard Sparks
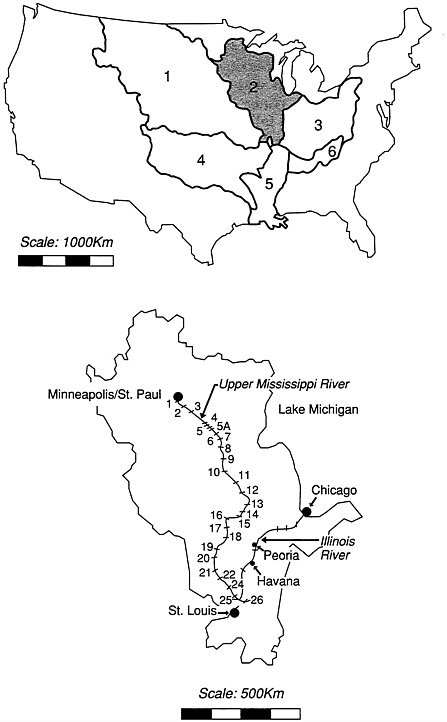
The Upper Mississippi River (Figure A.6) is a 1,300-mile navigation system maintained by the U.S. Army Corps of Engineers (COE), but it is also a national fish and wildlife refuge system, totaling 280,000 acres arranged like a corridor, maintained by the U.S. Fish and Wildlife Service (Upper Mississippi River Basin Association, n.d). The Izaak Walton League was largely responsible for persuading Congress to create the refuge in 1924 (Scarpino, 1985) and played a major role again in 1974, when it joined with the Sierra Club and 21 western railroad companies to file a lawsuit to prevent COE from constructing a new dam and set of locks (Locks and Dam 26) near St. Louis, Missouri (Upper Mississippi River Basin Commission, 1981). The plaintiffs argued that the new locks had not been duly authorized by Congress and that more information was needed on the effects on railroads and on the rivers of spending $1 billion (in 1991 dollars) to quadruple lock volume and thereby increase barge traffic on the entire upper river. The U.S. District Court ordered COE to obtain the consent of Congress, as well as more information on environmental and economic impacts. After considering the additional reports, Congress authorized construction of a new dam and single lock, imposed a fuel tax for the first time on commercial navigation, and created a trust fund to use the revenues. Congress also ordered that no further expansion of the navigation capacity of the system occur until a Master Management Plan for the river was prepared by
the Upper Mississippi River Basin Commission (Inland Waterways Authorization Act of 1978, P.L. 95-502). The plan was submitted to Congress on January 1, 1982, and with some modifications ultimately became the Environmental Management Program for the Upper Mississippi River System that was authorized as Public Law 99-88 in 1985 and as part of the Water Resources Development Act of 1986 (P.L. 99-662). Most of the following description of the program was taken from the Fifth Annual Addendum to the program (U.S. Army Corps of Engineers, 1990), except where noted otherwise.
Funding
Approximately 97 percent of the $200 million authorized for the Environmental Management Program for 1986 to 1996 is for habitat restoration ($124.6 million) and long-term resource monitoring ($61.1 million). Although the program has yet to be funded at its fully authorized level of $20 million per year, the funding levels have increased steadily from $0.8 million in 1986 to approximately $15 million in 1990 and 1991, and authorization has been extended 2 years, to 1998. The five states bordering the Upper Mississippi River collectively have contributed $3 million during the first 4 years, or approximately 18.4 percent of the federal funding.
As of May 1990, 5 habitat projects had been completed, another 35 were under way, and a total of 54 had been scheduled out of several hundred that were submitted by the U.S. Fish and Wildlife Service and the five states bordering the Upper Mississippi River. Although the master plan recognized that sediment loading from tributaries created major problems in the mainstream rivers and recommended that the already well-established programs for soil erosion control be accelerated, the Environmental Management Program focuses on restoration projects located within the floodplain of the mainstem rivers where there was no preexisting program (Upper Mississippi Basin Commission, 1981; U.S. Army Corps of Engineers, 1990). Funding for the Environmental Management Program comes entirely from the general revenues of the United States, not from the fuel tax on commercial navigation that goes into the Inland Waterways Trust Fund (IWTF). The 11-member board which oversees the Trust Fund is selected by the Secretary of the Army from shippers and carriers who use the inland waterways. There is general agreement that the Fund can be used for new construction and rehabilitation of the inland navigation system but not for operation and maintenance, although there is no agreed-upon definition of what distinguishes rehabilitation from maintenance. The sections of the public law that
establish the Trust Fund (P.L. 99-662, the Water Resources Development Act of 1986) do not address environmental restoration. It is clear that rehabilitation does not include environmental restoration, because Public Law 99-662, the Water Resource Development Act of 1986, Sections 1404 and 1405, specifically excludes use of the Trust Fund for the Environmental Management Program.
As of March 15, 1991, 6 habitat projects had been completed, 6 were under construction, and 41 were in various stages of design and review, out of several hundred that were submitted by the U.S. Fish and Wildlife Service, and the five states bordering the Upper Mississippi River. Proposed projects are evaluated and prioritized by a panel of biologists from state and federal agencies, and are then screened by the Corps of Engineers for program eligibility and engineering feasibility. Projects on lands managed as federal refuges are 100 percent federally funded for construction and 75 percent federally funded for operation and maintenance. Lands managed by states or as part of federal navigation projects are 75 percent federally funded for both construction and maintenance. The majority of the projects redress sedimentation problems in side channels and backwaters, through a combination of dredging and alteration of flow patterns by channel structures, construction of enclosed levee systems with pumps for water level control, or construction of island breakwaters.
Monitoring
The projects include funds for monitoring for 1 to 2 years before construction and 2 to 5 years after completion. A longer time series of preconstruction data is often available from the management agency that originally proposed the project. The Upper Mississippi River includes three COE districts (St. Paul, Rock Island, and St. Louis), in two divisions (North Central and Lower Mississippi), and each district has its own monitoring plan, although a basic list of 17 physical-chemical factors is used by both St. Louis and Rock Island. Periodic hydrographic surveys will determine the longevity of the projects by measuring the rate of sedimentation. Populations of the animals or plants expected to benefit from the projects will also be monitored.
While site-specific effects of the restoration projects are being monitored, the separate Long-Term Resource Monitoring (LTRM) subprogram addresses data gaps identified in the original lawsuit: (1) lack of information on long-term trends in the Illinois and Upper Mississippi rivers, and (2) incomplete knowledge of the factors affecting fish and wildlife populations, including the impacts of navigation. The first of three elements in LTRM is long-term monitoring
conducted on six study reaches spaced along the two rivers. Field stations on each reach are operated by the state natural resource agencies with federal funds and supervision provided by the U.S. Fish and Wildlife Service and the COE. Results from the study reaches are expected to document broad upstream-downstream and year-to-year trends in water quality, fish and invertebrate populations, and vegetation. The second program element uses short-term (1 to 3 years) experimental studies to determine what factors regulate or limit populations of key organisms. The third element is a Computerized River Information Center (CRIC) at Onalaska, Wisconsin, that maintains and analyzes long-term monitoring data as well as data provided by other agencies and programs, and supports data management at the field stations (U.S. FWS, 1988, 1989).
Evaluation
There have been problems in evaluating both the restoration proposals and the completed projects. One problem is quantification of expected benefits for purposes of selecting among competing proposals or among design alternatives within proposals. A habitat unit method for incremental analysis was first used in 1990 and will probably supplement, but not entirely replace, professional judgment. The method determines how many habitat units are gained by each increment in project cost. An example of a habitat unit might be the feeding area required to support a duck for a typical feeding period during its fall migration. Problems include the lack of quantitative data on habitat requirements of some species and the difficulty of defining optimum habitat for multiple species (although this limitation might be overcome by a guild approach; e.g., optimize for dabbling ducks rather than just mallards). The U.S. Army Corps of Engineers (1990) found that the cost of developing appropriate habitat models for diving ducks was $100,000, and application of the method to one proposal cost $4,000 but resulted in an estimated cost savings of $200,000 through elimination of a sediment-deflection dike that only marginally increased the number of habitat units. The validity of the habitat unit/incremental analysis method will be checked by the monitoring data collected after the projects are completed.
Criteria for Selecting Sites
A broader benefit/cost problem is whether restoration should be concentrated on areas that are least degraded or most degraded. More
projects probably could be done, and the success rate might be higher, if resources were concentrated on the less degraded areas. However, this approach would favor the northernmost states on the Upper Mississippi River, where backwaters are relatively less degraded because sediment loading and boat traffic are not as heavy, and would not help the areas most in need of restoration (see Illinois River case study, below). The actual approach has been to strive for a reasonably even geographic distribution, although this approach has its difficulties because federal lands are concentrated along thenorthern portions of the river system, and COE lacks the authority to acquire lands for restoration, even if there are willing sellers (again see Illinois River case study).
Effectiveness
Although it is too early to judge whether the restorations undertaken under the Environmental Management Program are successful in ecological terms, the program has been successful in mobilizing federal and state resources in a coordinated approach to restoration. The program is important because it is among the first in the nation to address conflicting federal mandates for large interstate rivers and to redress habitat degradation caused by alterations within the rivers and their drainage basins. Programs based on this model are being proposed for other large rivers in the United States (Raymond Hubley, U.S. Fish and Wildlife Service, La Crosse, Wisconsin, personal communication, January 8, 1991). Finally, what may be most encouraging to citizens concerned about restoration of rivers is that these programs grew out of concerns first raised at the local level by chapters of national conservation organizations.
References
Scarpino, P. V. 1985. Great River. An Environmental History of the Upper Mississippi, 1890–1950. University of Missouri Press, Columbia, Mo. 219 pp.
U.S. Army Corps of Engineers. 1990. Upper Mississippi River System Environmental Management Program. Fifth Annual Addendum. U.S. Army Corps of Engineers, North Central Division. 221 pp.
U.S. Fish and Wildlife Service (FWS). 1988. 1985 National Survey of Fishing, Hunting, and Wildlife-Associated Recreation. Washington, D.C. 167 pp.
U.S. Fish and Wildlife Service (FWS). 1989. Long Term Resource Monitoring Program for the Upper Mississippi River System—First Annual Report. U.S. Fish and Wildlife Service, Environmental Management Technical Center, Onalaska, Wis. 125 pp.
Upper Mississippi River Basin Association. n.d. The Upper Mississippi River System Environmental Management Program. Upper Mississippi River Basin Association, St. Paul, Minn. 8 pp.
Upper Mississippi River Basin Commission. 1981. Comprehensive Master Plan for the Management of the Upper Mississippi River System. Upper Mississippi River Basin Commission, Minneapolis, Minn, 181 pp.
Water Resources Development Act of 1986. P.L. 99-662, Nov. 17, 1985, 100 Stat. 4082.
THE ILLINOIS RIVER–FLOODPLAIN ECOSYSTEM
Richard Sparks
Introduction
The history of change in the Illinois River is unusually well documented because scientific studies began in 1874 (Calkins, 1874; Forbes, 1878; Hart, 1895; Kofoid, 1903; Baker, 1906; Forbes and Richardson, 1908, 1913, 1919; and, subsequently, many others). This history provides examples of (1) the effects of an attempt to restore one ecosystem (Lake Michigan) by transferring a pollution problem to another ecosystem (the Illinois River), (2) partial success in subsequent efforts to restore water quality in the river, (3) exceeding the limits of ecosystem resistance to increased sediment loading from nonpoint sources, (4) ongoing efforts to restore multiple functions of the river-floodplain ecosystem, and (5) constraints on these efforts.
General Characteristics
HYDROLOGY
The Illinois River drains approximately 29,010 square miles (or 18.5 million acres) in three states (85.5 percent of the drainage is in Illinois, 11.0 percent in Indiana, and 3.5 percent in Wisconsin) (Neely and Heister, 1987) (see Figure A.6). The upper Illinois River was connected to Lake Michigan as early as 1848 by the Illinois and Michigan Canal, but the major link, the Chicago Sanitary and Ship Canal, opened in 1900, and the total distance from Chicago to the confluence with the Mississippi just above St. Louis is now 327 miles (Injerd, 1987; Neely and Heister, 1987). The average discharge measured 71 miles upstream of the confluence is 21,895 ft 3/s for the 51-year period of record and includes approximately 3.200 ft3/s released from Lake Michigan (Sullivan et al., 1990). The maximum recorded discharge of 123,000 ft3/s occured in May 1943, and the minimum of 1,330 ft 3/s in September 1984 (Sullivan et al., 1990).
The lower 200 miles of river was unusually productive of fish and wildlife because it is a river-floodplain ecosystem flanked by extensive
backwaters, floodplains (ranging from 2 to 12 miles in total width and totaling approximately 400,000 acres), and floodplain lakes, and lies on the Mississippi flyway for migratory waterfowl (Mills et al., 1966). The typical spring flood provides access to spawning areas for fish and to feeding areas for both fish and waterfowl. The flood is protracted because the capacity of the floodplain is large in relation to the flow of the river, and the gradient is very shallow: the rate of fall in the lower 371 km (223 miles) is only 2 cm/km (approximately 0.1 ft per mile) (Mills et al., 1966). Two natural mainstem lakes, the upper and lower Peoria lakes, occured where the river was partially dammed by alluvial deposits from tributaries. Four dams downstream of the Chicago waterways maintain 9-ft minimum depths for navigation (Sparks, 1984).
BIOLOGICAL PRODUCTIVITY
In 1908, a 200-mile reach of the Illinois River produced 10 percent of the total U.S. catch of freshwater fish—more than any other river in North America (excluding rivers with anadromous fish, such as the Columbia). More than 2,000 commercial fishermen were employed on the river (U.S. Department of Commerce and Labor, 1911) and the commercial yield was 24 million pounds annually, or about 178 pounds per acre of permanent water (Lubinski et al., 1981). By the 1950s the yield had dropped to 38 pounds per acre; since the 1970s the yield has been a low 4 pounds per acre, totaling only 0.32 percent of the total U.S. freshwater harvest (Sparks, 1984). Similar downward trends were recorded over the same period for other indicators of biological productivity: waterfowl and sport fish populations (Bellrose et al., 1979; Sparks, 1977).
The declines are attributable to two major man-made changes: diversion of Chicago's pollution from Lake Michigan to the river, and intensification of agriculture in the upland drainage and floodplain.
Transferring Pollution from Lake Michigan to the Illinois River
In 1854 and 1885 major rainstorms caused untreated sewage to be carried into Lake Michigan, where it entered water intakes and caused outbreaks of cholera and typhoid (Injerd, 1987). In response to these epidemics, the flow of the Chicago and Calumet rivers was reversed, and sewage and Lake Michigan water were conveyed away from the lake and into the Illinois River via the Sanitary and Ship Canal, starting in 1900 (Injerd, 1987).
From 1900 to 1910 the organic loads from Chicago exerted their oxygen demand in the upper Illinois River and fertilized the middle and lower reaches (Palmer, 1903). The peak yield of commercial fish from the Illinois River occurred in 1908, not only because the nutrient loading and therefore the overall productivity of the river increased, but also because the diversion raised the minimum water levels in the river and its backwaters, thereby increasing the amount of aquatic habitat (Sparks, 1984). After 1910, however, the increasing pollution load from Chicago caused critically low oxygen levels in the water and putrescent conditions in the bottom sediments to progress further downriver each year. Forbes and Richardson (1919) and Richardson (1928) documented the alteration and destruction of the bottom fauna by this wave of pollution. They also reported that beds of aquatic plants, which once covered up to 50 percent of the total surface of the bottomland lakes, had disappeared by 1920. Fish populations declined because of the direct effects of low oxygen and loss of food, and habitat alteration produced by the die-off of aquatic plants (Sparks, 1984).
Restoration of Water Quality in the Illinois River
In the late 1920s and early 1930s, most of the larger cities along the Illinois River constructed sewage treatment plants; and so dissolved oxygen levels improved, and aquatic plants and fish populations recovered (Starrett, 1972). From the 1940s to the 1970s, municipal waste treatment capacity and technology did not always keep up with population growth: low oxygen levels occurred in both upper and middle reaches of the river in the mid-1960s, for example (Mills et al., 1966; Starrett, 1971).
IMPACT OF THE FEDERAL CLEAN WATER ACT
Since the enactment of the federal water pollution control acts, including the Clean Water Act of 1977 (P.L. 95-217), there has been an infusion of federal funds to help upgrade sewage plants. Between 1965 and 1975, approximately $4 billion in federal and local funds were spent on waste treatment by municipalities in the Illinois drainage basin (Briceland, 1976). In the Chicago area alone, a program to capture and treat combined sewer overflows (the Chicago Tunnel and Reservoir Plan, or TARP) will cost $3.8 billion if fully funded and completed in the 1990s (Lanyon and Lue-Hing, 1987). The combined sewer overflows constitute the largest remaining organic loading in the Chicago area that is untreated: the waterway absorbs
the equivalent of raw waste from one million people per day (Lanyon and Lue-Hing, 1987). The first phase of TARP is partly complete and will reduce this load by approximately 85 percent, as well as reducing floodwater damage by 10 to 15 percent (Lanyon and Lue-Hing, 1987). Upon completion in the 1990s, TARP will reduce the organic loading by 99.8 percent and flood damage costs by 65 percent (Lanyon and Lue-Hing, 1987).
MONITORING AND EVALUATION OF SUCCESS
Water quality in the Illinois River has improved, according to the latest biennial report filed by the Illinois Environmental Protection Agency under the requirements of Section 305(b) of the federal Clean Water Act (Illinois Environmental Protection Agency, 1990). This assessment is based on a water quality index (WQI), a macroinvertebrate biotic index (MBI), and a trend analysis of physical-chemical factors. The WQI compares six factors (temperature, dissolved oxygen, pH, total phosphorus, turbidity in nephelometric turbidity units (NTUs), and conductivity) with Illinois water quality criteria for general use. If no state criteria are available the U.S. Environmental Protection Agency (EPA) criteria for warm-water fish are used. These subindices of departure from criteria are then summed to provide an overall index. The six factors were selected because they showed the greatest degree of correlation with the MBI of all combinations of factors monitored in the Illinois Ambient Water Quality Monitoring Network (Kelly and Hite, 1984). The MBI assesses the numbers of pollution-tolerant and pollution-intolerant macroinvertebrates that colonize artificial substrates (Hester-Dendy samplers) suspended in the water column. Seven of the eight water quality monitoring stations on the mainstem Illinois River showed improved WQIs when the period from 1985 to 1989 was compared with that from 1979 to 1984. The trend analysis was conducted in cooperation with the U.S. Geological Survey (USGS) on the most recent 12 years of data available from 10 stations on the mainstem Illinois River. The seasonal Kendall test, which is intended for monthly water quality time series with potentially large seasonal variability (Smith et al., 1987), was used both on flow-adjusted concentrations and on unadjusted concentrations. Factors that showed no trends at any of the stations included two used in the WQI: turbidity and total phosphorus. Conductivity, ammonia, total suspended solids, chemical oxygen demand (COD), and five other factors showed improvements at several stations, and only one factor, sodium, showed a worsening trend (higher concentrations in more recent samples). Another state agency, the
Illinois Department of Conservation, credits improved water quality for partial restoration of gamefish populations in the upper 100 miles of the river, including the appearance of a sauger Stizostedion canadense (Smith) population that has supported a nationally ranked annual fishing tournament (Conlin, 1987).
Although restoration of water quality is often a necessary component of river and stream restoration, improving water quality alone may not be sufficient to restore streams and rivers, as described next in the case of the Illinois River.
Stress Thresholds: Sedimentation in the Illinois River
Some ecosystems have a degree of biotic control or compensation that may mask a gradual, detrimental change in some physical-chemical factor until a threshold is reached. Once the threshold has been crossed, the ecosystem may degrade rapidly into a stable condition that is very difficult to restore to its previous condition. In the Illinois River, clear vegetated backwaters and lakes became excessively turbid, barren areas, and gamefish and duck populations declined drastically from 1958 to 1961 in what was formerly the most biologically productive reach of the river: the lower 321 km (200 miles) (Bellrose et al., 1979). These degraded conditions persist to this day and are the subject of restoration efforts ranging from the scale of the entire drainage basin to experimental plots a few meters square.
INCREASED SEDIMENT LOADING
The changes in biological productivity were associated with, and are probably attributable to, increases in sediment loading and sediment resuspension in the Illinois River (Bellrose et al., 1979). Sediment loading increased because of land use changes in the drainage basin and floodplain. Cropland accounts for 70.4 percent of the land area of Illinois, and so changes in farming practices have a major impact on streams and rivers (Herman, 1987). In the Illinois River basin, row cropland increased about 67 percent between 1945 and 1986, at the expense of pasture, forage, and small grains, which better protect the soil from erosion (Bellrose et al., 1979). As farms became larger and more specialized in row crops, fences and fence rows were taken out (Illinois Environmental Protection Agency, 1979). The size of farm machinery also increased, making it more difficult to do contour farming, and many contours and old terraces were removed (Illinois Environmental Protection Agency, 1979). The common practice of plowing fields soon after harvest in the fall leaves land
susceptible to erosion for almost two-thirds of the year, including the period of heaviest rainfall in the early spring (Havera and Bellrose, 1985).
Stream modifications undertaken by farmers also contributed to sediment loading. Farmers channelize streams to improve drainage so that they can get on the fields earlier in the year and to straighten field borders to make it easier to use large equipment. Channelization shortens the stream length and thereby increases the slope. The water moves at greater velocity, gains erosive power, and tends to erode its bank and bed. Leedy (1979) estimated that more than 50 percent of the annual sediment yield of Illinois streams comes from bank and bed erosion. Because the rate of fall of the tributaries is approximately a foot per mile, they deliver most of their sediments to the Illinois River, where it settles out because the mainstem falls at only one-tenth of a foot per mile (Mills et al., 1966). Channelization extended to the marshy or forested deltas where tributaries enter the Illinois River, so these areas no longer trap sediments before they enter the river (Roseboom et al., 1989). Finally, approximately half the floodplain of the Illinois River was drained and leveed for agriculture (Bellrose et al., 1983; Thompson, 1989), so that sedimentation was concentrated in the remaining overflow areas, lakes, and backwaters.
The end result of these changes was an increasing sediment loading on the river, evidenced by sedimentation rates in a mainstem lake (Peoria Lake) that were twice as high in 1965 to 1985 (1.44 percent of the lake volume is lost per year) as in 1903 to 1965 (Demissie, 1989). Of an estimated 27.5 million tons of sediment delivered to the Illinois mainstem annually, approximately 12.1 million tons are delivered to the confluence with the Mississippi: the remaining 15.4 million tons are deposited in the remaining unleveed floodplain and backwaters (Lee, 1989). If this amount were spread evenly over the remaining floodplain, it would aggrade at the rate of 0.19 inch per year (Lee, 1989).
RESUSPENSION AND TRANSLOCATION
Once the sediment is in the river and backwaters it is resuspended by boat-and wind-driven waves and currents. The fine-grained sediments take 7 to 12 days to settle out, following a windstorm (Stall and Melsted, 1951). Because the average recurrence interval of moderate to strong winds in Illinois is less than 7 days, the river and its backwaters tend to remain turbid (Jackson and Starrett, 1959). Commercial and recreational boats not only cause bank erosion, but also resuspend and relocate sediments (Bhowmik and Schicht, 1980). By using infrared photography, Karaki and van Hoften (1974) showed
that commercial tow boats on the Illinois River generate turbidity trails 1.6 km in length, some of which enter backwaters adjacent to the river. Sparks et al. (1980) reported that barge traffic in the Illinois River increased suspended solids by 30 to 40 percent. Simons et al. (1981) used simulation models to project that sediment volumes entering a backwater along the lower Illinois River will increase 46.8 percent by the year 2000, if the tow traffic increases as predicted.
THRESHOLD EFFECT
Although the sediment loading undoubtedly increased gradually, the major biotic changes occurred rather suddenly, probably because rooted aquatic vegetation helped control turbidity (Jackson and Starrett, 1959) until an effect threshold was exceeded. Rooted plants promote settling and reduce sediment resuspension in the following ways: the roots of aquatic plants anchor the bottom against disturbance by waves and bottom-feeding fish, the stems slow currents and cause sediment to drop out, and the leaves dampen wave action. Sparks et al. (1990) described the probable sequence of events in the Illinois River from 1955 to 1960: increasing turbidity reduced light penetration and photosynthesis that, in turn, weakened or killed submerged aquatic plants growing in the deepest parts of the shallow backwaters. With wave action undampened, larger waves resuspend more sediment and uproot more plants, further increasing turbidity. This positive feedback caused rapid degradation of the remaining plant beds. A vegetation survey by Havera et al. (1980) in 1978 showed that submergent plants and all but one species of floating aquatic plant had been virtually eliminated from the lower 200 miles of the Illinois River and its connecting backwaters.
SECONDARY EFFECTS
The secondary effects of the loss of aquatic plants have been dramatic. Waterfowl usage of the Illinois River has declined because of the loss of plants and plant-associated invertebrates that waterfowl fed upon (Havera and Bellrose, 1985). Fish populations have declined, and dominance has shifted from sight predators and nest builders to species that can locate their food by scent and scatter their eggs on silty substrates (Sparks, 1975). Rooted aquatic plants take up ammonia as a nutrient, and loss of the plants may explain the buildup of toxic ammonia in the sediments, which appears to be limiting benthic macroinvertebrates and possibly fish (Ross et al., 1989; Ruelle and Grettenberger, 1991).
Restoration of the submersed aquatic vegetation in the Illinois River is key to restoration of the other functional parts of the system, and control of sediment introduction and resuspension is necessary for revegetation. The institutional and technical approaches to these objectives are described below.
Public Recognition of the Need for a Comprehensive Restoration Program
In 1987, approximately 200 people representing private citizens, conservation and environmental organizations, elected officials, university faculty, and federal, state, and local governmental agencies met on the Illinois River at Peoria to define management problems relating to the river and to identify ways to solve the problems (Mathis and Stout, 1987). The meeting had been instigated by 34 organizations, most of which were concerned with the deterioration of the river and its lakes in the vicinity of Peoria. The meeting was coordinated by the Water Resources Center at the University of Illinois and organized in a format to invite exchange of information, discussion, and suggestions. Participants agreed that the river needed to be managed as a system and that soil erosion and sedimentation were major problems affecting functions of the river, including recreational use, fish and wildlife production, and flood conveyance. Secondary problems included (1) lack of a comprehensive management plan for the Illinois River system; (2) lack of coordination among local, state, and federal agencies; (3) loss of wetlands and wildlife habitat along the river; (4) lack of a central organization to deal with the entire watershed; and (5) a general apathy toward the Illinois River basin on the part of state officials and the general public.
Institutional Responsibilities and Actions
LOCAL
Several technical and lobbying groups organized during and after the conference to help promote the recommendations. The Illinois River Coalition/Father Marquette Compact was organized by citizens from five river counties to build a regional consensus and tap governmental resources for river restoration. The Heartland Water Resources Council focuses on managing and restoring the river and its lakes around Peoria. The Illinois River Soil and Water Conservation Task Force, which was formed in 1985, received a public relations boost for its programs as a result of the conference. The Soil
and Water Conservation Task Force is made up of the elected directors of seven Soil and Water Conservation Districts along the Illinois River, as well as advisors from industry, state and federal agencies, and conservation organizations. The districts work together to accelerate and implement conservation practices in the Illinois River watershed. The task force supports traditional erosion control practices such as conservation tillage and terraces, as well as low-cost stream-bank and ravine stabilization practices. Many of the latter projects require extensive hand labor, which has been obtained through the Public Aid Program, Project Chance. As a side benefit, 20 out of the 50 Project Chance workers subsequently used the training they received and recommendations from their supervisors to obtain permanent jobs. The Soil and Water Conservation Task Force has received grants and equipment from the Caterpillar Tractor Co. and funding from the Illinois Department of Energy and Natural Resources. The Illinois State Water Survey monitors several of the projects.
STATE AND FEDERAL
At the request of the governor of Illinois, the Illinois State Water Plan Task Force reviewed the proceedings of the 1987 meeting and developed an action plan for state agency response. State agencies are now working with local groups and federal agencies on implementation of the plan, and progress is being monitored by the Water Plan Task Force (Vonnahme, 1989). Specific actions include (1) development of hydraulic simulation models and sediment transport models to evaluate the effects of management alternatives; (2) improved data collection, including hydrographic surveys, water quality monitoring, and sediment source identification; (3) installation of streambed and bank erosion controls on four of the tributaries that contribute the most sediment to the Illinois River above Peoria; (4) experimental rehabilitation of selected backwater areas; (5) nonstructural flood mitigation plans tailored for specific communities along the river (the plans are designed to reduce the $25 million average annual cost of Illinois River flooding [Wetmore, 1987] and include relocation of flood-prone structures, and public acquisition of flood-prone land and conversion to community parks and open areas); and (6) improvement of public access points and state parks along the river.
Approach To Restoration
The planned restoration is comprehensive: restoration techniques are being applied to the upland erosion sites and the tributaries to
reduce sediment loading of the river; revegetation experiments have been conducted in selected backwaters of the main river; and plans are being made for large-scale projects involving dredging of deposited sediments and creation of island wave barriers. The techniques are described below, grouped according to where in the basin they are applied: uplands; tributary channels; or mainstem river and backwaters, or floodplain lakes.
TECHNIQUES: UPLANDS
Much of the restoration effort has been focused on the two mainstem lakes at Peoria. Together they total 4,784 surface hectares (8,033 acres) and have been characterized as the most important recreational lakes in central Illinois, because the Peoria-Pekin population center straddles them (Bellrose et al., 1983). Of the sediment in the lakes, 40 percent originates from just 3 percent of the upstream drainage area, and erosion control and sediment trapping techniques have focused on the problem tributaries (Semonin, 1989).
The Illinois River Soil Conservation Task Force accelerated existing state and federal programs that reduce erosion from row crop fields on a cost-share basis with farmers, using $85,000 per year provided by the Illinois Department of Conservation. These include well-established practices such as conservation tillage and grass waterways administered by the local Soil Conservation Service offices and the Agricultural Stabilization and Conservation Committees, and are not discussed further here.
TECHNIQUES: TRIBUTARY CHANNELS
Within problem tributaries, reaches contributing the greatest amounts of sediment are restored first. These are typically massive streambank or gully erosion sites (Condit, 1989). Selection of techniques was based on an experimental, long-term study conducted by the Illinois State Water Survey and the Illinois Department of Conservation on a tributary to the Illinois River, Spoon River, and one of its tributaries, Court Creek (Roseboom and White, 1990).
Tree cuttings are used at all of the sites on the three tributaries to establish vegetative cover and stabilize the banks (Condit, 1989). Most of the sites also use tree revetments cut from adjacent woods and anchored at the toe of the banks with Laconia earth anchors and cables. One of the sites uses a gabion basket structure filled with broken concrete (Condit, 1989).
Although all of the sites incorporate some experimentation (selection
of tree species used for cuttings, alternative methods of inserting the cuttings in the bank), formal trials were designed by the Soil Conservation Service only for the most diverse site, where monitoring is being done by the Illinois State Water Survey (Condit, 1989).
TECHNIQUES: MAINSTEM RIVERS AND LAKES, BACKWATERS, AND FLOODPLAIN LAKES
Even if the sediment loading of the Illinois River is drastically reduced by the measures employed on the upland fields and in the tributary channels, the lakes and backwaters of the river will remain degraded by the sediments already deposited there, which are endlessly resuspended by wind-and boat-driven waves. The feasibility of restoring submersed aquatic plants under existing conditions was investigated in several field experiments. Based on these experiments, earlier projects on the Upper Mississippi River, and standard waterfowl management practices, nine major rehabilitation projects have been proposed for the lower 200 miles of the Illinois River. The field experiments are described below, and the design features of the major projects are discussed briefly.
Revegetation Experiments
Revegetation experiments were conducted with waterfowl food plants, duck potato or arrowhead (Sagittaria latifolia), and sago pondweed (Potamogeton pectinatus), in Peoria Lake from 1986 to 1990 (Roseboom et al., 1989) and with wide celery (eelgrass, tape grass), Vallisneria american, in 1990 in backwaters about 50 miles downstream at Havana, Illinois (Korschgen, 1990). The following description is taken mostly from the two sources cited and from personal communication with Donald Roseboom, Illinois State Water Survey, on February 15, 1991. Two of the backwaters in the Havana area were isolated from the main channel during low flow, and one was contiguous with the river at all river stages. The plants survived and grew if they were rooted in a deep, cohesive soil layer or in buckets of soil. However, the plants in both sites attracted herbivores that ate them down to the roots. The herbivores were identified as Canada geese in Peoria Lake, with some consumption or removal attributed to muskrats. The herbivores were never seen at Havana but were presumed to have been waterfowl. The plants in Peoria Lake subsequently were protected from grazing by orchard netting, but were eventually uprooted by waves, except where a 40-ft tree had lodged and created a windbreak.
During the winter of 1986-1987, a 700-ft breakwater was constructed onshore with donated tires and labor, and towed out to the revegetation site, where it was tied to pilings made of pipes that had been water-jetted 11 ft into the sediment. The tires float because they trap air, and they are oriented to absorb the energy of waves coming from the prevailing wind direction. Survivors of the first planting and the new plantings thrived during the next three growing seasons, with the arrowhead producing flowers at the end of each growing season. Conditions were unusually favorable for revegetation because water levels remained relatively low and stable during the drought of 1988-1989. The air pockets trapped in the tires gradually diminish unless air is periodically blown into them. The breakwater was allowed to sink in the winter of 1989-1990, to test whether the plant beds could sustain themselves behind the sunken tires and the subsurface levee that had formed because of increased sedimentation induced by the breakwater and the plants. Also, the tire breakwater is not as esthetically pleasing to some as a natural island or vegetation bed.
Unfortunately, the water regime in 1990 was drastically different from that in 1988-1989; there were several low to moderate floods during the growing season, and it was impossible to determine whether the observed loss of the plant beds was attributable to the lack of a breakwater, the fluctuating water levels, or a combination of both. It would be desirable to continue the experiment with more than one breakwater, so that at least one could be left floating and one allowed to sink, although the logistics of building and putting 25-ton structures in place tax the limits of locally available volunteer help.
Proposed Side Channel, Backwater, and Bottomland Lake Rehabilitation Projects
The partial success of the breakwater in Peoria Lake led to inclusion of breakwaters in the design of four of nine major habitat rehabilitation projects planned for the Illinois River (Donels, 1989). These projects are part of the Habitat Rehabilitation and Enhancement Sub-program of the Environmental Management Program for the Illinois and Upper Mississippi rivers. Advertisements for construction bids for the project in Peoria Lake are to be issued in December 1991 and include a barrier island (the material dredged for the island will also deepen a small portion of the lake), removal of a plug of downed trees and silt from a major side channel (the East River), and installation of water-control structures (low levees, gates, and pumps) for waterfowl management on an existing forested conservation area.
Lake Chautauqua, a federal wildlife refuge at Havana, will have improved water-control structures, island or levee breakwaters, and a reopened side channel. Wing dams are also proposed for another federal refuge, Swan Lake.
The rest of the projects include traditional methods for managing waterfowl: creation of impoundments, with low levees and gates or pumps, for water-level control. The impoundments are drawn down in the summer to encourage germination and growth of moist soil plants. Pumps or gates are used to flood the impoundments during the waterfowl migration in the fall, so ducks and geese can use the summer's seed production. The problem with these techniques is that low leeves and water-control structures are barriers to fish movements. Although fish can often enter these areas during major floods in the spring (which overtop the low levees), they may not be able to escape through the shallow water or water-control structures when the impoundments are drawn down.
Constraints on Restoration
SCALE CONSIDERATIONS
A large-scale restoration usually implies that the restoration will also be long term. Because resources are limited and the problem of excessive sediment yield affects the entire predominantly agricultural basin, substantial reduction of sediment loading will probably take decades. In the meantime, the high turbidity and sediment concentrations must be factored into the design of restoration projects in the mainstem river and its backwaters. This usually means that not all functions of the river-floodplain system can be restored simultaneously. For example, in cases where former levee districts have been purchased for wildlife areas (or considered for purchase), plans are to retain the high levees, instead of opening them to the river (Roelle et al., 1988). Where natural backwaters were isolated from the river years ago, as at Spring Lake near Havana, the backwaters have retained the submersed aquatic macrophytes characteristic of the pre-1955 river. Opening the levees would admit sediment-laden water that would degrade the new areas. Most planners and managers believe that breaching of the levees in conservation areas must wait for reduction of sediment loading in the river; thus, restoration of these areas for flood storage and conveyance and for use by fish that migrate between channels and backwaters must be considered incomplete, although these areas do support both migratory and resident wildlife populations and outdoor recreation.
The revegetation experiments in the Illinois River also raise important research and management questions about the scale of restoration projects. What are the minimum density and area of aquatic plants that can sustain the anticipated grazing pressure and contribute to vertebrate production? Does the answer change if the herbivorous grass carp, Ctenophyaryngodon idella, invades the Illinois River from the Upper Mississippi River and establishes reproducing populations? Is there some threshold surface area that has to be protected from waves or revegetated before plants begin to exert sufficient control over sediment resuspension and turbidity to maintain themselves or expand outward from planted areas (i.e., what levels of ''treatment" will trigger rapid regeneration of plant beds)? These are questions that are likely to be answered only by continued field trials and careful monitoring.
CONFLICTS IN RESTORATION GOALS AND TECHNIQUES
As suggested in the previous section, there is a conflict between managing existing floodplains and backwaters for waterfowl versus managing for fish. The conflict is engendered by the present degraded condition of the river. The pristine river provided food and habitat for both waterfowl and fish. With the submersed aquatic plants and their invertebrate fauna gone, managers rely on moist soil plants for waterfowl food, so they build low levees and water-control structures to draw water levels down in the summer to create mud flats—practices that are often detrimental to migratory fish and other aquatic organisms. There has been a substantial investment in developing management techniques, installing water-control structures, and training managers so that there is a natural interest on the part of waterfowl hunters and refuge managers in continuing and even expanding moist soil units.
BIOTIC CONSTRAINTS
In some cases, reestablishment of vegetation was hindered, not by the herbivores for whose benefit the vegetation was planted (geese and muskrats), but by pests such as the willow leaf beetle that attacked the new leaves on willow posts installed along one of the tributaries. Mortality of the sprouts was held to 20 percent by spraying with insecticide (Condit, 1989).
ABIOTIC DISTURBANCES
Any biologically mediated restoration is most vulnerable to disturbance when newly planted. Environmental conditions that adversely
affected some of the bioengineered bank stabilization projects in the Illinois River tributaries included the drought of 1988-1989 (some plantings dried up) (Condit, 1989).
Ice driven by winter or spring floods is a severe test for any bank stabilization method. In 1987, Palmiter revetments on the Court Creek tributary were heavily damaged or removed by such a flood less than a year after being installed (Condit and Roseboom, 1989). The revetments were rebuilt with Osage orange (Maclura pomifera), a more durable tree species; a better anchoring system (Laconia earth anchors); and willow whips planted through the revetments. The improved revetments withstood a severe flood the following year, when 3.5 inches of rain fell in an hour (Condit and Roseboom, 1989).
REDUCED WATER QUALITY
Aside from the beneficial effects on the mainstem river and lakes, the tributary restoration program was expected to restore fish and wildlife habitat along the streams. During the drought of 1988, feedlot runoff killed fish in one of the demonstration areas, and pesticide and feedlot runoff is suspected of limiting fish populations in other reaches (Condit and Roseboom, 1989).
SOCIAL AND ADMINISTRATIVE CONSTRAINTS ON RESTORATION
In common with other large rivers that were used for economic development from the time of settlement, the drainage basin, the floodplain, and the bottom of the river itself (in many locations) represent a checkerboard of ownership parcels. The federally supported habitat rehabilitation projects can be installed only on public land, which is in short supply along the Illinois. Although the General Plan for the Environmental Management Program on the Upper Mississippi River System (U.S. Army Corps of Engineers, 1986, Appendix D: Guidance, Policy and Procedures Part III. Environmental Management Program Elements. Section A, Habitat Rehabilitation and Enhancement Projects) specifically stated that "Prime habitat areas for waterfowl and other wetland wildlife species can be acquired and restored," the Office of the Chief of Engineers directed that such projects not be pursued (memo of February 5, 1988 to the Commander, North Central Division). Lands are slowly being acquired, when there are willing sellers, by organizations such as the Nature Conservancy, local park districts, and the Illinois Department of Conservation. The Illinois-Michigan National Heritage Corridor, administered
by the National Park Service, provides for the acquisition and management of some lands between the old Illinois and Michigan Canal and the Illinois River. The pending designation of the remainder of the river as a National Heritage Corridor may spur and focus local, state, and federal acquisition of the riverbank and conversion to open space.
Obtaining 30-ft riparian conservation easements along the tributaries for the bank-stabilization techniques has not been a problem because the landowners were losing cropland and crops to the streams (Condit and Roseboom, 1989). Private landowners were concerned about potential property damage and littering; thus, they retain the right to deny access to individuals. The conservation easements are given by the landowner to the local county Soil and Water Conservation District, which administers and maintains the area. The easement must remain in a natural state after reforestation with pin oak, green ash, red cedar, and gray dogwood (Condit and Roseboom, 1989).
Summary
The Illinois River was an unusually productive floodplain-river ecosystem, until impacted by municipal and industrial waste loading from Chicago and sediment loading resulting from land use changes associated with agriculture (drainage and leveeing of floodplains, channelization of tributaries, removal of riparian forests, and excessive soil erosion).
Expenditure of approximately $6 billion in federal and local funds on waste treatment by municipalities has resulted in improvement in water quality in the main channel, based on trend analysis of physical-chemical factors and biological indicators. Game fish have returned to the upper river, where they were formerly absent, and a sauger population supports a nationally ranked annual fishing tournament. The Illinois River provides 2.1 million angling days per year, valued at $25.2 million annually in 1983 dollars (Conlin, 1987). Hunters spend an additional $14 million per year (Conlin, 1987).
Although water quality has improved, the functions of the river-floodplain system remain impaired by excessive sediment loading. This loading probably increased gradually through the 1950s until a threshold was reached that caused rapid collapse of the submersed aquatic plant beds in the river and its associated backwaters. Since the plants acted as a biological mediator that made the ecosystem somewhat resistant to sediment loading, it is now difficult to restore the submersed aquatic vegetation in an environment where wind and boat-generated waves continually resuspend bottom sediments.
Revegetation experiments indicate that submersed aquatic plants will grow if protected by wave barriers and if roots and tubers are planted more deeply in the sediments than they might naturally grow. As the plants gain a solid roothold in deeper, denser sediments, the breakwaters continue to protect the growing plants. Based on these successful results, artificial island breakwaters are being planned for four of nine restoration projects that are part of the federally funded Environmental Management Program for the Upper Mississippi and Illinois rivers. Material to build the islands will be dredged from the bottom, thereby re-creating deep areas that may be used as wintering areas by some fish.
The revegetation experiments raised important questions about the scale and effectiveness of restoration. Herbivores (Canada geese and muskrats) rapidly consumed the plants on the small test plots, which had to be protected with orchard netting. An introduced herbivore, the grass carp of white amur, may also constrain revegetation. There may be some threshold surface area that must be protected from waves and herbivory before plants can sustain the grazing pressure and begin to exert sufficient control over sediment resuspension and turbidity to maintain themselves and expand outward from planted areas. The threshold that might trigger rapid regeneration of the plant beds is not known.
In addition to treating the mainstem river and backwaters, efforts are being made to reduce sediment loading by reducing soil erosion in the drainage basin and along the tributaries. Funds have been provided by the state of Illinois to accelerate soil erosion control in the basins with the greatest sediment yields. Reaches with the highest rates of bank and bed erosion are being stabilized with bioengineering approaches, including willow whip and post plantings and anchored tree revetments. Techniques originally developed in Ohio had to be modified to work in the easily erodible soils of the Illinois River tributaries. New plantings were especially vulnerable to disturbances, such as the 1988-1989 drought, infestations of willow leaf beetles, and ice scour, and most of the tributary restorations require some repair and adjustment.
It may take decades before measures to control soil and bank erosion substantially reduce sediment loading of the river because of the large scale of the problem, limited resources, and lag effects (sediments already in channels may keep moving toward the main river). The present degraded condition of the river limits restoration options and brings about conflicts in restoration objectives and approaches. Breaching of levees in floodplain drainage districts acquired for conservation would admit sediment-laden river water that would
degrade the restored wetlands. Hence, the functions of flood storage and conveyance and use by migratory fishes have not been restored in these areas. Because submersed aquatic plants will not grow in backwaters and lakes that are connected to or periodically overflowed by the river, waterfowl managers rely on low levees, gates, and pumps to lower water levels and produce moist soil plants on exposed mud flats. These techniques probably have been responsible for a recent upward trend in dabbling duck and goose populations but probably have been detrimental to fish that need access to backwaters.
The greatest uncertainties about the Illinois River restoration are whether thresholds exist for rapid regeneration of submersed aquatic plants, which are important biological mediators in the ecosystem, and if thresholds exist, how long it will take to reach them and what resources will be required. The most encouraging aspect is that the coalition of private landowners, advocacy groups, advisory groups, private businesses, and local, state, and federal agencies appears committed to a long-term, comprehensive restoration program that embraces accelerated soil erosion control on the uplands, bank stabilization and habitat improvement in tributaries, and rehabilitation of the mainstem river and its associated backwaters and bottomland lakes.
References
Baker, F. C. 1906. A catalogue of the mollusca of Illinois. Ill. Lab. Nat. Hist. Bull. 7(6):53-136.
Bellrose, F. C., F. L. Pavelio, Jr., and D. W. Steffeck. 1979. Waterfowl populations and the changing environment of the Illinois River valley. Ill. Nat. Hist. Surv. Bull. 32:1-54.
Bellrose, F. C., S. P. Havera, F. L. Paveglio, Jr., and D. W. Steffeck. 1983. The fate of lakes in the Illinois River valley. Illinois Natural History Survey Biological Notes 119.
Bhowmik, N. G., and R. J. Schicht. 1980. Bank erosion of the Illinois River. Illinois State Water Survey, Report 92.
Briceland, R. H., 1976. Statement of Dr. Richard H. Briceland, Director, Illinois Environmental Protection Agency, to the Task Force on Locks and Dam 26 of the Midwestern Conference, Council of State Governments, Clayton, Missouri, November 18.
Calkins, W. W. 1874. The land and fresh water shells of LaSalle County, Illinois. Ottawa Academy of Natural Science Proceedings. 48 pp. Clean Water Act of 1977. P.L. 95-217, Dec. 27, 1977, 91 Stat. 1566.
Condit, D. 1989. Illinois River Soil Conservation Task Force. Pp. 106-109 in Management of the Illinois River System: The 1990's and Beyond. Illinois River Resource Management. A Governor's Conference held April 1-3, 1987 , Peoria, Ill. 260 pp.
Condit, D., and D. Roseboom. 1989. Stream bank stabilization and the Illinois River Soil and Conservation Task Force. Pp. 110-132 in Management of the Illinois River System: The 1990's and Beyond. Illinois River Resource Management. A Governor's Conference held April 1-3, 1987, Peoria, Ill. 260 pp.
Conlin, M. 1987. Illinois River fish and wildlife considerations. Pp. 147-154 in Management of the Illinois River System: The 1990's and Beyond. Illinois River Resource Management. A Governor's Conference held April 1-3, 1987, Peoria, Ill. 260 pp.
Demissie, M. 1989. Peoria Lake sedimentation and proposed artificial islands. Pp. 46-57 in Management of the Illinois River System: The 1990's and Beyond. Illinois River Resource Management. A Governor's Conference held April 1-3, 1987, Peoria, Ill. 260 pp.
Donels, B. 1989. Environmental management program proposals—The Illinois basin. Pp. 77-80 in Proceedings of the Second Conference on the Management of the Illinois River System: The 1990's and Beyond. Illinois River Resource Management. A Governor's Conference held October 3-4. Peoria, Ill. 199 pp. Forbes, S. A. 1878. The food of Illinois fishes. Ill. Lab. Nat. Hist. Bull. 1(2):71-89.
Forbes, S. A., and R. E. Richardson. 1908. The fishes of Illinois. Illinois Natural History Survey, Urbana, Ill. cxxxvi plus 357 pp.
Forbes, S. A., and R. E. Richardson. 1913. Studies on the biology of the upper Illinois River. Ill. Lab. Nat. Hist. Bull. 9(10):481-574.
Forbes, S. A., and R. E. Richardson. 1919. Some recent changes in Illinois River biology. Ill. Nat. Hist. Surv. Bull. 13(6):139-156.
Hart, C. A. 1895. On the entomology of the Illinois River and adjacent waters. Ill. Lab. Nat. Hist. Bull. 4(6):149-273.
Havera, S. P., and F. C. Bellrose. 1985. The Illinois River: A lesson to be learned. Wetlands 4:29-41.
Havera, S.P., F. C. Bellrose, H. K. Archer, F. Paveglio, Jr., D. W. Steffeck, K. S. Lubinski, R. E. Sparks, W. U. Brigham, L. Coutant, S. Waite, and D. McCormick. 1980. Projected effects of increased diversion of Lake Michigan water on the environment of the Illinois River Valley. Report prepared for the U.S. Army Corps of Engineers, Chicago District, Chicago. Ill.
Herman, R. J. 1987. National resources inventory and potential stream sediment reductions. Pp. 173-183 in Management of the Illinois River System: The 1990's and Beyond. Illinois River Resource Management. A Governor's Conference held April 1-3, 1987, Peoria, Ill. 260 pp.
Illinois Environmental Protection Agency. 1979. Water Quality Management Plan. Volume III. Nonpoint Sources of Pollution: Soil Erosion and Sedimentation, Livestock Wastes, Fertilizers, Pesticides, Forestry, and Fruit Production. Illinois Environmental Protection Agency, Springfield, Ill. 384 pp.
Illinois Environmental Protection Agency. 1990. Illinois Water Quality Report 1988-1989. IEPA/WPC/90-160. Illinois Environmental Protection Agency, Division of Water Pollution Control, Springfield, Ill. 352 pp.
Injerd, D. 1987. Illinois Lake Michigan water diversion. Pp. 56-64 in Management of the Illinois River System: The 1990's and Beyond. Proceedings of the Illinois River Resource Management, A Governor's Conference held April 1-3, 1987, Peoria, Ill. 260 pp.
Jackson, H. O., and W. C. Starrett. 1959. Turbidity and sedimentation at Lake Chautauqua, Illinois. J. Wildl. Manage. 23:157-168.
Karaki, S., and J. van Hoften. 1974. Resuspension of bed material and wave effects on the Illinois and Upper Mississippi rivers caused by boat traffic. Contract Report No. LMSSD 75-881, prepared for the U.S. Army Engineers District, St. Louis, Mo., by Engineering Research Center, Colorado State University, Fort Collins, Colo.
Kelly, M. H., and R. L. Hite. 1984. An evaluation of empirical correlations between the macroinvertebrate biotic index (MBI) and the STORET water quality index (WQI). Unpublished manuscript. Illinois Environmental Protection Agency, Springfield, Ill.
Kofoid, C. A. 1903. Plankton studies. IV. The plankton of the Illinois River, 1894-1899, with introductory notes upon the hydrography of the Illinois River and its basin. Part I. Quantitative investigations and general results. Ill. Lab. Nat. Hist. Bull. 6(2): 95-635.
Korschgen, C. E. 1990. Feasibility study impacts of turbidity on growth and production of submersed plants. U.S. Fish and Wildlife Service, Northern Prairie Wildlife Research Center, LaCrosse, Wis. 11 pp.
Lanyon, R., and C. Lue-Hing. 1987. MSDGC activities in the Upper Illinois basin. Pp. 103-130 in Management of the Illinois River System: The 1990's and Beyond. Illinois River Resource Management. A Governor's Conference held April 1-3, 1987, Peoria, Ill. 260 pp.
Lee, M. T. 1989. Soil erosion, sediment yield, and deposition in the Illinois River basin. Pp. 718-722 in Proceedings of the International Symposium on Sediment Transport Modeling, American Society of Civil Engineers, New Orleans, La., August 14-18.
Leedy, J. B. 1979. Observations on the sources of sediment in Illinois streams. Report of Investigations, No. 18. Illinois Water Information System Group, University of Illinois, Urbana, Ill.
Lubinski, K. S., M. J. Wallendorf, and M. C. Reese. 1981. Analysis of Upper Mississippi River system correlations between physical, biological and navigation variables. Technical Report in partial fulfillment of Contract No. 895-305. Upper Mississippi River Basin Commission, St. Paul, Minn.
Mathis, B. M., and G. E. Stout. 1987. Summary and Recommendations. Pp. 1-4 in Management of the Illinois River System: The 1990's and Beyond. Illinois River Resource Management. A Governor's Conference held April 1-3, 1987, Peoria, Ill. 260 pp.
Mills, H. B., W. C. Starrett, and F. C. Bellrose. 1966. Man's effect on the fish and wildlife of the Illinois River. Biological Notes, No. 57. Illinois Natural History Survey, Urbana, Ill. 24 pp.
Neely, R. D., and C. G. Heister, compilers. 1987. The Natural Resources of Illinois: Introduction and Guide. Special Publication 6. Illinois Natural History Survey, Havana, Ill. 224 pp.
Palmer, A. W. 1903. The pollution and self-purification of the waters of the Illinois River. Bull. Ill. State Water Surv. Bull. 2:62-240.
Richardson, R. E. 1928. The bottom fauna of the middle Illinois River, 1913-1925. Its distribution, abundance, valuation, and index value in the study of stream pollution. Ill. Nat. Hist. Surv. Bull. 17(12):387-475.
Roelle, J. E., D. B. Hamilton, and R. L. Johnson. 1988. Refuge management analyses: Restoration of Thompson Lake as an alternative to further development at Chautauqua National Wildlife Refuge. U.S. Department of the Interior, Fish and Wildlife Service, Research and Development, Washington, D.C. 65 pp.
Roseboom, D., and B. White. 1990. The Court Creek Restoration Project. Pp. 27-39 in Erosion Control: Technology in Transition. Proceedings of Conference XXI, International Erosion Control Association, Feb. 14-17, 1990. Washington, D.C.
Roseboom, D., R. Twait, and D. Sallee. 1989. Habitat restoration for fish and wildlife in backwater lakes of the Illinois River. Pp. 65-68 in Proceedings of the Second Conference on Management of the Illinois River System: The 1990's and Beyond. Illinois River Resource Management. A Governor's Conference held April 1-3, 1987, Peoria, Ill. 260 pp.
Ross, P. E., R. E. Sparks, and F. S. Dillon. 1989. Identification of toxic substances in the upper Illinois River
. Annual Report. Illinois Department of Energy and Natural Resources, Contract No. WR36. 20 ppRuelle, R., and J. Grettenberger. 1991. A preliminary contaminant and toxicological survey of Illinois River sediments. Special Project Report 90-1. U.S. Fish and Wildlife Service, Rock Island, Ill. 17 pp.
Semonin, R. G. 1989. Comments for Illinois River Conference. Pp. 41-45 in Proceedings of the Second Conference of the Management of the Illinois River System: The
1990's and Beyond. Illinois River Resource Management. A Governor's Conference held April 1-3, 1987, Peoria, Ill. 260 pp.
Simons, D. B., R. M. Li, Y. H. Chen, S. S. Ellis, and T. P. Chang. 1981. Investigation of effects of navigation traffic activities on hydrologic, hydraulic, and geomorphic characteristics. Working Paper 2 for Task D, submitted to Upper Mississippi River Basin Commission, Minneapolis, Minn.
Smith, R. A., R. B. Alexander, and M. G. Wolman. 1987. Water-quality trends in the nation's rivers. Science 235:1607-1614.
Sparks, R. E. 1975. Environmental inventory and assessment of navigation pools 24, 25,and 26, Upper Mississippi and Lower Illinois rivers. An electrofishing survey of the Illinois River. Contract Report No. Y-74-4 to U.S. Army Corps of Engineers District, St. Louis, Mo.
Sparks, R. E. 1977. Environmental inventory and assessment of navigation Pools 24, 25,and 26, Upper Mississippi and Lower Illinois rivers. An electrofishing survey of the Illinois River. Urbana-Champaign Water Resources Center Special Report No. 5. UILU-WRC-77-0005. University of Illinois, Urbana, Ill. 122 pp.
Sparks, R. E. 1984. The role of contaminants in the decline of the Illinois River: Implications for the Upper Mississippi. Pp. 25-66 in James G. Wiener, Richard V. Anderson, and David R. McConville, eds., Contaminants in the Upper Mississippi River. Proceedings of the 15th Annual Meeting of the Mississippi River Research Consortium. Butterworth Publishers, Stoneham, Mass. 368 pp.
Sparks, R. E., R. C. Thomas, and D. J. Schaeffer. 1980. The effects of barge traffic on suspended sediment and turbidity in the Illinois River. U.S. Fish and Wildlife Service, Rock Island Field Office, Rock Island, Ill.
Sparks, R. E., P. B. Bayley, S. L. Kohler, and L. L. Osborne. 1990. Disturbance and recovery of large floodplain rivers. Environ. Manage. 14(5):699-709.
Stall, J. B., and S. W. Melsted. 1951. The silting of Lake Chautauqua, Havana, Illinois. Illinois State Water Survey, in cooperation with Illinois Agriculture Experiment Station, Report of Investigations 8. Starrett, W. C. 1971. A survey of the mussels (Unionacea) of the Illinois River. A polluted stream. Ill. Nat. Hist. Surv. Bull. 30:267-403.
Starrett, W. C. 1972. Man and the Illinois River. Pp. 131-169 in R. T. Oglesby, C. A. Carlson, and J. A. McCann, eds., River Ecology and the Impact of Man. Academic Press, New York.
Sullivan, D. J., P. D. Hayes, T. E. Richards, and J. C. Maurer. 1990. Water Resources Data. Illinois Water Year 1989. Volume 2. Illinois River Basin. U.S. Geological Survey Water Data Report IL-89-2. Urbana, Ill. 467 pp.
Thompson, J. 1989. Case Studies in Drainage and Levee District Formation and Development on the Floodplain of the Lower Illinois River, 1890s-1930s. Special Report 016. University of Illinois at Urbana-Champaign, Water Resources Center, Urbana, Ill. 152 pp.
U.S. Army Corps of Engineers. 1986. Upper Mississippi River System Environmental Management Program. General Plan. North Central Division, U.S. Army Corps of Engineers, Chicago, Illinois, 31 p. and 4 exhibits.
U.S. Department of Commerce and Labor. 1911. Special Reports. Fisheries of the United States 1908. U.S. Government Printing Office, Washington, D.C. 324 pp.
Vonnahme, D. R. 1989. Progress in the Illinois River watershed since the First Illinois River Conference. Pp. 8-14 in Management of the Illinois River System: The 1990's and Beyond. Illinois River Resource Management. A Governor's Conference held April 1-3, 1987, Peoria, Ill. 260 pp.
Wetmore, F. 1987. Flood damage protection programs. Pp. 89-102 in Management of the Illinois River System: The 1990's and Beyond. Illinois River Resource Management. A Governor's Conference held April 1-3, 1987, Peoria, Ill. 260 pp.
RESTORING ATTRIBUTES OF THE WILLAMETTE RIVER
John J. Berger
Introduction
The Willamette River cleanup (Figure A.7) has been called "the most successful river-rejuvenation program in the country" (Starbird, 1972). The U.S. Army Corps of Engineers (COE) has described the Willamette as "one of the cleanest streams of comparable size in the nation" (U.S. Army Corps of Engineers, 1989). According to Starbird (and to conventional wisdom about the Willamette), the river "has regained it unspoiled charm" from Eugene, Oregon to Corvallis, Oregon. A documentary videotape produced by the State of Oregon Department of Environmental Quality also reinforces this view with highly laudatory remarks about the river's condition (State of Oregon, Department of Environmental Quality, 1989). A department spokesperson recently stated that the river today is as clean and trouble free as in the 1970s. Gleeson (1972) characterized the river as "recovered" in terms of its water quality. The U.S. Environmental Protection Agency has described the Willamette as a water quality success story and pronounced the river clean (U.S. Environmental Protection Agency, n.d.). Yet various problems remain unsolved, and new problems have recently been discovered, specifically, the presence of dioxin in the river (State of Oregon, Department of Environmental Quality, 1989).
General Description
The Willamette River, the twelfth largest in the United States (Gleeson, 1972), drains 11,460 square miles (29,800 km2 of northwestern Oregon (USGS, 1977). In its aboriginal condition, the Willamette flowed cleanly and freely through grassy meadows and shady woodlands until its confluence with the Columbia River. Thickets of alder, cottonwood, and willow grew along the river, whereas above the floodplain stood tall groves of cedar and fir, rooted in the valley's black, alluvial soil (State of Oregon, Department of Parks and Recreation, 1988). Two-thirds of the state's 2.8 million people live in the Willamette Basin, and two-thirds of its economic activity is conducted there (State of Oregon, Department of Environmental Quality, 1988a; Horner, 1989). About 95 percent of the watershed is still forest (in various stages of forest succession) or farmland (U.S. Environmental Protection Agency, n.d.), but the river is no longer pure and unfettered.
The Willamette River Basin is of roughly rectangular shape, trending north-south in length for 150 miles, at an average width of about 75 miles (State of Oregon, Department of Environmental Quality, 1988a). The basin is bounded on the north by the Columbia River, on the south by the Calapooya Mountains, and on the east and west by the Cascade and Coast Ranges (USGS, 1977). The middle third of the basin is occupied by the Willamette Valley (USGS, 1977). The river itself flows from south to north and is the basin's main waterway (State of Oregon, Department of Environmental Quality, 1988a).
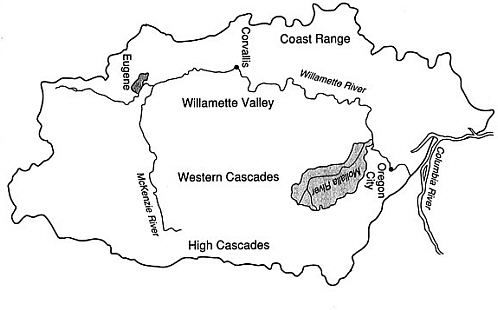
FIGURE A.7
Map of the Willamette River basin. Source: U.S. Geological Survey, 1979.
Major subbasins include the Columbia, Tualatin, Molalla, Coast Range, Santiam, Long Tom, McKenzie, Middle Fork, and Coast Fork (State of Oregon, Department of Environmental Quality, 1988a). Major tributaries are the Middle Fork Willamette, McKenzie, Santiam, Molalla, Pudding, and Clackamas rivers (State of Oregon, Department of Environmental Quality, 1988a). The slopes and mountains of the basin tend to be forested, whereas the valleys are used for agriculture and urban settlement (State of Oregon, Department of Environmental Quality, 1988a). The river itself is used for municipal and industrial water supply, fish production, irrigation, electric power production, navigation, recreation (fishing, boating, and swimming), and receiving water for regulated wastewater discharges (U.S. Environmental Protection Agency, n.d.)
River Morphology
The mainstem of the Willamette River, formed near Eugene from the confluence of its Coast Fork and Middle Fork, flows for 187 miles (300 km) to its confluence with the Columbia River at Portland (USGS, 1977). The mainstem has three main reaches. The upper reach is the swiftest and shallowest; it extends for 135 miles (217 km) from Eugene almost to Newberg. This section is meandering, braided, and relatively turbulent, flowing over cobbles and gravel at velocities 10 to 20 times faster than the two downstream reaches (USGS, 1977). The next 25.5 miles, the ''Newberg Pool," is a much slower, deeper depositional reach with fine sediments of sand and clay mixed with gravel and some cobbles (USGS, 1977). This is separated from the lower river by Willamette Falls near Oregon City. From there to the Columbia, the remaining 26.5 miles (42.6 km) of the river flows in a relatively stable incised channel subject to nonsaline tidal influences "transmitted from the Pacific via the Columbia River" (USGS, 1977). This portion of the riverbed is composed of "intermixed clay, sand, and gravel" and is dredged to maintain navigation (USGS, 1977).
Hydrological Data
Precipitation in the basin varies considerably with elevation and topography; the mean annual precipitation is 63 inches (1,600 mm) (USGS, 1977), with two thirds of it falling from November to March (State of Oregon, Department of Environmental Quality, n.d., unpublished material). Winters are generally wet in the basin; summers are dry. This accounts for the Willamette's annual pattern of Fall rising flows to a January peak, subsiding to annual low flows in August
and September (State of Oregon, Department of Environmental Quality, n.d.). Natural mean average flow at Salem is about 23,000 cfs (Gleeson, 1972). The largest known flood was estimated at 500,000 cfs in December 1861 (Gleeson, 1972).
At Portland, the average discharge from 1972 to 1982 was 32,760 cfs or 23,730,000 acre-ft per yr. Maximum discharge was 283,000 cfs and minimum daily discharge was 4,200 cfs (USGS, 1984).
Augmentation of low summer flow rates by releases of water from reservoirs in the basin have significantly affected the river's natural flow and temperature patterns. Prior to regulation, which began having a major impact in 1952, average annual consecutive 30-day low flow was 3,670 cfs. Between 1953 and 1970 it averaged 6,010 cfs (USGS, 1977). Release of cool bottom waters from impoundments at Lookout Point-Dexter Reservoir complex on the Middle Fork often reduces the river's summer temperature above RM 120, but elsewhere has little effect (USGS, 1977).
History of Pollution Control Efforts
The river basin was first settled by people of European ancestry in 1812 (Weber, 1989). Population growth thereafter was extremely rapid. In less than 40 years, 6,000 people were making their homes in the basin. By 1900 the population had grown to 233,700. The basin had 691,204 residents by 1940 (Weber, 1989); and by 1970, 1.4 million (Gleeson, 1972); and the estimated 1990 population was 2.8 million. By the 1920s, with hundreds of thousands of people living in the Willamette region using the river, the Willamette was grossly polluted by sewage and industrial waste, most of it from the pulp and paper industry.
Although pollution control legislation had been passed as early as 1919, the laws were not well enforced. Citizens, private groups, and public agencies all endeavored to rectify the situation during the 1920s without success. Their concerns led to studies in the 1920s and 1930s of dissolved oxygen in the river; the studies revealed near-complete or complete oxygen depletion in the lower river below Portland (Gleeson, 1972).
At that time the river was an open sewer that stank and contained dangerously high concentrations of coliform bacteria; none of the cities or industries along the Willamette bothered to treat their waste materials. Wood-products industries, canneries, and slaughter-houses dumped their waste directly into the river. Decomposing wood fiber sludge from the river bottom rose to the surface, buoyed by the gases formed during its decomposition. These sludge rafts, swathed in sewage
bacteria (Sphaerotilus natans), floated downstream, consuming oxygen as they rotted (Gleeson, 1972). Aquatic life in the lower river suffocated and died. Zones of oxygen depletion in the lower river served as barriers to fish migration. Commercial and sport fishing as well as recreational uses of the river suffered. Slime coated the water's edge.
STATE, FEDERAL, AND PRIVATE RESTORATION EFFORTS
When efforts to get state antipollution legislation passed during the 1930s failed repeatedly, citizens sponsored a successful antipollution ballot initiative that was approved in 1938. The Water Purification and Prevention of Pollution Bill established a State Sanitary Authority with responsibility for cleaning up and protecting Oregon's public waters (U.S. Environmental Protection Agency, n.d.) The drafting of the legislation was preceded by a study of successful pollution control legislation elsewhere and an analysis of the principles that made controls work (Gleeson, 1972). World War II slowed pollution control efforts. Studies of river conditions resumed in 1944 and revealed that conditions were worse than in 1929.
Progress toward clean water came slowly. It took 8 years after the establishment of the State Sanitary Authority for the first municipal primary wastewater treatment plant to be built on the river, and it was not until 1957, 10 years later, that all municipalities on the river had primary treatment (U.S. Environmental Protection Agency, n.d.). Continued studies of the river in the 1950s and early 1960s revealed, however, that this was not sufficient to correct the problem of low dissolved oxygen. To do so, controlled release of water from reservoirs was begun in 1953 to increase river flow during low-flow months when pollutants were more concentrated and oxygen demand greatest. This was coupled with increasing regulation of paper and pulp mill discharges, beginning 1950. Even these measures combined were insufficient to bring the Willamette up to standards for acceptable water quality. One indication of the river's condition was a fall chinook salmon run in 1965 of only 79 fish, counted at Oregon City Falls.
A turning point in the struggle to clean up the Willamette occurred in the late 1960s. Passage of the federal Clean Water Act of 1977 (P.L. 95-217) required all states to set water quality standards for their rivers and to prepare to enforce them. Hearings to set water quality standards were therefore held by the State Sanitary Authority in 1967, and that year, the state legislature rewrote and greatly strengthened the state's water quality laws. Citizens were very much involved in urging government to take decisive action (U.S. Environmental Protection Agency, n.d.).
The new state law of 1967 made it illegal to put waste materials in the river without obtaining a discharge permit from the State Sanitary Authority (U.S. Environmental Protection Agency, n.d.). All major point source discharges and some minor point sources were thus identified and subsequently controlled. The law set new water quality regulations and water pollution control standards for the state and a mid-1972 deadline for attainment of the new standards. Special water quality standards were established for the Willamette.
The broad state standards dealt with solids, microorganisms, oxygen content, pH, temperature, color, odor, turbidity, oils, aesthetics, and radiological properties of waste. The standards also prescribed minimum dissolved oxygen levels for different reaches of the mainstem, with a minimum of 5 mg per liter in the lower reach. To meet the new standards, the state gave grants to municipalities for sewage treatment plants and tax credits to industry for pollution control equipment.
Secondary treatment was accomplished by all municipalities by 1969, but even this was not sufficient because of the continuing release of waste from the pulp and paper industry (U.S. Environmental Protection Agency, n.d.). Reflecting heightened interest in and concern for the environment, the Oregon legislature in 1969 transferred the State Sanitary Authority to a new state Department of Environmental Quality under an Environmental Quality Commission (Gleeson, 1972; U.S. Environmental Protection Agency, n.d.).
Paper and pulp mills had been ordered in 1950 to stop releasing untreated sulfite waste liquors into the river during the low-flow months of June through October (Gleeson, 1972). They were ordered to provide year-round primary treatment in 1964, and sulfite mills were required to cut the biochemical oxygen demand in their effluents by 85 percent (Gleeson, 1972). Since 1973, under nondegradation provisions of the Federal Water Pollution Control Act Amendments of 1972, state discharge permits have allowed no further increase in total waste loadings to the river (U.S. Environmental Protection Agency, n.d.).
Low-Flow Augmentation
Despite the reduction in waste discharge to the river, low-flow augmentation is critical to the maintenance of water quality. "In spite of the remarkable reduction in pollutional loadings which have been accomplished, the quality of water is dependent upon natural water flow augmentation in the summer low flow periods" (Gleeson, 1972). The U.S. Geological Survey (USGS, 1976) concurred: "Even
with the excellent pollution control program mounted over the years, [dissolved oxygen] standards would still be violated in certain subreaches during most summers without low-flow augmentation." The USGS scientists believe that flow augmentation is also critical to preventing algal blooms in the river, which might occur due to high nutrients levels, and USGS studies suggested that water detention time was the primary limitation on algal growth (USGS, 1976).
The Greenway
Water quality improvements on the Willamette have been accentuated by the development of a riverfront park system known as a greenway, authorized by the state in 1967. Millions of dollars in federal, state, and local funds have been combined in the endeavor, resulting in the creation of extensive shoreline preserves.
The greenway system now includes 255 river miles (J. Lilly, Rivers Program, Oregon Parks and Recreation Division, personal communication, 1990). These 255 miles are supposed to be protected from Lane County at the southern end of the Valley to the Columbia, including the lower reaches of the Coast Fork and Middle Fork under a state law passed in 1967 and updated in 1973. Other headwaters and Cascade Mountain reaches of the Willamette are not within the greenway system itself but are on National Forest land.
STATE ADMINISTRATIVE OBSTACLES
Two legal and administrative problems impede protection of the greenway. State law gives carte blanche to users of land for agricultural purposes in Oregon: farmers along the river can clear land all the way to the river's edge. Agriculture increased over the past 10 to 15 years along the river, then was on the decline, and is now stable (J. Lilly, Rivers Program, Oregon Parks and Recreation Division, personal communication, 1990). This provides an opportunity to have inactive agricultural lands put into the conservation reserve program.
The second problem affecting the greenway is timber harvesting. Until 4 years ago, local government could review and approve timber harvests along the greenway (J. Lilly, Rivers Program, Oregon Parks and Recreation Division, personal communication, 1990). However, as the result of a restructuring of the state forestry program and its rules, local government lost its right to approve timber harvests (J. Lilly, Rivers Program, Oregon Parks and Recreation Division, personal communication, 1990). Although forestry practice rules
designed to protect fish and wildlife and water quality are in place, they do not address recreational impacts or scenic impacts of logging (J. Lilly, Rivers Program, Oregon Parks and Recreation Division, personal communication, 1990).
Another administrative problem affecting the greenway is lack of staff. The Oregon Department of Parks for the past 10 years has had only one person working only 20 percent time on the greenway acquisition process, although field staff and maintenance staff exist to manage the existing greenway sites.
In creating the greenway, not much thought has been given to restoration of natural ecosystems, and little or no actual ecological restoration has been done on the greenway lands, although urban park development has occurred along the river, and some riverfront land has been reclaimed from urban or highway use and converted to park land. The creation of Tom McCall Waterfront Park, for example, involved moving a highway away from the river. Uncharacteristically, a few acres of wetlands have been restored at the McCormick Pier condominium in Portland.
Greenway creation has been more reclamation than restoration. However, the Oregon Department of Parks and Recreation does have a joint management agreement with Fisheries and Wildlife to provide feed for game, especially grain for waterfowl.
Oregon Water Quality Programs
The State of Oregon has recently shifted the emphasis of its pollution control permit system from technology-based standards that focus on the point source facility to an emphasis on receiving-water quality (State of Oregon, Department of Environmental Quality, 1988c). In addition, the state has also begun to shift from its traditional emphasis on point source pollution to paying additional attention to nonpoint source pollution problems, prompted both by the federal Water Quality Act of 1987 and by a suit filed in 1986 by the Northwest Environmental Defense Center. Development and implementation of a nonpoint source management program is one of the state's six major water pollution control program goals (State of Oregon, Department of Environmental Quality, 1988c). The state has an overall water quality management plan as well as the Oregon Clean Water Strategy, a comprehensive geographic approach to meet clean water goals and fulfill requirements of the federal Clean Water Act of 1977 and the federal Water Quality Act of 1987 (State of Oregon, Department of Environmental Quality, 1988c).
Unresolved Problems
WATER QUALITY
The state in its 305B Report (State of Oregon, Department of Environmental Quality, 1988c) published the results of an extensive statewide water quality monitoring, revealing the location, type, severity, and causes of pollution. These are summarized briefly in Tables A.1 through A.4. Technical appendixes supporting these tables are available from the State of Oregon, Department of Environmental Quality.
As shown in Table A.1, the department found that 895 of the Willamette's 4,019 miles had severe water quality problems and that 1,696 miles had moderate pollution. The data in Table A.2 reveal that certain reaches of the river were contaminated with pesticides (e.g., dichlorodiphenyltrichlorethane (DDT)), toxic heavy metals (e.g., arsenic, lead, and zinc), polychlorinated biphenyls (PCBs), dioxin, phthalate, and anthracene. The data in Table A.3 showed that 24 percent of the fish sampled from river mile 51 had abnormalities, as did 17 percent of those from river mile 22. "Abnormalities included lesions, ulcers, deformed fins, missing eyes, or heavy mucous films" (State of Oregon, Department of Environmental Quality, 1988c). Abnormalities were not restricted to the heavily industrialized lower river. That reach, however, did show the highest levels of sediment contamination, including contamination by heavy metals, DDT, and PCBs (Table A.4). The 1988 Basin Status Summary attributes the pollution of the Middle Willamette to causes such as agriculture, industrial point sources, municipal point sources, leaky septic tanks, and urban and residential runoff, and attributes problems in the Coast Fork to septic systems, municipal waste, and agriculture. These plus urban and residential runoff were also cited as causes of pollution in the Lower Willamette.
As the data suggest, nonpoint source-related water quality problems remain in the Willamette Basin. Sources of these problems are land "surface erosion and disturbance of riparian vegetation and stream banks" caused by logging, farming, landslides, and surface runoff from roads (State of Oregon, Department of Environmental Quality, 1988a). "Waterbodies in which serious NPS pollution problems are known to exist or have been reported without challenge" include the Coast Fork of the Willamette and Willamette Harbor. Data indicate that moderate water quality problems exist in the river throughout the North Basin until the problems become severe north of the junction with the Clackamas River. Most of the river in the South Basin also has moderate water quality problems except for Lookout Point
TABLE A.1 Summary of Use Support for Rivers and Streams
|
|
|
Miles of Use Supported or Unknown |
Miles of Use Partially Supported |
Miles of Use Not Supported |
||||
|
Basin |
Total Miles Assessed |
Total |
Monitored (based on DEQ Data) |
NPS* Assessment Evaluation |
Total |
Monitored (based on DEQ Data |
NPS Assessment Evaluated |
Total |
|
North Coast/L. Columbia |
905 |
165 |
0 |
490 |
490 |
59 |
191 |
250 |
|
Mid Coast |
931 |
321 |
0 |
552 |
552 |
19 |
39 |
58 |
|
Umpqua |
1,873 |
732 |
77 |
442 |
519 |
69 |
553 |
622 |
|
South Coast |
1,368 |
496 |
0 |
582 |
582 |
39 |
251 |
290 |
|
Rogue |
2,026 |
1,127 |
150 |
405 |
555 |
81 |
263 |
344 |
|
Willamette |
4,019 |
1,428 |
374 |
1,322 |
1,696 |
257 |
638 |
895 |
|
Sandy |
233 |
102 |
0 |
53 |
53 |
0 |
78 |
78 |
|
Mood |
285 |
47 |
14 |
139 |
153 |
0 |
85 |
85 |
|
Deschutes |
2,538 |
1,325 |
95 |
547 |
642 |
166 |
405 |
571 |
|
John Day |
2,236 |
883 |
32 |
418 |
450 |
325 |
578 |
903 |
|
Umatilla / Walla Walla |
1,120 |
435 |
57 |
399 |
456 |
22 |
207 |
229 |
|
Grande Ronde |
1,771 |
951 |
19 |
511 |
530 |
128 |
162 |
290 |
|
Powder Burnt |
1,331 |
586 |
62 |
380 |
442 |
111 |
192 |
303 |
|
Malheur |
1,613 |
902 |
0 |
353 |
353 |
110 |
248 |
358 |
|
Owyhee |
1,659 |
1,254 |
10 |
161 |
171 |
18 |
216 |
234 |
|
Malheur Lake |
1,902 |
1,035 |
0 |
301 |
301 |
0 |
566 |
566 |
TABLE A.2 Documentation Ambient Monitoring Information
|
Basin-Waterbody |
River Mile |
Sample Type |
Parameter of Concern |
Number Samples |
Median/ Mean Conc. (mg/kg) |
Range Conc. (mg/kg) |
Reason for Inclusion |
|
COLUMBIA BASIN |
|||||||
|
Columbia River |
41.0 |
ft |
Dioxin |
2 |
0.002 |
0.002–0.003 |
Dioxin in fish tissue. |
|
Columbia River |
141.0 |
wsr |
As |
12 |
1.0 |
<1.0–2.0 |
Exceeded 25% human health criteria (83%) |
|
North Portland Harbor |
102.5 |
sd |
DDT |
2 |
0.024 |
<.001–.047 |
Median exceeds threshold conc. for. |
|
|
|
|
DDD |
2 |
0.014 |
<.001–.029 |
DDT, DDD, DDE, in sediments. |
|
|
|
|
DDE |
2 |
0.014 |
<.001–.009 |
|
|
|
|
|
As |
2 |
4.05 |
3.6–4.05 |
Mod. pollutedly by GLG. |
|
|
|
|
Pb |
2 |
18.4 |
17.4–19.4 |
Exceeds EPA median. |
|
|
|
|
Zn |
2 |
145.5 |
140.0–151.0 |
Mid. polluted by GLG. |
|
WILLAMETTE BASIN: |
|||||||
|
Willamette River (St. John's Bridge) |
6.0 |
sd |
DDT |
3 |
0.021 |
<.002–.041 |
Median exceeds threshold conc. for. |
|
|
|
|
DDD |
3 |
0.027 |
<.002–.053 |
DDT, DDD, DDE in sediments. |
|
|
|
|
DDE |
3 |
0.017 |
<.002–.033 |
|
|
|
|
|
As |
3 |
2.4 |
.23–.4.3 |
Range Value exceeds EPA median. |
|
|
|
|
Cu |
3 |
52.5 |
22.0–119.6 |
Highly polluted by GLC. |
|
|
|
|
Pb |
3 |
56.4 |
20.4–116.4 |
Mod. Polluted by GLC. |
|
|
|
|
Zn |
3 |
123.0 |
109.0–210.0 |
Mod. Polluted by Great Lakes Guidelines |
|
|
|
|
enthracene |
3 |
1.100 |
.059–4.2 |
Range value exceeds EPA median. |
|
|
|
|
phenanthrene |
3 |
6.4 |
.490–28.0 |
Range value exceeds EPA median. |
|
|
|
|
PCB |
3 |
.190 |
<.010–.380 |
Range value exceeds EPA median. |
|
Willamette River (Sr&S Bridge) |
7.0 |
wsr |
phthalate |
3 |
2.3 |
0.3–5.6 |
Exceeds fresh H (2)O chronic criteria |
|
|
|
sd |
DDT |
3 |
0.003 |
<.001–.007 |
Median exceeds threshold conc. for. |
|
|
|
|
DDD |
3 |
0.011 |
.006–.014 |
DDT, DDD, DDE in sediments. |
|
|
|
|
DDE |
3 |
0.006 |
.003-.808 |
|
|
|
|
|
As |
3 |
5.5 |
4.8-8.4 |
Mod. polluted by GLG. |
|
|
|
|
Cd |
3 |
0.63 |
0.1-1.15 |
Range vlaue exceeds EPA median. |
|
|
|
|
Cu |
3 |
54.0 |
28.6-129.8 |
Highly polluted by GLG. |
|
|
|
|
Pb |
3 |
15.3 |
2.89-89.1 |
Range value exceeds EPA median. |
|
|
|
|
Zn |
3 |
88.0 |
33.0-221.0 |
Range Value exceeds EPA median. |
|
|
|
|
phthalate |
3 |
0.172 |
<.290-.580 |
Range value exceeds EPA median. |
|
|
|
|
PCB |
3 |
0.076 |
<.015-.103 |
Range value exceeds EPA median |
|
|
|
|
|
|
2.7 |
|
|
|
Willamette River (Near Doanne Lake) |
7.1 |
sd |
DDT |
1 |
0.100 |
|
Median exceeds threshold conc. for. |
|
|
|
|
DDD |
1 |
0.600 |
|
DDT, DDT, DDE in sediments. |
|
|
|
|
DDE |
1 |
5.0 |
|
|
|
|
|
|
As |
1 |
26.5 |
|
Mod. polluted by GLG. |
|
|
|
|
Cu |
1 |
147.0 |
|
Mod. polluted by GLG. |
|
|
|
|
Zn |
1 |
.314 |
|
Mod. polluted by GLG. |
|
|
|
|
PCB |
1 |
|
|
Median exceeds EPA median |
|
Willamette River |
22.0 |
fh |
|
1 |
|
|
Fish health impairment. |
|
Willamette River |
51.0 |
fh |
|
1 |
|
|
Fish health impairment. |
|
Willamette River |
184.6 |
ft. |
Dioxin |
2 |
0.003 |
0.001-0.005 |
Dioxin in fish tissue |
|
Cottage Grove Reservoir |
29.5 |
ft |
Hg |
4 |
0.685 |
.350-1.00 |
Exceeds 50% FDA action level(60%). |
|
Columbia Slough (Below North Slough) |
1.4 |
sd |
As |
2 |
9.3 |
6.5-12.0 |
Highly polluted by GLG. |
|
|
|
|
Cd |
2 |
1.07 |
0.96-1.18 |
Median exceeds EPA median. |
|
|
|
|
Cu |
2 |
51.9 |
42.7-61.0 |
Highly polluted by GLG. |
|
|
|
|
Pb |
2 |
161.7 |
128.0-195.4 |
Highly polluted by GLG. |
|
|
|
|
Zn |
2 |
295.5 |
260.0-331.0 |
Highly polluted by GLG>. |
|
Columbia Slough (At dumpsite) |
2.7 |
ft |
(+) |
5 |
0.300 |
0.150-0.470 |
Not exceed 50% but need to note-(+) |
|
|
|
sd |
As |
3 |
1.2 |
0.8-12.7 |
Range value exceeds EPA median. |
|
|
|
|
Cd |
3 |
2.36 |
1.1-3.6 |
Range value exceeds EPA median. |
|
Basin-Waterbody |
River Mile |
Sample type |
Parameter of Concern |
Number Samples |
Median/Mean conc. (mg/kg) |
Range Conc. (mg/kg) |
Reason for Inclusion |
|
WILLAMETTE BASIN: |
|||||||
|
|
|
|
Cu |
3 |
44.7 |
41.0-95.8 |
Mod. polluted by GLG. |
|
|
|
|
Pb |
3 |
113.9 |
75.5-396.8 |
Highly polluted by GLG. |
|
|
|
|
Zn |
3 |
244.0 |
217.0-549.0 |
Highly polluted by GLG. |
|
|
|
|
phthalate |
3 |
0.900 |
<.100-1.800 |
Range value exceeds EPA median |
|
|
|
|
PCB (+) |
3 |
0.420 |
.300-1.060 |
Range value exceeds EPA median |
|
Columbia Slough |
4.0-5.0 |
wsr |
phthalate (+) |
1 |
55.1 |
|
Exceeds Fr H2O chronic criteria. |
|
(B1 Landfill Bridge) |
|
|
PCB (+) |
1 |
0.037 |
|
Exceeds Fr H2O chronic criteria. |
|
|
|
sd |
As |
1 |
4.8 |
|
Mod. polluted by Great Lakes Guidelines. |
|
|
|
|
Cd |
1 |
1.5 |
|
Median exceeds EPA median |
|
|
|
|
Cu |
1 |
27.5 |
|
Mod. polluted by Great Lakes Guidelines. |
|
|
|
|
phthalate (+) |
1 |
0.266 |
|
Does not exceed but significant cause (+). |
|
|
|
|
PCB (+) |
1 |
0.057 |
|
Does not exceed but significant cause (+). |
|
Columbia Slough |
5.7 |
wsr |
PCE |
1 |
18.0 |
|
Exceed human health criteria. |
|
(B1 Denver Ave.) |
|
sd |
PCB (+) |
1 |
0.028 |
|
Exceed chronic and human health criteria. |
|
|
|
|
As |
1 |
9.0 |
|
Highly polluted by GLG. |
|
|
|
|
Cu |
1 |
82.0 |
|
Highly polluted by GLG. |
|
|
|
|
phthalate |
1 |
0.664 |
|
Medium exceeds EPA median. |
|
|
|
|
PCB (+) |
1 |
0.115 |
|
Median exceeds EPA median. |
|
|
|
|
DDE |
2 |
0.052 |
.042-.061 |
|
|
Beaverton Creek |
5.5 |
wsr |
PCE |
1 |
39.0 |
|
Exceed human health criteria. |
|
(B1 Tekronix) |
|
sd |
DDT |
1 |
0.140 |
|
DDT, DDD, DDE in sediments. |
|
|
|
|
DDE |
1 |
0.024 |
|
|
|
|
|
|
As |
1 |
4.8 |
|
Mod. polluted by GLG. |
|
|
|
|
Cu |
1 |
115.0 |
|
Highly Polluted by GLG. |
|
|
|
|
Pb |
1 |
113.0 |
|
Highly polluted by GLG. |
|
|
|
|
phthalate |
1 |
2.432 |
|
Median exceeds threshold conc. |
|
Conser Slough |
113.5 |
ft |
PCB (+) |
4 |
0.460 |
0.270-2.910 |
Exceeds FDA action levels. |
|
|
|
sd |
As |
4 |
3.8 |
3.7-8.6 |
Mod. polluted by GLG. |
|
|
|
|
Cu |
4 |
68.1 |
56.8-171.1 |
Highly polluted by GLG. |
|
|
|
|
Pb |
4 |
30.2 |
22.2-165.6 |
Range value exceeds EPA medium. |
|
|
|
|
Hg |
4 |
0.14 |
0.07-0.586 |
Do not know why it is here. |
|
|
|
|
Zn |
4 |
158.0 |
136.0-224.0 |
Mod. polluted by GLG. |
|
|
|
|
phenanthrene |
4 |
0.490 |
<.230-1.10 |
Range value exceeds EPA median. |
|
|
|
|
PCB (+) |
4 |
2.280 |
1.52-7.63 |
Exceeds all sediment guidelines. |
|
ROGUE BASIN: |
|||||||
|
Break Creek |
9.0 |
sd |
DDT |
2 |
0.058 |
.009-.107 |
Median exceeds threshold conc. for. |
|
(At Medford) |
|
|
DDD |
2 |
0.017 |
.015-.018 |
DDT, DDD, DDE in sediments. |
|
|
|
|
Cu |
2 |
26.7 |
26.0-27.4 |
Mod. polluted by GLG. |
|
|
|
|
Pb |
2 |
30.9 |
29.0-32.8 |
Range value exceeds EPA median. |
|
|
|
|
Zn |
2 |
65.5 |
65.0-66.0 |
Range value exceeds EPA median. |
|
|
|
|
phthalate |
2 |
1.340 |
.7809-1.900 |
Median exceeds threshold conc. |
|
Applegate River |
45.7 |
wsr |
As |
6 |
1.3 |
<1.0-2.0 |
Exceeds 25% human health criteria (50%). |
|
(Near Copper) |
|
|
Cd |
6 |
1.3 |
<1.0-2.0 |
Exceeds 25% Fr H2O chronic criteria (67%). |
|
|
|
|
Pb |
6 |
7.2 |
1.0-20.0 |
Exceeds 25% Fr H2O chronic criteria (83%). |
|
|
|
|
Hg |
6 |
0.1 |
<0.1-0.4 |
Exceeds 25% Fr H2O chronic criteria (63%). |
|
Basin-Waterbody |
River Mile |
Sample Type |
Parameter of Concern |
Number Samples |
Median/Mean Conc. (mg/kg) |
Range Conc. (mg/kg) |
Reason for Inclusion |
|
MALHEUR BASIN: |
|||||||
|
Malheur River (At Mouth) |
0.4 |
ft |
DDT (+) |
3 |
0.145 |
0.031-0.227 |
Not exceed but significant that detected. |
|
|
|
|
DDT |
3 |
0.011 |
0.006-0.106 |
Since this is a (+). |
|
|
|
|
DDE |
3 |
0.142 |
0.098-0.820 |
|
|
|
|
sd |
DDT (+) |
4 |
0.015 |
<.001-.019 |
Median exceeds threshold conc. for. |
|
|
|
|
DDD |
4 |
0.009 |
<.001-.105 |
DDT, DDD, DDE in sediments. |
|
|
|
|
DDE |
4 |
0.023 |
<.001-.053 |
|
|
|
|
|
As |
4 |
4.1 |
0.5-4.3 |
Mod. polluted by GLG. |
|
|
|
|
Cu |
4 |
34.3 |
21.7-37.8 |
Mod. polluted by GLG. |
|
|
|
|
Zn |
4 |
61.5 |
35.0-69.1 |
Range value exceeds EPA median. |
|
OWYHEE BASIN: |
|||||||
|
Owyhee River |
2.9 |
ft |
DDT (+) |
1 |
0.480 |
|
Greater than 50% of FDA action level. |
|
(At Hwy. 201 Bridge) |
|
|
DDD |
1 |
0.239 |
|
|
|
|
|
|
DDE |
1 |
2.060 |
|
|
|
|
|
|
Hg |
1 |
0.840 |
|
>50% of FDA action level (84%). |
|
|
|
sd |
DDT (+) |
5 |
0.012 |
.006-.030 |
Median exceeds threshold conc. for. |
|
Owyhee River (At Owyhee) |
|
|
DDD |
5 |
0.007 |
.005-.029 |
DDT, DDD, DDE in sediments. |
|
|
|
|
DDE |
5 |
0.040 |
.032-.113 |
|
|
|
|
|
As |
5 |
4.9 |
3.9-14.4 |
Mod. polluted by GLG. |
|
|
|
|
Zn |
5 |
35.0 |
32.0-80.6 |
Range value exceeds EPA median. |
|
|
5.1 |
wsr |
As |
12 |
19.4 |
3.0-47.0 |
Exceeds 25% human health criteria (100%). |
|
KLAMATH BASIN: |
|||||||
|
Klamath River (At Hwy. 97) |
248.3 |
ft |
Hg |
2 |
0.340 |
.20-1.10 |
Exceeds FDA action level of 1. |
|
Source: State of Oregon, Department of Environmental Quality, 1988. |
|||||||
TABLE A.3 Percent of River Fish Afflicted with Abnormalities.a
Reservoir, which has severe water quality problems, and river headwaters, where water quality is generally better. Moderate problems are defined as those that "interfere(s) with desired uses of the water body and with the normal life history or composition of aquatic populations" (State of Oregon, Department of Environmental Quality, 1987). Severe problems are those causing "substantial or nearly complete interference with the beneficial uses or opportunities to use the water" (State of Oregon, Department of Environmental Quality, 1987).
Among the specific water quality problems cited by the Department of Environmental Quality (DEQ) in the River are turbidity, low dissolved oxygen, bacteria/viruses, solids, erosion, low flow, sediment, pesticides, and plant growth. Probable causes of water quality cited by DEQ include changes in flow pattern and timing, pollution in runoff from roads and industrial sites, elimination of protective vegetation over streams, declines in alluvial water tables, flow alteration, water withdrawals, reservoir storage and releases, alteration of physical characteristics of the stream, channelization and wetland
drainage, and diffuse waste disposal. (State of Oregon, Department of Environmental Quality, 1988b).
High levels of nutrients and bacteria have been found in certain parts of the river when precipitation is high (S. Kengla, Department of Environmental Quality, Portland, Oregon, personal communication, 1990). The most dangerous form of dioxin—2,3,7,8-tetrachlorodibenzo-p-dioxin (TCDD)—has recently been found in fish in the Willamette and Columbia rivers at levels of a few parts per trillion in whole fish and fillets. This persistent carcinogen is formed during the bleaching of paper pulp by pulp mills along the river. The DEQ
TABLE A.4 Areas Exhibiting Elevated Levels of Toxics in Sediment
is currently working to reduce dioxin discharges by adding dioxin discharge limits to National Pollutant Discharge Elimination System permits issued to pulp mills. The DEQ is also concerned about 3,000 absorbable organic halides formed during kraft pulp manufacture (State of Oregon, Department of Environmental Quality, 1989).
Some river miles today are not meeting water quality standards with respect to dissolved oxygen and dioxin (Lydia Taylor, Division Administrator, Oregon Department of Environmental Quality, personal communication, 1990). "Degradation has set in but the level of intensity is so small it would be difficult to measure," according to T. Morse (U.S. Army Corps of Engineers, Portland, Oregon, personal communication, 1990). "Dioxin is probably the most serious contaminant in the Willamette" (T. Morse, U.S. Army Corps of Engineers, Portland, Oregon, personal communication, 1990).
The consensus that some decline in river quality is being experienced was shared by James Monteith, director of the Oregon Natural Resources Council, who said, "In the last four to five years we've begun to experience some degradation as a result of agricultural practices and as a result of pulp mills discharges. The dioxin levels have become a very big issue recently. I'm not sure whether what we're seeing is an effect of increased awareness. The main issue today may be toxic loads from paper and pulp mills. This will be looked at very closely" (J. Monteith, Oregon Natural Resources Council, Portland, Oregon, personal communication, 1990).
FISHERIES
The U.S. Army Corps of Engineers has built 13 multipurpose dams in the basin since 1941. By COE calculations, these dams have, among other benefits, prevented $6.5 billion worth of flood damage (U.S. Army Corps of Engineers, 1989). Controlled water releases during low flow periods have maintained water quality by diluting pollution, but the price paid by the natural environment in lost spawning and rearing areas has been steep.
Today, high dams essentially block fish passage on the Willamette, and in response, the Oregon Department of Fish and Wildlife (DFW) has invested in replacing the natural spring chinook and winter steelhead runs with hatchery fish. To improve fisheries, a fish ladder was made fully operational at Willamette Falls in 1971, and nine salmonsteelhead hatcheries have been built in the basin (Gleeson, 1972). Even where fish ladders are constructed and operated properly, however, high head storage dams are drawn down by winter time; fish ladders do not operate well over such a wide range of water levels
(Max Smith, Oregon Department of Fish and Wildlife, personal communication, 1990). "We have not perfected fish passage technology," Smith noted. "Downstream migrant passage facilities don't work very well."
The wild components of the winter steelhead and spring chinook runs are very depleted. Juvenile salmonids are killed in passing through the power plant at Willamette Falls; adult salmon and steelhead are "delayed, stranded, injured, or killed" there (State of Oregon, Department of Fish and Wildlife, 1988).
An adequate water supply for fish is also a problem. According to the Department of Fish and Wildlife, "present water laws do not fully protect fish habitat.... Many tributaries do not have minimum flows established to protect fish and aquatic life" (State of Oregon, Department of Fish and Wildlife, 1988). Reservoir management practices resulting in turbidity, high dissolved nitrogen, and below-dam erosion are also problems.
Native winter steelhead and spring chinook share some spawning areas. Hatcheries, however, are being operated for chinook and winter steelhead, and for a summer steelhead and a fall chinook run that were never native (Max Smith, Oregon Department of Fish and Wildlife, personal communication, 1990). "Some of the anadromous fish stocks are in real trouble" due to competition from introduced exotic species, including bass, bluegills, catfish, pumkinseed, and strains of nonindigenous salmonids (Max Smith, Oregon Department of Fisheries and Wildlife, personal communication, 1990). Interbreeding between wild and hatchery fish and overharvesting of wild adults in mixed-stock fisheries are also problems (State of Oregon, Department of Fish and Wildlife, 1988).
The Department of Fish and Wildlife's philosophical orientation is reflected in its utilitarian goal of managing the basin's fish resource "to provide the greatest recreational, commercial, economic, and nonconsumptive benefits to...citizens." The restoration of natural ecological conditions and the management of ecosystems and habitats do not appear to be as strongly emphasized by the department as hatchery operations, although it does advocate cooperative efforts with other agencies to restore degraded habitat (State of Oregon, Department of Fish and Wildlife, 1988). Within the utilitarian framework mentioned, the department tends to prepare plans for the management of single fish species (e.g., the Coho Salmon Plan of 1981, the Trout Plan of 1987) or groups of (the Warmwater Fish Plan of 1987), rather than see the river as an aquatic ecosystem with valuable nongame components. The department manages some runs intensively, even sometimes trapping surplus fish that return to hatchery sites and trucking them "to downstream release sites for recycling
through the fishery'' (Max Smith, State of Oregon, Department of Fish and Wildlife, personal communication, 1990).
Significant fishery management actions in the basin have been taken with sparse knowledge of the resource base. Trout stocks in the basin have not been identified; recent estimates of natural spring chinook production are lacking; and "information on the habitat requirements of the native [winter steelhead] stock are inadequate to provide specific guidelines for habitat protection and enhancement . . ." (State of Oregon, Department of Fish and Wildlife, 1988).
Much fish habitat has been lost on the Willamette and has not been replaced. The river used to be braided throughout the Willamette Valley, and had side channels and slow places where fish could feed or spawn. About 400 river miles of habitat remain of the 1,400 river miles originally available (Sedell and Frogatt, 1984).
Probably less than half the fish production on the Willamette today is wild native fish. Dams more than any other single factor have the most detrimental effect on wild and native fish (Max Smith, Oregon Department of Fish and Wildlife, personal communication, 1990). There are 14 reservoirs in the Willamette Basin and 12 fish hatcheries or rearing ponds. Almost two-thirds of the Oregon Department of Fish and Wildlife budget is spent on fish propagation in hatcheries. Another 10 percent is spent on fish management activities, including stocking and the monitoring of harvest and population abundance. Only 8 percent of the budget is spent on habitat improvement (State of Oregon, Department of Fish and Wildlife, 1988).
Forestry also has had serious detrimental effects on the river and its fishery because of an emphasis on clearcutting on federal lands not covered by the Oregon Forest Practices Act.
THERMAL IMPACTS ON FISH
Referring to research efforts by the COE to devise ways to overcome thermal disturbances to the river resulting from reservoir releases, Morse (U.S. Army Corps of Engineers, Portland, Oregon, personal communication, 1990) noted "[Our] thermal objective is to restore natural temperatures in the summer. The water is now 5-8 degrees C cooler than it was historically. In September, October, and November this has a warm water effect of about 4 degrees C which reduces growth rates and maturation times in the summer and accelerates hatching time in winter well before there are food resources for fish to take advantage of." The Pacific Northwest Power Planning and Conservation Act (P.L. 96-501) calls for the restoration and enhancement of salmonids in the Pacific Northwest.
Research Activities
The U.S. Army Corps of Engineers is currently conducting a $600,000 basinwide study of the operation and management of its 13 reservoirs in the Willamette Basin. Known as the River Basin Review, the study is to evaluate reservoir storage capacity and current operation on those reservoirs (Johnson, 1990).
The COE has also undertaken a major study of the temperature and flow effects of its dam releases in the basin. The Willamette System Temperature Control Study arose out concerns expressed by resource management agencies since the 1960s about the effects on salmonids of releasing water in the spring and summer that is colder than normal and releasing water in the fall that is warmer than normal. A draft report was completed in 1990 stating that temperature control can be produced by construction and use of water withdrawal towers having selective multiple intake ports (R. Cassidy, U.S. Army Corps of Engineers, Portland, Oregon, personal communication, 1991).
The Oregon Department of Environmental Quality has recently received $25,000 from the Oregon legislature to form a technical steering committee to produce a work plan for a comprehensive River Water Quality Study. This study would reassess the current condition of the river, determine its capacity to accept waste, project the effects of further growth in the basin, and revise the current river management plan (State of Oregon, Department of Environmental Quality, 1990). The DEQ has outlined in detail the future research needs to achieve these goals (State of Oregon, Department of Environmental Quality, 1990). To further evaluate the risks from dioxin, a joint DEQ-Oregon State University study of fish tissue was conducted in 1991. Using current information, the DEQ is currently working to reduce the risks.
Overall Evaluation
The Willamette restoration has been directed primarily toward restoring attributes of water quality, protecting beneficial uses of the river water, and managing for certain species of gamefish. The restoration also includes a reservoir management and research effort to reduce temperature disturbances in the river caused by the release of water from reservoirs. Although attention has been given to land use planning in the basin and in some cases to stream-bank reclamation, there has been no holistic effort to re-create natural antecedent biological or ecological conditions on the Willamette.
Dams on the Willamette and its tributaries have altered normal temperature and flow regimes of the Willamette and its tributaries, and have damaged native wild salmonid populations. Much of the Willamette's water quality improvement has been accomplished by augmenting summer water flows with impounded water to dilute pollutants. Point source industrial discharges are also regulated in amount and concentration through a discharge permit system. As water treatment standards become more rigorous in the future to compensate for an increased human population in the Willamette Basin, more land treatment of wastewater may be employed, further reducing flow in certain Willamette tributaries. This may tend to lower water quality.
Little effort appears to have been made to restore native aquatic life other than anadromous game fish species, and much of the anadromous fish restoration has been the replacement of wild fish by hatchery stock. The river restoration effort has not yet been successful in maintaining natural fish migration routes or in re-creating the predisturbance structure of the native fish community, species by species, to its previous percentage composition. Dams serve not only as barriers to migration to organisms within the river, but also as sediment barriers and obstructions to flooding of riparian areas, which once returned nutrients and sediment to the land.
The Willamette River today is in an unnatural condition that requires constant management. Without flow management through augmentation of low river flow, water quality would be unacceptable. Without hatchery production and release of salmonids, the sport fishery would be severely limited, and without regulation of municipal and industrial waste discharges, high water quality could not be guaranteed. The 13 dams on the river, the past riprapping and channelization, and the dredging (in the lower river) are all indications of the inescapable major impacts that human activities have had on the river. Thus, to call the Willamette an example of river restoration is something of a misnomer. The Willamette is rather an example of river reclamation in which a severely polluted river was cleaned up so that some of its beneficial uses could again be enjoyed by the public. Just as clear-cutting a diverse, complex forest ecosystem and replacing it with a stand of Douglas fir produces a tree farm rather than a restored forest, neither does taking a highly disrupted and polluted river system and merely abating the pollution suffice to "restore" the river.
References
Clean Water Act of 1977. P.L. 95–217, Dec 27, 1977, 91 Stat. 1566.
Federal Water Pollution Control Act Amendments. 1972. P.L. 92–500.
Gleeson, G.W. 1972. The Return of a River: The Willamette River, Oregon. WRR113. Advisory Committee on Environmental Science and Technology and Water Resources Research Institute, Oregon State University, Corvallis, Ore. June.
Horner, E.R. 1989. The Almanac of the Fifty States. Information Systems, Palo Alto, Calif.
Johnson, K. 1990. Fact Sheet. River Basin Review, Oregon, U.S. Army Corps of Engineers. Portland, Ore. January 16.
Sedell, J.R., and J. L. Frogatt. 1984. Importance of streamside forests to large rivers: The isolation of the River, Oregon, USA from its floodplain by snagging and streamside forest removal . Int. Ver. Theoret. Angew. Limnol. Verh. 22:1828–1834.
Starbird, E. A. 1972. A river restored: Oregon's Willamette. Natl. Geogr. 141(6): 816–834.
State of Oregon. Department of Environmental Quality. 1987. Definitions. Pub. WH2399. Portland, Ore. October 14.
State of Oregon. Department of Environmental Quality. 1988a. Oregon Statewide Assessment of Nonpoint Sources of Water Pollution. Chapter 4: Assessment of NPS-Related Water Quality Problems; Appendix E: NPS Database Supporting Maps, Portland, Ore.
State of Oregon. Department of Environmental Quality. 1988b. Oregon Statewide Assessment of Water Pollution. Appendix E: NPS Database Supporting Maps, Portland, Ore.
State of Oregon, Department of Environmental Quality. 1988c. Oregon 1988 Water Quality Status Assessment Report. 305B Report. Portland, Ore.
State of Oregon, Department of Environmental Quality. 1989. A River Restored: Oregon's Willamette. Videotape of slide show. Portland, Ore.
State of Oregon, Department of Environmental Quality. 1990. River Water Quality Study. Draft study proposal. Portland, Ore. March 7.
State of Oregon, Department of Fish and Wildlife. 1988. Basin Fish Management Plan. Portland, Ore. March.
State of Oregon, Department of Parks and Recreation. 1988. Annotated Map. River Recreation Guide. Portland, Ore. March.
U.S. Army Corps of Engineers. 1989. River Basin Reservoir System Operation: Reservoir Regulation and Water Quality Section. Porland District Office. Portland, Ore. May. 29 pp.
U.S. Environmental Protection Agency. n.d. The River Lives Again. Water Quality Success Story Series. Office of Water Planning and Standards. Washington, D.C.
U.S. Geological Survey (USGS), U.S. Department of the Interior. 1976. Methodology for River Quality Assessment with Application to the Willamette River Basin, Oregon. Geological Circular 715 M by D.A. Rickett, W.G. Hines, and S.W. McKenzie.
U.S. Geological Survey, U.S. Department of the Interior. 1977. Dissolved-Oxygen Regimen of the River, Oregon, Under Conditions of Basinwide Secondary Treatment. Geological Circular 715 I by W.G. Hines, S.W. McKenzie, D.A. Rickett, and F.A. Rinella.
U.S. Geological Survey. 1979. Asynoptic Approach for Analyzing Erosion as a Guide to Land-Use Planning. USGS Circular 715-L. U.S. Geological Survey, Reston, Va.
U.S. Geological Survey. 1984. Statistical Summary of Streamflow Data in Oregon. Volume 2 Western Ore. Open File 1984-445-A, Department of the Interior, U.S. Geological Survey, Portland, Ore.
Weber, E. 1989. River Erosion Analysis Project: RM 56.0 TO 121.0, 1989. Oregon Department of Agriculture, Soil and Water Division, Salem, Ore.
CITIZEN RESTORATION EFFORTS IN THE MATTOLE RIVER WATERSHED
John J. Berger
General Description and Location
The Mattole River (Figure A.8) rises south of the town of Whitehorn in Northern California's Humboldt County and flows 62 miles northwest to the Pacific Ocean, which it meets 8 miles south of Cape Mendocino (Mattole Restoration Council [MRC], 1989). About 2,000 people inhabit the 306-square-mile watershed, which has a generally mild, Mediterranean climate due to its proximity to the ocean (MRC, 1989; House, 1990).
Mountain ridges and peaks on the western side of the Mattole watershed uplift winter storm clouds from the ocean and produce frequent heavy rains. Precipitation usually occurs in the winter months and ranges from an average of 50 inches (1,270 mm) of rain in the lower watershed to between 80 and 90 inches (2,032-2, 286 mm) in the upper watershed (MRC, 1989).
Measurements of stream flow made since 1950 at Petrolia in the Lower Mattole watershed indicate an average annual flow rate of 1,340 ft 3/s and an average monthly winter flow of 1,710 to 4,170 ft3/s (MRC, 1989). Summer and fall average flows are less than 60 ft3/s (MRC, 1989). The minimum recorded flow was 20 ft3/s, and the peak flood was 90,400 ft3/s (MRC, 1989).
The watershed is in a seismically active area subject to rapid tectonic uplift and high rates of natural erosion and sedimentation (MRC, 1989).
The river bed drops an average of 22 ft per mile in elevation. The Upper Mattole has a relatively steep gradient and stable bedrock in much of the channel. The Middle Mattole is less steep, but the river and streams cut through highly erodible fractured sandstones and decomposing shales and clay (MRC, 1989). The Lower Mattole has a gentle gradient (less than 11 ft per mile) and meanders through a broad alluvial valley to end in a short estuary that becomes a lagoon when reduced summer river flows allow the river mouth to become plugged with sand (MRC, 1989). The gradual river slope results in deposition of gravel bars, islands, and sediment terraces (Focus, 1990).
The Mattole River was once much cooler, deeper, and narrower than it is today. In the 1940s, the river was still shaded by dense forest of Douglas fir, redwood, and native hardwoods (MRC, 1989). The watershed was rich in riverine fur-bearing wildlife, including fisher, mink, otter, and weasel, which were trapped commercially.
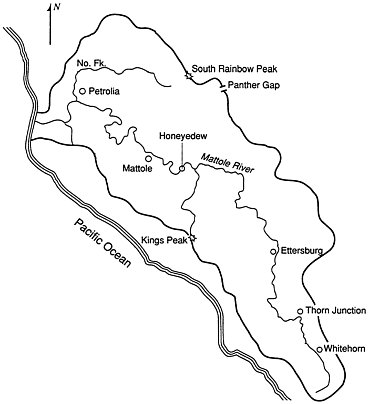
Figure A.8 Mattole River Basin. Source: Reprinted, by permission, from MRC (1989). Copyright © by Mattole Restoration Council, Petrolia, Calif.
Immense runs of king (chinook) salmon (Oncorhynchus tshawytscha), and silver (coho) salmon (Oncorhynchus kisutch), and steelhead (Salmo gairdner) the Mattole during the spawning season as the fish made their way to the clean, cold, well-aerated waters of the Upper Mattole and its numerous tributaries.
Dramatic changes in the watershed began in the nineteenth century. Settlers arrived in the 1850s and had destroyed the indigenous Mattole and Sinkyone Native American people by the 1860s (MRC, 1989). The raising of vegetables, fruits, nuts, and livestock and the pursuit of lumbering replaced the Native Americans' stable hunting, gathering, fishing, and agricultural economy. Trees were cut for homes and fences, and large numbers of tan-bark oaks were stripped of their bark to produce tannin for curing hides (MRC, 1989). Clear-cutting did not begin in the watershed until after World War II, when military tank technology led to creation of the steel-tracked bulldozer, giving timber companies access to steep, remote forestlands.
Type of Disturbance and Time Since Restoration
Today the Upper Mattole still has a closed forest canopy over the river and relatively intact riparian zone vegetation (MRC, 1989). However, between 1950 and 1970, more than three-quarters of the watershed's redwood and Douglas fir timber was cut. Severe damage occurred to the middle and lower sections of the river due to massive erosion from fires, logging, overgrazing, and road construction (MRC, 1989). A maze of thousands of skid trails and roads caused millions of cubic yards of sediment to enter the river. Newly eroded soil and rocks filled in the river channel and pools, silting in spawning gravels used by native king and silver salmon. The result was channel migration, flooding, bank erosion, loss of riparian vegetation, and disappearance of riverside farmland (MRC, 1989; House, 1990). Overflowing its old channel, the lower river reached a width of half a mile.
The heavy load of sediment transported by the river tends to settle in its lower reaches, especially near the mouth. Sometime in early summer, when river flows drop below the 120 ft3/s needed to repel sand left at the river mouth by ocean waves, the river naturally closes and a lagoon forms behind the sandbar. In bygone days, smolts thrived in the slightly brackish waters here. However, since the river has been charged with sediment, the lagoon is much shallower and lacks the cool water necessary to king salmon. Thick silt on the river bottom discourages the benthic insects the salmon need for food. Overhanging vegetation that once cooled the water and provided habitat for insects has been scoured away.
Large nylon gillnets used by Oriental fishermen to catch squid cover many square miles of the Pacific and are also believed to be reducing the number of returning Mattole River salmon.
Restoration Methods and Techniques
Citizen restoration workers in the Mattole watershed intervene directly in the salmonids' spawning cycle in an effort to improve reproductive success. During salmon runs, fish are guided into wooden salmon traps by weirs in the river. Females are removed and stripped of their roe; the roe is fertilized in buckets, and the eggs are placed in clean gravel inside wooden hatch boxes. These handmade streamside salmon incubators are constructed so that clean, filtered, flowing river water can be provided to the fertilized eggs and fry, instead of forcing them to attempt survival in the muddy river. These simple, inexpensive hatching devices with no moving parts typically increase salmon hatch success rates from 15 to 80 percent (House, 1990).
Salmon are then raised in creek holding areas. When salmonid smolts were released in May for their downstream migration, mortality was high in the warm, shallow lagoon. Smolts are therefore now being held for release in the fall when high river flows reopen the plugged river mouth. Restoration workers hope that this will increase smolt survival. Citizens had to work in the river in May 1990, to keep the river mouth open long enough for salmon smolt to get to the sea. Because the river has been designated a Wilderness Study Area, mechanized equipment cannot be used for this task.
Public or Political Involvement
The watershed restoration was begun by a small group of about a dozen people residing in the Mattole watershed who called themselves the Mattole Watershed Salmon Support Group (MWSSG) (House, 1990) and who initiated erosion control, reforestation, salmonid habitat repair, and habitat enhancement. After meeting informally from 1979 to 1985, the Mattole Restoration Council was incorporated in 1985 to conduct active watershed restoration, to make long-range plans, and to oversee their implementation. The MRC is a consensual decisionmaking body representing 13 member organizations, including the MWSSG (House, 1990). The group's guiding principle in watershed restoration is to imitate natural processes as closely as possible (House, 1990). To date, the MRC and member groups have raised between $500,000 and $600,000 for Mattole watershed restoration. School children as well as local residents and landowners have been extensively involved in the restoration work, especially in the release of young salmon.
Early in the restoration process, a citizen salmonid habitat inventory was conducted in the watershed. Citizens also inventoried the remaining old-growth forests, and more recently, they systematically identified sources of erosion in the watershed and prescribed remedial actions.
Whenever the need and opportunity for work in the watershed arose, the MRC endeavored to train local citizens. For example, they were trained in techniques used for erosion mapping, for measuring siltation in the river channel, and for estimating reforestation success and the survival of remnant old-growth forest (House, 1990). With the assistance of professional geologists, 23 watershed residents performed erosion surveying and mapping. They found roads, including logging haul roads and skid trails, to be the source of 76 percent of all erosion problems mapped in the watershed (MRC, 1989).
In the Mattole estuary, the MWSSG has also been attaching driftwood structures to the riverbanks to provide shade and shelter to
juvenile king salmon and steelhead. Other structures will be built to use winter high-water flows to rescour deep pools in the estuary. Currently, the MWSSG and the MRC are engaged in a 2-year effort to create a salmonid enhancement plan for the estuary.
Because of the silt deposition in the estuary area, the river is unstable and has moved its course away from the riparian areas. Alders and willows have been planted around the estuary to encourage the river to scour more deeply, to stabilize the banks and increase shading, and to create deeper channels and pools. The U.S. Bureau of Land Management and the California Conservation Corps planted 3,000 2-year-old seedlings in 1990. A few thousand willows cuttings 5 to 10 ft in length were augured into the banks in the winter of 1990 by the MWSSG in the south side of the floodplain a mile or two from the river's mouth. Since the restoration work began, more trees have been planted in the watershed by timberland owners than by restoration groups. However, much of the landowners' activity stems from community education work and activism by the MWSSG and the MRC. For example, the MRC published a map contrasting the distribution of old-growth forests in 1988 with that in 1947 and has also done a forest regeneration study.
Federal and Local Agency Roles
For the past 5 years, the MRC in cooperation with the State Coastal Conservancy and the Redwood Community Action Agency has been conducting annual cross-sectional surveys of river channel depth at 14 sites to monitor sediment movement in the river (Focus, 1990). During the same period, the MRC has been conducting a study of the estuary in cooperation with the Bureau of Land Management and, since 1983, has been studying a major landslide in cooperation with the California Department of Water Resources, the Redwood National Park, and the California State Coastal Conservancy (Focus, 1990).
The MWSSG and the MRC have coordinated closely with the California Conservation Corps (CCC), identifying target areas and tasks fo CCC workers and, in some cases, working directly with them.
The Bureau of Land Management has been resistant to having local residents play a managerial role in the restoration (F. House, Mattole Restoration Council, personal communication, 1990). However, the bureau has proposed a plan for reintroduction of Roosevelt elk to the watershed.
Government agencies have, in general, provided expertise and recordkeeping for much of the restoration work. The Department of
Fish and Game and the State Coastal Conservancy have provided restoration grants, and the conservancy has provided planning funds.
Recovery Accomplished
The MRC states that 250,000 salmonids were released in the watershed between 1980 and 1990. But the MWSSG has scanty data on fish returns, because most of the fish released were not tagged. Thus, it is difficult in most cases to identify propagated returnees from native returnees. However, the MWSSG has also released fish into tributary streams where there were no king salmon or silver salmon before and has found salmon now occupying these habitats. For example, from 1986 to 1991 there have been silver salmon in Lower Mill Creek. Silver salmon have also reoccupied the North Fork of Honeydew Creek from 1989 to 1991. The population is thought to be self-sustaining in Lower Mill Creek, but introductions are continuing in Honeydew Creek, Squaw Creek, Thompson Creek, Bear Creek, and the mainstem of the river have also had introductions of king salmon.
The overall numbers of returning spawners have continued to decline in the river as a whole, despite the introductions. Whereas an estimated 20,000 king and silver salmon used the river in 1964, they had declined to 3,000 kings and 500 silvers in the winter of 1981–1982. In 1991, the king salmon count was only 200 fish, and no silver salmon were seen. The depletion has probably been intensified by a 4-year drought in California and by an offshore ocean temperature anomaly known as EL NIñO. Low water keeps the returning fish from reaching their preferred spawning areas and forces them to spawn in parts of the river where survival is poorer; low water also leads to early closure of the river mouth. Without the assistance of the MWSSG and the MRC over the past decade, the river's king salmon population might be extinct or at least closer to it.
Ecological Models Against Which to Measure Success
The MRC has not articulated a clear policy on what ecological model will be used to measure success, but the MRC is likely to consider its efforts highly successful if it is able to restore native salmonid populations to near-predisturbance levels, and if it can educate citizens to live in a sustainable relationship to their natural resources (House, 1990). According to House (F. House, Mattolle Restoration Council, personal communication, 1990), success will be achieved when hatchery operations can be halted and species can maintain themselves without human intervention.
Overall Evaluation
The work of the MWSSG and the MRC has prompted regulatory agencies to look more closely at the risks of extinction of old growth linked species within hydrological and biological management units. Much public education has been conducted, and a cadre of local citizens has been created who have a deep concern and detailed knowledge of the watershed and its hydrological processes. The MRC sees environmental restoration as an opportunity to bring about social as well as ecological transformation by reeducating residents to restore and live in a harmonious, sustainable way within their watershed (House, 1990).
References
Focus on Mattole Estuary, 1990. Mattole Restoration Newsletter, Winter 12pp.
House, F. 1990. To learn the Things We Need to Know. Whole Earth Review, Spring.
Mattole Restoration Council (MRC), 1989. Elements of Recovery: An Inventory of Upslope Sources of Sedimentation in the Mattole River Watershed with Rehabilitation Prescriptions and Additional Information for Erosion Control Prioritization. Mattole Restoration Council, Petrolia, Calif. December, 47 pp. (Note: This document is presented as a step toward a comprehensive watershed restoration plan).
THE MERRIMACK RIVER
Sheila David
With good management and human commitment, nature often takes over and heals itself.
Rene Dubos
General Description and Type of Disturbance
The history of pollution of the Merrimack River reads like a horror story. Report after report describes the foul, polluted condition of the river, its headwaters, and its tributaries. In the 1930s, reports indicated that contamination along the length of the river made it too polluted for domestic water supply uses. Raw sewage, paper mill waste, tannery sludge, and other pollutants were dumped into the river untreated. By the end of World War II, the Merrimack was recognized as one of the 10 most polluted streams in the nation.
The Merrimack River is formed by the confluence of the Pemigewassett and Winnepesaukee Rivers in Franklin, New Hampshire (Figure A.9). It flows south through New Hampshire's capital, Concord, past its
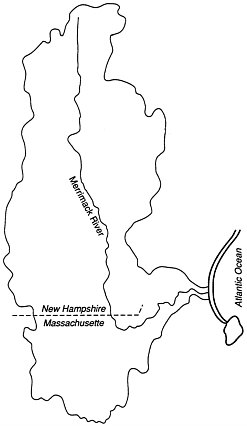
FIGURE A.9 Merrimack River Basin. Source: U.S. Environmental Protection Agency, 1987.
most populated cities of Manchester and Nashua, and into Massachusetts. There it turns sharply east toward the Atlantic, flowing through the cities of Lowell, Lawrence, and Haverhill. Just below Haverhill, the river becomes tidal, widening into an important estuarine zone at Newburyport. The river then flows through a narrow channel between Plum Island and Salisbury Beach into the Atlantic Ocean. The Merrimack River Basin is the fourth largest in New England and has a maximum length of 134 miles and a maximum width of 68 miles. Of the 5,010-square-mile basin area, 3,810 square miles lie in New Hampshire and 1,200 square miles in Massachusetts.
Approximately 1,484,000 people lived in the basin in 1980. The economy of the basin depends primarily on manufacturing and service industries. Recreation and tourism are of great importance in the upper basin, where mountains and lakes have made the area a leading vacation spot in the Northeast.
The Cleanup Begins
Serious efforts to improve the quality of the Merrimack River began in 1972. The Clean Water Act of 1977 (P.L. 95–217) established standards for water quality, supplied funds to assist states in meeting those standards, and directed the states to maintain the standards through effective administration.
Since then there has been significant improvement in the quality of the river. More than 84 wastewater treatment plants have been constructed throughout New Hampshire at a cost exceeding $280 million. Initial emphasis was placed on cleaning up the tributaries. Treatment facilities came online one after the other during a period of generous federal support. Industries were brought into compliance, and they often made a substantial investment in pollution control equipment. In many cases, industries learned how to use water more efficiently, whereas others were unable to operate profitably under the clean water regulations and went out of business.
The river's recovery is not yet complete. Key municipalities along the river have not completed their wastewater treatment plants or are in need of interceptors and expansion. In its 1986 report to Congress, the New Hampshire Water Supply and Pollution Control Commission reported to the Nashua Regional Planning Commission that it assessed 488.3 miles of the Merrimack and its major tributaries in New Hampshire (Nashua Regional Planning Commission, 1986). A total of 420.9 of those miles met or exceeded the Class-B federal standards for fishable and swimmable waters, leaving 67.4 miles in need of water quality improvement.
The combination of reduced federal funds and impending deadlines for compliance has increased competition and friction between river communities. Whether the federal government continues to withdraw its support for wastewater treatment projects or not, greater cooperation between the states and communities is required.
Citizen Power
Local citizen groups have been very effective at helping to restore the Merrimack River. For example, the Merrimack River Watershed Council, begun in 1977, is an interstate organization dedicated to the protection of the Merrimack River. The council was formed by a small group of citizens who recognized the need for an independent organization to address the issues affecting river life and water quality. The council has been effective in defining resource values, increasing public awareness of water issues, and preserving open space in many towns.
The council's goal has been a revitalized Merrimack, and it has been working to achieve a balanced program of environmental protection and enlightened land use that is nonpolluting and in the public interest, and to build a citizenry alert to the issues and opportunities surrounding protection and restoration of the river. The group has been assisted by two regional planning agencies and the New England Rivers Center, and prepared a comprehensive greenway plan in its first 2 years.
Access points have been established, trails protected, and agricultural preservation restrictions enacted. Because of the council's efforts, the Merrimack has been designated a local scenic river in Massachusetts and may soon be granted National Wild and Scenic River status.
The council has worked with business and industry to stop pollution, has linked various groups with municipal and states agencies, and has created effective coalitions. The River's Reach, a first-class, issue-oriented publication circulated to 12,000 people twice annually, has focused attention on the river as a dominant and positive force in the valley. The council has helped people realize that the Merrimack, despite 100 years of neglect and abuse, is a natural resource of critical value to the economic and social well-being of the region. The Merrimack River Watershed Council has been key to managing in the public interest the increasing demands on the river and to achieving equitable resolution of upstream and downstream and out-of-basin conflicts.
Results
The Merrimack River is resilient and has responded favorably to the tremendous and successful efforts of government agencies and private citizens to make it fishable and swimmable. Pollution abatement activities on the Merrimack have resulted in at least partial achievement of water quality standards in 94.3 percent of the New Hampshire portion of the basin and 68 percent of the Massachusetts portion (Nashua Regional Planning Commission, 1986). The entire Massachussetts portion of the mainstem of the river is at least partially supporting designated uses. The river is the drinking water source for several Massachussetts and New Hampshire communities, supplying more than 237,000 people in Massachusetts alone. The use of the river as a source of drinking water intensifies the need to protect the integrity of the Merrimack's water quality.
The river now offers a good deal of enjoyable canoeing. In the marshlands, canoeists can enjoy a multitude of bird and other wildlife sightings. The state Division of Fisheries and Wildlife, Division
of Marine Fisheries, and the U.S. Fish and Wildlife Service are working on a major restoration effort for Atlantic salmon, American shad, and other anadromous fish. The Lowell Heritage State Park (the first urban national park of its kind) preserves examples of a textile millera that had a dramatic impact on the regional economy.
A stretch of 36.4 miles of the Merrimack River from its start in Franklin to northern Manchester in New Hampshire meets water quality standards for Class-B waters, with coliform concentrations of 240 ppm or less per 100 ml, drastically reduced total organic loadings, levels of suspended solids reduced by one-third, and a much higher dissolved oxygen content (U.S. EPA, 1987). The river's appearance, and its biological and chemical makeup, have improved markedly. For example, significant reductions in the input of pollutants have resulted in the replacement of sewage-laden sediments by reestablished benthic fauna. Such results were obtained in numerous improvement projects that included the Winnepesaukee basin plant in Franklin, the Boscawen Wastewater Treatment Plant, a secondary waste treatment facility in Hooksett, two facilities in Concord Penacook and Hall Streets, a secondary facility at Allenstown-Pembroke, six facilities along the Pemigewassett River and six on the Contoocook, a secondary facility in Manchester, another secondary facility on the Souhegan, and a primary treatment plant on the Piscataquog.
In Massachusetts, similar efforts have upgraded the river's water quality. Secondary wastewater treatment facilities were built in six communities along the Merrimack mainstem. Operation of three of these plants — at Lowell, Lawrence, and Haverhill — reduced the amount of Biological Oxygen Demands on the river from these three towns by an estimated 80 percent (Nashua Regional Planning Commission, 1986). Also significant have been the increase in dissolved oxygen and the decrease in coliform bacteria counts. Today, four drinking water collection sites are in operation in Lowell, And over, Methuen, and Lawrence, Massachusetts, and one operates in Nashua, New Hampshire. A sixth withdrawal site is under construction in Tewkesbury, Massachusetts.
Upgraded wastewater treatment has also led to a relaxation of the prohibition againts shellfishing in the estuary. A recent upgrade of the Newburyport wastewater treatment facility is expected to yield further improvement in the estuary.
Hydrology and Ground Water
Unlike surface water systems, which are hydrologically well understood, ground water systems and their intricacies are less well
understood. Understanding the ground water environment, with an assesment of the resource, is necessary before it can be adequately protected and efficiently utilized. This is critical because ground water serves as the principal source of domestic water supply throughout rural areas of the basin and also makes an important contribution to public systems. Past and present efforts within the basin have focused on ensuring the quality of ground water for public consumption as a prerequisite for managing ground water quality. Largescale, general data on ground water quality have been compiled by New Hampshire. Information is slightly more refined in the Massachusetts portion of the basin because of hydrologic studies performed by the U.S. Geological Survey. Studies indicate that ground water quality conditions are generally the same in Massachusetts as in New Hampshire (Hanley, 1990).
The runoff of the Merrimack Basin flows through the interconnected system of surface water and ground water. Although surface water is the most visible manifestation of runoff, it is derived primarily from ground water via subsurface flow. The Merrimack mainstem is the axis in the basin, connecting five principal tributaries and ultimately channeling an average flow of 4.9 billion gallons per day to the Atlantic Ocean.
Overall Evaluation
The water quality of the Merrimack River has gradually improved, and the readily observable contamination has vanished. Although the projections of expected continued improvement in water quality for years 1990 through 2020 may be well founded for Class-B water characteristics, the increased population in the basin and subsequent activity along the river will inevitably affect the attainment of public drinking water standards. It is clear that improvements in the river have been achieved through a combination of local, state, and federal efforts. In addition, the cooperation and financial assistance of private industry have helped bring the Merrimack River to health.
According to the October 1988 bulletin of the Merrimack River Watershed Council, current policies affecting the water resources of the Merrimack include the following:
-
The Clean Water Act of 1977 and its recent reauthorization, which reflect strong commitment to support water quality programs that improve or maintain water resources at fishable and swimmable quality.
-
Implementation of the Anadromous Fish Restoration Program in the U.S. Fish and Wildlife Service.
-
Mandate of October 1987 from the U.S. Environmental Protection Agency (EPA) for commencement of the Merrimack River Watershed Initiative, which recognized the need for managing water quality with funding provided to the states for implementation.
-
Riparian rights in New Hampshire, meaning that ownership of riverfront land allows use of the water flowing by, provided the owner has a ''reasonable use" and downstream riparian owners are not unreason
-
Congressional mandate that New Hampshire enforce the Clean Water Act of 1977. Although several miles of the Merrimack did not meet the July 1, 1988, fishable and swimmable criteria as required, state efforts have greatly improved the river's water quality.
-
The Merrimack River Watershed Initiative (funded by a $50,000 grant from EPA) and the New Hampshire River Protection Program, which were implemented in 1988.
-
The Water Supply Task Force, partially funded by major water users, which is studying the long-range water supply needs of 68 communities in southern New Hampshire.
-
The fact that the state of New Hampshire has no specific policies that address development and use of public drinking water supplies. There has not been an act of legislature either establishing policy or establishing a program in the state administrative agencies.
-
Lack of a clear mandate from the legislature, so that state agencies allow and encourage water users to rely more heavily on the Merrimack River. As the Department of Environmental Services Commissioner told the Merrimack River Watershed Council recently, "It is clear that there is sufficient minimum flow for usage of the Merrimack as a principal water supply source for south central New Hampshire in the future" (Hanley, 1990).
References and Recommended Reading
Brochures and bulletins from the Merrimack River Watershed Council, 694 Main Street, West Newbury, MA 01985.
Clean Water Act of 1997. P.L. 95-217, Dec. 27, 1977, Stat. 1566.
Hanley, N.E. 1990. A Massachussetts Merrimack River Water Supply Protection Initiative 1990. Massachusetts Department of Environmental Protection, Technical Services Branch, Westborough, MA 01581.
Nashua Regional Planning Commission. 1986. The Merrimack River: Issues fo Southern New Hampshire. Nashua Regional Planning Commission, 115 Main Street, Nashua, NH 03061.
U.S. Environmental Protection Agency (EPA). 1987. Merrimack River Watershed Protection Initiative: Past, Present, and Future. U.S. EPA, Water Management Division, Boston, Mass.
THE BLANCO RIVER
John J. Berger
Introduction
This case study discusses scientific, technological, and administrative aspects of the Blanco River reconstruction project in southwestern Colorado (Figure A.10). It focuses on the channel stabilization and fishery problems encountered and the processes used to solve them.
Before repair work began in 1987, target sites on both branches of the Blanco River were broad, shallow, and braided with no pools. In the course of the 3-year river reconstruction project directed by hydrologist D. L. Rosgen, the river's bank-full width was reduced from a 400-ft-wide braided channel to a stable, 65-ft channel with a high pool-to-riffle ratio (personal communication during site visit to
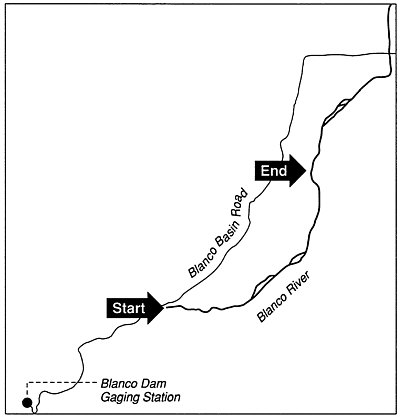
FIGURE A.10 Map of the Blanco River.
Blanco River, June 1990; D.L. Rosgen, telephone interview, January 1991). Even before project conclusion in 1990, major improvements had occured in the fishery and in the appearance of the site.
General Description
The Blanco River is located 20 miles southeast of Pagosa Springs, Colorado, on Highway 84, 10 miles east of Blanco Basin Road. The project area is about 2.7 stream miles in length and drains a basin of approximately 56 square miles. The site has been used for grazing for about 50 years. Mean precipitation in the basin is approximately 42 inches per year; runoff is dominated by snowmelt. Major floods in recent years have been caused by late summer and fall high-intensity thunderstorms.
The river has a slope of about 1.5 percent. Bed materials are heterogeneous unconsolidated cohesive particles ranging from fine sand to very coarse cobbles. The mean river depth is 3.5 ft, and the river in the project vicinity is a fourth-order Horton stream. In the stream classification system of the hydrologist who repaired sections of the Blanco and San Juan Rivers (Rosgen, 1988), both project reaches of both rivers were designated as D1 streams and were reconstructed as C1 streams.
A D1 stream has a slope of 1.5 percent or greater; a braided channel; and a cobble bed with a mixture of coarse gravel, sand, and small boulders; it is slightly entrenched without valley confinement, and is found in coarse glacial outwash depositional material in a reach with an excess sediment supply of coarse-size material (Rosgen, 1988).
The C1 target stream has a gradient of 1.2 to 1.5 percent; a sinuous channel with a sinuosity ratio of 1.5 to 2.0; a width-to-depth ratio of 10 or higher (18 to 20 in the case of the reference streams used as models for the Blanco restoration); and a cobble bed with a mixture of small boulders and coarse gravel; it is moderately entrenched and moderately confined by its valley, and is found in predominantly coarse-textured, stable, high alluvial terraces (Rosgen, 1988; D.L. Rosgen, telephone interview, January 1991).
Origin of the Problem: Improper Flood Control
A major difference between the Blanco and the San Juan River is that the Blanco was channelized by the U.S. Army Corps of Engineers (COE) after a 1970 flood in an effort to protect adjacent land from flooding. The flood control effort resulted in channel instability and in the creation of a braided reach. By contrast, the channel instability
in the San Juan River was caused by extirpation of stream-bank vegetation.
After the 1970 flood, COE straightened portions of the Blanco River, increased its slope, and entrenched the river within a levee system so that what once was the low-flow channel, terrace, and floodplain became a wide, flat-bottomed trapezoidal channel. The loss of meanders and steepening of the river caused the channel bed to degrade. This, in turn, resulted in stream-bank failure and erosion. This erosion typically travels upstream and eventually contributes to sedimentation and aggradation of downstream reaches.
Replacement of the natural river morphology by the wide artificial channel induced sediment deposition through a reduction in shear stress. The shear stress is a function of stream gradient, specific gravity of water, and the hydraulic radius. Enlarging the width-depth ratio by channelization reduces the shear stress or entertainment capacity of the stream at any flow. This can cause sedimentation and a braiding channel. Channel confinement also prevented the floodplain from functioning (the floodplain is necessary to dissipate energy). Another problem was COE's use of highly erodible riverbed material to build the levees.
After channelization, a broad range of hydrological problems began to appear. The river began to spread out from its channel, becoming broad and shallow, detaching riparian vegetation, and eroding banks as it migrated. The active bank erosion contributed high sediment loadings to the stream, which in turn led to bar building and other types of sediment deposition. Agricultural land along the river was made unusable and agricultural facilities, including a barn, were threatened. Because the shallow river experienced high summer temperatures and full freezing in the winter, and had lost its pools and other trout refugia, few fish could be found; those taken were generally small brook trout. As on the East Fork of the Blanco (another Rosgen channel stabilization site), much of the Blanco sediment was contributed by a relatively short stretch of the river.
Since COE's flood control intervention, there has been continual progressive erosion of the property owner's land near the Blanco, threatening portions of the remaining land and facilities. Since COE changed the natural riverine hydrology, the landowner has had to spend thousands of dollars over many years trying to stabilize the riverbanks, but to no avail. Until he learned of Rosgen's successful work on the nearby San Juan River, the landowner was uncertain how to proceed, because he did not want to use conventional COE engineering approaches that rely on unsightly concrete and riprap to imprison the river.
Restoration Goals and Objectives
The major goal of the Blanco reconstruction was to stabilize the river in a well-incised but natural looking permanent channel that would enable it to handle floods, without requiring creation of an artificial-looking concrete channel. The "soft engineering" approach used by Rosgen required rebuilding the river's width-to-depth ratio, and re-creating a natural channel geometry containing a low flow channel, floodplain, and terrace.
In selecting design criteria, Rosgen first located undisturbed similar streams in the vicinity of the Blanco and found that their dimensions and patterns were consistent with those of the C1 stream type in his stream classification system. He then sought to use as design criteria the values of this very stable stream type existing in the local area on the same gradient and within similar channel and bank materials.
In Rosgen's work on the East Fork of the Blanco, he modeled the reconstruction on a stable section of the river about a mile down-stream from his project site. To verify that the candidate stream type selected should be stable, he studied a long time series of aerial photos taken from the 1940s until recent years. This historical record included a period that extended many years before and after major floods. Inspection revealed that the C1 stream type exhibited postflood self-stabilization. Rosgen therefore concluded that the C1 stream type had held up and would hold up very well.
Another reconstruction goal was to increase bank storage. Previous to Rosgen's stabilization work, the Blanco River project sites were so wide that the floodplain had been eroded away, and no land was adjacent to the active channel.
Cost and Benefits
Restoration costs on the Blanco, about $30 per lineal foot of stream, were half those on the San Juan River project, because equipment operators had been trained during the earlier project and were able to work more efficiently (D.L. Rosgen, telephone interview, January 1991). Total costs to the private landowner on whose property the Blanco River work was done were about $400,000. Spawning channels and a new spring-fed, floodplain-level trout pond on the Blanco added about another 15 percent to total project costs (D.L. Rosgen, telephone interview, January 1991).
From his $400,000 investment, the landowner gained the 168 to 170 acres of agricultural land that was once again made available in the floodplain. The recreated floodplain varied from about 400 to 800 ft
in width, and the cost of its creation per acre was about the going rate for purchase of land in the area.
Where fish were scarce and small, it is now not unusual to catch 16- to 18-inch brown and rainbow trout that have been stocked. Fishing has also been improved by construction of narrow, sinuous fish spawning channels ranging from 20 or 30 to 500 yards in length and connected to the main branch of the river, as well as by creation of an acre-and-a-half, spring-fed trout pond. Through revegetation with willows and cottonwoods, major aesthetic improvements were also made at the site.
Another way to assess the value of the project beyond landowner satisfaction with the fishery, land reacquisition, aesthetic improvements, and property protection values would be to estimate the avoided damage from stream sedimentation. Rosgen points out that Pacific Gas and Electric Company pays $4 per cubic yard of sediment kept out of Wolf Creek, which it manages in California. Sediment not kept out of the creek and accumulating in a company holding pond must be dredged and disposed of at a cost of about $6 per cubic yard. Because of the very active bank erosion in progress before the project began, use of this sediment-to-dollars conversion factor would result in a very large estimated project benefit based solely on avoidance of sediment damage.
Project Permits
The Blanco River project design was reviewed by the following agencies prior to the granting of a construction permit under Section 404 of the Clean Water Act of 1977 (P.L. 95–217): the Colorado Division of Wildlife, the U.S. Fish and Wildlife Service, the Environmental Protection Agency, and the U.S. Forest Service. The project almost failed to materialize when COE subjected the unique design to expert review and was told by its reviewers that the new system would not contain flood flows. The project design was then sent for review to Professor Luna Leopold at the University of California, Berkeley, Department of Geology and Geophysics; Leopold praised the project and expressed confidence that it would work. On the basis of his recommendation, COE withdrew its reservations, and the project was allowed to proceed.
No federal funding was applied for, although it is possible that matching funds could have been obtained through the Agricultural Conservation and Stabilization Service.
Restoration Process: Major Stages
Rogens attemps in a mathematical way to match the observed stream morphology of stable streams to the reconstruction design criteria for his projects. He takes theoretical relationships regarding channel geometry and then observes the empirical relationships in the field for verification of the theory. Observations are then linked to his standardized empirical stream classification system. In effect, he matches stream data and other variables to the model. The principles employed work in any physiographic region, because sediment grain size and slope are physical characteristics that can be observed anywhere in the world, and the laws of physics are also universal. Over time, Rosgen continues expanding and refining his classification system by adding newly observed stream types.
Rosgen began the Blanco project with research to identify the causes of the river's problem. This entailed inventorying of hydrological conditions, locating stream flow records from the U.S. Geological Survey, and interpreting over time the behavior of stable and unstable channel forms and types.
Rosgen then created a design based on existing flow and other variables similar to the natural stable form for that flow. Dimensions for the channel were chosen based on flow data, and patterns for the channel were developed based on the dimensions and flow. The river's meander geometry—the radius of its curvature, curve amplitude, and meander length—was designed commensurate with its width in the same proportion as a natural river of the model type.
Next, Rosgen obtained necessary permits using calculations based on permanent stream cross sections to calculate the necessary amounts of cut and fill (i.e., the yardage of excavations). He was also required to do an environmental assessment for his project and mitigation. Clearance of the Section 404 permit took about 60 days.
Rosgen then field-staked the active channel and its proper alignment and other aspects of its meander geometry using a laser beam level. Before construction began, he diverted the stream into a constructed bypass channel so the stream work could be done dry. Construction was done during seasonal low-flow periods.
Downstream of the construction area, Rosgen had constructed a settling detention basin outside the active channel via a diversion. Thus any sediment from the project was flushed into the pond.
Rosgen then directed the shaping of the channel with bulldozers and scrapers, so that material from bars and channel was deposited
in the floodplain. The effect of the entire project was to bring about a transformation of the river. The problem with braided rivers is that they generally do not recovery naturally; recoveries are known but are extremely rare; and braided channels typically get progressively worse and are not self-correcting (D.L. Rosgen, telephone interview, January 1991).
Once Rosgen establishes the river geometry including cross-sectional dimensions, he delineates the flow pattern and then performs bank revetment work utilizing native material, including logs, root wads, boulders, and live vegetation. On the Blanco River, he used cottonwoods and willows to reestablish streamwide tree cover, and he used fescue, bluegrass, and clover, as well as nonnative timothy and orchard grass, to cover bank areas. Willows in this project were transplanted by front-end loaders from an adjacent terrace located about 150 yards from the river channel to the river banks. Cuttings were also taken from willows adjacent to the river, utilizing the same species of willows.
To reinforce banks, Rosgen used much the same procedure as on the San Juan River: he sank logs in the streambed, put boulders over them, and positioned logs on top of the boulders. After the logs had been covered with some soil, willows were planted in the newly created bank margins.
Project Indicators
Variables with which Rosgen was concerned on this project included river width, depth, velocity, discharge, slope, energy slope, roughness, sediment load, sediment size, sinuosity, width-to-depth ratio, dominant particle size of bed and bank materials, entrenchment of channel, confinement of channel, landform confinement of channel, landform features, soil erodibility, and stability (Rosgen, 1988).
Rosgen measured sediment particle size, substrate, aggregation, degradation, slope, longitudinal profile, bed load, suspended sediment, grading curves, and particle size on the very similar East Fork project reach on the Blanco and used that data in his design work on the main branch of the river.
In gathering this data, Rosgen's main concern was to verify that, given the sizes of sediment that moved through the new channel versus the old channel and the expected sediment input from the feeder channel, the reconstructed reach would be able to accommodate the demands placed on it.
Conclusion
The Blanco River project site now has new meanders, deep pools, new flood terraces, rebuilt floodplains, riparian vegetation, verdant pasture grasses, and banks stabilized with locally obtained root wads, tree trunks, and boulders. The current is focused into the center of the channel by strategic placement of "vortex rocks" in the channel to aim the force of the water away from the banks. The new stable channel complex has a natural look, compared with cement trapezoidal channels, levees, and riprapped banks. The fishing is a delight to landowner and visitors alike.
References
Clean Water Act of 1977. P.L. 95–217, Dec. 27, 1977, 91 Stat. 1566.
Rosgen, D.L. 1988. A Stream Classification System. Pp. 163–179 in K.M. Mutz et al., eds., Restoration, Creation and Management of Wetland and Riparian Ecosystems in the American West, pages 163–179. A Symposium of the Rocky Mountain Chapter of the Society of Wetland Scientists, November 14–16. PIC Technologies, Inc./ CRS Sirrine, Inc., Denver, Colo.
THE KISSIMMEE RIVERINE-FLOODPLAIN SYSTEM
John J. Berger
I wondered... about this passion to make a place into something it isn't. We irrigate the desert and drain Florida. I suppose we'd bulldoze the Rockies if we could find a big enough bulldozer... What made south Florida unique was singled out for eradication.
G. Norman, 1984
Introduction
The restoration of the Kissimmee River needs to be understood in the larger context of the effort to restore the Florida Everglades. The Kissimmee River was once a broad, meandering 103-mile-long waterway that drained an upper basin consisting of a chain of lakes (Figure A.11). The river then flowed slowly through an expansive marshy floodplain into Lake Okeechobee, its southern terminus. The Kissimmee River basin, the enormous lake, and the Everglades together
formed a 9,000-square-mile hydrological system. (The connection between the lake and the Everglades was intermittent, mainly during or after the rainy season, when water flowed over the lake
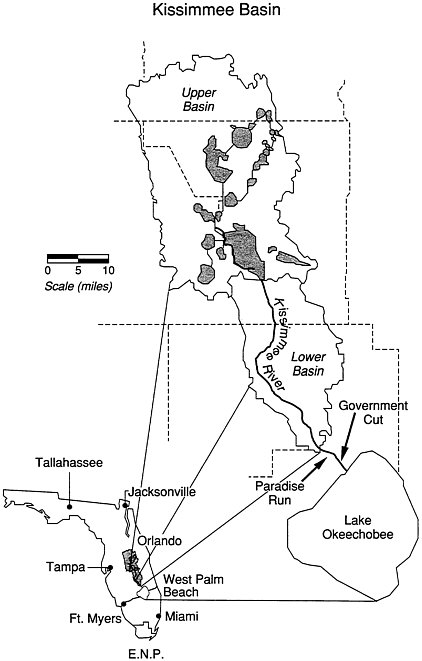
FIGURE A.11 Kissimmee River basin and Lake Okeechobee area. Source: Reprinted by permission of the South Florida Water Management District, n.d.
brim in a sheet. Although the connection was intermittent, the habitat that received periodic inundation was continuous.)
Then in 1961, the U.S. Army Corps of Engineers (COE), in response to a request from the state of Florida, began a far-reaching flood control program on the Kissimmee that brought major ecological changes to the river and its floodplain. The COE is currently conducting a feasibility study and design work for an effort to restore some of the natural hydrological functions that were lost in the course of that flood control effort. Restoration of the Kissimmee River would be a centerpiece of the effort to restore the Kissimmee-Okeechobee Everglades ecosystem. This case study describes the Kissimmee River Restoration Demonstration Project, begun in the late 1980s, and assesses that experiment in the context of (1) ecological changes that have taken place in South Florida and (2) the state's comprehensive program to restore the Everglades.
Predisturbance Ecological and Hydrological Conditions
The Everglades to the south of Lake Okeechobee was once a vast, gently sloping area of wet marsh, tussocks, bayous, ponds, and sloughs inundated from the north by clean water that spilled gently over the brim of Lake Okeechobee (Brumbach, 1990). Water emptying out of Lake Okeechobee after heavy rains formed a shallow sheet 40 to 60 miles wide that flowed across much of the Everglades, which covered most of southeast Florida. From the inland freshwater marshes that compose most of the Everglades, the water continued south through mangrove swamps into coastal salt marshes and then into Florida Bay. As recently as 100 to 130 years ago, relatively little drainage of wetlands and, hence, little damage to the entire Kissimmee-Okeechobee-Everglades ecosystem had occurred.
Along the margins of the Kissimmee-Everglades floodplain marshes was wet prairie, home to diverse grasses, forbs, and rushes with their seeds, bulbs, and rhizomes. This prairie provided a valuable feeding, resting, nesting, and breeding ground for a great variety of wildlife, including species now extinct, rare, or endangered, such as the Florida panther.
Among the profusion of life in the Kissimmee-Everglades waterways and marshes, billions of shrimp grazed on algae and zooplankton. Above the shrimp on the complex trophic web, other billions of small fish fed, supporting the legions of multicolored wading and diving birds that foraged in the water for crustaceans and fish.
In the Kissimmee basin during the rainy season, river water would flow over adjacent lands, providing habitat and nourishment for the
multitude of fish, invertebrates, and other aquatic life. During the dry season, the marshes slowly drained their nourishing contents back into the river, concentrating flood organisms there for large fish, waterfowl, and alligators.
FEDERAL FLOOD CONTROL EFFORTS
South Florida, a hurricane-prone land, was hit by several hurricanes in the 1920s. After a 1928 hurricane broke a low dike around Lake Okeechobee and caused a flood that took more than 2,000 lives, the federal government launched a major flood control program in South Florida, and COE impounded Lake Okeechobee with a 20-ft-high levee (Brumbach, 1990). More hurricane-induced flooding in the 1940s in the upper Kissimmee lakes basin and throughout South Florida led the state of Florida to request additional federal flood control help in the Kissimmee River basin (Dreher, 1986). The COE responded to the state's desire for flood control and developable land by proposing the excavation of a canal from Lake Kissimmee to Lake Okeechobee to replace the Kissimmee River (U.S. DOI, 1958). ''The primary purpose of the Kissimmee River development [was] to permit improvement or more intensive use of grazing lands within the basin" (U.S. DOI, 1958).
Over the objections of the U.S. Fish and Wildlife Service, which proposed alternative flood control plans that did not require conversion of the Kissimmee River into a canal (U.S. DOI, 1958), COE in 1961 began the channelization effort that transformed the slow, winding, shady river, with its renowned largemouth bass fishery, into a straight, deep, unshaded 56-mile canal. The new channel was uniform in geometry, with water levels controlled by electrically operated steel and concrete locks that divided the river into five, reservoir-like, longitudinal pools. The results of this technological fix were far-reaching.
ECOLOGICAL IMPACTS OF WATER MANAGEMENT
Hydrology was the principal factor that made the Kissimmee-Okeechobee-Everglades ecosystem unique, and hydrological change brought ecological problems. The channelization of the Kissimmee River and the destruction of much of its associated wetlands and floodplains, the leveeing of Lake Okeechobee, the drainage of its wetlands, the digging of hundreds of canals, and, the construction of east-west roads, all interrupted the natural timing and flow of clean water into the Everglades (Brumbach, 1990). Even National Park
status was not enough to prevent water control activities beyond park boundaries from bringing severe ecological degradation—in the form of periodic desiccation, flooding, and water pollution—to the Everglades and to much of its surroundings.
So scant did the water flow become at times that salt water seeped into freshwater streams and aquifers in parts of the Everglades. As water tables dropped, rapid land subsidence occurred in places such as the Everglades Agricultural Area just south of Lake Okeechobee. Oxidation ate away fragile peat soil. As the soil dried out and turned to dust, winds eroded it, sometimes down to the porous limestone bedrock. Elsewhere during the dry season, desiccated marshes caught fire and burned.
As hydrologic conditions changed, wildlife in vast numbers perished or departed. The wading bird population of South Florida has plummeted 90 percent since the 1930s (Lancaster, 1990) and is only 5 percent of what it was before drainage efforts began in the nineteenth century (Brumbach, 1990).
Ecological Effects of the Kissimmee River Channelization
The channelization of the Kissimmee River alone drained 34,000 acres of Kissimmee floodplain wetlands, wiping out 5 billion small fish and 6 billion shrimp (Loftin et al., 1990; Toth, 1990). In addition, 13,000 acres of natural Kissimmee wetlands were converted to "impounded wetlands," resulting in a loss of ecological values (Loftin et al., 1990). Another 7,000 acres of wetlands were obliterated along with about 35 miles of the original river channel when COE's new C-38 canal was excavated (Loftin et al., 1990), and the excavated spoil was piled along the canal banks to form levees. Six indigenous species of fish were extirpated from the river in the process (Toth, 1990).
Channelization caused profound alterations in the riverine-flood-plain hydrologic system—changes in the hydroperiod, amounts of flow, rates of flow, flow distribution, and smoothness of the seasonal transition from high to low flows (Loftin et al., 1990). Natural hydroperiods were eliminated in favor of stable water levels. After channelization, stagnant sections of the old river channel remained as oxbows off the excavated canal but retained little habitat value because of low water flow, large in-channel accumulations of submerged organic matter, and consequent low dissolved oxygen levels (Loftin et al., 1990; Toth, 1990).
Water quality degradation in the Everglades, the Kissimmee, and Lake Okeechobee soon followed the flood control projects. Wastewater from sugarcane fields was regularly drained into the Everglades
and Lake Okeechobee. Currently it drains southward of the lake into water conservation areas from which it enters the Everglades. The water contains large quantities of fertilizer-derived phosphorus and nitrogen that promote the proliferation of algae and cattails, the latter replacing native plants of higher ecological value to wildlife. Flood control activities in the Kissimmee basin also stimulated agricultural development on adjacent lands, sending contaminated runoff into the Kissimmee canal. As it flowed from the canal into Lake Okeechobee, the polluted water exacerbated the lake's grave eutrophication problem.
Agricultural enterprises in Florida are still allowed to pump polluted water into the Everglades pursuant to exemptions under the federal Clean Water Act of 1977 (P.L. 95–217). In 1988, U.S. Attorney Dexter W. Lehtinen sued both the South Florida Water Management District and the state's Department of Water Resources for allowing this. The suit was suspended for 2 months in February 1991 as part of a state-federal agreement to work together on a water cleanup plan (New York Times/ AP, 1991; Schneider, 1991).
Although the canal replacing the Kissimmee River is by no means biologically dead, the Kissimmee River as a naturally flowing riverine-wetland system has ceased to exist. Everglades National Park, too, is in jeopardy: "Scientists, public officials and leaders in the National Park Service have known for years that the Everglades are dying" (Schneider, 1991). According to Park Superintendent Robert S. Chandler, the park is "at a stage of biological collapse" (Schneider, 1991).
Impetus to Restore Lost Ecological Values
An extensive, publicly funded program is now being pursued to save the Everglades. The program includes restoration of a more natural flow regime to the park, filling of drainage canals, expansion of the park by 107,000 acres, proposed treatment of agricultural wastewater by sending it through experimental cattail marshes, and proposed restoration of the Kissimmee River to much of its serpentine river channel. The estimated price tag was $700 million. Of all these measures, the Kissimmee restoration project at $300 million is by far the most expensive. Recent cost estimates for the Kissimmee restoration are $422 million.
The Kissimme channelization was opposed from the start by conservation groups and by others, as previously noted. The Governor's Conference on Water Management in South Florida and the Central and South Florida Flood Control District began calling for reflooding
the Kissimmee wetlands in 1971, even before COE was through with its work (Dreher, 1986). These objections soon led the Florida legislature to initiate a study to assess the impacts of channelization on the Kissimmee River and Lake Okeechobee (Dreher, 1986).
In 1976 the Florida legislature passed the Kissimmee River Restoration Act (Chapter 76–113, Florida Statutes) and established the Coordinating Council on the Restoration of the Kissimmee River Valley and Taylor Creek-Nubbins Slough Basin (KRCC) to guide the restoration of water quality in the Kissimmee River basin (Florida Statutes, 1976). The legislature directed the coordinating council to consider the merits of partial or total restoration of the Kissimmee River and to develop measures that would restore natural seasonal water-level fluctuations and make maximum use of the natural and free energies of the river (Florida Statutes, 1976). After 7 years of restoration studies, the coordinating council in 1983 issued a report that called for dechannelization of the Kissimmee River along with other measures (Dreher, 1986; Toth, 1991). The report, a milestone in the restoration effort, specifically recommended that the South Florida Water Management District (SFWMD) begin development of a program to dechannelize the Kissimmee River (McCaffrey, 1983). In complying with this recommendation, the district initiated its demonstration project (to be discussed later). The council then went out of existence in keeping with a "sunset" provision in the Kissimmee River Restoration Act of 1976 (Florida Statutes, 1976).
Florida Governor Bob Graham immediately replaced the council on November 4, 1983, by issuing an Executive Order creating the Kissimmee River-Lake Okeechobee-Everglades Coordinating Council (KOECC) to coordinate and promote restoration efforts in the Kissimmee River-Lake Okeechobee-Everglades ecosystem (Graham, 1983). The new council's mandate was broader than its predeccessor's and included avoidance of further destruction of natural systems, reestablishment of ecological functions, improvements in overall management, and environmental preservation (Graham, 1983). The heads of six state agencies were appointed to the council by Governor Graham and were required to actively implement its restoration program (SFWMD, n.d.). That requirement greatly spurred the state's restoration efforts.
A major landmark in the effort to restore the Everglades and related ecosystems was Governor Graham's Save Our Everglades Program of 1983, which enlisted federal, state, and regional agencies in the effort (Brumbach, 1990) and included a call "to reestablish the values of the Kissimmee River" (State of Florida, 1983). It also contained a direct appeal to President Ronald Reagan for his support.
This well-publicized, comprehensive program captured the public's imagination and helped generate broad support for the goal of reestablishing the natural ecological functions of the Everglades, Lake Okeechobee, and the Kissimmee River (State of Florida, 1983). However, it did not go into much detail about the Kissimmee River. The SFWMD then, at Governor Graham's request, formulated a more detailed, seven-point Kissimmee River Restoration Strategy, which Governor Graham approved in 1985 (Loftin et al., 1990). It called for continuation of the SFWMD's demonstration restoration project, detailed monitoring of the project, expedited floodplain land acquisition, water quality improvement, and pursuit of restoration options that included dechannelizing the river by filling the C-38 canal (the designation given by COE to the channelized river).
Responding to the previously mentioned recommendation by the 1977 KRCC to the SFWMD to begin a dechannelization program (McCaffrey, 1983), the district in 1984 had begun a $1.4 million (excluding staff costs) experimental restoration demonstration project along a 12-mile stretch of the canal (between locks S-65A and S-65B) 14 miles due west of Sebring, Florida. This project's goal was to field test "methods of reestablishing a more natural water regime in the Kissimmee Valley" (SFWMD, n.d.) and was a highly significant step toward restoration of the Kissimmee.
Kissimmee River Restoration Demonstration Project
The physical restoration work was conducted in Pool B of the canal and began with construction of three notched weirs (steel walls) in the channelized river, which COE calls the C-38 canal. The plan was to reflood 1,300 acres of drained wetlands on the river floodplain and to increase water flow in remnant sections of the old river channel. The establishment of a 300-acre flow-through marsh was also attempted (Toth, 1991).
Other aspects of the demonstration project were adoption of a new water flow fluctuation schedule and conduct of hydrologic and hydraulic modeling studies. (Variations in stage and discharge regimes are important in creating a diverse mosaic of wetland plant communities [Toth, 1991].) The SFWMD, the Florida Game and Fresh Water Fish Commission, and the Florida Department of Environmental Regulation all agreed to share in monitoring and evaluating the demonstration project.
The focus of SFWMD monitoring was the effect of hydrologic changes on floodplain vegetation, floodplain fish, secondary productivity, benthic invertebrates, and river channel habitat characteristics (Toth,
1991). Data were collected from July 1984 to November 1988. The other Florida agencies agreed to count alligators, conduct bird surveys, sample fish populations, and monitor water quality and aquatic macroinvertebrate and periphyton responses (Toth, 1991).
Transects through representative postchannelization floodplain communities were set up in the Pool B floodplain, and aquatic invertebrates were sampled along the transects to measure changes in secondary productivity. Fish utilization was also measured. River channel cross sections were used to evaluate changes induced by increased flow in river channel habitat, bottom morphology, sediment characteristics, benthic invertebrate densities, and community structure.
DEMONSTRATION PROJECT RESULTS
The water-level manipulations and increased flow through remnant river channels produced encouraging results. Whereas the demonstration project experiment by no means "restored the Kissimmee River," it did demonstrate that wetland vegetation and other wildlife would readily recolonize the reflooded areas, and that riverine ecosystems would respond favorably to resumption of natural flow regimes. In response to seasonal and intermittent flooding, a diverse complement of wetland species became reestablished. Investigators found that inundation periods of 1 to 2 years may be the fastest way of reestablishing wetland species and that prolonged annual hydroperiods of about 250 days "shifted the competitive environment in favor of hydrophytic species" (Toth, 1991). The responses of the vegetation also proved that the reproductive potential and seedbank of many wetland plants were conserved over the more than two decades since drainage (Toth, 1991).
Although the frequency and distribution of wetland species increased in response to increased inundation, xerophytic and mesophytic species receded. In general, "plant community responses to Demonstration Project components showed that restoration of wetland communities on the Kissimmee River floodplain is feasible" (Toth, 1991). The experiment also provided evidence that some fish and invertebrate recolonization could be induced and that increased bird utilization of the floodplains could be expected. Restoration of water flow to the old river channels also helped reestablish more natural substrate characteristics, channel morphology, and benthic species diversity (Toth, 1991). The increased flow through the remnant channels swept away much organic debris and increased channel cross-sectional areas.
In many parts of the experimental area, the extent and depth of flooding and drying of the floodplain were not comparable to
prechannelization conditions, and return drainage from floodplain to river channel occurred far more rapidly than in the natural prechannelization system, because the floodplain is very efficiently drained by the canal as soon as increased regulated water discharges from the upper Kissimmee lakes cease. Another departure from natural conditions was caused by the fact that water discharges from the upper Kissimmee basin depended on the Kissimmee lakes regulation schedules. This resulted in discharges during lake drawdown periods from January to April, rather than during the wet season months. In addition, the notched weirs installed in the C-38 canal to partially block it were inefficient in diverting water from the canal into the remnant river reaches and floodplains when discharges into the canal fell below 28 cubic meters per second.
In addition, the planned flow-through marsh could not be evaluated by demonstration project scientists because drainage of water from the site was impeded by a transverse ridge and spoil pile that impounded water instead of permitting it to flow over the site. River flow regimes also contrasted sharply in quantity and timing with prechannelization characteristics and included some no-flow periods (Toth, 1991). Before channelization, river flow had been continuous, with frequent overbank flow and much base flow (Toth, 1991). To summarize, "Because key hydrologic characteristics were not adequately reestablished, most structural and functional aspects of floodplain ecosystem integrity were affected temporarily and/or only partially restored" (Toth, 1991). Due to these constraints, the demonstration project achieved only partial success as an ecosystem restoration. It was, however, a very significant success as a demonstration that restoration of riverine-floodplain values and functions is possible. "It was not intended to restore the river or any section of the river," asserted project biologist L.A. Toth. "We demonstrated we can affect very positive changes to the biology of the system'' (L.A. Toth, South Florida Water Management District, personal communication, 1991). Former project manager M. K. Loftin agreed: "The demonstration project was an overwhelming success, because it showed that when water conditions were correct, biological recovery was tremendous, and when water conditions were adverse, it showed catastrophic declines" (K. A. Loftin, former project manager, Kissimmee Alternative Plan Evaluation and Preliminary Design Report, South Florida Water Management District, West Palm Beach, Fla., personal communication, April 24, 1991). The demonstration project thus provided evidence that once more natural hydrological conditions have been restored to the lower Kissimmee basin by filling the C-38 canal, significant ecological recovery of the riverine-floodplain system is likely.
The end result of the demonstration project's scientific monitoring effort and the related hydrologic modeling studies was a recommendation by the SFWMD study team to backfill "long, continuous reaches of C-38" as the only way to restore the ecological integrity of the Kissimmee River and about 22,000 acres of its original floodplains. This backfilling option, known as the Level II Backfilling Plan, had previously been endorsed by Florida Governor Bob Martinez (L. A. Toth, South Florida Water Management District, personal communication, 1991).
Consistent with the Committee on Restoration of Aquatic Ecosystems' general procedural recommendations for restoration planning and evaluation, the SFWMD study team recommended that, in preparation for the major river restoration effort to come, baseline data should be collected immediately "on all components of the ecosystem, including wading birds, waterfowl, fisheries, fish communities, habitat, water quality, and ecosystem function. . ." (L.A. Toth, South Florida Water Management District, personal communication, 1991).
The fundamental challenge now remaining for Kissimmee restoration planners is to bring about the restoration of ecological integrity—species composition, physical structure, and ecological functions—of the Kissimmee's riverine-floodplain system, while avoiding unwanted future flood drainage.
Political Context
The pivotal role played by former Governor Bob Graham and his staff in establishing and providing firm guidance to the Kissimmee River-Lake Okeechobee-Everglades Coordinating Council, in launching Florida's Save Our Everglades Program in 1983, and in lobbying federal officials for their support in protecting the Everglades illustrates the tremendous political power that a governor committed to ecological restoration can wield. Not only can governors appoint ecologically minded individuals to regional management councils and water management districts, they can also propose and sponsor legislation supportive of restoration. Governor Graham, for example, strongly supported Florida's Save Our Rivers Act in 1981 to provide $300 million for the acquisition of river floodplains, wetlands, and recharge areas. In addition, Governor Graham backed a comprehensive statewide water policy that encouraged use of nonstructural water management methods, instead of ditches, dams, and levees. He also supported and approved the state's 1984 Wetlands Protection Act and proclaimed 1984 as the Year of the Wetlands. Governor Graham's successor, Governor Bob Martinez, also played a crucial
role in the restoration program by galvanizing commitment to the most expensive of the Kissimmee restoration options, the dechannelization plan known as the Level II Backfilling Plan. Governor Martinez was also instrumental in persuading the SFWMD board to adopt that option (K. A. Loftin, former project manager, Kissimmee Alternative Plan Evaluation and Preliminary Design Report, South Florida Water Management District, West Palm Beach, Fla., personal communication, April 24, 1991).
Florida's current Governor, Lawton Chiles, has pledged to work with Senator Graham and the Florida delegation to obtain congressional appropriations for the East Everglades addition to the park and to continue restoration of water flows to the Shark River Slough area. In his first address after taking office in 1991, Governor Chiles, speaking to the Sixth Annual Everglades Coalition Conference, adopted the Save the Everglades Program and made restoration of the Kissimmee-Okeechobee-Everglades ecosystem his number one environmental policy.
By making an example of his or her own deep convictions about restoration, a governor can make restoration a high statewide priority. It is hard to imagine how a restoration program as challenging, controversial, and expensive as the program to restore the Kissimmee-Okeechobee-Everglades ecosystem could have gotten as far as it has without powerful leadership from the state's top executive. National and local environmental organizations have also been very active over the years on behalf of the restoration and protection program through a host of public education activities and lobbying.
Restoration Goals, Objectives, and Criteria
The overall mission of the restoration program was vividly articulated in the governor's Save Our Everglades Program of 1983: "Florida must take action to rejuvenate the Kissimmee-Okeechobee-Everglades ecological system and the environment of south Florida. Although the system can never be the same as it was before [drainage], many of its natural functions and values can be restored while providing water supplies and flood protection to south Florida." The standard against which the program was to be evaluated was to be its degree of success in ensuring "that the Everglades of the year 2000 looks and functions more like it did in 1900 than it does today" (State of Florida, 1983).
The Kissimmee River Restoration Symposium in October 1988 served a vital role in clarifying the approach to the Kissimmee restoration and underscored that the only way to realize the environmental goals identified in both the Kissimmee River Restoration Act of
1976 and Governor Graham's 1983 Executive Order would be by adopting a "holistic, ecosystem restoration perspective" (Loftin et al., 1990). (Further discussion of restoration in the Everglades took place in 1989 at another symposium (SFWMD, 1991.)
After years of studies and debates in Florida over what to do about the damage to the Kissimmee, a consensus emerged at the 1988 restoration symposium on what the specific goals and objectives for the Kissimmee River restoration ought to be. Reestablishment of the Kissimmee River ecosystem's ecological integrity emerged as the primary restoration goal. In addition, it was agreed that four broad goals needed to be accomplished and were to serve as guidelines for any major Kissimmee River restoration work:
-
Restoration should use the natural and free energies of the river system (not those of an impounded, highly managed system).
-
The natural ecological functions of the river system were to be restored.
-
The physical, chemical, and biological integrity of the river system was to be restored and maintained.
-
Lost environmental values were to be restored.
It was understood that in the restoration to come, these goals had to be met, subject to the retention of a specified level of flood control and without causing major adverse impacts to navigation, water supply, water chemistry, or sedimentation (Loftin et al., 1990).
Once these goals were agreed upon, detailed comparative studies of the Kissimmee riverine-wetlands system (Toth, n.d.; Toth, 1990) were performed, and five critical evaluation criteria were developed for use in appraising alternative methods of restoring the Kissimmee. The evaluation criteria were the following (from Loftin et al., 1990):
-
continuous flow with duration and variability characteristics comparable to prechannelization records;
-
average flow velocities between 0.8 and 1.8 feet per second (ft/s) when flows are contained within channel banks;
-
a stage-discharge relationship that results in overbank flows along most of the floodplain when discharges exceed 1,400 to 2,000 cubic feet per second;
-
stage recession rates on the floodplain that typically do not exceed 1 ft per month; and
-
stage hydrographs that result in floodplain inundation frequencies comparable to prechannelization hydroperiods, including seasonal and long-term variability characteristics.
Alternative Plan Evaluation
A major study was then conducted by the South Florida Water Management District, with hydrological modeling support from researchers of the University of California, Berkeley, to evaluate four principal alternative Kissimmee River restoration plans in terms of the above criteria (Loftin et al., 1990). The following four plans were evaluated:
-
Rely on weirs to restore river flow from the canal to remnant section of the old river channel and, under some conditions, to the floodplain.
-
Block small portions of the canal with earthen plugs to produce the same effects as the first plan.
-
Extend the plugs from the same locations in the second plan so as to block longer sections of the canal, leaving portions of the canal at junctions, and to link portions of the original river channel.
-
Fill as much of the canal as possible without affecting flood control in the Upper Kissimmee River basin and at the outlet of the lower basin. (This option has become known as the Level II Backfilling Plan.)
The evaluation team concluded that only the fourth alternative plan, Level II Blackfilling, would restore the ecological integrity of the riverine-floodplain system. All other options "would result in excessive river channel velocities, rapid stage recession rates, [and] inadequate floodplain inundation. . ." (Loftin et al., 1990). The analysts projected that Level II Backfilling could reestablish "prechannelization hydrologic characteristics along 52 contiguous miles of river channel and 24,000 acres of floodplain."
The cost of the Level II Backfilling Plan was estimated at $291,600,000 making it the most expensive of all the alternatives studied. Combined with ancillary related waterworks, the total cost would be $343,520,000. As noted earlier, recent estimates are $80 million higher. Because flood control would be abandoned over parts of the floodplain, all the plans studied provide for land acquisition in the floodplain and for the acquisition of flowage (flooding) rights (Loftin et al., 1990). It is obvious that the cost of restoration far exceeds the cost of the channelization of the river.
Anticipated Restoration Benefits
Restoration of the Kissimmee ecosystem will have favorable effects on the Okeechobee-Everglades system to which it is linked. Restored
stored wetlands will retain water, improve water quality, reduce phosphorus input to Lake Okeechobee by 10 percent (Dreher, 1986), and aid in recharge of aquifers. The Kissimmee restoration will recreate the scenic beauty of a slowly meandering southern subtropical river with its floodplain marshes and abundant fish and wildlife.
Economists are not in agreement on the economic value of wetlands and have proposed estimates that differ by more than a factor of four (Dreher, 1986); they do generally agree, however, that the value is considerable. In addition, the project would prevent further floodplain development that might lead to sizable flood damage claims later and would also avert spending by counties in the area on infrastructure to support development. Tax losses would be "insubstantial" (Dreher, 1986).
Areas of Critical State Concern: A Mechanism for Encouraging Restoration
The lower Kissimmee River basin along with the East Everglades area was one of the state's 12 designated resource planning and management areas under an amendment to Florida's Areas of Critical State Concern Program (Graham, 1984; Brumbach, 1990). Each area was to have a resource and management committee under Chapter 380, Florida Statutes, to carry out tasks assigned to it. In the Kissimmee area, the governor charged the planning and management committee to work with local, regional, state, and federal agencies and private interest groups "to develop a Resource Management Plan for the lower Kissimmee River and Taylor Creek drainage basin" (Graham, 1984). The committee was directed to address issues of "land use management, land acquisition strategy, water quality protection and economic development," including a review of "local government comprehensive plans and implementing regulations such as zoning and subdivision ordinances'' (Graham, 1984). The committee was charged not only to provide policies for each issue identified but also to "assign implementation actions to appropriate federal, state, regional and local governments and a schedule for adoptions of these actions" along with measurable standards to ensure that these policies were carried out. Within 12 months of submitting its plan to the governor, the committee then had to evaluate its implementation by state, regional and local governments.
In response to this firm guidance, the Kissimmee River Resource Planning and Management Committee chose to concentrate on water issues and wrote a model floodplain ordinance for all counties in the
basin to adopt. The ordinance stated that low-intensity agriculture would be the highest-intensity land use allowed in the basin (K. A. Loftin, former project manager, Kissimmee Alternative Plan Evaluation and Preliminary Design Report, South Florida Water Management District, West Palm Beach, Fla., personal communication, April 24, 1991). One basin county adopted the ordinance; however, four have not. These counties will now have to submit their comprehensive growth management plans for review by the state's Department of Community Affairs. In general, if recommendations of a Resource Management Committee are not implemented by the local governing bodies, the state can then designate the locality as an Area of Critical State Concern and can set land use standards that the local government must meet. Having a resource planning and management committee is an alternative to being designated a state critical management area and is generally preferred by a locality to more explicit state control in which local areas must develop management plans that meet state standards. The Areas of Critical State Concern Program and the cogent directive given to the Kissimmee River committee are well worth study by resource managers interested in new institutional mechanisms for guiding complex restoration programs (Graham, 1984).
Current Status of the Kissimmee River Restoration
Congress in 1990 agreed to appropriate another $6 million in federal funds for the Kissimmee restoration, bringing the total federal contribution to $12.3 million in addition to the $20 million put up by the state of Florida (Woody, 1991). Federal spending was originally authorized under Section 1135 of the Water Resources Development Act (amended).
At the insistence of U.S. Senator and former Florida Governor Bob Graham, the 1990 version of the act directed the COE to do a feasibility study on the Level II Backfilling Plan recommended by the Alternative Plan Evaluation and Preliminary Design Report of the SFWMD (Loftin et al., 1990). The act also requires COE to submit the final feasibility report to Congress by April 1, 1992, and to complete a design memorandum, construction bidding plan, and all other preparatory work for the the Kissimmee restoration by June 1, 1994 (Executive Office of the Governor, 1991). The COE in conjunction with the SFWMD is already doing design work on water control modifications that will be required in the upper Kissimmee lakes basin, and the SFWMD is acquiring flowage easements over floodplain lands so that more water can be stored in the headwaters region (R. Smith, government analyst,
State of Florida, Governor's Office of Planning and Budgeting, Environmental Policy Unit, personal communication, April 25, 1991).
The state of Florida has told the Office of Management and Budget (which opposed funding the whole Kissimmee restoration in 1990) that the full-scale Kissimmee restoration project, a 10- to 15-year effort, is the state's highest-priority project for inclusion in the 1992 Water Resources Development Act (T. Woody, personal communication, 1991). Meanwhile, the first phase of the project—modifications of the upper chain of lakes north of the Kissimmee by COE—can proceed in order to increase year-round water flow to the Kissimmee.
With the state of Florida solidly behind it, the biggest hurdle faced by the restoration program may be obtaining federal support in a recessionary period of large federal budget deficits—over the possible objections of the Office of Management and Budget and perhaps others in the Bush administration. If federal funds were appropriated by Congress as part of the 1992 Water Resources Development Act, Section 1135, the program could move forward decisively toward its final goal. Inclusion in the act would provide the federal cost sharing necessary for COE to conduct the dechannelization work. That role would be consistent with what some observers believe is COE's desire to be the environmental engineers of the 1990s.
Conclusion
The Kissimmee River Demonstration Project was the largest restoration project examined by this committee. (The much larger planned restoration of the Kissimmee River and the Everglades would probably be the largest restoration in the nation.) Several conclusions can be reached about the Kissimmee demonstration effort:
-
Although the general public eventually recognized the need to restore the river and its wetlands, and the citizens initially provided the impetus for restoring the river, many people believed this could be done merely by replacing the material removed during channelization, and that everything would then return to predisturbance ecological conditions. Scientists and engineers in the South Florida Water Management District had to make a major public education effort to acquaint people with the complexities of ecological restoration.
-
Because explicit goals for the Kissimmee restoration were set in advance, a number of alternative plans were excluded from consideration. For example, there could have been a minimal plan, such as regulating water levels differently in the canal or creating floodplain
-
impoundments. Both measures would have created more wetlands but would not have resulted in restoration of ecological integrity as defined in this report. They would instead have created a substitute ecosystem quite different from the one preceding channelization.
-
Although the words "self-maintaining" were not explicitly used, the requirement for using the natural and free energies of the river system and restoring and maintaining physical, chemical, and biological integrity has essentially the same effect. Nonetheless, all restoration options evaluated will require some regular maintenance.
-
The South Florida Water Management District wisely avoided establishing biological criteria in terms of numbers of fish or waterfowl to be restored. This would almost certainly have resulted in battles among different user groups, such as anglers, hunters, and bird watchers. More importantly, management for these particular species-oriented values would not have permitted natural, successional, and evolutionary ecosystem processes to operate. "No criteria specifying individual species requirements, whether alone or in combination, will reestablish the complex food webs, habitat heterogeneity, and physical, chemical and biological processes and interactions that determined the biological attributes of the former system" (Loftin et al., 1990).
-
The South Florida Water Management District prudently had a much more extensive scientific peer-review process than many restoration projects have, although others, such as the Des Plaines River restoration project, had scientific peer review. Intensive peer review lends credibility to restoration studies and makes more expertise and vision available to the restoration project.
-
The use of hydrologic models to estimate probable outcomes for some of the nonbiological aspects of alternative restoration plans reduced uncertainty about these outcomes.
-
Monitoring of the full-scale Kissimmee River restoration, should—like the restoration itself—be designed from an ecosystem perspective in order to "provide a thorough understanding of the ecosystem—with and without restoration; show direct cause and effect relationships between restoration measures and ecological responses; include quantified biological responses; and document changes that are of importance to society, as well as scientifically important" (Toth, 1991).
-
The Kissimmee River Demonstration Project and the Kissimmee River Alternative Plan Evaluation studies were particularly valuable in showing that the cost of restoring a riverine system is considerably greater than the cost of channelizing it, and that many important ecological values of the riverine-floodplain system can be restored if prompt and decisive action is taken by a competent, properly funded interdisciplinary team.
Acknowledgement
My thanks to John Cairns, Jr., for contributing to the preparation of this case study. The committee wishes to thank Louis A. Toth of the South Florida Water Management District for briefing it on ecological impacts to the Kissimmee River system and on restoration efforts, and for providing the committee with documents essential for understanding the situation. The committee also especially wishes to thank M. Kent Loftin, former project manager, Kissimmee River Alternative Plan Evaluation, SFWMD; Patricia Sculley of SFWMD; and Rick Smith, government analyst, State of Florida Governor's Office of Planning and Budgeting, Environmental Policy Unit, for their assistance.
References
Brumbach, B. 1990. Restoring Florida's Everglades: A Strategic planning approach. In J. Berger, ed., Environmental Restoration: Science and Strategies for Restoring the Earth. Island Press, Washington, D.C.
Clean Water Act of 1977. P.L. 95217, Dec. 27, 1977, 91 Stat. 1566. Dreher, R. G. 1986. Comments Regarding Final Feasibility Report and Environmental Impact Statement, Kissimmee River, Florida. To Board of Engineers for Rivers and Harbors, U.S. Army Corps of Engineers. Printed material by Sierra Club Legal Defense Fund, Inc., San Francisco, Calif.
Executive Office of the Governor. 1991. Everglades Status. A report prepared by the Office of Environmental Affairs, Tallahassee, Fla. January 15.
Florida Statutes. 1976. Kissimmee River Restoration Act. Chapter 76–113, Laws of Florida. Section 373.1965 (1976 Supplement). Kissimmee River Valley and Taylor Creek-Nubbins Slough Basin: Coordinating Council on Restoration Project Implementation.
Graham, B. 1983. Executive Order Number 83–178. State of Florida, Office of the Governor, Tallahassee, Fla.
Graham, B. 1984. Letter to Mr. Timer E. Powers, Chairman, Kissimmee River Resource Planning and Management Committee. August 9.
Lancaster, J. 1990. Monumental salvage job is planned for Everglades. The Washington Post. February 20.
Loftin, K. A., L. A. Toth, and J. T. B. Obeysekera. 1990. Kissimmee River Restoration: Alternative Plan Evaluation and Preliminary Design Report. South Florida Water Management District, West Palm Beach, Fla. June.
McCaffrey, P. N. 1983. Memorandum of Findings and Recommendations Adopted at August 19, 1983 Meeting. Coordinating Council on the Restoration of the Kissimmee River Valley and Taylor Creek-Nubbin Slough Basin, Tallahassee, Fla. August 22.
New York Times/AP. 1991. U.S.-Florida deal raises Everglades cleanup hope. February 21.
Norman, G. 1984. Justice, just in time. Esquire. January.
Schneider, K. 1991. Returning part of Everglades to nature for $700 million. New York Times. March 11.
South Florida Water Management District (SFWMD). n.d. A Closer Look. Kissimmee River Restoration, Phase 1—A Demonstration Project. P10 261 Rev 386 5M. West Palm Beach, Fla.
South Florida Water Management District. n.d. Florida's Kissimmee River—A Restoration Plan. West Palm Beach, Fla.
South Florida Water Management District. 1991. Spatial and Temporal Patterns as Guidlines for Ecosystem Restoration. Environmental Sciences Division, South Florida Water Management District. West Palm Beach, Fla.
State of Florida, Office of the Governor. 1983. Save Our Everglades Program. Press release and issue paper. August 9.
Toth, L. A. n.d. An Ecosystem Approach to Kissimmee River Restoration Monograph. Environmental Sciences Division, South Florida Water Management District, West Palm Beach, Fla.
Toth, L. A. 1990. Impacts of Channelization on the Kissimmee River Ecosystem. Monograph. Kissimmee River Restoration Symposium (October 1988). Environmental Sciences Division, South Florida Water Management District, West Palm Beach, Fla.
Toth, L. A. 1991. Environmental Responses to the Kissimmee River Demonstration Project. Technical Publication 91-02. South Florida Water Management District, West Palm Beach, Fla.
U.S. Department of the Interior (DOI). Fish and Wildlife Service. 1958. Bureau of Sport Fisheries and Wildlife, Office of Regional Director, Region 4. Atlanta, Ga. A Detailed Report of the Fish and Wildlife Resources in Relation to the Corps of Engineer's Plan of Development, Kissimmee River Basin, Florida. Prepared by Branch of River Basins, Vero Beach, Fla. December 17.
Woody, T. 1991. News from the Kissimmee. Everglades Update. March–April.
Wetlands
BOTTOMLAND HARDWOOD WETLAND RESTORATION IN THE MISSISSIPPI DRAINAGE
Rebecca Sharitz
The lower Mississippi floodplain was selected as a case study because it provides an example of large-scale disturbance in which the physical condition of the wetland area has been altered and cumulative impacts have occurred. Both public and privately owned lands are involved. Restoration efforts have been limited, and most have focused on reestablishment of forest species for timber or wildlife habitat values. Actual site restoration, including recovery of original hydrologic conditions, is uncommon. Success is typically measured on the basis of early establishment of desirable woody species. Most such restoration activities have been undertaken within the last decade, and long-term evaluations of their success are not available.
General Description and Locations
HISTORY AND BACKGROUND
At the time of European settlement, approximately 80 million hectares of forested wetlands existed in the conterminous United States (Gosselink and Lee, 1989). Although substantial harvesting of timber resources began with the coming of pioneers, drainage and clearing for agriculture were extensive by the middle of this century. By the 1950s, forested wetland had been reduced to about 27 million hectares, and by the mid-1970s to 24.4 million hectares (Gosselink and Lee, 1989). The loss rate from 1954 to 1974 was about 0.51 percent per year (Harris and Gosselink, 1990). Conversion to agricultural use has accounted for 87 percent of these wetland losses (Tiner, 1984).
TYPE OF DISTURBANCE
One of the best-documented examples of conversion of bottomland hardwood wetlands has been on the 9.8-million hectare Mississippi alluvial plain (Figure A.12). In 1937, bottomland hardwood forests covered 4.9 million hectares of this alluvial plain, but by 1977 they had been reduced to 2.2 million hectares of natural wetlands (MacDonald et al., 1979). The greatest forest loss resulted from conversion to croplands. Currently, along the lower Mississippi River, areas of bottomland hardwood forest still are being cleared for agriculture in tracts up to 12,000 ha at a time (Gosselink and Lee, 1989). Disastrous floods of the Mississippi River in 1927 and 1929 led to massive government programs of levee construction and a myriad of other water control works. As a result of the reduced flood frequency and duration, agricultural development increased and bottomland forests were cleared for row crops such as soybeans. Other major factors include the continuing increase in urban areas and related uses.
REPRESENTATIVE SITES
Two of the best remaining examples of bottomland hardwood forest are the 24,000-ha Delta National Forest in western Mississippi and the 22,000-ha Tensas River National Wildlife Refuge in northeastern Louisiana (Newling, 1990). Sites representing the historical effects and current restoration and reforestation activities include (1) areas of the Yazoo National Wildlife Refuge in west central Mississippi, (2) part of the Tensas National Wildlife Refuge, (3) the Ouachita Wildlife Management Area in central Louisiana, and (4) research
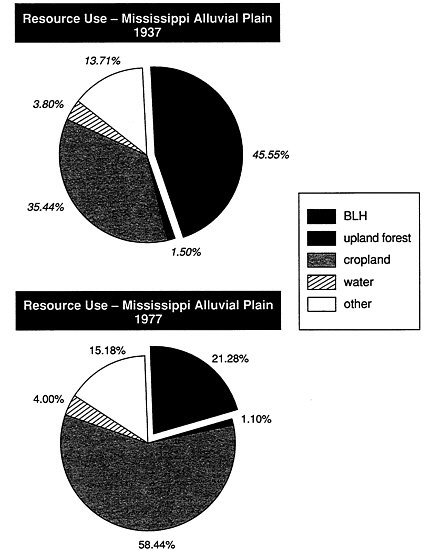
Figure A.12 Changes in resource use in the Mississippi alluvial plain from 1937 to 1977 (data fom MacDonald et al., 1979). SOURCE: Sharitz and Mitsch, 1991.
plots in the Delta Experimental Forest near the Southern Hardwoods Laboratory at Stoneville, Mississippi.
The Yazoo National Wildlife Refuge complex consists of five national wildlife refuges located on the Mississippi-Yazoo rivers alluvial plain. The total area is approximately 24,000 ha. Reforestation to enhance wildlife usage began in the early 1980s. At the Tensas National Wildlife Refuge on the Tensas River, management of "wet soil" areas with seasonal flooding and crops encourages waterfowl
and other wildlife use. Both sites are managed by the U.S. Fish and Wildlife Service, and have wildlife and waterfowl values of major importance. One of the largest bottomland forest restoration projects is currently under way near Monroe, Louisiana, where 1,821 ha purchased by the state in 1984 are being reforested to create a corridor between the existing Russell Sage and Ouachita wildlife management areas.
The Southern Hardwoods Research Laboratory is a research wing of the U.S. Forest Service's Southern Forest Experiment Station. Since the 1950s, some of the most complete and long-term research on regeneration of bottomland hardwood forests has been conducted on research plots established near this laboratory.
Political and Administrative Aspects
Public concern over losses of bottomland forests has increased in recent years with better awareness of the functions and values of wetlands and realization of the magnitude of past and continuing losses. However, most forested wetland restoration is driven by federal programs rather than by grassroots interests. Section 404 of the Clean Water Act of 1977 (P.L. 95–217), which requires that permits be issued by the U.S. Army Corps of Engineers for any discharge of dredged or fill material into the waters of the United States and adjacent wetlands, is intended to retard loss of wetlands, not restore them. Section 906 of the Water Resources Development Act of 1986 (P.L. 99–662) states that future mitigation plans for federal water projects should include specific plans to ensure that impacts to bottomland hardwood forests are mitigated in kind, to the extent possible (Haynes et al., 1988).
Opportunities for reestablishment occur when the initial loss or modification of the floodplain site, especially its hydrologic and geomorphologic condition, is not permanent and community reestablishment methods are technically feasible. These opportunities may include (1) reestablishment on abandoned, "high-risk" farmland in flood-prone areas; and (2) reestablishment in national forests, wildlife refuges and management areas, flood control projects, or public lands on which bottomland hardwood forest habitat serves management goals that are determined to be in the best public interest (Haynes et al., 1988).
The Food Security Act of 1985 (Farm Bill, P.L. 100–233), the Agricultural Credit Act of 1987, and Executive Orders 11990 and 11988 for protection of wetlands and floodplains provide for restoration of wetland habitat that is crucial to fish and wildlife resources and overall
biological diversity. Under the Farm Bill, wetlands are restored on areas previously converted to agriculture through (1) easements on Farmers Home Administration (FmHA) lands and (2) enrollment of lands in the Conservation Reserve Program (CRP). Conservation easements established by FmHA are administered as a part of the National Wildlife Refuge System. The CRP program provides for costsharing of bottomland hardwood establishment on flood-prone croplands. Agreements with private landowners are for a minimum of 10 years.
Other support for bottomland forest restoration results from the Water Resources Development Act of 1986, the North American Waterfowl Management Plan, and the Environmental Protection Agency's policy of no net loss to wetlands.
Scientific Basis
Most bottomland forest restoration projects focus on techniques of planting and establishing forest species. Some of the most extensive research in this area has been conducted at the Southern Hardwoods Laboratory and in the Delta Experimental Forest (e.g., Johnson and Krinard, 1987; Krinard and Johnson, 1987; Krinard and Kennedy, 1987). A critical factor is to achieve adequate hydrological conditions for forest establishment and development. Other important factors may include substrate stability, availability of adequate soil rooting volume and fertility, and control of herbivores and competitive weeds (Clewell and Lea, 1989).
Restoration success is commonly judged, at least in the early phases, by the success of tree seedling establishment. For example, Allen (1990) reported densities ranging from 87 to 914 trees per acre in 10 stands of 4 to 8 years in age in the Yazoo National Wildlife Refuge. He found survival and growth of planted seedlings to be generally higher than those obtained from direct seeding.
ECOLOGICAL MODEL VERSUS WHAT MEASURES SUCCESS
The goal of duplicating an original forest stand in terms of species composition and age, structure, and function can only be approximated. Natural forests are themselves in constant flux. Also, land use activities may have modified soil or hydrologic conditions to the point that duplication of the original forest is impossible and an altered forest community is the only option.
Clewell and Lea (1989) recommend five criteria for judging success:
-
The watershed area within the same ownership shall be functioning in a manner that is consistent with project goals.
-
The substrate shall be stabilized and any erosion shall not greatly exceed that expected under normal circumstances in natural forests.
-
There shall be a density of at least 980 potential overstory trees per hectare (400 per acre) that are at least 2 meters tall. All trees shall be preffered species and shall occur in proper zonation (e.g., hydric trees in wet sites).
-
There shall be adequate representation of undergrowth species.
-
Streams and standing water bodies shall be of sufficient water quality so as not to inhibit reforestation or interfere with the attainment of other success criteria.
Universal acceptance of these criteria has not been achieved. For example, a lower stocking density of 150 to 200 trees per acre is generally preffered for wildlife habitat and enhanced mas production. Emphasis on evaluating success needs to be placed on presence of preferred species (indigenous trees and undergrowth characteristic of mature stands). Once a threshold density of trees 2 m tall has been attained, survival is virtually assured (Clewell and Lea, 1989). Natural regeneration relative to achieving a diversity of tree species is also an important consideration. Haynes and Moore (1988) suggest that bottom-land hardwood forests planted on abandoned farmland could become self regenerating communities in 40 to 60 years.
RESEARCH BENEFITS AND NEEDS
Success criteria for evaluating wetland forest restoration projects in the Southeast are generally inadequately conceived. There are critical information gaps. For example, the silvicultural literature does not cover all aspect of wetland tree establishment, especially conditions conducive to natural regeneration and techniques for effective establishment of undergrowth species. Most important, research is needed to determine if successful forest replacement in terms of structure and species composition will provide the functions of the original wetland forest ecosystem.
Technical Basis
METHODS AND TECHNIQUES USED
Most research has been directed to methods of planting and establishing desired woody species. Much practical information comes from
the Southern Hardwoods Research Laboratory. Allen and Kennedy (1989) have produced a useful booklet on reforestation techniques for the landowner. They provide guidelines on planting techniques, including seed sources, seed storage, site preparation, and planting depth and spacing; a list of nurseries from which seedlings can be obtained; and guidelines on flood tolerance of bottomland forest species and their suitability for wildlife use and timber production.
A further review of forest wetland restoration in the southeastern United States is given by Clewell and Lea (1989), along with a discussion of success criteria and research needs. Haynes et al. (1988) have produced an annotated bibliography for reestablishment of bottomland hardwood forests on previuosly disturbed sites.
Typical costs of direct seeding in 1989 were about $40 to $60 per acre (Allen and Kennedy, 1989), whereas planting seedlings costs two or three times as much. The species most often planted are Nuttall oak (Quercus nuttallii), willow oak (Q.phellos), cherrybark aok (Q.falcata var. pagodaefolia), water oak (Q.nigra), Shumard oak (Q. shumardii) , and pecan (Carya illinoensis).
Direct seeding has several advantages: the costs is lower, and tree roots develop naturally without the disturbance caused by cutting roots and planting seedlings. A disadvantage of direct seeding is slower initial development of the forest and susceptibility of seeds to predation. Also, direct seeding is reliable only for oaks and, to a lesser degree, other large seeded species such as sweet pecan. Smaller seeds are most susceptible to heat and dry soil.
From a comparison of 4- to 8 year-old stands in the Yazoo National Wildlife Refuge, Allen (1990) recommended planting seedlings as a better method of establishing wildlife habitat quickly, even thought direct seeding may cost only half as much. He reported extensive drought-caused mortality of newly germinated seedlings. However, he also reported effective invasion of light-seeded species, especially sweet gum (Liquidambar styraciflua), green ash (Fraxinus pennsylvanica) , and American elm (Ulmus americana), thus enhancing diversity.
The most successful planting technique to obtain mixtures of species involves planting of blocks of rows of a single species, interspersed with blocks or rows of other species (J.R. Toliver, U.S. Forest Service, Southern Forest Experiment Station, Stoneville, Miss, July 17, 1990). This approach enhances establishment of slower-growing or poorly competing species. Furthermore, this spacing arrangement allows placement of different species across a gradient of hydrologic and soil conditions within a site, according to their ecological tolerances. Such a planting approach is being used at the Ouachita Wildlife
Management Area (L. Savage, Louisiana Department of Wildlife and Fisheries, Monroe, La., July 18, 1990).
Overall Evaluation
Reforestation and restoration efforts are proving successful in reestablishing bottomland hardwood forests for commercial and wildlife habitat values (Haynes et al., 1988; Allen and Kennedy, 1989; Clewell and Lea, 1989). A variety of forest establishment techniques have been employed, such as direct seeding of oaks and planting of seedlings of several bottom-land species. Most of these projects began during the late 1980s. Although some may appear promising in terms of species composition and structure, it is too soon to assess the recovery of other wetland functions.
Many of the other functions of forested wetlands require full forest development before they can be evaluated. Thus, other ecological and societal values are seldom measured in evaluating the success of restoration in these wetland systems.
Conclusion and Recommendations
-
The wetland forests on these alluvial floodplain sites have been undergoing loss or conversion for several hundred years. Site alterations, such as diking, ditching, and channelization, have been extensive. It is not realistic to anticipate that major restoration to original geologic, hydrologic, and biological conditions is possible except in limited areas.
-
Smaller-scale areas (such as upland tributaries or watersheds) have greater possibilities of functional recovery than do larger-scale areas. Numerous small projects in such areas may be more effective in restoring floodplain forest values than one major project because restoration of the hydrologic regime is easier in smaller areas.
-
Most current bottomland forest restoration projects are restoring only a few of the functional values (e.g., timber values, wildlife or waterfowl habitat).
-
Most bottomland forest restoration projects are not restoring the original physical and hydrologic conditions.
-
Some management will remain necessary to maintain forested wetlands in some situation, especially where physical and hydrological alterations have been major.
-
Most bottomland forest restoration efforts are driven by agency activities (e.g., mitigation) and federal land programs, not by grassroots support.
-
Watershed effects must be considered in the restoration of forested wetlands. Activities in an upper portion of the drainage will affect downstream areas. Liability for downstream flooding or loss of water resources may limit possible restoration activities.
-
Cumulative effects of restoration on a landscape (watershed) scale must be assessed and incoroporated into the planning process.
-
Longer-term leases under federal land programs (e.g., CRP) would increase the possibility of wetland forest restoration.
References
Allen, J. A. 1990. Stocking, growth, and natural invasion of bottomland oak plantations on the Yazoo National Wildlife Refuge Complex. Unpublished manuscript. U.S. Fish and Wildlife Services, Slidell, La.
Allen, J. A., and H. E. Kennedy, Jr. 1989. Bottomland Hardwood Restoration in the Lower Mississippi Valley. U.S. Fish and Wildlife Service, Slidell, La., and U.S. Forest Service, Southern Hardwoods Laboratory, Stoneville, Miss. 28 pp.
Clean Water Act of 1977. P.L. 95-217, Dec. 27, 1977, 91 Stat. 1566.
Clewell, A. F., and R. Lea. 1989. Creation and restoration of forested wetlands vegetation in the southeastern United States. Pp. 199–237 in J. A. Kusler and M. E. Kentula, eds., Wetland Creation and Restoration: The Status of the Science. Volume I: Regional Reviews. EPA 600/3–89/038. U.S. Environmental Protection Agency, Corvallis, Ore. 473 pp.
Gosselink, J. G., and L. C. Lee. 1989. Cumulative impact assessment in bottomland hardwood forests. Wetlands 9:89–174.
Harris, L., and J. G. Gosselink. 1990. Cumulative impacts of bottomland hardwood conversion on hydrology, water quality, and terrestrial wildlife. Pp. 259–322 in J. G. Gosselink, L. C. Lee, and T. A. Muir, eds., Ecological Processes and Cumulative Impacts: Illustrated by Bottomland Hardwood Wetland Ecosystems. Lewis Publishers, Chelsea, Mich.
Haynes, R. J., and L. Moore. 1988. Reestablishment of bottomland hardwoods within national wildlife refuges in the Southeast. Pp. 95–103 in Proceedings of a conference Increasing Our Wetland Resources. National Wildlife Federation, Washington, D.C.
Haynes, R. J., J. A. Allen, and E. C. Pendleton. 1988. Reestablishment of bottomland hardwood forests on disturbed sites: An annotated bibliography. U.S. Fish and Wildlife Service Biological Report 88(42). 104 pp.
Johnson, R. L., and R. M. Krinard. 1987. Direct seeding of southern oaks—A progress report. Pp. 10–16 in Proceedings of the Fifteenth Annual Hardwood Symposium. Hardwood Research Council, Memphis, Tenn.
Krinard, R. M., and R. L. Johnson. 1987. Growth of a 31 year-old bald cypress plantation USDA Forest Service, Southern Forest Experiment Station Note SO-339. New Orleans, La. 4 pp.
Krinard, R. M., and H. E. Kennedy. 1987. Fifteen-year growth of six planted hardwood species on Sharkey clay soil. USDA Forest Service, Southern Forest Experiment Station Note SO-336. New Orleans, La. 4pp.
MacDonald, P. O., W. E. Frayer, and J. K. Clauser. 1979. Documentation, Chronology, and Future Projections of Bottomland Hardwood Habitat Losses in the Lower Mississippi Alluvial Plain. 2 volumes. U. S. Department of the Interior, Fish and Wildlife Service, Washington, D.C.
Newling, C. J. 1990. Restoration of bottomland hardwood forests in the Lower Mississippi Valley. Restoration Manage. Notes 8(1):23–28.
Sharitz, R. R., and W. J. Mitsch. 1991. Southern floodplain forest. In W. H. Martin, ed., Biodiversity of the Southeastern United States. Volume 1: Terrestrial Communities. John Wiley & Sons, New York.
Tiner, R. W. 1984. Wetlands of the United States: Current Status and Recent Trends. National Wetlands Inventory, U. S. Fish and Wildlife Service, Washington, D.C., 59 pp.
Water Resources Development Act of 1986. P.L. 99–662, Nov. 17, 1985, 100 Stat. 4082.
PRAIRIE POTHOLES
Donald Hey
Introduction
The geographical region referred to as the prairie potholes comprises 192 million acres (Leitch, 1989). This area traverses the provinces of Alberta, Saskatchewan, and Manitoba in Canada, and the states of Montana, North Dakota, South Dakota, Minnesota, and Iowa in the United States. Of this area, 40 percent falls in the United States and 60 percent in Canada. The region is characterized by flat to undulating glaciated topography with poorly defined natural drainage. Millions of potholes, remnant glacial depressions, are sprinkled across the landscape.
Starting in the middle of the nineteenth century, the potholes and their watersheds were altered by European settlers to facilitate farming. Engineered, agricultural drains converted the poorly defined drainage to a well-defined system. Seasonal or perennial inundation of potholes was eliminated by drain tiles and outlet ditches. From the 1870s to the 1970s, 20 million acres of wetlands were reduced to 10 million acres. The effects on wildlife and water resources were dramatic. Although early population estimates are not available, recent studies (Weller, 1982) show a direct relationship between wildlife populations and ponded areas. Given a 50 percent reduction in life populations and ponded areas. Given a 50 percent reduction in ponded areas, wildlife populations were likely cut in half. At the same time, flood storage may have been reduced by as much as 20 million to 30 million acre-feet. This loss, no doubt, contributed to increased flooding along regional streams and rivers. Also, without the long detention times provided by the storage, sediments and nutrients were flushed from and through these former wetlands to foul receiving waters (Gilliam, 1986). However, no quantitative measure of these effects has been made.
In recent years, a great deal of concern has been expressed about the loss of pothole wetlands. A number of studies have been undertaken to better understand the physical and biological functions of potholes (van der Valk, 1989), and some restoration programs have been initiated. Federal laws (e.g., the Clean Water Act of 1977 (P.L. 95-217), the Food and Security Act, and the Emergency Wetlands Resources Act) now discourage the destruction of these important aquatic ecosystems. In Minnesota, for example, there are 32 federal, state, local, and private assistance programs for preserving and restoring wetlands.
Background
The committee elected to review 18 restoration projects in pothole regions. They are located in Meeker and Rice counties, Minnesota. The work was accomplished under the direction of the U.S. Fish and Wildlife Service.
Meeker County lies 60 miles west of St. Paul, and Rice County is about 30 miles south. The population of Rice County is 46,000, approximately twice the population of Meeker County (21,000). On the other hand, Meeker has a larger area, approximately 396,000 acres. The area of Rice County is approximately 317,000 acres. The differences in land area and population result in the population density of Rice County being three times that of Meeker County. In Rice County, there is approximately 0.14 person per acre, whereas in Meeker County, the ratio is 0.05 person per acre.
Despite the large difference in population density, the land use of both counties is quite similar. Agricultural uses cover 84 percent of the land in Meeker County, whereas they cover 80 percent in Rice County. The remaining land is devoted to urban and transportation uses, and streams and lakes. Of the agricultural lands, 29 percent are drained in Meeker County and 25 percent in Rice County (Bureau of the Census, 1981).
The topography and surficial geology of both counties are also quite similar. Both were glaciated during the Wisconsinan stage; the surface material is till. Prior to settlement, both counties contained large areas of poorly drained soils and poorly defined drainage systems, as the extent of agricultural drainage implies.
The two counties are characterized by cool, subhumid conditions. Minimum temperatures range from-30°F in February to 54°F in July. Maximum temperatures range from 40°F in February to 98°F in August. Precipitation averages about 28 inches. Most of the precipitation occurs during the summer months, whereas the least accumulates
in the winter. October is generally the driest month, and August the wettest. Soils are frozen 2- to 3-ft. for 4 to 5 months of the year.
Restoration Programs
The U.S. Fish and Wildlife Service is actively pursuing the restoration of wetlands on private, agricultural lands in both counties. The work is being done under a program developed by the service's Region 3. The program, called Stewardship 2000, was started in 1987 (U.S. Fish and Wildlife Service, 1990).
Twelve restoration projects were visited in Meeker County and six in Rice County. Except for their means of financing, the projects are all very similar. Following is a list of general topics covered in the initial planning work:
-
Land use
-
Location
-
Ownership
-
Easements, rights of way, and reservations
-
Wildlife use
-
Soils and topography
-
General habitat description
-
History of land use under private ownership (including uplands, wetlands, buildings, and so on)
-
Surrounding land use within 3 miles of the project (including private land, state land, federal waterfowl protection areas, and federal wetland easements)
-
Objectives
-
Past waterfowl protection activities
Financing played a significant role in defining the scope of the restoration activities. For example, the 160-acre Christenson project (named after the landowner) was financed with money from Ducks Unlimited as well as from the Conservation Reserve Program. Restoration of waterfowl habitat was the principal objective. Money from the Conservation Reserve Program was used to create a wildlife habitat buffer around the restoration area. On the other hand, money from the Luthens project was financed with money from Reinvest in Minnesota, a state program for habitat restoration. In this case, no buffer surrounds the restored pothole project.
In both cases, the restoration consisted of very simple changes to the drainage system. On the Christenson property, agricultural drainage structures in and around 10 farmed potholes were removed, blocked,
or altered to emulate presettlement hydrologic conditions. The potholes ranged in size from 0.2 to 10 acres. The tributary watersheds ranged in size from 5 acres associated with the smallest wetland to 500 acres associated with the largest. The tiles draining the potholes were blocked. Drainage ditches were blocked by small earth fills or dikes, the longest of which was 125 ft. Each dike incorporated a spillway.
On the Luthens farm, the drainage structures were modified for potholes of 1.5 and 0.7 acre. As in the Christenson case, earthen dikes were used to block the surface drainage and the tiles were removed to prevent subsurface drainage. No plant materials were introduced in the farmed wetlands being restored, and only a limited number of plant species, both warm and cool season grasses (no forbs), were planted in the buffer areas around the restored potholes. The costs for the restoration work were quite modest, in each case being less than $1,000.
Each property owner signed an agreement with the U.S. Fish and Wildlife Service. The service acquired the following rights:
-
to restore and maintain the wetlands described in the agreement by plugging drainage ditches or tiles and installing water control structures;
-
to access the land for management purposes; and
-
to establish a vegetative cover on soils disturbed during construction.
In return, the property owner acquired the wildlife benefits (hunting, fishing, and others) received from the restored potholes. The agreement could have been terminated within 30 days by a written notice from either party. If the property owner terminated the agreement within 4 years, the owner would reimburse the service for all improvements.
Conclusions
The overriding goal of these restoration projects was the development of waterfowl habitat. However, flood control and water quality were often mentioned as secondary goals. None of the goals had been quantified, nor had restoration criteria been established.
None of the 18 restoration projects inspected by the committee appeared to have a comprehensive plan concerning location, scale, or purpose. In fact, there is no comprehensive restoration plan for the counties, region, or state. The landowner, for one reason or another,
had contracted the service for help in restoring wetlands. After the landowner agreed to participate in the service's program, a specific restoration plan was developed. After restoration, no monitoring or management of the restored areas was undertaken or planned.
The success of, and the degree to which, the restoration projects meet either site-specific objectives or regional objectives are unknown. The diversity of plant communities observed in the restored areas was extremely low. Even in the surrounding buffer areas the diversity of plants and, hence, wildlife habitat was extremely low. Because no monitoring has been undertaken, it will not be easy to ascertain success or failure or to improve future restoration projects. Providing a diverse habitat for animals other than waterfowl seems not to have been a consideration.
Despite the lack of well-though-out restoration goals and criteria, this case study illustrates an extremely important aspect of any restoration strategy. The U.S. Fish and Wildlife Service is creating and responding to individual, local interest in and support for restoration. With only a meager staff commitment, the service is having considerable success. Potholes are being taken out of agricultural production and returned to their natural functions of water storage, nutrient cycling, and wildlife habitat. The other lesson involves the innovative financial program that weaves together a variety of funding sources. The ingenuity of the service's project officers and the creative dedication of its administration in Region 5 should serve as an excellent example to other states and other Fish and Wildlife Service regions. If better design criteria and management programs were available and used, the chances of success would be improved and a wider range of aquatic functions achieved.
References
Bureau of the Census. 1981. 1978 Census of Agriculture. U.S. Department of Commerce, Washington, D.C.
Clean Water Act of 1977. P.L. 95-217, Dec. 27, 1977, 91 Stat. 1566.
Leitch, J. A. 1989. Politicoeconomic Overview of Prairie Potholes. Northern Prairie
Wetlands Iowa State University Press, Ames, Iowa. U.S. Fish and Wildlife Service, Region III, North Central Region . 1990. Stewardship 2000. Fort Snelling, Minn.
van der Valk, A, 1989. Northern Prairie Wertlands. Iowa State University Press, Ames, Iowa.
Weller, M. W. 1981. Wetlands of Canada. Polyscience Publications, Montreal, Quebec.
Weller, M. W. 1982. Ecology and Wildlife Management. Freshwater Marshes. University of Minnesota Press, Minneapolis, Minn.
THE HACKENSACK RIVER MEADOWLANDS
John Berger
Introduction
The Hackensack Meadowlands is a 21,000-acre estuarine area of freshwater and saltwater marshes and meadows situated in the lower Hackensack River basin amidst the New York-northeastern New Jersey metropolitan area (Figure A.13). Almost 18,000 acres of the Hackensack Meadowlands was originally wetland (M. Thiesing, U.S. Environmental Protection Agency, personal communication, 1991).
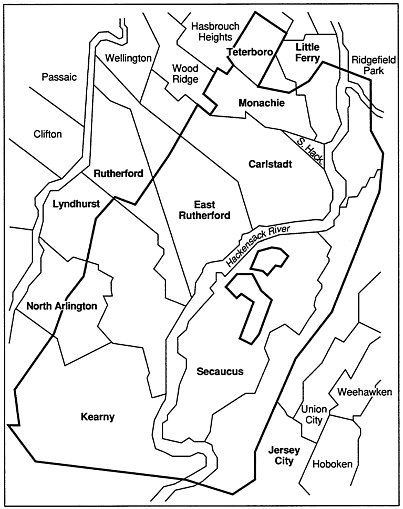
FIGURE A.13 Hackensack Meadowlands district. SOURCE: Reprinted, by permission, of the Hackensack Meadowlands Development Commission, 1990.
but extensive development, drainage, diking, filling, garbage dumping, and sewage pumping have occured in the Meadowlands, disturbing many of the area's natural ecological processes.
Thirty-two square miles of the Meadowlands have been administered since 1969 by the Hackensack Meadowlands Development Commission (HMDC). At the time the HMDC was established, the Hackensack River reportedly was ''nearly dead," and the Meadowlands' wetlands were being used as a disposal site for 30 to 40 percent of New Jersey's garbage (Scardino, 1990). Illegal waste dumping was also common, and development was proceeding in a haphazard manner (Scardino, 1990).
However, commission documents report that during the commission's tenure, "[t]he district has seen drastic improvement in its environment; the Hackensack River has returned to a state of health; wildlife is returning to the district in abundance [and] water quality has greatly improved..." (HMDC, 1989a). Former New Jersey Governor Thomas H. Kean in 1989 commended the HMDC on "the restoration of the environment of this once blighted landscape" (HMDC, 1989a). Responding to similar accounts of environmental restoration, the Committee on Restoration of Aquatic Ecosystems visited the Meadowlands in 1990 to gather evidence of environmental restoration.
The Hackensack Meadowlands Development Commission
Established by an act of the New Jersey legislature, the HMDC was set up to provide for the reclamation, planned development, and redevelopment of the Hackensack Meadowlands within Bergen and Hudson countries, a zone including 14 municipalities (HMRDA, 1968). The commission was also charged with providing garbage disposal sites for 116 communities (HMDC, 1989b).
Currently operating with a $5.5 million annual budget (A. Galli, Hackensack Meadowlands Development Commission, personal communication, 1991), the commission usually monitors 500 to 600 development projects in the district at a time (HMDC, 1989b) and by 1989 had overseen privately funded development worth more than $1 billion (HMDC, 1989a). Another $450 million in "publicly backed funds" have been spent on a 750-acre sports complex in the Meadowlands.
Some of this growth has impinged on natural areas. From the commission's inception until 1984, more than 863 acres of wetlands were filled in accordance with the HMDC's master plan. Little filling has occured since then (D. Smith, Hackensack Meadowlands Development Commission, personal communication, 1991). Wetland habitat enhancement work has been performed on only 190 acres in mitigation
for the wetland filling or drainage. All but a few acres of this mitigation work was paid for by developers. (Although the HMDC controls all construction in the district, permits to fill wetlands are principally the responsibility of the U.S. Army Corps of Engineers (COE) under Section 404 of the Clean Water Act of 1977, subject to concurrence by the U.S. Environmental Protection Agency.) Commission literature states that "the Meadowlands wetlands are in need of restoration, not simple protection," but that neither the state nor the federal government would pay for the restoration," so the HMDC is left on its own to solve the problem" (HMDC, 1989b). The HMDC's solution is not to use any substantial part of its operating revenue to restore the Meadowlands, but to allow certain Hackensack wetlands to be filled in exchange for developer-sponsored mitigation (HMDC, 1989b).
The commission's emphasis on development was consistent with its original 1968 mandate. The Hackensack Meadowland Reclamation and Development Act (HMRDA), which established the commission, noted that, whereas extensive portions of the Meadowlands "have so far resisted development...the orderly, comprehensive development of these [Meadowlands] areas can no longer be deffered...."
The commission has pursued this goal while also taking action to improve environmental conditions in the Meadowlands by exercise of its zoning powers and advisory role on discharge permit applications. In general, the commission sought the upgrading of sewage treatment plants, and the closure and cleanup of chemical manufacturing plants and toxic waste sites. It also oversaw the closure of 23 of 24 operating landfills in the Meadowlands; it blocked the use of wetlands for new garbage dumps; and it has generally served as a "watchdog" on environmental conditions for the New Jersey Department of Environmental Protection and the U.S. Environmental Protection Agency (R. Smith, Hackensack Meadowlands Development Commission, personal communication, 1991).
This environmentally oriented activity was in keeping with the declaration, in the Act establishing the HMDC, that "the ecological factors constituting the environment of the meadowlands and the need to preserve the delicate balance of nature must be recognized to avoid any aritificially imposed development that would adversely affect not only this area but the entire state..." (HMRDA, 1968).
Exactly what constitutes the "delicate balance of nature" in a highly disrupted area has been a matter of some controversy in the years following the establishment of the commission. The HMDC's 1972 master plan and zoning regulations, for example, were approved by the Office of Coastal Zone Management (of the National Oceanic and
Atmospheric Administration) over the objections of the COE, the U.S. Fish and Wildlife Service, the Environmental Protection Agency, and the National Marine Fisheries Service (U.S. Army Corps of Engineers, 1982). (The HMDC is now engaged in preparation of a programmatic Environmental Impact Statement for a new master plan.)
The 190 acres of mitigation work performed in the Meadowlands to date has been conducted mainly by the New Jersey Turnpike Authority, the Bellemead Development Corporation, the Hartz Mountain Development Corporation, and to a minor extent, the HMDC itself (on a small wetland and swale around a landfill). The most detailed mitigation information available to this committee deals with the Hartz Mountain project and its mitigation. To assess its merits as a restoration, one must compare the conditions produced by the project with the ecological conditions prior to disturbance.
History
The Hackensack Meadowlands rest in the ancient basin of a lake formed during the retreat of the Wisconsin glaciation, when glacial meltwater was trapped behind a terminal moraine of rock and earth (HMDC, 1984). Over long periods of time, sediments were deposited in the lake bed, and vegetation took root in the lake's shallow reaches. Eventually, thousands of years ago, the moraine was breached, the lake drained, and tidal flows mingled with fresh waters in the resulting estuary (HMDC, 1984).
Much time passed, and a succession of plant communities came and went, competing with each other and struggling to adapt to environmental fluctuations, including the sea level changes that altered salinities in the estuary. Ecological studies dating back to the late nineteenth century indicate that in the last phase of its natural succession, the Hackensack Meadowlands was a boggy area dominated by Atlantic white cedar (Chamacyparis thyoides) in a region of black ash (Fraxinus nigra) and tamarack (Larix laricina)( Kraus and Smith, n.d.). The Hartz Mountain project site may have been highly brackish marsh dominated by salt hay (Spartina patens) and salt grass (Distichlis spicata) with a white Atlantic cedar bog at its upland edge, before the whole area was ditched and then diked for mosquito control between 1914 and 1950 (Kraus and Smith, n.d.; HMDC, 1984; D. Smith, Hackensack Meadowlands Development Commission, personal communication, 1991). (This issue was not independently verified by the committee.)
The altered hydrology quickly led to major changes in vegetation. With tidal flow excluded and water salinity reduced, the common
reed (Phragmites australis) invaded the area and became the dominant vegetation. Another major change in the area's hydrology occured in 1922 when the Oradell Dam was built across the Hackensack River upstream from the project site by the Hackensack Water Company. Reduction in freshwater flow further altered ecological conditions in the estuary by allowing greater saltwater intrusion upstream into the Hackensack basin below the dam.
The original Hartz Mountain project—a mall, office complex, and condominiums—was proposed for the Cromakill Creek and Mill Creek basins of the Meadowlands in the Township of North Bergen and the Town of Secaucus. Subsequently, the condominium component was dropped or delayed, and the company received permission to fill 127 acres of wetlands to build the mall at Mill Creek and the office complex. The COE reviewed the Hartz Mountain proposal and issued a finding in 1982 that it would have "no significant adverse environmental impacts" (U.S. Army Corps of Engineers, 1982). Thus COE did not require an environmental impact statement.
Based on an interagency wetland evaluation conducted by several federal agencies, the site—still dominated by common reed—was deemed to be of only average value as a wetland. Water quality was found to be poor; vegetation diversity was low; and benthic invertebrates and fish were rated "low to medium" (U.S. Army Corps of Engineers, 1982). The COE noted, however, that filling the wetland would "essentially destroy all wildlife values within the fill area" and that loss of the wetland would reduce the highly desirable isolation of other remaining wetlands, increasing noise levels and the probability of further human encroachment on the remaining wetlands (U.S. Army Corps of Engineers, 1982).
The COE also observed that the land would have much greater potential wildlife value if the water quality were improved and the diversity of wetland vegetation increased. "With improved water quality, loss of wetlands would be of much greater concern" (U.S. Army Corps of Engineers, 1982). The Hartz Mountain project was allowed to proceed with the stipulation that the company would have to mitigate its impacts by construction of a 63-acre brackish marsh. The mitigation site was slightly less than half the size of the filled wetlands, but the new marsh was intended to be of much higher ecological value.
The brackish marsh ecosystem is in Secaucus, N.J., approximately south of Hackensack River mile 10.5, adjacent to the eastern shore of Mill Creek, and west of the eastern branch of the New Jersey Turnpike. As noted, the site before 1985 was a degraded tidal marsh with poor water quality, dominated by tall, dense stands of common reed
(Phragmites australis)( TAMS, 1990). Tidal inundation was limited by site elevations ranging from +9.6 ft National Geodectic Vertical Datum (NGVD) to 0.0 NGVD.
The mitigation goals were to enhance wildlife diversity and abundance by converting the site from a common reed-dominated community to a cordgrass (Spartina alterniflora) intertidal marsh. The plan adopted was to remove the common reed in the process of lowering the site's elevation by excavation to increase tidal inundation. An effort was also made to construct a more heterogeneous habitat, including open water and raised areas of woody vegetation in order to increase vegetative diversity and wildlife use.
Replacement of the common reed by cordgrass offers several ecological benefits. Cordgrass detritus regularly enters marsh waters and breaks down relatively quickly, releasing nutrients. The detritus from common reed, which grows on higher ground, is only washed into the water on an irregular basis and decomposes relatively slowly (HMDC, 1984). Very dense stands of common reeds are not considered to be of high value to waterfowl, marsh mammals, and wading shorebirds (TAMS, 1990). In addition, the reed is very persistent, invasive, and robust, contributing to drying of marsh soil, reduction of water flow, and increases in site elevations through growth and accumulation of organic matter and ensuing entrapment of sediment.
However, among the common reed's ecological services are provision of habitat for large populations of aphids that in turn support large numbers of ladybugs, which provide food for praying mantises, birds (HMDC, 1984), and occasionally for fish.
Methods
The mitigation site was sprayed with the herbicide RODEO by helicopter and later by hand-sprayer to eliminate the common reed. The site was then shaped and graded with Priestman variable counterbalanced excavators imported from England for the marsh work, because of their low ground pressure and ability to accomplish the very fine gradations in elevations necessary to successfully establish the elevation-sensitive cordgrass. The horticultural contractor was Environmental Concern, Inc., of St. Michaels, Md., a firm well known for its pioneering work in salt marsh restoration.
The high marsh was sculpted into channels and open water, lower-elevation intertidal zones, and raised areas (berms) from +5.73 to +10.33 NGVD, built up of excavated materials. The earthwork was done from March 1985 to July 1987. Cordgrass seed was planted
each spring from 1986 through 1988. Detailed biological and other monitoring has been done by TAMS Consultants, Inc., on the site and at an untreated 131-acre control site, also dominated by common reed and similar to the pretreatment mitigation site.
Results
Initial plantings of trees, shrub root stocks, and herbaceous vegetation experienced high mortality due to high soil salt content that was allowed to leach out with rainwater during the next 2 to 3 years. Plant survival on the berms improved in 1988 as leaching continued (TAMS, 1990). The plantings are in an early stage of establishment and are fenced to discourage muskrat depredation.
More than 80 percent of the site is now inundated during part of the mean tide cycle, and a vigorous growth of cordgrass has become established on more than 75 percent of the intertidal zones between +2.0 and +3.0 NGVD. Common reeds have not reappeared in the cordgrass zones. Where they reemerged on berms, they have apparently been controlled by hand-spraying with RODEO. Some native marsh species, such as fleabane, rushes, and sedges, have reappeared naturally on the site. Channels appear to be stable throughout the site (TAMS, 1990).
Although it is too early for the mitigation site to have fully recovered from earth-moving operations, fish, benthic organisms, and zooplankton already appear similar to those at the ecologically impaired control site, whereas bird life has become much more abundant and diverse (TAMS, 1990). Because of the creation of more channels, greater water surface area for oxygen exchange, and greater tidal flushing, water quality on-site seems to approximate values in the adjacent Hackensack River. High levels of coliform bacteria are still found in water samples from the site, and benthic organism samples contained a large proportion of a few pollution-tolerant species, indicative of a stressed ecosystem. Almost all the fish found at the control and mitigation site were mummichogs (Fundulus heteroclitus), an import and secondary consumer in the eastern salt marsh food web, but their physical distribution was wider in the mitigation site, as was the case for zooplankton (TAMS, 1990).
Bird species diversity was markedly greater on the mitigation site (46 species) versus the control (32 species), and the distribution among species was also more equitable on the mitigation site, probably in response to its greater habitat diversity and secondary productivity (TAMS, 1990).
Conclusion
The intertidal cordgrass marsh created out of high marsh at the mitigation site appears to have met the goals of enhancing habitat heterogeneity, vegetational diversity, and wildlife utilization, principally by birds. In this sense the project has been a success, and the engineering and biological science used appears to be of a high caliber. However, the project should be viewed as habitat enhancement and conversion rather than ecosystem restoration for the following reasons:
-
The mitigation did not endeavor to re-create the particular estuarine ecosystem that existed on the site prior to the damming of the Hackensack River and prior to other significant environmental modifications that have occurred in the Meadowlands. By altering the hydrology of the area and the salinity of its water and soil, the Oradell Dam made restoration of vegetation adapted to less saline conditions impossible without the reintroduction of additional fresh water to the project site.
-
Because of the limited areal scope of the mitigation work and the limited goals, the mitigation project had virtually no impact on the regionwide ecological degradation of the Meadowlands—exemplified by the damming and ditching of Meadowland marshes, the blockage of the Hackensack River, the presence of sewage and toxic substances in soil, and the extirpation of certain species. Therefore the resulting ecosystem cannot be considered "restored" because of the influence of these intractable conditions on the mitigation project site.
-
Where once there was probably a high marsh of Spartina patens, Distichlis spicata, and other species, the contractors produced an intertidal marsh with mud flats and raised inlands of woody vegetation. There is no evidence that the ecosystem created on the mitigation site has existed there within human memory.
The regulated development of the HMDC is far better than the indiscriminate dumping and haphazard development that preceded the HMDC in the 1950s and 1960s. Water quality in the Hackensack River appears to be far better than the sewer-like conditions reported 20 years ago. Evidence is undeniable that certain aquatic organisms, such as grass shrimp and mummichog, are now thriving in vast numbers and that certain species of waterfowl and fish have returned.
However, as the Committee on Restoration of Aquatic Ecosystems has pointed out elsewhere, river restoration involves more than water quality improvement and increased wildlife use. Also required are a return of ecological integrity, structure, function, and ecosystem
processes, beginning with natural hydrological conditions and including restoration of communities of organisms and their interactions. An increase in the presence of a wildlife species is generally a promising indication that ecological health is returning but is insufficient cause for proclaiming that restoration has occurred.
The HMDC has in the past sanctioned the development of substantial wetland acreage rather than protecting all wetlands. The commission thereby set a precedent of trading wetland development for wetland enhancement, with a resulting net loss of wetland acreage in a quest for increased wetland functional values. There are alternatives to that strategy. The commission might instead gradually begin to invest some of its own not inconsiderable revenues directly in wetland restoration year by year (and solicit federal, state, local, and private funds to augment its contribution), without choosing to sacrifice additional wetland acreage to subsidize wetland improvement.
In the future, too, the commission may wish to consider developing a systematic mitigation or ecological restoration program for the Meadowlands in which individual mitigations are conducted as part of a broader overall restoration strategy.
References
Axelrod, H. R., C. W. Emmens, D. Sculthorpe, and W. Vorderwinkler. 1962. Exotic Tropical Fishes. T. F. H. Publications, Jersey City, N.J.
Clean Water Act of 1977. P.L. 95-217, Dec. 27, 1977, 99 Stat. 1566.
Hackensack Meadowlands Development Commission (HMDC). 1984. Wetland Bio-Zones of the Hackensack Meadowlands: An Inventory. Lyndhurst, N.J. June.
Hackensack Meadowlands Development Commission. 1989a. Annual Report. Lyndhurst, N.J.
Hackensack Meadowlands Development Commission. 1989b. Fact Sheet. Lyndhurst, N.J. October.
Hackensack Meadowlands District. 1990. Special Area Management Plan. Lyndhurst, N.J.
Hackensack Meadowland Reclamation and Development Act (HMRDA). 1968. State of New Jersey Statutes. Chapter 17, Sections 13:7-1 to 13-17-86.
Kraus, M. L., and D. J. Smith. n.d. Competition and Succession in a Perturbed Urban Estuary: The Effects of Hydrology. Monograph. Hackensack Meadowlands Development Commission, Lyndhurst, N.J.
Scardino, A. 1990. Executive Director, Hackensack Meadowlands Development Commission. Briefing to Committee on Restoration of Aquatic Ecosystems. Lyndhurst, N.J.
TAMS Consultants, Inc. 1990. Comprehensive Baseline Studies: IR-2 Site and Off-Site Mitigation Areas—Evaluation of Harmon Meadow Western Brackish Marsh Mitigation Area. January. New York, N.Y.
U.S. Army Corps of Engineers. 1982. Statement of Findings for Application No. 81-391-J2 by the Hartz Mountain Development Corporation. New York District. Regulatory Branch. December 16.


