
Analysis of Projected Impact of Plug-in
Electric Vehicles on the Distribution Grid
ARINDAM MAITRA
Electric Power Research Institute
INTRODUCTION
A new era of plug-in electric vehicles (PEVs) has begun. Nissan and General Motors launched production PEVs in December 2010, and Ford, Mitsubishi, Toyota, Tesla, and others have announced plans to introduce such vehicles to the US market. With the rapidly approaching commercialization of plug-in hybrid (PHEVs) and battery electric vehicles (BEVs) as well, utilities need to ensure that they can support customers’ use of such vehicles by preparing for the installation of residential, commercial, and private infrastructure in their service territories and by managing the impact of these new loads on the electric distribution system.
In light of these developments and needs, the Electric Power Research Institute (EPRI) initiated a multiyear project (EPRI 2012; Maitra et al. 2009; Taylor et al. 2009) with 19 utilities to understand PEV system impacts in the United States and Canada. This paper provides an overview of the study, presents the results relevant to the US analysis, and summarizes the conclusions.
STUDY METHODOLOGY AND GENERAL ANALYSIS FRAMEWORK
The study methodology was designed to capture potential near-term distribution system impacts in response to increased customer load. Assuming a near-term planning horizon (1 to 5 years), only the characteristics of first-generation PEVs are considered. Specifically, PEVs are modeled as simple loads whose characteristics are mainly dictated by customer behavior; controlled dispatching or vehicle-to-grid operations are not included (for a discussion of the latter, see Mangharam 2013). Growth in the base load is also not included because no particular planning
year is evaluated in any given scenario. Finally, only residential customers are considered, as initial adopters are expected to charge at their residence.
The project included an assessment of PEV charging effects on specific circuits in a utility’s distribution system—typically one or two representative feeders per utility—based on detailed simulations of distribution systems, customer load characteristics, and potential electric vehicle (EV) penetration and charging profiles. The results of the simulations were combined to develop summaries of general concerns and to identify assets most likely to be at risk, conditions that could require additional monitoring to avoid problems, and the impacts of different charging profiles.
As part of a PEV distribution impact collaborative project, EPRI developed a novel methodology to evaluate the impact of PEVs on distribution systems. The study methodology was designed to capture potential distribution system impacts in response to customer adoption of the new load type and was applied to 36 radial distribution feeders. The analytical framework was developed to evaluate the impacts of PEVs on distribution system thermal loading, voltage regulation, transformer loss of life, unbalance, distribution system losses, and harmonic distortion levels. These impacts are primarily determined by the assumed location of PEVs throughout the distribution network, the time of day that PEVs are expected to charge from the system, and the magnitude and duration of the charge cycle. In order to determine both system-level and individual component—level impacts, the framework provides for both deterministic and stochastic consideration of these key spatial and temporal variables (Figure 1). Specifically, the analysis identifies assets at risk of being affected and the likelihood and severity of impact.
• Asset deterministic analysis examines each asset’s capacity to serve additional demand compared to the worst-case projected PEV demand under the defined scenario. Each asset’s capacity is determined via the circuit models and the projected PEV load is derived from probabilistic evaluations of PEV characteristics and number of customers served from each asset.
• Stochastic analysis projects likely impacts considering the full projected diversity of the PEV charging through randomly generated system scenarios that model PEV charging and system response over a full calendar year. PEV load location and temporal demands are randomly determined using the PEV characteristic probability distributions discussed above. Results from the simulation and analysis of hundreds of these randomly generated cases provide indications of likely impacts and their severity.
MARKET PENETRATION AND CLUSTERING
The study is based on projected market penetration 1 to 5 years after PEV commercialization. Although the total penetration is assumed to be small, possible
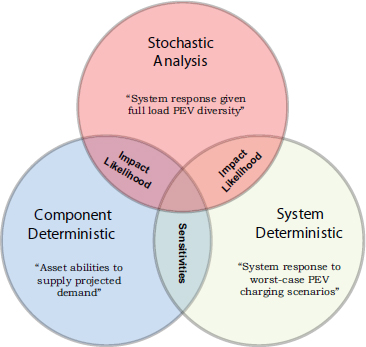
FIGURE 1 System impact analysis framework.
high localized concentrations are possible. Using known distribution system circuit information, PEV charge characteristics, and likely customer behaviors to construct models of system conditions, the analysis framework considers the following principal factors that define PEV loading on distribution systems: PEV market penetration levels per utility customer class (residential, commercial); different PEV charge spectrums (battery type, charger efficiency) and profiles; time profiles and likely customer charging habits; and battery state of charge based on miles driven.
To evaluate circuits from 19 utility operating territories, PEV adoption levels in the range of 2–25% were used. It’s important to note that, even for low overall customer PEV adoption rates, based on system configuration and assumed customer adoption probabilities PEV clusters will occur randomly throughout the system, as shown in Figure 2. Each PEV is represented by a circle, and as PEVs are introduced at the same location they are spaced like petals on a flower. Detailed analysis from 36 circuits in 19 utility operating territories revealed a penetration pattern that resembles sparse clusters that are nonuniform, centered on early adopter neighborhoods. Several of these distribution system segments have older homes and are capacity constrained. Higher penetration rates, of course, increase the potential for larger and more numerous clusters. Although these clusters may indicate an increased risk of higher than average loading levels, clustering alone does not signify the likelihood of negative impact because other PEV load characteristics must be taken into account.
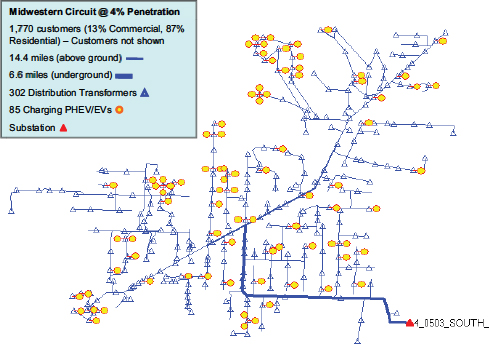
FIGURE 2 Sample daisy plots illustrating clustering at 4% penetration level. EV = electric vehicle; PHEV = plug-in hybrid electric vehicle.
CHARGING INFRASTRUCTURE
There are several ways to recharge PEVs at power levels ranging from less than 1 kilowatt (kW) to as much as 250 kW and at charging times of less than 30 minutes to more than 24 hours. Most residential and public charging will occur at power levels ranging from less than 1 kW to as much as 19.2 kW, with full charge times of 3–8 hours.
Charging is grouped into two classifications based on whether the electricity delivered is alternating current (AC) or direct current (DC). AC charging is governed by SAE Recommended Practice J1772 and has two classification levels in North America. Level 1 charging delivers 120 volts AC (VAC), and the electric vehicle supply equipment (EVSE1) generally consists of a self-contained cordset that terminates in a standard NEMA 5-15R plug compatible with any standard 120 volt household outlet. Level 2 charging delivers 208–240 VAC and requires a permanently connected EVSE. Level 1 AC charging is generally limited to
__________
1EVSE can be defined as “The conductors, including the ungrounded, grounded, and equipment grounding conductors, the electric vehicle connectors, attachment plugs, and all other fittings, devices, power outlets or apparatuses installed specifically for the purpose of delivering energy from the premises wiring to the electric vehicle” (NEC 1996).
1.44 kW, Level 2 can reach 19.2 kW, and most vehicles and installations use 3.3–6.6 kW. Both Level 1 and Level 2 charging use the same connector design at the vehicle, and most vehicles can charge at either voltage through the same charge port.
Instead of an onboard charge port, DC charging, often referred to as “fast charging,” converts AC electricity to DC and directly charges the vehicle battery through an offboard charging station. BEVs have been designed and tested for DC charging at rates of 50–60 kW; the maximum charging power depends on the battery chemistry and system design.
Most electric vehicles are expected to charge at power levels below 7 kW (although the residential charging standard can reach levels of 19.2 kW, or 80 amps at 240 volts). PHEVs can easily recharge overnight at Level 1 (120 V, 1.2 kW) or Level 2 (240 V, 3.3 kW). The specific impacts on a feeder will depend on the design and loading practices for various components of the feeder and characteristics of PEVs in the area.
Charging Patterns
The timing of PEV charging can have either positive or negative impacts on electric generation and transmission systems. A significant amount of PEV charging coincident with the system peak would create a need for additional generation, whereas charging performed consistently during off-peak hours could reduce system costs.
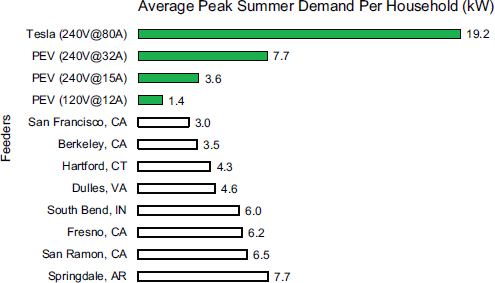
Figure 3 compares the maximum charge powers for Level 1 (120 V) and Level 2 (240 V) EVs to average peak summer demand for households in eight US cities with different climates. Likely implementations of residential Level 2 charging range from a 15 amp circuit (12 amp continuous, 2.88 kW) to a 100 amp circuit (80 amp continuous, 19.2 kW). Higher-capacity EVSE installations are more likely to affect the local distribution system.
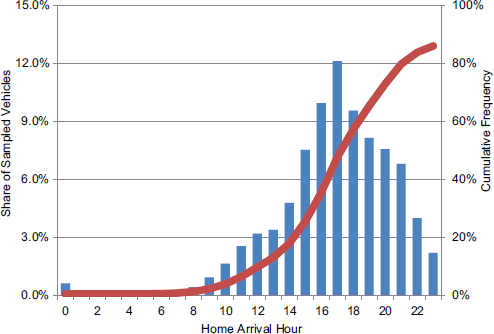
It is often assumed that EV charging could create a large load coincident with the peak. However, according to data from the National Personal Transportation Survey,2 vehicles do not all connect at the same time. Figure 4 shows the distribution of home arrival times (on a 24-hour clock) for average American drivers. Even during the peak hour of 5–6 PM (17–18 on the x-axis), only about 12% of drivers arrive home.
Aggregate Feeder Loading Analysis
Characterization of PEV load diversity’s influence on the system requires examination of the total additional loading expected at the substation (head of
__________
2US Department of Transportation Federal Highway Administration, www.fhwa.dot.gov/ctpp/jtw/contents.htm.
the feeder) for each circuit. There are uncertainties in the expected makeup of PEVs, charging patterns served from each feeder, and customer habits, but they can be reasonably bounded at the aggregate level for the substation transformer. The study results showed that, based on typical daily driving statistics, the average energy delivered to a midsize sedan during a charge is 5–8 kWh and that for different vehicle mixes the aggregate on-peak load will vary between 700 W and 1100 W per PEV.
Charging patterns at the aggregate level correlate with statistical driving patterns, according to data from the National Household Transportation Survey (NHTS; Vyas et al. 2009). Potential hours of PEV connection to the distribution grid were derived from the likely residential customer home arrival times shown in Figure 4. It is possible to estimate aggregate hourly demand on the substation transformer by coupling NHTS statistics with daily customer driving distance patterns, PEV types (e.g., Chevy Volt, Nissan Leaf, Ford Focus, Mitsubishi iMieV), electrical charger characteristics, and different charging profiles that can be used to control charging.
Figure 5 shows a plausible case for vehicle charging based on a fleet of extended-range electric vehicles (E-REVs, as represented by the Chevy Volt; 30%), blended PEVs (represented by the Ford Escape; 50%), and BEVs (represented by the Nissan Leaf; 20%), all with 7.68 kW chargers that begin charging at full power upon arriving home. Although the charging occurs at peak load,
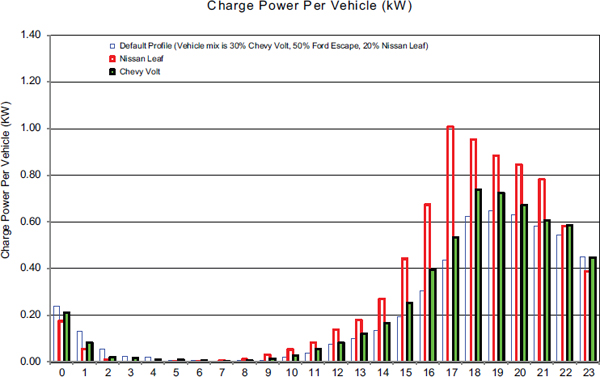
FIGURE 5 Aggregate power demand for uncontrolled vehicle charging.
it uses about 0.7–1.0 kW per vehicle. Other vehicle mixes, with more PEVs or lower-power chargers, will decrease the vehicle charging peak. Similarly, higher-power chargers will increase the vehicle charging peak but the charging will finish sooner.
SYSTEM IMPACTS
Correlating expected demand against asset capacity will provide a strong indicator of the number and type of assets most at risk of exceeding their thermal ratings due to PEV adoption. Peak capacity is determined from the peak load power flow solution and each component’s specified thermal ratings. The EPRI analysis shows that higher charging levels/rates (6.6 kW versus 3.3 kW versus 1.4 kW) have a greater impact on transformer capacity, as illustrated in Figure 6.
The calculated peak hour remaining capacities for an example circuit are plotted in Figures 7 and 8 as a function of the number of customers served. Each asset is evaluated against projected PEV demands and its remaining capacity plotted as an individual point and sorted based on customers served and asset class. Projected demands are superimposed as lines for the three market penetration levels (2%, 4%, or 20%) examined. The estimated maximum PEV demand
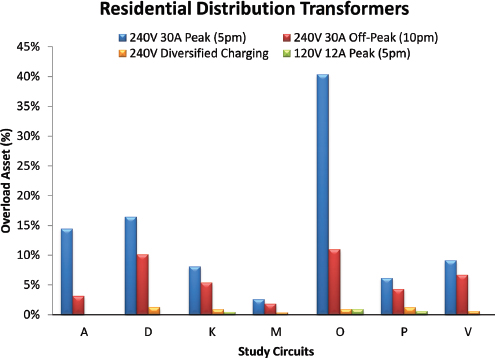
FIGURE 6 PEV charge levels have a stronger impact compared to charge time.
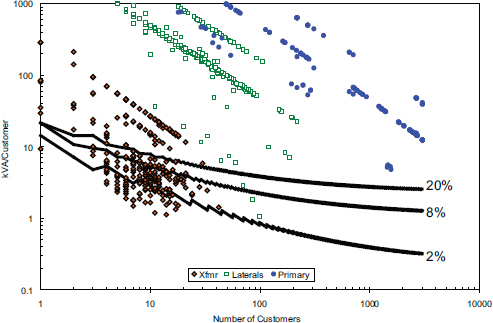
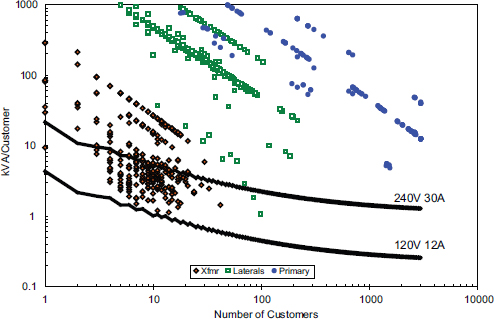
is also plotted, permitting the ready identification of assets that are at risk of impact. Assets whose remaining capacity falls above the projected demand are unlikely to be affected by 2%, 4%, or 20% PEV market penetration. Given the 99.99% confidence level used for the P-test and the conservative construction of the maximum projected demand lines, the probability of exceeding the thermal ratings of these assets is less than 0.01%. Thus, assets above the maximum project lines are unlikely to be impacted (where the asset’s remaining capacity exceeds the projected PEV demand lines) and can be quickly identified for different PEV penetration levels.
As PEV market penetration increases so does the potential for system impacts (although such impacts cannot be discounted even for penetrations as low as 2%). As expected, the number of assets that fall below the projected maximum PEV demand line increases with the penetration level. Furthermore, the nature of the asset capacities in relation to the maximum PEV demand lines clearly indicates that the impact of PEV adoption will most likely first appear on service transformers. Not surprisingly, transformers with the lowest capacity per customer are the most susceptible.
It is important to note that these circuit models, based on allocation of customer load per transformer kVA, may limit the accuracy of the projections because they do not capture innate variations in transformer loadings. Thus transformers that may be heavily loaded in the field cannot be completely discounted from being overloaded due to PEV charging. In the analysis described here, impact likelihood is determined through stochastic simulations of the circuit operation over a full calendar year for projected PEV penetration levels. In each case, PEVs of specific types are randomly assigned to customer locations according to defined probability distribution function (PDF) and an hourly demand profile for the year is developed from the charge time and remaining charge PDFs. This process is repeated for each penetration level and the simulated results are aggregated to provide an indication of impact likelihood (the analysis also accounts for other system impacts such as steady-state voltage changes and losses). The stochastic analyses are also designed to enable identification of the particular system and PEV conditions that result in a negative impact to the system or asset.
CONCLUSIONS
The results of the EPRI study show the following:
• The extent of system impacts depends on PEV penetration and charging behaviors of PEV adopters.
• The expected aggregate addition to system peak loads is 700–1,000 watts per PEV in a given utility territory.
• Short-term impacts for most utilities should be minimal and localized. There is a possibility, however, of isolated and more severe impacts on
some distribution transformers and secondary service lines, particularly in neighborhoods with older distribution systems and underground systems.
• PEV charge rate, or level, is the PEV characteristic that most influences the overload risks posed to service transformers from PEV adoption. Increased charge durations, due to larger battery sizes, can also impact thermal aging.
• Each transformer’s remaining capacity per customer is one of the strongest indicators of the potential risk that a transformer may exceed its thermal ratings. This metric incorporates a number of key factors including the transformer’s existing demand, thermal ratings, and the number of customers served.
• Assets near the load are most susceptible to system overloads from PEV clusters as the potential benefit of spatial diversity decreases.
• PEV clustering will occur randomly throughout a system. While it may indicate an increased risk of higher than average loading levels, PEV clustering alone does not signify the likelihood of negative impact as other PEV load characteristics must also be taken into account.
• Transformers characterized by low capacity per customer are the most likely to be affected by PEV adoption. In particular, transformers lower than 25 kVA are expected to be the most susceptible to overloading as they typically have lower amounts of capacity, which can be quickly consumed by one or more PEVs.
REFERENCES
EPRI [Electric Power Research Institute]. 2012. Understanding the Grid Impacts of Plug-in Electric Vehicles—Phase 1 Study. TR 1024101. December.
Maitra A, Kook K, Taylor J, Giumento A. 2009. Evaluation of PEV loading characteristics on Hydro-Quebec’s distribution system operations. Electric Vehicle Symposium (EVS)24, Stavanger, Norway, May 13-16. Available online at www.cars21.com/knowledge/papersView/47.
Mangharam R. 2013. The car and the cloud: Automotive architecture for 2020. In Frontiers of Engineering: Reports on Leading-Edge Engineering from the 2012 Symposium. Washington, DC: National Academies Press.
NEC [National Electrical Code]. 1996. NEC Handbook, NFPA 70. Article 625, Electrical Vehicle Charging System Equipment, Section 625-2. Quincy MA: National Fire Protection Association.
Taylor J, Maitra A, Alexander M, Brooks D, Duvall M. 2009. Evaluation of the impact of PEV loading on distribution system operations. IEEE Power Engineering Society, Calgary, July.
Vyas A, Wang M, Santini D, Elgowainy A. 2009. Analysis of the 2001 National Household Transportation Survey in support of the PHEV project to evaluate impacts on electricity generation and GHG emissions. Unpublished information.


