
E
Assessing the Cost-Effectiveness of Development and Use of the Total Artificial Heart
THIS APPENDIX DESCRIBES the framework and results of an analysis of the cost-effectiveness of the eventual development and use of the total artificial heart (TAH). The analysis was conducted in support of and collaboration with the Institute of Medicine (IOM) Committee to Evaluate the Artificial Heart Program of the National Heart, Lung, and Blood Institute (NHLBI). The overall aim of the analysis was to provide information to support the committee's consideration of two questions. First, how well is the TAH likely to perform when it is in routine use, approximately in the year 2010? Second, what are the possible outcomes, in terms of device availability and cost, of higher levels of NHLBI support for TAH research and development? Both of these questions were addressed using a cost-effectiveness framework.
Given (1) our lack of clinical experience with the TAH and (2) the obvious uncertainties associated with research and development activities, it should be apparent that this kind of exercise cannot provide definitive conclusions or precise estimates. Rather, the intent was to explore some of the likely outcomes and trade-offs under alternative sets of plausible as
This appendix was prepared by Louis P. Garrison, Jr., of the Project HOPE Center for Health Affairs. He worked closely as a consultant with committee members and project staff to develop both the model and the estimates. The Markov model estimates were prepared using a software package called Decision Maker (Version 6.2). A copy of the computer model can be obtained from the National Technical Information Service (NTIS), U.S. Department of Commerce, Springfield, Virginia 22161.
sumptions and scenarios that were developed through discussions with the committee and other experts.
BACKGROUND
Aside from medical therapies, heart transplantation is currently the only clinical option for patients suffering from end-stage heart failure. As discussed in Chapter 4, the number of potential heart transplant recipients greatly exceeds the available supply of donor hearts. Several types of long-term mechanical circulatory support devices are being developed in order to treat these heart failure patients. Currently, the ventricular assist device has the best prospect of being available in the near future. Although this device will potentially be able to serve a large number of heart failure patients, it is unlikely to work satisfactorily for the subset of patients with both right and left heart failure. Hence, several groups in the United States, four of which have NHLBI support, are continuing their efforts to develop a total heart replacement device.
In order to address the issue of the level of resources that society should devote to research and development of the TAH, it is important to develop an understanding of the likely costs and outcomes of such investments. Given the uncertainties of such a question, however, it is not obvious that a quantitative, as opposed to qualitative, approach is either necessary or preferred. Nonetheless, the committee chose to have data gathered and compiled to illustrate some of the quantitative dimensions of the issue.
The information was compiled in a cost-effectiveness analysis (CEA) framework for two separate but related issues:
-
The future cost-effectiveness of the artificial heart in use, compared to alternative surgical and medical therapies.
-
The cost-effectiveness of alternative research and development strategies for developing TAHs.
The framework and estimates associated with each of these issues are presented in the following sections. Although the R&D investment must come before the TAH is available for use, it is useful to consider first the cost-effectiveness in use since the diffusion of the device becomes the benefit of the investment.
ESTIMATING THE COST-EFFECTIVENESS OF THE ARTIFICIAL HEART IN ROUTINE USE
Approach
To estimate the cost-effectiveness of the artificial heart in routine use, a Markov simulation model was used, permitting variations in assumptions
about cost, clinical, and outcome variables. Both the structure of the model and the parameter estimates were developed in collaboration with the committee and its expert consultants. In forecasting the parameter estimates, it is necessary to have a frame of reference in terms of both time and the case mix of patients. The committee saw the period beginning in 2010 as the earliest when a TAH might be in routine use.
The typical patient is seen as a moribund 50 year old (New York Heart Association Class IV) with life expectancy measured in days or weeks. It is assumed that 75 percent of the patients would be male and 25 percent female. In the model, this directly affects the average mortality from all other causes.
Structure of the Model
The clinical process of receiving a TAH was conceived of as a Markov process in which the typical patient moves through a sequence of potential “states” on a monthly, probabilistic basis. The cost effectiveness of TAH implantation was considered relative to two alternative therapies —conventional medical treatment and heart transplantation. The 10 possible states under TAH implantation are shown in Table E.1. For example, a patient who receives a TAH in the first month and is discharged alive could, in the second month, fall into one of nine different states, including having the device fail, having a well-functioning device, and being hospitalized for complications.
In the model, the patient is followed through this process over a 20-year period (240 monthly cycles in the model). Each month the TAH recipient is
TABLE E.1 States in a Markov Model of Artificial Heart Implantation
|
TAH Recipient States Implantation Well-functioning implant Complications—Infection Complications—Thromboembolism Complications—Bleeding Complications—Psychological Complications—Other Soft device failure Hard device failure Death |
Heart Transplant Recipient States Transplantation Well-functioning organ Complications Rejectiona Death |
|
aIncludes both early (acute) rejection and late (chronic) rejection. TAH, total artificial heart. |
|
TABLE E.2 Assumptions for Cost-Effectiveness Analysis of Total Artificial Hearts in Routine Use
|
in one of the 10 states. The “outcomes” associated with each monthly cycle can be classified into the two broad categories of costs and benefits, although there are several possible ways to define these. As indicated in Table E.2, this analysis considers costs narrowly: only medical costs are analyzed. Benefits are measured quantitatively in terms of average expected life years gained and of quality-adjusted life years (QALYs) gained. The quality adjustments are made through utility ratings of each state.
in one of the 10 states. The “outcomes” associated with each monthly cycle can be classified into the two broad categories of costs and benefits, although there are several possible ways to define these. As indicated in Table E.2, this analysis considers costs narrowly: only medical costs are analyzed. Benefits are measured quantitatively in terms of average expected life years gained and of quality-adjusted life years (QALYs) gained. The quality adjustments are made through utility ratings of each state.
Several of these assumptions are summarized in Table E.2. Note also that the analysis takes a societal perspective and makes estimates in real dollars (i.e., constant 1991 dollars).
Parameter Estimates
The clinical and cost parameters of the model were estimated by an expert panel of cardiologists, surgeons, and engineers. The panel members were asked to predict the probabilities and outcomes of the events associated with the 10 states in the Markov model. For each state, they estimated the annual probability that a TAH recipient would experience the state, the probability that death would result, the number of days spent in the hospital in both routine and intensive care, and the associated physician fees (see supplementary Table E.14 and Table E.15 at the end of the appendix). In addition, for some states, such as device failures, the probabilities of related events such as replacement and repair were estimated.
The base case probabilities are shown in Table E.3. It is estimated that 10 percent of those who receive the TAH implant will die during that initial stay. Annually, for the first seven years, an average of 5 percent are expected to experience a major or “hard” device failure, with 85 percent of them dying. This failure rate increases in subsequent years to over 50 percent after year 10. Also, for the first three years, 5 percent are expected to have a less serious “soft” device failure, requiring either a repair or replacement. This rate also increases in subsequent years.
TABLE E.3 Estimates of Clinical Parameters
|
State/Parameter |
Base Case |
|
TAH recipient |
|
|
Implantation |
|
|
% who die |
0.10 |
|
Hard device failure |
|
|
% who experiencea |
0.05 |
|
Of those |
|
|
% who die |
0.85 |
|
% with replacement |
0.10 |
|
% with repair |
0.05 |
|
Soft device failure |
|
|
% who experiencea |
0.05 |
|
Of those |
|
|
% who die |
0.10 |
|
% with replacement |
0.50 |
|
% with repair |
0.40 |
|
Infection |
|
|
% who experience |
0.05 |
|
Of those, % who die |
0.15 |
|
Thromboembolism |
|
|
% who experience |
0.10 |
|
Of those, % who die |
0.15 |
|
Bleeding |
|
|
% who experience |
0.10 |
|
Of those, % who die |
0.015 |
|
Psychological |
|
|
% who experience |
0.02 |
|
Of those, % who die |
0.00 |
|
Other complications |
|
|
% who experience |
0.20 |
|
Of those, % who die |
0.20 |
|
Well |
|
|
% who experience |
|
|
Of those, % who die (average) |
0.014 |
|
Conventional medical therapy |
|
|
Survival (months) |
6 |
|
Transplantation |
|
|
Transplant |
|
|
% who die |
0.05 |
|
% with major complications |
0.25 |
|
Rejection |
|
|
% who experiencea |
0.05 |
|
Of those, % who die |
0.02 |
|
Other complications |
|
|
% who experiencea |
0.30 |
|
Of those, % who die |
0.03 |
|
NOTES: All parameters are expressed as a probability on annual basis unless otherwise noted. “% who experience” is expressed as annual rate; other probabilities are expressed as a percentage of those experiencing the state. aRates vary in following years. bDetermined as residual. TAH, total artificial heart. |
|
TAH recipients are also subject to complications including infection, thromboembolism, bleeding, and psychological problems. The probability of dying as a result of each of these complications was also estimated. For example, annually an average of 5 percent of recipients are expected to have an infection requiring hospitalization. Fifteen percent of those hospitalized are expected to die. Age-specific general population mortality rates (for a recipient who ages from 50 to 70) were used to model deaths from other causes.
The probability of a month with a “well-functioning device” is estimated as a residual, i.e., what happens if none of these adverse events occurs. Since the estimates are based on expert judgments and not actual clinical experience with the TAH, developing the model from these micro-level parameter estimates does not necessarily generate plausible aggregate survival probabilities. As a consistency check, the experts were also asked to estimate the annual year-to-year overall survival probabilities as well. Their overall estimates imply a five-year survival rate of 60 percent for TAH recipients.
Relevant estimates were also made for the alternative therapies of conventional medical therapy and heart transplantation. For the former, an average survival of six months was projected. For the latter, as shown in Table E.3, the expert panel projected organ rejection probabilities and other complications in the aggregate. Thus, the model used for heart transplantation was much simpler, hence sacrificing some clinical detail.
Cost parameter estimates are shown in Table E.4. These were developed
TABLE E.4 Cost Parameter Estimates (expected cost during month in state)
|
State |
Base Case Cost per Month |
|
TAH recipients |
|
|
Evaluation (4 patients)a |
$ 45,600 |
|
Initial implantationb (incl. device cost and hospitalization) |
$157,000 |
|
Hard device failureb |
$ 19,500 |
|
Soft device failureb |
$ 74,800 |
|
Infection |
$ 20,400 |
|
Thromboembolism |
$ 17,000 |
|
Bleeding |
$ 30,900 |
|
Psychological complication |
$ 20,700 |
|
Other complications |
$ 26,700 |
|
Well-functioning device |
$ 800 |
|
Conventional medical therapy |
|
|
All forms of care |
$ 4,800 |
|
Heart transplantation |
|
|
Evaluation (5 patients)a |
$19,600 |
|
Initial transplant stay (incl. organ procurement and hospitalization costs) |
$58,100 |
|
Rejection stay |
$12,600 |
|
Complication stay |
$11,000 |
|
Well-functioning transplant |
$ 1,500 |
|
NOTE: Cost estimates are based on expert panel estimates (see Table E.14 and Table E.15) of hospital length of stay, percent of days in ICU, and physician fees; hospital costs assume a cost per day of $1,000 (regular room) and $2,000 (ICU). aFor TAH evaluation, expert panel estimates assumed hospitalization in all cases, in contrast to evaluation of potential transplant recipients, some of whom require less extensive hospitalization. bFor TAH recipients, the state of initial implantation includes device priced at $100,000. However, for hard and soft failures, only a fraction of patients receive another device (i.e., some die or have device repair). TAH, total artificial heart; ICU, intensive care unit. |
|
based on utilization estimates made by the expert panel. The utilization estimates are shown in supplementary Table E.14 and Table E.15, at the end of the appendix. The TAH device, in the base case, is expected to cost $100,000. The initial hospitalization associated with implanting the device is projected to cost $57,000. In addition, evaluation costs for four patients per eventual recipient are estimated at $45,600. Thus, the initial costs total more than $200,000 per recipient. This can be compared to $77,700 for the initial heart transplantation hospitalization, including the costs of evaluations of four other candidates who did not receive a transplant and procurement of the donor organ.
Complications and device failures can also lead to costly hospitalizations, ranging from $19,500 per hard device failure to over $30,000 for bleeding or other complications. The estimate for each state is the mean (weighted) cost based on the several events that can happen to a person in that state, such as death or complications, which may vary in their resource use.
The entire committee participated in rating the utilities associated with each of the states, depending upon whether the patient had a well-functioning TAH or was hospitalized. Using the time trade-off method, a utility was rated for each state on a scale in which 1.0 was well, 0 was death, and states worse than death were valued between 0 and −1.0. Their mean utility estimates are shown in Table E.5A. The estimation process and results are described in detail in Patrick and Erickson (forthcoming); the relevant states are described in the appendix to Chapter 6. It is noteworthy that those on conventional medical therapy were rated as having very poor or negative utilities. Table E.5B shows the mean utility for each state in the model for TAH and heart transplant recipients. The values are weighted averages of the values in the top panel, depending on the expected number of days per month spent in the hospital (and in the intensive care unit or not). These mean values were used to adjust life
TABLE E.5A Utility Values for End-Stage Heart Disease States by Time Trade-off Method
TABLE E.5B Implied Utility Values for End-Stage Heart Disease States in Model
|
TAH Recipient |
Heart Transplant Recipient |
Medical Treatment Only |
|
|
Well-functioning/average state |
0.66 |
0.75 |
0.07 |
|
Implant/transplant |
0.50 |
0.59 |
NA |
|
Complications |
|||
|
Infection |
0.57 |
NA |
NA |
|
Thromboembolism |
0.58 |
NA |
NA |
|
Bleeding |
0.52 |
NA |
NA |
|
Psychological |
0.56 |
NA |
NA |
|
Other/all |
0.54 |
0.68 |
NA |
|
Hard failure/rejection |
0.43 |
0.67 |
NA |
|
Soft failure |
0.56 |
NA |
NA |
|
Death |
0 |
0 |
0 |
|
NOTES: (1) Values are derived as weighted averages of numbers in Table E.5A based on average hospital stays (see Table E.14 and Table E.15). (2) For heart transplantation recipients, all complications were modeled together. (3) For conventional therapy, only one average state was modeled; the estimate of 0.07 reflects 20 days of hospitalization (or approximately 11 percent of the 6 months of life expectancy). TAH, total artificial heart; NA, not applicable. |
|||
years gained for differences in quality of life. The mean value for a month on conventional therapy was estimated at 0.07.
Both costs and benefits were discounted using several alternative discount rates—0, 3, 6, and 10 percent. For TAH recipients, over 50 percent of the costs are typically borne initially, associated with the implantation of the device. Yet, most of the benefits—in terms of quality-adjusted life years—come later. Hence, discounting costs and benefits will tend to reduce cost-effectiveness, that is, increase the C/E ratio. The 3 percent discount rate is used for all base case simulations.
Base Case
It is instructive first to compare TAH survival results using the event simulation with the experts' overall TAH estimates, and with their estimates for heart transplantation. These were as follows:
|
Year |
TAH Event Simulation |
TAH Overall Estimate |
Heart Transplant Event Simulation |
Heart Transplant Overall Estimate |
|
1 |
0.79 |
0.80 |
0.92 |
0.95 |
|
2 |
0.69 |
0.75 |
0.88 |
0.93 |
|
3 |
0.61 |
0.70 |
0.87 |
0.91 |
|
4 |
0.53 |
0.65 |
0.85 |
0.90 |
|
5 |
0.46 |
0.60 |
0.83 |
0.89 |
|
10 |
0.11 |
0.26 |
0.72 |
0.75 |
The TAH results from the event simulation are worse in terms of survival, but not outside a reasonable confidence interval around the overall estimates. The much lower survival probability shown in the tenth year for the TAH event simulation is due largely to a built-in acceleration in the model in the rate of hard and soft device failures. Survival probabilities for TAH recipients are significantly poorer than the survival experience expected in the future for heart transplant recipients, based on either event simulation or overall estimates.
Table E.6A and Table E.6B summarize costs, survival, and cost-effectiveness results for the base case for the three alternative therapies. Expected costs over the 20-year horizon are estimated to average $327,600 for each TAH patient. Average costs for conventional therapy are projected at $28,500, and the model for heart transplant patients yields average total costs of $298,200.
The average survival for TAH recipients is 53 months (4.42 years); for conventional medical therapy, 6 months; and for transplant patients, 135 months (11.3) years. Clearly, heart transplantation would be the modality of choice if a suitable donor heart can be found. It should be noted that expected average survival of 11.3 years (based on event simulation) would be a substantial improvement over current levels, based on the experts' assumption of clinical progress in transplantation between 1991 and 2010. The TAH is expected to both cost more and yield poorer survival than heart transplantation.
Cost-effectiveness for the artificial heart and transplantation, relative to conventional therapy, depends importantly on the quality adjustment. The quality adjustment has two offsetting impacts on life years. Because states associated with the TAH yield a utility of 0.66 at best (0.75 for heart transplant), quality-adjusted survival is at least one-third shorter. On the other hand, since conventional therapy produces very low positive utilities, the adjustment essentially makes the TAH and heart transplantation slightly more favorable in terms of quality-adjusted life expectancy.
Adjusting for quality of life effectively reduces TAH survival to 34.6 months (2.88 years). Compared with conventional therapy, the cost-
TABLE E.6A Cost-Effectiveness Results for Base Case: Cost and Outcomes by Therapy
TABLE E.6B Cost-Effectiveness Ratios for Base Case
|
Comparisona |
Incremental Cost (K$) |
Change in LY |
Marginal Cost/LY (K$/yr) |
Change in QALY |
Marginal Cost/QALY (K$/yr) |
|
Artificial heart vs. conventional medical (line 1 - line 3) |
$299.1 |
3.92 |
$76 |
2.85 |
$105 |
|
Transplantation vs. conventional medical (line 2 - line 3) |
$269.7 |
10.80 |
$25 |
8.42 |
$ 32 |
|
Transplantation vs. artificial heart (line 2 - line 1) |
$−29.4 |
−6.88 |
D |
−5.57 |
D |
|
NOTE: Cost and outcomes discounted at 3 percent per annum; 20-year horizon. aComparing the indicated lines of Table E.6A. K$, $1,000; LY, life years gained; QALY, quality-adjusted life years; D, dominated (clearly advantageous in both costs and benefits; therefore preferred). |
|||||
effectiveness of the artificial heart is estimated at $76,000 per life year gained before the quality adjustment and $105,000 per QALY after the adjustment has been made.
Sensitivity Analyses
Table E.7 summarizes the results of sensitivity analyses of both clinical and cost parameters. The upper portion of the table shows changes that would reduce the cost-effectiveness of the TAH. The alternative estimate
TABLE E.7 Sensitivity Analyses: Artificial Heart Model
|
Parameter |
Base Case |
Alternate Estimate |
Net Cost (K$) |
Net LY (yr) |
Net QALY (yr) |
Marginal Cost/LY (K$/yr) |
Marginal Cost/QALY (K$/yr) |
|
Base case |
— |
— |
$299 |
3.9 |
2.8 |
$ 76 |
$105 |
|
Worsening Cost-Effectiveness (changes that increase the C/E ratio) |
|||||||
|
Operative mortality |
0.10 |
0.15 |
$291 |
3.6 |
2.7 |
$ 80 |
$109 |
|
Hard failure mortality |
0.85 |
0.50 |
$327 |
4.3 |
3.1 |
$76 |
$106 |
|
Hard failure rates |
$282 |
3.3 |
2.4 |
$86 |
$117 |
||
|
Years 1-7 |
0.05 |
0.10 |
|||||
|
Years 8 and 9 |
0.15 |
0.15 |
|||||
|
Year 10 and later |
0.50 |
0.50 |
|||||
|
Soft failure rates |
$303 |
3.8 |
2.8 |
$ 80 |
$110 |
||
|
Years 1-3 |
0.05 |
0.10 |
|||||
|
Years 4-7 |
0.10 |
0.10 |
|||||
|
Years 8 and 9 |
0.15 |
0.15 |
|||||
|
Year 10 and later |
0.30 |
0.30 |
|||||
|
Infection/year |
0.05 |
0.15 |
$299 |
3.8 |
2.8 |
$ 79 |
$108 |
|
Emboli/year |
0.10 |
0.15 |
$299 |
3.8 |
2.8 |
$ 79 |
$108 |
|
Bleeding/year |
0.10 |
0.15 |
$306 |
3.9 |
2.8 |
$ 78 |
$108 |
|
Other complications |
0.20 |
0.25 |
$300 |
3.7 |
2.7 |
$ 80 |
$110 |
|
All of above |
— |
— |
$313 |
2.6 |
2.0 |
$108 |
$142 |
|
All of above and costs 25% higher |
— |
— |
$366 |
2.6 |
2.0 |
$126 |
$165 |
|
Improving Cost-Effectiveness (changes that lower the C/E ratio) |
|||||||
|
Operative mortality |
0.10 |
0.05 |
$307 |
4.2 |
3.0 |
$73 |
$102 |
|
Hard failure rates |
$312 |
4.2 |
3.1 |
$73 |
$102 |
||
|
Years 1-7 |
0.05 |
0.05 |
|||||
|
Years 8 and 9 |
0.15 |
0.05 |
|||||
|
Year 10 and later |
0.50 |
0.50 |
|||||
|
Soft failure rates |
$293 |
4.0 |
2.9 |
$73 |
$101 |
||
|
Years 1-3 |
0.05 |
0.05 |
|||||
|
Years 4-7 |
0.10 |
0.05 |
|||||
|
Years 8 and 9 |
0.15 |
0.05 |
|||||
|
Year 10 and later |
0.30 |
0.30 |
|||||
|
Infection/year |
0.05 |
0.02 |
$299 |
4.0 |
2.9 |
$75 |
$103 |
|
Emboli/year |
0.10 |
0.08 |
$299 |
4.0 |
2.9 |
$75 |
$104 |
|
Bleeding/year |
0.10 |
0.05 |
$293 |
3.9 |
2.8 |
$75 |
$103 |
|
Other complications |
0.20 |
0.15 |
$298 |
4.1 |
3.0 |
$73 |
$101 |
|
All four lower complications and lower hard failure mortality |
— |
— |
$337 |
5.0 |
3.6 |
$67 |
$ 95 |
or each parameter was chosen from the upper end of the range of the experts' estimates. The marginal cost-effectiveness values (Cost/LY and Cost/QALY) are expressed relative to conventional medical therapy, and all benefits and costs are discounted at 3 percent.
Taken singly, changes in any one of the complication rates or in operative mortality have a relatively small impact on cost-effectiveness —generally less than 10 percent. The sensitivity of the results to changes in the cost parameters is shown using an overall adjustment of 25 percent, which just increases the cost per life year by that percentage. Taken together, all of these changes would shorten life expectancy considerably and increase cost per life year substantially. Relative to conventional medical therapy, this would imply a cost per QALY of $165,000.
Possible parameter values that would improve cost-effectiveness are shown in the lower portion of Table E.7 and are based on the lower end of the ranges exhibited in the responses of the experts. As in the above panel, each of these variations has a relatively small impact on cost-effectiveness if taken alone. Together, however, if these parameters held, cost-effectiveness relative to conventional therapy would improve from $105,000 per QALY to $73,000 per QALY. Of course, the latter estimate would hold only if costs are 10 percent lower and if all of these clinical parameters were at their lower bound, which is very unlikely.
Using the usual range of discount factors, cost per QALY for the TAH, in comparison with conventional therapy, would vary as follows:
|
Discount Rate |
Cost per QALY |
|
0% |
$ 98,000 |
|
3% |
$105,000 |
|
6% |
$109,000 |
|
10% |
$117,000 |
The impact of discounting at 10 percent is to increase the C/E ratio by 11 percent above the base case. Hence, the relative cost-effectiveness of TAH implantation is not greatly affected by choice of discount rates.
Table E.8 compares the cost-effectiveness estimates generated here with those found for other heart disease treatments from previous studies. It is clear that the value of $105,000 per QALY for the TAH is considerably beyond the upper bound of what many would consider as generally acceptable for medical treatments and procedures. Heart transplantation projected at $32,000 per QALY in the future, however, would compare quite favorably with several of these other treatments.
COST-EFFECTIVENESS OF TAH RESEARCH AND DEVELOPMENT
Description of Scenarios
In addressing its mandate, the committee considered alternative NHLBI investment strategies and how they would affect the development of the device. These strategies are assumed to affect TAH development in terms of (1) the timing of the initial availability of a Food and Drug Administration-approved device and (2) the cost of the device to hospitals.
This poses the following trade-off. More front-end investment dollars (i.e., NHLBI project dollars) for R&D may make the device available sooner, but by definition at a higher development cost. More lives, and thus life years, would be saved as a result. Also, if more R &D dollars improve manufacturability, then the cost of the device when in routine use could be reduced for all patients.
In consultation with experts available to the committee, three alternative scenarios of this R&D investment decision were developed and are summarized in Table E.9. First, the base case (Scenario 1) assumes that twogroups will receive $2 millionof annual support throughout the preclinical testing period, and that oneof the groups will produce a device approved to begin clinical trials by 1998. During the clinical trial period, from 1999 to 2003, one device will be under trial, and that research group will continue to receive $2 million in annual support. The ultimate cost of the device to hospitals is projected to be $100,000 (in 1991 dollars) for the first 6 years, dropping then to a cost of $78,500 for the next six years, and eventually to $70,000.
It is important to emphasize that this base case is assumed to be the “default” strategy. In other words, it is assumed that this is the minimum amount that NHLBI will invest in the TAH over this period. Thus, the two alternative scenarios represent increases in investment dollars above this minimum. These scenarios were developed based on IOM staff discussions with members of the TAH research teams involved in the development of these types of devices.
TABLE E.8 Summary of Cost-Effectiveness Ratios of Selected Heart Disease Treatments
|
Treatment |
Cost per Life Year or Quality-Adjusted Life Year Gained (in 1991 dollars) |
|
Coronary Artery Bypass Graft Surgery |
|
|
Left main coronary artery disease |
$ 6,900 |
|
3-vessel coronary artery disease |
|
|
Severe angina |
14,400 |
|
Very mild angina, poor LV function |
9,500 |
|
Very mild angina, good LV function |
143,800 |
|
2-vessel coronary artery disease |
|
|
Severe angina |
33,500 |
|
Very mild angina |
89,900 |
|
1-vessel coronary artery disease |
|
|
Severe angina |
57,400 |
|
Very mild angina |
899,300 |
|
Beta-Blockade Post-Infarction |
|
|
High risk |
4,400 |
|
Medium risk |
7,200 |
|
Low risk |
28,800 |
|
Intracoronary Streptokinase |
|
|
Inferior infarction |
7,500 |
|
Anterior infarction |
2,900 |
|
Coronary Care Units (vs. intermediate care) |
|
|
High risk |
69,900 |
|
Low risk |
294,400 |
|
Mobile Coronary Care Units |
53,900 |
|
Percutaneous Transluminal Coronary Angioplasty |
|
|
Severe angina |
6,900-12,700 |
|
Mild angina |
47,200-102,400 |
|
Automatic Implantable Cardioverter Defibrillator (AICD)a |
22,900 |
|
Electrophysiologic Testingb |
32,400 |
|
Heart Transplantationc |
32,000 |
|
Implantation of Total Artificial Heartc |
105,000 |
|
aFor treatment of recurrent life-threatening ventricular arrhythmia, relative to drug treatment. bFor treatment of symptomatic bifascicular block, relative to observation; cost updated from 1985. cRelative to conventional medical therapy. LV, Left ventricular. SOURCES: For last two entries, this appendix; for percutaneous transluminalcoronary angioplasty, Wong et al. (1990); for AICD, S. G. Pauker,personal communication, 1991; for electrophysiologic testing, Becket al. (1987); for balance, M. C. Weinstein, personal communication,1991 (all but last two updated from 1988 for inflation by a factorof 1.15). |
|
TABLE E.9 Scenario Assumptions for Cost-Effectiveness Analysis of Impact of Increased Funding of TAH Development
|
Increased Funding |
|||
|
Scenario 1 (base case) |
Scenario 2 |
Scenario 3 |
|
|
Preclinical Testing |
|||
|
Number of R&D groups |
2 |
3 |
4 |
|
Amount per year per group |
$2 million |
$3 million |
$4 million |
|
Duration of testing (years) |
5 |
4 |
3.75 |
|
Dates of testing |
1/1/94-12/31/98 |
1/1/94-12/31/97 |
1/1/94-12/30/97 |
|
Clinical Trials |
|||
|
Number of R&D groups |
1 |
2 |
3 |
|
Amount per year per group |
$2 million |
$2 million |
$2 million |
|
Duration of trials (years) |
5 |
5 |
5 |
|
Dates of trial(s) |
1/1/99-12/31/03 |
1/1/98-12/31/02 |
1/1/97-9/30/02 |
|
Approved Device |
|||
|
Earliest approval date |
1/1/05 |
1/1/04 |
9/30/03 |
|
Device selling price |
$100,000, first 6 yrs.; $78,500, second 6 yrs.; $70,000 thereafter |
$78,500, first 6 yrs.; $70,000 thereafter |
$70,000 |
|
NOTE: All amounts are in 1991 dollars. TAH, total artificial heart; R&D, research and development. |
|||
Scenario 2 differs in that threegroups receive $3 millioneach in annual funding during 1993-1997, with the result that the device will become available 12 months soonerand at a lower costto hospitals of $78,500 (dropping to $70,000 after six years). Also, twogroups will have devices under clinical trials, and each group will receive $2 million in annual support from 1998 to 2002. Under Scenario 3, fourgroups each receives $4 millionannually over this initial period, with the device becoming available 15 monthsearlier than under Scenario 1. Also, threegroups will have devices in clinical trials from late 1997 to late 2002. Each of these groups will receive $2 million in annual support. The device will cost hospitals $70,000.
Pursuing either alternative Scenario 2 or 3 has three major impacts with regard to costs and benefits. First, the cumulative R&D investment dollars under these two scenarios are greater. But this expenditure produces two benefits. The earlier availability of the device means that an additional 12 (or 15) months of TAH implantation will be carried out. This, in essence, produces a cohort of individuals (in approximately the year 2010) who would not have received the device otherwise. The second benefit, the reduction in device cost, will affect not only this 12-15 month cohort, but
also all patients who receive the device for the ensuing 12 years. The cost savings from this will more than offset the increased front-end R&D expenditures.
Based on the epidemiological analysis discussed in Chapter 4, the following analysis works with three alternative aggregate annual volume assumptions: 2,000; 10,000; and 20,000. For moribund patients, the lowest assumption is the most plausible, and it is considered to be the most likely at this time.
Results
Table E.10 shows the R&D costs under three alternative investment scenarios. Scenario 2 costs twice as much as Scenario 1, and Scenario 3 costs three times as much as Scenario 1. This more or less holds regardless of the discount rate. At a 3 percent discount rate, the additional cost of Scenario 2 is $22 million, and that of Scenario 3 is $50 million. As explained above, two different, essentially unrelated benefits may result—earlier availability and lower device cost.
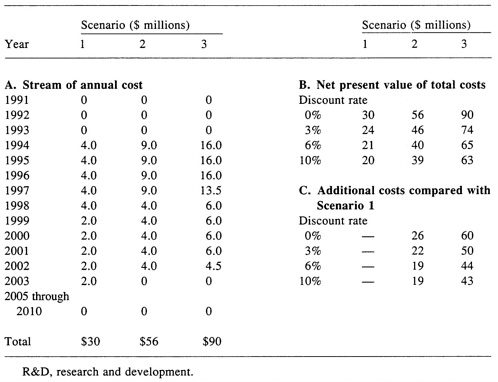
Table E.11 shows the additional life years saved under Scenarios 2 and 3. Again, this is due solely to the additional patients kept alive by the earlier availability of the device (1 year under Scenario 2 and 15 months under Scenario 3). Depending on the volume of patients and the discount rate, thousands of life years could be saved, even at the lowest volume. For example, at a 3 percent discount rate and 2,000 patients per year, 5,051 (Scenario 2) and 5,993 (Scenario 3) life years could be saved. Adjusting for quality of life, this corresponds to 3,250 QALYs under Scenario 2 and 4,087 QALYs under Scenario 3.
Table E.12 shows the incremental cost-effectiveness of the additional R&D investment under Scenarios 2 and 3. In the base case, considering the R&D investment stream and the future reductions in device cost, the marginal cost per QALY is approximately $97,000, lower than the $105,000 under the treatment CEA because the TAH price does not remain a constant $100,000. The two alternative scenarios, although involving higher R&D costs, result in lower device costs for a time and in the device becoming available sooner.
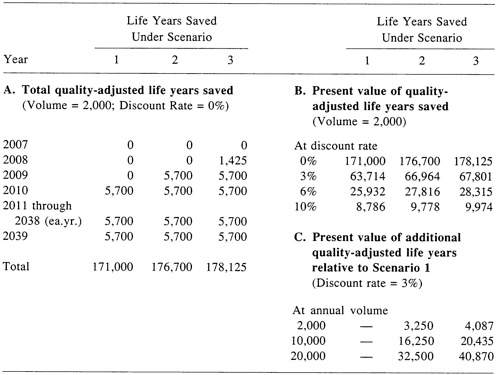
TABLE E.12 Cost-Effectiveness of Alternative R&D Scenarios
|
Increased Funding |
|||
|
Scenario 1 (base case) |
Scenario 2 |
Scenario 3 |
|
|
Assumptions |
|||
|
Date of first implant |
1/1/10 |
1/1/09 |
10/1/08 |
|
Device selling price |
|||
|
First 6 years |
$100,000 |
$ 78,500 |
$ 70,000 |
|
Second 6 years |
$ 78,500 |
$ 70,000 |
$ 70,000 |
|
Thereafter |
$ 70,000 |
$ 70,000 |
$ 70,000 |
|
Net treatment cost per patient (discounted as of date of first implant) |
$299,100a |
$273,400b |
$263,200 |
|
Results |
|||
|
Total costs (millions) |
$ 6,155 |
$ 6,287 |
$ 6,335 |
|
Total QALYs gained |
63,714 |
66,964 |
67,801 |
|
Marginal cost per QALY of TAH in clinical use (all annual cohorts) c |
$ 97,000 |
$ 94,000 |
$ 93,000 |
|
Incremental R&D cost-effectiveness, compared with Scenario 1 (per QALY) |
NA |
$ 41,000 |
$ 44,000 |
|
NOTES: Assumptions applicable to all scenarios: 2,000 patients per year; R&D investment during 1994-2003; 3 percent discount rate; 2.85 net QALYs gained per TAH recipient; total costs and total QALYs are discounted to 1991; horizon is 2039 for all three scenarios. a Will decrease in 2015 and again in 2021 with reductions in device cost to $78,500 and $70,000. b Will decrease in 2015 with reduction in device cost to $70,000. c Cost per QALY of TAH use compared with medical treatment only. R&D, research and development; QALY, quality-adjusted life year; TAH, total artificial heart; NA, not applicable. |
|||
For example, under Scenario 3, the additional discounted R&D costs are $50 million (Table E.10, section C). Putting aside the earlier availability of the device, the cost savings from the price reduction alone are about $230 million. Thus, on those grounds alone, this marginal investment would be desirable ifthe result were certain (which it is not) and if the cost per QALY for the TAH in clinical practice, compared with medical treatment, were acceptable (which it may not be).
Having the device available sooner increases the total costs (due to the treatment costs per patient) as well as total discounted life years saved, compared to Scenario 1. In considering the marginal impact under Scenario 3, for example, the net cost savings of approximately $180 million ($230 million – $50 million) effectively offset a portion of the additional dis-
TABLE E.13 Sensitivity Analyses: Cost-Effectiveness of Alternative R&D Outcomes
|
Device Parameters |
Cost-Effectiveness Implications |
||||
|
Cost ($000s) |
Year Available |
Total Costs ($ millions) |
Total QALYs |
Marginal Cost per QALY for All Annual Cohortsa ($000s) |
Incremental R&D Cost-Effectivenessb ($000s per QALY) |
|
Base case |
|||||
|
$100c |
2010 |
$6.155 |
63,714 |
$97 |
NA |
|
Alternative outcomesd |
|||||
|
$78.5 |
2009 |
$6,287 |
66,964 |
$94 |
$41 |
|
$78.5 |
2008 |
$6,597 |
70,312 |
$94 |
$76 |
|
$78.5 |
2007 |
$6,917 |
73,761 |
$94 |
$76 |
|
$70 |
2009 |
$6,258 |
66,964 |
$93 |
$32 |
|
$70 |
2008 |
$6,567 |
60,312 |
$93 |
$62 |
|
$70 |
2007 |
$6,886 |
73,761 |
$93 |
$73 |
|
$50e |
2009 |
$5,694 |
66,964 |
$85 |
|
|
$50 |
2008 |
$5,975 |
70,312 |
$85 |
$13 |
|
$50 |
2007 |
$6,264 |
73,761 |
$85 |
$37 |
|
NOTE: Same assumptions as for Table E.12: 2,000 cases per year; base case time frame, 2010-2039; all costs and QALYs discounted at 3 percent; horizon 2039 for all three scenarios. aCost per QALY of TAH use compared with medical treatment only. bCompared with Scenario 1 (base case). cAs in Table E.12, cost declines to $78,500 in 2016 and $70,000 in 2022 (total cost differs from the original base case, in which the $100,000 device cost did not decline). dAlternative outcomes with device cost at $78,500 assume investment Scenario 2; those with device cost at $70,000 or $50,000 assume investment Scenario 3. eAlternative outcomes with $50,000 device cost are compared with base case with device cost of $50,000; total cost is $5.780 billion. fCost reducing in toto. R&D, research and development; QALY, quality-adjusted life year; NA, not applicable. |
|||||
counted treatment costs for the 2,500 recipients (in the 15 months). Thus, the in-cremental cost of obtaining the additional 4,087 QALYs is about $44,000, far below the cost per QALY of TAHs implanted in 2010 and thereafter. Similarly, under Scenario 2, the incremental cost per QALY is approximately $41,000.
Sensitivity Analyses
Clearly, if the cost savings from Scenarios 2 and 3 were certain to be realized and if the TAH were, in 2010 and beyond, to be an acceptable use of resources, then either of those two scenarios would be preferred to Scenario 1 (which of course is not to say that any of the three should be undertaken). The additional savings in terms of life years would further strengthen the case. However, the committee understandably expressed considerable uncertainty about the likelihood of these scenarios. Hence, sensitivity analysis was undertaken to judge the potential impact of this uncertainty.
Table E.13 summarizes the sensitivity of the incremental C/E results to changes in assumptions about device cost savings and availability. One result is noteworthy: earlier availability alone tends to increase marginal cost per QALY as the aggregate (more or less constant) cost savings are subtracted from a larger sum of incremental operating costs.
Given the uncertainties involved, it is entirely possible that one could pursue investment Scenario 2 or 3 but obtain the result of Scenario 1 (i.e., device cost of $100,000 and availability in 2010). Nonetheless, spreading the additional R&D costs (of Scenario 2 or 3) over a discounted base of 62,375 QALYs (under Scenario 1) would have a small impact (an increase of less than $1,000) on the base case cost per QALY of $97,000. Of course, this assumes that Scenario 1 is the worst case outcome, which it may not be. It is certainly possible that the device could cost more, have worse outcomes, or not be available by 2010.
CONCLUSION: MAJOR FINDINGS AND LIMITATIONS
The approach taken here is unusual in several respects. First, cost-effectiveness analyses typically rely to a much greater extent on the existing clinical literature. Of course, this could not be done since the TAH is a technology under consideration for the future and does yet exist. Second, cost-effectiveness analysis has rarely been used to frame long-run public R&D investment decisions in the health sector. At the very least, this attempt illustrates some of the difficulties and long-run trade-offs that are involved in such questions.
The key finding was that, as experts currently conceive of the technology, the total artificial heart is likely to be more expensive than technologies currently in use. At approximately $100,000 per QALY gained, its C/E ratio is substantially less favorable than the C/E ratios for heart transplantation and renal dialysis and, therefore, many would currently regard it as questionable or borderline on a cost-effectiveness basis. The experts' vision of the TAH describes a technology that could in the future provide
TABLE E.14 Utilization and Cost Estimates for Developing Costs for Each State
clinical benefits that many patients would like to have available. However, the experts forecast outcomes much less favorable than what they see as the future of heart transplantation.
The long-run R&D investment decision is also difficult given the uncertainties associated with the outcomes. On the one hand, for only an additional $20 to $50 million over the next 15 years, we might be able to save hundreds of millions of dollars in device costs and thousands of life years. On the other hand, even with these gains, the TAH's cost per quality-adjusted life year gained is still likely to be on the order of between $80,000 and $100,000. Despite considerable uncertainties, as a marginal decision, the two alternative R&D scenarios do not appear to be particularly risky or costly. However, since they also have only a minimal impact on the over-all cost per QALY, they do not make the overall decision concerning the desir-
TABLE E.15 Fee and Follow-up Cost Estimates for Developing Costs for Each State
ability of investing in TAH development any easier. As suggested above, it is entirely possible that the device could cost more, have worse outcomes, or become available later than is assumed under the base case scenario.
Several limitations of this analysis should be reemphasized. Neither the clinical or cost parameters were developed from meta-analysis or other syntheses of the literature. Only a small number of exceptionally knowledgeable experts were consulted, and there was a substantial spread in many of their estimates. Also, although computationally complex, the models, especially for heart transplantation and conventional therapy, are crude approximations of what couldbe developed from current literature, given more resources and time. The cost parameters attempted to measure economic costs to society, but given the lack of accurate information on something as basic as the cost of a day in an intensive care unit, the cost estimates should also be considered approximations.
REFERENCES
Beck, J. R., D. N. Salem, N. A. M. Estes, and S. G. Pauker. 1987. A computer-based Markov decision analysis of the management of symptomatic bifascicular block: The threshold probability for pacing . Journal of the American College of Cardiology 9:920-935.
Patrick, D. L., and P. Erickson. Forthcoming. Health Status and Health Policy. New York: Oxford University Press.
Wong, J. B., F. A. Sonnenberg, D. N. Salem, and S. G. Pauker. 1990. Myocardial revascularization for chronic stable angina: Analysis of the role of percutaneous transluminal coronary angioplasty based on data available in 1989 . Annals of Internal Medicine 113:852-871.


