
THE MICROBIAL FORENSICS PATHWAY FOR USE OF
MASSIVELY PARALLEL SEQUENCING TECHNOLOGIES
Bruce Budowle,1,2Sarah E. Schmedes,1,2and Randall S. Murch1,3
The Challenge
Eliminating the threat of terrorist or criminal attacks with microorganisms or toxin weapons is a continual challenge for biodefense and biosecurity programs. The task is difficult for several reasons: (1) the relative ease of access to a variety of effective source materials (Srivatsan et al., 2008) and options for the delivery of a bioweapon, (2) the minute quantities of materials that can be transferred and yet still be effective, (3) the difficulties in detection and analysis of microbiological evidence, and (4) the lack of well-defined approaches regarding credible inferences that can be made from microbial forensic evidence given extant data. At the onset of an event, it may be difficult to distinguish between a deliberate attack and a naturally occurring outbreak of an infectious disease (Morse and
_______________________
1 Institute of Applied Genetics, University of North Texas Health Science Center, Fort Worth, TX.
2 Department of Forensic and Investigative Genetics, University of North Texas Health Science Center, Fort Worth, TX.
3 Virginia Tech, National Capital Region, Arlington, VA.
Budowle, 2006; Morse and Khan, 2005). Even if evidence strongly supports the hypothesis of a deliberate attack, it may still be very difficult to attribute the attack with certainty to those responsible (i.e., attribution). Attempts to resolve the crime will require advanced methods for characterizing microbial agents, as well as a combination of traditional investigation and intelligence gathering activities.
The Approach
In response to the need to determine the nature of the threat and the source of the weapon and to identify those who perpetrated the crime, the scientific community rose to the occasion beginning in 1996 and developed the field of microbial forensics. Microbial forensics is the scientific discipline dedicated to analyzing evidence from a bioterrorism act, biocrime, hoax, or inadvertent microorganism/toxin release for attribution purposes (Budowle et al., 2003, 2005a; Köser et al., 2012; Morse and Budowle, 2006). Another goal can be to support analysis of potential bioweapons capabilities for counter-proliferation, treaty verification, and/or interdiction. A forensics investigation initially will attempt to determine the identity of the causal agent and/or source of the bioweapon in much the same manner as in an epidemiological investigation. The epidemiological concerns are identification and characterization of specific disease-causing pathogens or their toxins, their modes of transmission, and any manipulations that may have been performed intentionally to increase their effects against human, animal, or plant targets (Morse and Budowle, 2006; Morse and Khan, 2005). A microbial forensics investigation proceeds further in that evidence is characterized to assist in determining the specific source of the sample, as individualizing as possible, and the methods, means, processes, and locations involved to determine the identity of the perpetrator(s) of the attack or to determine that an act is in preparation. A systems analysis may be able to determine the processes used to generate the weapon or how it was delivered, which also can help inform the investigation and attribution decision. The ultimate goal is attribution—to identify the perpetrator(s) or to reduce the potential perpetrator population to as few individuals as possible so investigative and intelligence methods can be effectively and efficiently applied to “build the case” (Figure A1-1).
Forensic Targets
Microbial forensic evidence may include the microbe, toxin, nucleic acids, protein signatures, inadvertent microbial contaminants, stabilizers, additives, dispersal devices, and indications of the methods used in a preparation. In addition, traditional types of forensic evidence may be informative and should be part of the toolbox of potential analyses of evidence from an act of bioterrorism or biocrime. Traditional evidence includes fingerprints, body fluids and tissues, hair, fibers, documents, photos, digital evidence, videos, firearms, glass, metals, plastics, paint, powders, explosives, tool marks, and soil. Other types of relevant
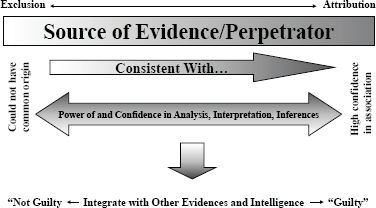
FIGURE A1-1 The microbial forensics attribution continuum.
evidence must be considered to exploit avenues to better achieve attribution, including proteins and chemical signatures. These types of signatures can only be obtained from crimes where the weaponized material or delivery device is found; they have little use in covert attacks where the biological agent is derived from the victims. Many of these methods are based on sound technologies and are complementary. They can be combined to identify signatures of sample growth, processing, and chronometry (Morse and Budowle, 2006). Matching of sample properties can help to establish the relatedness of disparate incidents. Furthermore, mismatches might have exclusionary power or signify a more complex causal relationship between the events under investigation. The results of these analyses can provide information on how, when, and/or where microorganisms were grown and weaponized. While the goal of a microbial forensic analysis is to characterize a sample such that it can be traced to a unique source or at least eliminate other sources, it is unlikely that microbial forensic evidence alone is currently adequate to meet this goal.
Emerging Science and Technology
To enhance attribution capabilities with microbial evidence, considerable attention is being invested in molecular genetics, genomics, and bioinformatics. These fields are essential to microbial species/strain identification, fine genome variation, virulence determination, pathogenicity characterization, possible genetic engineering, and attaining source attribution to the highest degree possible. The various tools that have been, or are being, developed in these areas will help to narrow the potential sources from which the pathogen used in an attack may have originated. Indeed, sequencing of an entire genome has been demonstrated
as feasible in epidemiological investigations, such as the recent studies of outbreaks of E. coli O104:H4 in Germany and cholera in Haiti (Brzuszkiewicz et al., 2008; Chin et al., 2011; Grad et al., 2012; Hasan et al., 2012; Hendriksen et al., 2011; Mellmann et al., 2011; Rasko et al., 2011; Rohde et al., 2011). In addition, metagenomics studies may become foundational on describing diversity and endemicity. Endemicity becomes important when the relationship between microbes or their genetic residues in samples collected from a site of interest and microbes in the environmental background need to be defined. While the inferential capacity of microbial forensics genetics has yet to reach its full power, the phenomenal new generations of sequencing technology and the concomitant developments for bioinformatics capabilities to handle and extract the explosion of data offer potentials for enhancing microbial forensic investigations. Indeed, the science and technology supporting microbial forensics are advancing at an inconceivable rate. For example, in 2002 in response to the anthrax letter attack, whole genomes of a few isolates were sequenced using shotgun sequencing by TIGR (Budowle et al., 2005b; NRC, 2009; Ravel et al., 2009; Read et al., 2002, 2003). That seemingly nominal analysis, by today’s capabilities, cost approximately $250,000 for one genome, took several weeks, and was unable to characterize but a few samples. Today, such enterprises are a fraction of the cost (and continue to drop dramatically), are becoming more automatable, and provide gigabases and terabytes of data in a matter of days (Bentley et al., 2008; Holt et al., 2008; Loman et al., 2012; MacLean et al., 2009; Margulies et al., 2005).
Given the enhanced capabilities of nucleic acid sequencing of microbes the microbial forensics community will embrace these molecular tools. Although developments are needed, one can envision identification of microbes at the species, strain, and isolate levels being transformed using next- (or better termed “current-”) generation sequencing (CGS). Fine genome detail could become available for routine microbial forensic use. Because CGS provides whole genome characterization capabilities with high depths of coverage (100s to 1,000s fold and beyond), the technology will serve a critical role for research, such as genetic diversity and endemicity studies via metagenomics, and become a rapid diagnostic tool initially when viable and culturable microbes are available. Indeed, whole genome sequencing will reduce the need for a priori design of assays directed at defined species. The technology should apply at some resolution level to any genome without knowledge of the target. In addition, whole genome sequencing offers the capability to evaluate a sample for indications of genetic engineering.
Current Realities
However, not all microbial forensic evidence will present itself in a manner where copious quantities of target are available. Some samples will be highly degraded and/or contaminated. Thus, there will be challenges to extract the most
information possible from limited materials and non-viable organisms. To meet these challenges, improved sample collection and extraction methods will be needed, nucleic acid repair methods will be sought, target amplification strategies such as whole genome amplification and selective target capture will be sought, and sequencing chemistries will be enhanced. Because of the throughput, CGS technologies can analyze multiple samples and not even begin to exploit the full throughput of the systems (Brzuszkiewicz et al., 2011; Cummings et al., 2012; Eisen, 2007; Hasan et al., 2012; Holt et al., 2008; Howden et al., 2011; Loman et al., 2012; MacLean et al., 2009; Relman, 2011; Rohde et al., 2011). However, the technology still is evolving and currently does not offer the sensitivity of detection to analyze low-quantity and low-quality DNA samples without some amplification approach prior to sequencing. Nonetheless, CGS is sufficiently mature to be considered useful for microbial forensic applications. Alternatively, technologies, such as mass spectrometry analyses of nucleic acids and real-time PCR, will continue to be used because they offer rapid detection (at species and strain levels) at substantially lower costs (Jacob et al., 2012; Kenefic et al., 2008; Sampath et al., 2005, 2009; U’ren et al., 2005; Vogler et al., 2008).
There are a number of CGS instruments and different chemistries. They include Miseq® System and Hiseq™ Sequencing Systems (Illumina, Inc., San Diego, CA), Ion Personal Genome Machine™ (PGM™) Sequencer, Ion Proton™ Sequencer and SOLiD® Systems (Life Technologies, Foster City, CA), and the 454 Genome Sequencer FLX and GS Junior Systems (Roche Diagnostics Corporation, Indianapolis, IN) (Bentley et al., 2008; Cummings et al., 2010; Loman et al., 2012; Margulies et al., 2005). In addition, single molecule detection platforms, such those from Pacific Bioscience (Chin et al., 2011; Eid et al., 2009) and possibly Oxford Nanopore (Branton et al., 2008) are on the horizon. Each system offers some advantages and limitations for sequencing that will need to be defined with considerations of library preparation, read length, and accuracy. The evaluations should be based on the needs of application-oriented laboratories and not necessarily those of a research laboratory. Initially, microbial forensics instruments will be maintained in controlled laboratory environments.
Library preparation is one of the critical limiting factors for transferring CGS technology from a research environment to that of an operational laboratory. Currently, only a few samples can be prepared at any given time. Thus, while the sequencing throughput of the platforms is high, a sufficient number of samples cannot be readily prepared in an appropriate amount of time to meet the full capacity of the system. Library preparation needs to be simplified. Haloplex (Agilent, Santa Clara, CA) is an example of a library preparation process that potentially can reduce the preparation work required (www.halogenomics.com). This library preparation approach is a single-tube target amplification methodology that enables a large number of library samples to be prepared manually. The general process is: (1) restriction digest and denature the sample; (2) hybridize probes to targeted ends of the digested fragments; (3) circularize and ligate the
molecules; and (4) introduce bar codes and amplify the targets by polymerase chain reaction (PCR). Eventually with automation the process might accommodate the number of samples that may be encountered by high-throughput operational laboratories. As many as 96 bar codes are available, which fits well with the 96-well format and reduces the preparation time from 2 weeks or several days to 6 hours. However, currently Haloplex is not available for use with non-human nucleic acids. One constraint is that the Haloplex system employs restriction digestion of the DNA. The restriction enzymes can potentially cleave a target site of interest (either a single nucleotide polymorphism (SNP) site or within a repeat motif) and render the marker untypable. Unfortunately, the enzymes used in Haloplex are proprietary, and one cannot readily scan for the restriction sites that would be incompatible with the designated targets (although palindromes can be sought for potential sites that may be obliterated). Another strategy for simplifying library preparation and decreasing sample input is that of the Nextera XT DNA Sample Preparation Kit (www.illumina.com). Strategies, such as the Haloplex system and the Nextera XT DNA kit, hold promise for simplifying and possibly automating library preparation.
Another factor to consider with CGS technology is sequencing read length and accuracy. Current read lengths for the most widely used CGS instruments typically do not exceed 200 bases, and when they do, the quality of base calling decreases substantially along the length of a read. Longer reads with higher accuracy are necessary. Advances in technology for some platform systems suggest that reads up to 400 bases will be feasible in 2012.
Another consideration of platform selection is for situations where rapid responses are required (such as in military operations, some pandemics, and bioterrorism acts). Initially, platforms will be placed in laboratories with controlled environments. One can envision the technology being taken to the field for immediate response and exigent circumstances. Robustness of the instrumentation, supply lines of reagents, and service support will be part of the decision process for the instrumentation/chemistry of choice. Fortunately, the technology and supporting interpretation tools continue to evolve and likely will become more robust.
Seeking More Power and Depth
For design and selection of systems and diagnostics, different diagnostic-based strategies can be considered. They can be based on the sample type, the sample matrix, the amount of work, or the question that one is attempting to address. The latter may be the best suited for conceiving workflow systems. The different scenarios should be considered where nucleic acid analyses may be applied, because these will help guide the needs for the microbial forensic community. They likely are (1) identification of species/strain (i.e., similar to epidemiological needs), (2) attribution, (3) genetic engineering, (4) sample-to-sample
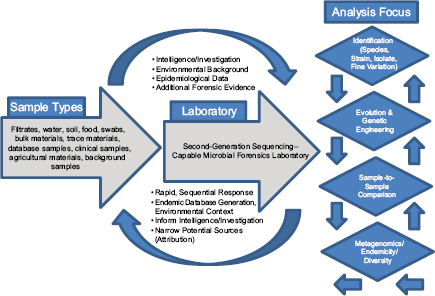
comparisons, and (5) metagenomics for endemicity (or a modified metagenomics for sample characterization) (Figure A1-2).
Sample identification generally would be direct characterization to identify the agent for immediate determination of potential threat and probable cause to investigate further. The process of attribution would drill down to the finest resolution possible and make comparisons to other reference samples, databases, or repositories to reduce the possible sources from which the sample originated or to a recent common ancestor. Genetic engineering could be detected by whole genome sequencing.
Metagenomics studies have been performed on several platforms, and they will likely provide some foundational data on diversity and endemicity (Eisen, 2007; Relman, 2011; Tringe et al., 2005). The value could be searching various niches for select agents. Suppose that in every sample tested certain select agents are identified. Then there can be two consequences: one is that it may be more difficult to elucidate natural outbreaks versus intentional releases (although strain resolution may reduce the uncertainty); the second could be that such high resolution may be less informative at some threshold depth of coverage.
Most metagenomic work to date has been by exploiting a small, single sequence target (16s rRNA), at a very high depth of coverage (Rusch et al., 2007; Venter et al., 2004). These studies often cannot provide resolution beyond family to genus levels. Clearly such broad range definition will not enable
individualization or identify select agents. The anthrax investigation could have benefited from a modified metagenomics characterization. The putative common source of the material (RMR1029) was composed of a population of very similar cells. The colony morphological variants found in the evidence from the 2001 anthrax letter attacks were minority components and because of sample preparation and stochastic effects the minor variants potentially could be difficult to detect with PCR-based assays that were developed for the investigation. Because of the high depth of coverage with CGS, the population of low-level variants may be more readily detected, especially if an amplification enrichment step was included that focused only on the known variant sites that defined the morphology types. Such high depth of coverage would substantially reduce the false-positive rate and improve confidence in the potential relationship of the most similar samples to focus investigative leads (Cummings et al., 2010). Indeed, the depth of coverage could be in the millions. While exquisitely sensitive, platform- and chemistry-specific errors may confound interpretation, and thus thresholds of reliability may be necessarily invoked.
One could envision extending this population depth analysis, which in essence is a simplified metagenomic analysis, and exploiting the concept of using a multi-locus sequence typing (MLST) approach to provide a species-level identification capability (Maiden et al., 1998; Spratt, 1999). A few loci (perhaps the seven typically applied to MLST to 15) could be selected as a standard (e.g., for bacteria). If there is a combination of sufficiently stable sites and evolutionarily rapid sites, the loci could indicate species- to strain-level presence in mixed and metagenomic samples. Using the core seven used for MLST could allow some questions regarding time and place of isolation, host or niche, serotype, and some clinical or drug resistance profiles. This will not be a trivial process because each of the sites will not be physically linked. However, one could determine, if the complete set or a reasonable subset of targets are in a sample, whether there is confidence that a particular species or sets of species are present. In theory this approach could be extended to strain levels. There certainly is enough through-put to consider this capability. The potential already has been established with electrospray ionization mass spectrometry of targeted genes for rapid bacterial species identification (and even for viruses such as influenza). There are sufficient bacterial genomes that have been sequenced to test our hypothesis, and work is under way.
Inferences about the significance of genetic evidence may not reach the ultimate goal of attribution. The most confounding constraint on reaching the full power of attribution is scant data on diversity and endemicity. The vast diversity of the microbial world is unknown and will not be defined substantially with current approaches in the area where a biocrime or bioterrorist attack has occurred. This limitation is not the sole purview of the microbial forensics community; it plagues the epidemiologists as well. Another limitation that evidentiary samples will likely have is an unknown history. Lack of knowledge on how it was manipulated (e.g., number of passages, exposure to mutagenic agents, length of storage)
will complicate providing inferences about the significance or strength of sequencing results, especially because the distance between samples will be determined by the degree of similarity or dissimilarity. Indeed, even defining what is a “match” or “similar” may not be straightforward. Keim (personal communication) has stressed this uncertainty and proffered new terminology—a “member,” to the microbial forensic lexicon based on phylogenetics for the relationship of a sample to some reference samples. Regardless of the terminology used, some data will be needed to define the uncertainty of a “membership” or “association.” In 2006, the need for reconciliation between microbial genomics and systematics was described; microbial forensics and epidemiology were seen to offer useful, practical venues to frame the gaps and priorities (Buckley and Roberts, 2006). This challenge remains.
Some assessment of the strength or significance of an analytical result and subsequent comparison also is needed (Budowle et al., 2008; Chakraborty and Budowle, 2011). Of course, because of scant supporting data, such an endeavor will be challenging. Qualitative and/or quantitative statements of the significance of the finding will need to be developed. As an example, consider a forensic analysis of whole genome sequence data that compared two or more sequences, such as an evidence sample profile with that of a reference sample that may be considered a possible direct link or have a common ancestor. The evolutionary rates of the variants will need to be known. But perhaps as consequential, sequencing error and other factors could inflate the dissimilarity between samples and add a degree of “uncertainty” to some extent. Thus, efforts in defining and quantifying the error rates associated with each CGS platform and chemistry are critically important.
Beyond comparison of samples for identification purposes are inferences by whole genome sequencing of phenotypic (i.e., functional) properties of a microbe. For example, even with a whole genome sequence whether a microbe phenotypically displays antimicrobial resistance or susceptibility is still limited. Bacteria may contain multiple pathways, and how the different genes interact is far from being completely understood (Eisen, 2007; Köser et al., 2012; Relman, 2011). Substantial research will be needed such that genotype can be used reliably to predict phenotype.
Making Sense of Data
The ever-increasing amount of microbial genomic sequence data presents a variety of challenges related to the handling and storage of data and the development of bioinformatics methods that can accommodate such large numbers of whole genomes. Being able to analyze the vast amounts of data in a timely fashion is a key challenge to leveraging the power of these newer sequencing platforms. Software, hardware, and IT support may be the greatest barrier to use of CGS technology. It is unlikely that dedicated bioinformaticists will reside in every microbial forensics laboratory. Data cannot be sent to web-based clouds
and be analyzed because the results may be classified. Instead, some standardization and standard operating data analysis and interpretation approaches will be needed. Pipeline and interpretation software will need to be evaluated for reliability and seamless diagnostic flow without bioinformatics expert intervention. The output of results must be intelligible to the microbial forensic analyst as well. The ideal software should be a comprehensive tool(s) enabling microbe detection to determination of engineering.
The government should rely heavily on industry and well-established genome centers. The commercial competitive environment is driving down costs and improving informatics pipelines without the need for extensive investment. Leveraging these efforts will help meet the needs of microbial forensics more expeditiously than going it alone. The centers (to include the national laboratories) are evaluating platforms and chemistries and are generating data at unprecedented levels. They are providing solutions to massive data handling, including storage, curation of reference data, annotation, and data analysis.
Collection and databases are needed to house the microbial genomic data and when possible the accompanying meta-data. No standards yet exist for building databases to meet the needs of the microbial forensic community. Requirements for storage and retrieval of raw sequence data in microbial forensics cases and supporting inferential data must be developed. Given the high throughput and anticipated speed of analyses, it is conceivable that meaningful databases can be developed “on the fly” that better reflect the diversity where the crime was committed (to include the preparation laboratory to the crime scene).
The power of microbial forensics techniques, tools, software, and databases that are used need to be understood, and their limitations even more so need to be understood. To achieve this goal methods need to be validated, and validation should be a requisite of any forensic repertoire. Indeed the forensic sciences in general are facing well-deserved criticism for not necessarily having sound foundations and overstating the strength of the evidence (NRC, 2009). Attempts to attribute any attack to a person(s) or group should rely on acurate and credible results. The interpretation of such results might seriously impact the course or focus of an investigation, thus affecting the liberties of individuals or even being used as a justification for a government’s military response to an attack or threat of an attack. Therefore, the methods for collection, extraction, and analysis of microbial evidence that could generate key results need to be as scientifically robust as possible, so the methods can be high performing and the results defensible for decision makers and to the legal, international government, law enforcement, and scientific communities, as well as scrutiny by the media.
Validation Is Essential
Validation is frequently used to connote confidence in a test or process, but it may be better thought of as defining the limitation of a method, process, or assay (Budowle et al., 2003, 2006, 2008). It still is common for the term validation
to be used vaguely or to remain undefined when applied to process performance evaluation. The degree of validation varies from nominal to rigorous. The consequences of such varied requirements can be catastrophic if methods used in microbial forensic investigations are poorly constructed, under-developed, or generate results that are difficult to interpret. The validation process needs to be defined as to what is expected to be achieved by a validation study.
Validation determines the limits of a test. It does not mean that a test must be 100 percent accurate or have no cross-reactivity, false-positive results, or false-negative results to be considered useful. It is often thought of as a process applied to the analytical portion of a system. This concept is only partly correct. The limits that the methods can provide must be demonstrated and documented for all steps of the process to include sample collection, preservation, extraction, analytical characterization, and data interpretation. Furthermore, it is recognized that as new technologies and capabilities are developed to address the needs of the microbial forensics community, key principles and performance parameters including accuracy, precision, bias, reliability, sensitivity, and robustness will need to be determined. Robust quality assurance and data control systems are required to achieve confidence in results by diverse users of the information. It is imperative that both technical and interpretation limitations (and thus accuracy and error) be defined. Additionally, a key resource for microbial forensic research, validation, and analysis is access to well-defined and curated microbial collections and data sets that are as comprehensive as is possible to the task. This effort includes the structure, content, and quality of the data sets. While some collections have been started for use in research, or created for case-specific use, no comprehensive repository exists to support microbial forensics, and standards are not codified for meta-data and data curation.
The implications of highly technical data, epidemiological data, traditional evidence data, and investigative or intelligence information are complex and need to be appreciated for their strengths and limitations. Because scientific data can affect the decision-making process for retaliation, preemptive actions, and/or courtroom deliberations, it is imperative that those directly involved in microbial forensics or those who may use the results for investigative lead value or more direct associations be properly educated (or at least properly apprised) of the implications of such data. To meet this necessary goal, education and training are critical to disseminate the principles, development, and applications of the evolving field of microbial forensics. Educational strategies and programs need to be constructed and training programs developed on the varied scientific foundations that support microbial forensics.
If validation processes are not defined and not followed and proper training or communication is not provided, then it is possible that a false sense of confidence may be associated with a poor method or process or from a result of limited significance. There are myriad methods, processes, targets, platforms, and applications. Yet some basic requirements transcend individual differences in methods, and these can be reinforced by contextual description (Table A1-1).
Validation needs to be codified. Efforts are under way and should be applied equally across the user space.
Conclusion
Microbial forensics should embrace and validate newly developed and emerging molecular biology technologies and phylogenetics approaches, and pursue potential forensic information and comparative sources, such as might be achieved through metagenomics. Genetic analyses of microorganisms often are a powerful tool for differentiating species, isolates, and strains. Similar to human DNA forensic identification, DNA sequences of microorganisms can be used to identify and differentiate between isolates and strains of a single microbial species; however, nucleic acid–based identification is not as resolving with respect to source attribution in microbial forensics as with human DNA forensic analysis. The basic constituents of nucleic acids essentially are the same for bacteria and humans; however, unlike humans, bacteria, viruses, and fungi multiply rapidly in a clonal fashion and can readily share or exchange genetic material between and among species. These differences and uncertainties due to scant supporting data must be taken into consideration during analysis, interpretation, and reporting related to the findings derived from microbial genetic evidence. For the foreseeable future
TABLE A1-1 Validation Criteria List
• Sensitivity
• Specificity
• Reproducibility
• Precision
• Accuracy
• Resolution
• Reliability
• Robustness
• Specified samples
• Purity
• Input values
• Quantitation
• Dynamic range
• Limit of detection
• Controls
• Window of performance for operational steps of assay
• Critical equipment calibration
• Critical reagents
• Databases
NOTE: It is difficult to prescribe the criteria for validation of the variety of methods that may be considered. The list is provided for consideration and is not meant to be exhaustive.
SOURCE: Derived from Budowle et al. (2008).
the ability of microbial forensics to establish that a sample collected from either a crime scene or a person of interest can be attributed to a known source to a high degree of scientific certainty will be limited. Therefore, the methods must be reliable and robust, and the uncertainty associated with any interpretation should be properly conveyed.
Microbial forensics experts and those who contribute in closely related fields need to work together to advance the science, to validate methods to scientific and legal standards, and to transition interpretation of results and conclusions from such analyses into something that can be used by the criminal justice system, the policy community, and other stakeholders. It is incumbent upon the microbial forensics community to make every effort to interpret and communicate objectively and effectively the advantages and limitations of both microbial forensics and traditional forensic science analyses. Consumers of microbial forensic information who incorporate this evidence into decision making should be provided accurate, reliable, credible, and defensible results, interpretations, and context.
References
Bentley, D. R., S. Balasubramanian, H. P. Swerdlow, G. P. Smith, J. Milton, C. G. Brown, K. P. Hall, D. J. Evers, C. L. Barnes, H. R. Bignell, J. M. Boutell, J. Bryant, R. J. Carter, R. K. Cheetham, A. J. Cox, D. J. Ellis, M. R. Flatbush, N. A. Gormley, S. J. Humphray, L. J. Irving, M. S. Karbelashvili, S. M. Kirk, H. Li, X. Liu, K. S. Maisinger, L. J. Murray, B. Obradovic, T. Ost, M. L. Parkinson, M. R. Pratt, I. M. J. Rasolonjatovo, M. T. Reed, R. Rigatti, C. Rodighiero, M. T. Ross, A. Sabot, S. V. Sankar, A. Scally, G. P. Schroth, M. E. Smith, V. P. Smith, A. Spiridou, P. E. Torrance, S. S. Tzonev, E. H. Vermaas, K. Walter, X. Wu, L. Zhang, M. D. Alam, C. Anastasi, I. C. Aniebo, D. M. D. Bailey, I. R. Bancarz, S. Banerjee, S. G. Barbour, P. A. Baybayan, V. A. Benoit, K. F. Benson, C. Bevis, P. J. Black, A. Boodhun, J. S. Brennan, J. A. Bridgham, R. C. Brown, A. A. Brown, D. H. Buermann, A. A. Bundu, J. C. Burrows, N. P. Carter, N. Castillo, M. C. E. Catenazzi, S. Chang, R. N. Cooley, N. R. Crake, O. O. Dada, K. D. Diakoumakos, B. Dominguez-Fernandez, D. J. Earnshaw, U. C. Egbujor, D. W. Elmore, S. S. Etchin, M. R. Ewan, M. Fedurco, L. J. Fraser, K. V. Fuentes Fajardo, W. S. Furey, D. George, K. J. Gietzen, C. P. Goddard, G. S. Golda, P. A. Granieri, D. E. Green, D. L. Gustafson, N. F. Hansen, K. Harnish, C. D. Haudenschild, N. I. Heyer, M. M. Hims, J. T. Ho, A. M. Horgan, K. Hoschler, S. Hurwitz, D. V. Ivanov, M. Q. Johnson, T. James, T. A. Huw Jones, G.-D. Kang, T. H. Kerelska, A. D. Kersey, I. Khrebtukova, A. P. Kindwall, Z. Kingsbury, P. I. Kokko-Gonzales, A. Kumar, M. A. Laurent, C. T. Lawley, S. E. Lee, X. Lee, A. K. Liao, J. A. Loch, M. Lok, S. Luo, R. M. Mammen, J. W. Martin, P. G. McCauley, P. McNitt, P. Mehta, K. W. Moon, J. W. Mullens, T. Newington, Z. Ning, B. L. Ng, S. M. Novo, M. J. O’Neill, M. A. Osborne, A. Osnowski, O. Ostadan, L. L. Paraschos, L. Pickering, A. C. Pike, A. C. Pike, D. C. Pinkard, D. P. Pliskin, J. Podhasky, V. J. Quijano, C. Raczy, V. H. Rae, S. R. Rawlings, A. Chiva Rodriguez, P. M. Roe, J. Rogers, M. C. Rogert Bacigalupo, N. Romanov, A. Romieu, R. K. Roth, N. J. Rourke, S. T. Ruediger, E. Rusman, R. M. Sanches-Kuiper, M. R. Schenker, J. M. Seoane, R. J. Shaw, M. K. Shiver, S. W. Short, N. L. Sizto, J. P. Sluis, M. A. Smith, J. Ernest Sohna Sohna, E. J. Spence, K. Stevens, N. Sutton, L. Szajkowski, C. L. Tregidgo, G. Turcatti, S. Vandevondele, Y. Verhovsky, S. M. Virk, S. Wakelin, G. C. Walcott, J. Wang, G. J. Worsley, J. Yan, L. Yau, M. Zuerlein, J. Rogers, J. C. Mullikin, M. E. Hurles, N. J. McCooke, J. S. West, F. L. Oaks, P. L. Lundberg, D. Klenerman, R. Durbin, and A. J. Smith. 2008. Accurate whole human genome sequencing using reversible terminator chemistry. Nature 456:53-59.
Branton, D., D. W. Deamer, A. Marziali, H. Bayley, S. A. Benner, T. Butler, M. Di Ventra, S. Garaj, A. Hibbs, X. Huang, S. B. Jovanovich, P. S. Krstic, S. Lindsay, X. S. Ling, C. H. Mastrangelo, A. Meller, J. S. Oliver, Y. V. Pershin, J. M. Ramsey, R. Riehn, G. V. Soni, V. Tabard-Cossa, M. Wanunu, M. Wiggin, and J. A. Schloss. 2008. The potential and challenges of nanopore sequencing. Nature Biotechnology 26:1146-1153.
Brzuszkiewicz, E., A. Thurmer, J. Schuldes, A. Leimbach, H. Liesegang, F. D. Meyer, J. Boelter, H. Petersen, G. Gottschalk, R. Daniel. 2011. Genome sequence analyses of two isolates from the recent Escherichia coli outbreak in Germany reveal the emergence of a new pathotype: Entero-aggregative-haemorrhagic Escherichia coli (EAHEC). Archives of Microbiology 193:883-891.
Buckley, M., and R. J. Roberts. 2006. Reconciling microbial systematics and genomics. Report of a Colloquium of the American Academy of Microbiology, Washington, DC: ASM Press.
Budowle, B., S. E. Schutzer, A. Einseln, L. C. Kelley, A. C. Walsh, J. A. Smith, B. L. Marrone, J. Robertson, and J. Campos. 2003. Building microbial forensics as a response to bio-terrorism. Science 301:1852-1853.
Budowle, B., S. E. Schutzer, M. S. Ascher, R. M. Atlas, J. P. Burans, R. Chakraborty, J. J. Dunn, C. M. Fraser, D. R. Franz, T. J. Leighton, S. A. Morse, R. S. Murch, J. Ravel, D. L. Rock, T. R. Slezak, S. P. Velsko, A. C. Walsh, R. A. Walters. 2005a. Toward a system of microbial forensics: From sample collection to interpretation of evidence. Applied and Environmental Microbiology 71:2209-2213.
Budowle, B., M. D. Johnson, C. M. Fraser, T. J. Leighton, R. S. Murch, and R. Chakraborty. 2005b. Genetic analysis and attribution of microbial forensics evidence. Critical Reviews in Microbiology 31(4):233-254.
Budowle, B., S. E. Schutzer, J. P. Burans, D. J. Beecher, T. A. Cebula, R. Chakraborty, W. T. Cobb, J. Fletcher, M. L. Hale, R. B. Harris, M. A. Heitkamp, F. P. Keller, C. Kuske, J. E. LeClerc, B. L. Marrone, T. S. McKenna, S. A. Morse, L. L. Rodriguez, N. B. Valentine, and J. Yadev. 2006. Quality sample collection, handling, and preservation for an effective microbial forensics program. Applied and Environmental Microbiology 72(10):6431-6438.
Budowle, B., S. E. Schutzer, S. A. Morse, K. F. Martinez, R. Chakraborty, B. L. Marrone, S. L. Messenger, R. S. Murch, P. J. Jackson, P. Williamson, R. Harmon, and S. P. Velsko. 2008. Criteria for validation of methods in microbial forensics. Applied and Environmental Microbiology 74:5559-5607.
Chakraborty, R., and B. Budowle. 2011. Population genetic considerations in statistical interpretation of microbial forensic data in comparison with the human DNA forensic standard. In: Microbial Forensics, 2nd ed., edited by: B. Budowle, S. E. Schutzer, R. Breeze, P. S. Keim, and S. A. Morse. Amsterdam: Academic Press. Pp. 561-580.
Chin, C. S., J. Sorenson, J. B. Harris, W. P. Robins, R. C. Charles, R. R. Jean-Charles, J. Bullard, D. R. Webster, A. Kasarskis, P. Peluso, E. E. Paxinos, Y. Yamaichi, S. B. Calderwood, J. J. Mekalanos, E. E. Schadt, and M. K. Waldor. 2011. The origin of the Haitian cholera outbreak strain. New England Journal of Medicine 364:33-42.
Cummings, C. A., C. A. Bormann-Chung, R. Fang, M. Barker, P. Brzoska, P. C. Williamson, J. Beaudry, M. Matthews, J. Schupp, D. M. Wagner, D. Birdsell, A. J. Vogler, M. R. Furtado, P. Keim, and B. Budowle. 2010. Accurate, rapid, and high-throughput detection of strain-specific polymorphisms in Bacillus anthracis and Yersinia pestis by next-generation sequencing. BMC Investigative Genetics 1:5.
Eid, J., A. Fehr, J. Gray, K. Luong, J. Lyle, G. Otto, P. Peluso, D. Rank, P. Baybayan, B. Bettman, A. Bibillo, K. Bjornson, B. Chaudhuri, F. Christians, R. Cicero, S. Clark, R. Dalal, A. deWinter, J. Dixon, M. Foquet, A. Gaertner, P. Hardenbol, C. Heiner, K. Hester, D. Holden, G. Kearns, X. Kong, R. Kuse, Y. Lacroix, S. Lin, P. Lundquist, C. Ma, P. Marks, M. Maxham, D. Murphy, I. Park, T. Pham, M. Phillips, J. Roy, R. Sebra, G. Shen, J. Sorenson, A. Tomaney, K. Travers, M. Trulson, J. Vieceli, J. Wegener, D. Wu, A. Yang, D. Zaccarin, P. Zhao, F. Zhong, J. Korlach, and S. Turner. 2009. Real-time DNA sequencing from single polymerase molecules. Science 323:133-138.
Eisen, J. A. 2007. Environmental shotgun sequencing: Its potential and challenges for studying the hidden world of microbes. PLoS Biology 5(3): e82.
Grad, Y. H., M. Lipsitch, M. Feldgarden, H. M. Arachchi, G. C. Cerqueira, M. Fitzgerald, P. Godfrey, B. J. Haas, C. I. Murphy, C. Russ, S. Sykes, B. J. Walker, J. R. Wortman, S. Young, Q. Zeng, A. Abouelleil, J. Bochicchio, S. Chauvin, T. DeSmet, S. Gujja, C. McCowan, A. Montmayeur, S. Steelman, J. Frimodt-Møller, A. M. Petersen, C. Struve, K. A. Krogfelt, E. Bingen, F-X. Weill, E. S. Lander, C. Nusbaum, B. W. Birren, D. T. Hung, and W. P. Hanage. 2012. Genomic epidemiology of the Escherichia coli O104:H4 outbreaks in Europe, 2011. Proceedings of the National Academy of Sciences USA 109:3065-3070.
Hasan, N. A., S. Y. Choi, M. Eppinger, P. W. Clark, A. Chen, M. Alam, B. J. Haley, E. Taviani, E. Hine, Q. Su, L. J. Tallon, J. B. Prosper, K. Furth, M. M. Hog, H. Li, C. M. Fraser-Liggett, A. Cravioto, A. Hug, J. Ravel, T. A. Cebula, and R. R. Colwell. 2012. Genomic diversity of 2010 Haitian cholera outbreak strains. Proceedings of the National Academy of Sciences USA 109(29):E2010-E2017.
Hendriksen, R. S., L. B. Price, J. M. Schupp, J. D. Gillece, R. S. Kaas, D. M. Engelthaler, V. Bortolaia, T. Pearson, A. E. Waters, B. P. Upadhyay, S. D. Shrestha, S. Adhikai, G. Shakya, P. S. Keim, and F. M. Aarestrup. 2011. Population genetics of Vibrio cholerae from Nepal in 2010: Evidence on the origin of the Haitian outbreak. MBio 2(4):e00157-e00111.
Holt, K. E., J. Parkhill, C. J. Mazzoni, P. Roumagnac, F-X. Weill, I. Goodhead, R. Rance, S. Baker, D. J. Maskell, J. Wain, C. Dolecek, M. Achtman, and G. Dougan. 2008. High-throughput sequencing provides insights into genome variation and evolution in Salmonella typhi. Nature Genetics 40:987-993.
Howden, B. P., C. R. E. McEvoy, D. L. Allen, K. Chua, W. Gao, P. F. Harrison, J. Bell, G. Coombs, V. Bennett-Wood, J. L. Porter, R. Robins-Browne, J. K. Davies, T. Seemann, T. P. Stinear. 2011. Evolution of multidrug resistance during Staphylococcus aureus infection involves mutation of the essential two component regulator WalKR. PLoS Pathogens 7(11):e1002359.
Jacob, D., U. Sauer, R. Housley, C. Washington, K. Sannes-Lowery, D. J. Ecker, R. Sampath, R. Grunow. 2012. Rapid and high-throughput detection of highly pathogenic bacteria by Ibis PLEX-ID technology. PLoS One 7(6):e39928.
Kenefic, L. J., J. Beaudry, C. Trim, R. Daly, R. Parmar, S. Zanecki, L. Huynh, M. N. Van Ert, D. M. Wagner, T. Graham, and P. Keim. 2008. High resolution genotyping of Bacillus anthracis outbreak strains using four highly mutable single nucleotide repeat markers. Letters in Applied Microbiology 46:600-603.
Köser, C. U., M. J. Ellington, E. J. Cartwright, S. H. Gillespie, N. M. Brown, M. Farrington, M. T. G. Holden, G. Dougan, S. D. Bentley, J. Parkhill, and S. J. Peacock. 2012. Routine use of microbial whole genome sequencing in diagnostic and public health microbiology. PLoS Pathogens 8(8):e1002824.
Loman, N. J., R. V. Misra, T. J. Dallman, C. Constantinidou, S. E. Gharbia, J. Wain, and M. J. Pallen. 2012. Performance comparison of benchtop high-throughput sequencing platforms. Nature Biotechnology 30(5):434-439.
MacLean, D., J. D. Jones, and D. J. Studholme. 2009. Application of “next-generation” sequencing technologies to microbial genetics. Nature Reviews Microbiology 7(4):287-296.
Maiden, M. C., J. A. Bygraves, E. Feil, G. Morelli, J. E. Russell, R. Urwin, Q. Zhang, J. Zhou, K. Zurth, D. A. Caugant, I. M. Feavers, M. Achtman, and B. G. Spratt. 1998. Multilocus sequence typing: A portable approach to the identification of clones within populations of pathogenic microorganisms. Proceedings of the National Academy of Sciences USA 95:3140-3145.
Margulies, M., M. Egholm, W. E. Altman, S. Attiya, J. S. Bader, L. A. Bemben, J. Berka, M. S. Braverman, Y-J. Chen, Z. Chen, S. B. Dewell, L. Du, J. M. Fierro, X. V. Gomes, B. C. Godwin, W. He, S. Helgesen, C. H. Ho, G. P. Irzyk, S. C. Jando, M. L. I. Alenquer, T. P. Jarvie, K B. Jirage, J-B Kim, J. R. Knight, J. R. Lanza, J. H. Leamon, S. M. Lefkowitz, M. Lei, J. Li, K. L. Lohman, H. Lu, V. B. Makhijani, K. E. McDade, M. P. McKenna, E. W. Myers, E. Nickerson, J. R. Nobile, R. Plant, B. P. Puc, M. T. Ronan, G. T. Roth, G. J. Sarkis, J. F. Simons, J. W. Simpson, M. Srinivasan, K. R. Tartaro, A. Tomasz, K. A. Vogt, G. A. Volkmer, S. H. Wang, Y. Wang, M. P. Weiner, P. Yu, R. F. Begley, and J. M. Rothberg. 2005. Genome sequencing in microfabricated high-density picolitre reactors. Nature 437:376-380.
Mellmann, A., D. Harmsen, C. A. Cummings, E. B. Zentz, S. R. Leopold, A. Rico, K. Prior, R. Szczepanowski, Y. Ji, W. Zhang, S. F. McLaughlin, J. K. Henkhaus, B. Leopold, M. Bielaszewska, R. Prager, P. M. Brzoska, R. L. Moore, S. Guenther, J. M. Rothberg, and H. Karch. 2011. Prospective genomic characterization of the German enterohemorrhagic Escherichia coli O104:H4 outbreak by rapid next-generation sequencing technology. PLoS One 6(7):e22751.
Morse, S. A., and B. Budowle. 2006. Microbial forensics: Application to bioterrorism preparedness and response. Infectious Disease Clinics of North America 20:455-473.
Morse, S. A., and A. S. Khan. 2005. Epidemiologic investigation for public health, biodefense, and forensic microbiology. In: Microbial Forensics, edited by R. Breeze, B. Budowle, and S. Schutzer. Amsterdam: Academic Press. Pp. 157-171.
NRC (National Research Council). 2009. Strengthening forensic science in the United States: A path forward. Washington, DC: The National Academies Press.
Rasko, D. A., P. L. Worshamb, T. G. Abshireb, S. T. Stanley, J. D. Bannand, M. R. Wilson, R. J. Langham, R. S. Decker, L. Jianga, T. D. Reade, A. M. Phillippy, S. L. Salzberg, M. Pop, M. N. Van Ert, L. J. Kenefic, P. S. Keim, C. M. Fraser-Liggett, and J. Ravel. 2011. Bacillus anthracis comparative genome analysis in support of the Amerithrax investigation. Proceedings of the National Academy of Sciences USA 108(12):5027-5032.
Ravel, J., L. Jiang, S. T. Stanley, M. R. Wilson, R. S. Decker, T. D. Read, P. Worsham, P. S. Keim, S. L. Salzberg, C. M. Liggett, and D. A. Rasko. 2009. The complete genome sequence of Bacillus anthracis Ames “Ancestor.” Journal of Bacteriology 191:445-446.
Read, T. D., S. L. Salzberg, M. Pop, M. Shumway, L. Umayam, L. Jiang, E. Holtzapple, J. D. Busch, K. L. Smith, J. M. Schupp, D. Solomon, P. Keim, and C. M. Fraser. 2002. Comparative genome sequencing for discovery of novel polymorphisms in Bacillus anthracis. Science 296:2028-2033.
Read, T. D., S. N. Peterson, N. Tourasse, L. W. Baillie, I. T. Paulsen, K. E. Nelson, H. Tettelin, D. E. Fouts, J. A. Eisen, S. R. Gill, E. K. Holtzapple, O. A. Okstad, E. Helgason, J. Rilstone, M. Wu, J. F. Kolonay, M. J. Beanman, R. J. Dodson, L. M. Brinkac, M. Gwinn, R. T. DeBoy, R. Madpu, S. C. Daugherty, A. S. Durkin, D. H. Haft, W. C. Nelson, J. D. Peterson, M. Pop, H. M. Khouri, D. Radune, J. L. Benton, Y. Mahamoud, L. Jiang, I. R. Hance, J. F. Wiedman, K. J. Berry, R. D. Plaut, A. M. Wolf, K. L. Watkins, W. C. Nierman, A. Hazen, R. Cline, C. Redmond, J. E. Thwaite, O. White, S. L. Salzberg, B. Thomason, A. M. Friedlander, T. M. Koehler, P. C. Hanna, A. B. Kolstø, and C. M. Fraser. 2003. The genome sequence of Bacillus anthracis Ames and comparison to closely related bacteria. Nature 423:81-86.
Relman, D. A. 2011. Microbial genomics and infectious diseases. New England Journal of Medicine 365:347-357.
Rohde, H., J. Qin, Y. Cui, D. Li, N. J. Loman, M. Hentschke, W. Chen, F. Pu, Y. Peng, J. Li, F. Xi, S. Li, Y. Li, Z. Zhang, X. Yang, M. Zhao, P. Wang, Y. Guan, Z. Cen, X. Zhao, M. Christner, R. Kobbe, S. Loos, J. Oh, L. Yang, A. Danchin, G. F. Gao, Y. Song, Y. Li, H. Yang, J. Wang, J. Xu, M. J. Pallen, J. Wang, M. Aepfelbacher, and R. Yang. 2011. E. coli O104:H4 Genome Analysis Crowd-Sourcing Consortium 2011. Open-source genomic analysis of Shiga-toxin-producing E. coli O104:H4. New England Journal of Medicine 365(8):718-724.
Rusch, D. B., A. L. Halpern, G. Sutton, K. B. Heidelberg, S. Williamson, S. Yooseph, D. Wu, J. A. Eisen, J. M. Hoffman, K. Remington, K. Beeson, B. Tran, H. Smith, H. Baden-Tillson, C. Stewart, J. Thorpe, J. Freeman, C. Andrews-Pfannkoch, J. E. Venter, K. Li, S. Kravitz, J. F. Heidelberg, T. Utterback, Y-H. Rogers, L. I. Falcón, V. Souza, G. Bonilla-Rosso, L. E. Eguiarte, D. M. Karl, S. Sathyendranath, T. Platt, E. Bermingham, V. Gallardo, G. Tamayo-Castillo, M. R. Ferrari, R. L. Strausberg, K. Nealson, R. Friedman, M. Frazier, and J. C. Venter. 2007. The Sorcerer II global ocean sampling expedition: Northwest Atlantic through Eastern Tropical Pacific. PLoS Biology 5:e77.
Sampath, R., N. Mulholland, L. B. Blyn, M. W. Eshoo, T. A. Hall, C. Massire, H. M. Levene, J. C. Hannis, P. M. Harrell, B. Neuman, M. J. Buchmeier, Y. Jiang, R. Ranken, J. J. Drader, V. Samant, R. H. Griffey, J. A. McNeil, S. T. Crooke, and D. J. Ecker. 2005. Rapid identification of emerging pathogens: Coronavirus. Emerging Infectious Diseases 11:373-379.
Sampath, R., N. Mulholland, L. B. Blyn, C. Massire, C. A. Whitehouse, N. Waybright, C. Harter, J. Bogan, M. S. Miranda, D. Smith, C. Baldwin, M. Wolcott, D. Norwood, R. Kreft, M. Frinder, R. Lovari, I. Yasuda, H. Matthews, D. Toleno, R. Housley, D. Duncan, F. Li, R. Warren, M. W. Eshoo, T. A. Hall, S. A. Hofstadler, and D. J. Ecker. 2009. Comprehensive biothreat cluster identification by PCR/electrospray-ionization mass spectrometry. Nature Reviews Microbiology 7(4):287-296.
Spratt, B. G. 1999. Multilocus sequence typing: Molecular typing of bacterial pathogens in an era of rapid DNA sequencing and the Internet. Current Opinion in Microbiology 2:312-316.
Srivatsan, A., Y. Han, J. Peng, A. K. Tehranchi, R. Gibbs, J. D. Wang, and R. Chen. 2008. High-precision, whole-genome sequencing of laboratory strains facilitates genetic studies. PLoS Genetics 4(8):e1000139.
Tringe, S. G., C. von Mering, A. Kobayashi, A. A. Salamov, K. Chen, H. W. Chang, M. Podar, J. M. Short, E. J. Mathur, J. C. Detter, P. Bork, P. Hugenholtz, and E. M. Rubin. 2005. Comparative metagenomics of microbial communities. Science 308:554-557.
U’ren, J. M., M. N. Vant, J. M. Schupp, W. R. Easterday, T. S. Simonson, R. T. Okinaka, T. Pearson, and P. Keim. 2005. Use of a real-time PCR TaqMan assay for rapid identification and differentiation of Burkholderia pseudomallei and Burkholderia mallei. Journal of Clinical Microbiology 43:5771-5774.
Venter, J. C., K. Remington, J. F. Heidelberg, A. L. Halpern, D. Rusch, J. A. Eisen, D. Wu, I. Paulsen, K. E. Nelson, W. Nelson, D. E. Fouts, S. Levy, A. H. Knap, M. W. Lomas, K. Nealson, O. White, J. Peterson, J. Hoffman, R. Parsons, H. Baden-Tillson, C. Pfannkoch, Y-H. Rogers, and H. O. Smith. 2004. Environmental genome shotgun sequencing of the Sargasso Sea. Science 304:66-74.
Vogler, A. J., E. M. Driebe, J. Lee, R. K. Auerbach, C. J. Allender, M. Stanley, K. Kubota, G. L. Andersen, L. Radnedge, P. L. Worsham, P. Keim, and D. M. Wagner. 2008. Assays for the rapid and specific identification of North American Yersinia pestis and the common laboratory strain CO92. BioTechniques 44:201-207.
MICROBIAL VIRULENCE AS AN EMERGENT PROPERTY: CONSEQUENCES AND OPPORTUNITIES4
Arturo Casadevall,5,* Ferric C. Fang,6Liise-anne Pirofski5
Although an existential threat from the microbial world might seem like science fiction, a catastrophic decline in amphibian populations with the extinction of dozens of species has been attributed to a chytrid fungus (Daszak et al., 1999; Pound et al., 2006), and North American bats are being decimated by Geomyces destructans, a new fungal pathogen (Blehert et al., 2009). Hence, individual microbes can cause the extinction of a species. In the foregoing instances, neither fungus had a known relationship with the threatened species; there was neither selection pressure for pathogen attenuation nor effective host defense. Humans are also constantly confronted by new microbial threats as witnessed by the appearance of HIV, SARS coronavirus, and the latest influenza pandemic. While some microbial threats seem to be frequently emerging or re-emerging, others seem to wane or attenuate with time, as exemplified by the decline of rheumatic heart disease (Quinn, 1989), the evolution of syphilis from a fulminant to a chronic disease (Tognotti, 2009), and the disappearance of “English sweating sickness” (Beeson, 1980). A defining feature of infectious diseases is changeability, with change being a function of microbial, host, environmental, and societal changes that together translate into changes in the outcome of a host–microbe interaction. Given that species as varied as amphibians and bats can be threatened with extinction by microbes, the development of predictive tools for identifying microbial threats is both desirable and important.
_______________________
4 Reprinted from PLoS Pathogens. Originally published as Casadevall A, Fang FC, Pirofski L-a (2011) Microbial Virulence as an Emergent Property: Consequences and Opportunities. PLoS Pathogens 7(7): e1002136. doi:10.1371/journal.ppat.1002136.
Editor: Glenn F. Rall, The Fox Chase Cancer Center, United States of America.
5 Department of Microbiology & Immunology and Medicine, Albert Einstein College of Medicine, Bronx, New York, United States of America.
6 Departments of Laboratory Medicine and Microbiology, University of Washington School of Medicine, Seattle, Washington, United States of America.
Published: July 21, 2011
Copyright: ©2011 Casadevall et al. This is an open-access article distributed under the terms of the Creative Commons Attribution License, which permits unrestricted use, distribution, and reproduction in any medium, provided the original author and source are credited.
Funding: The authors are supported by NIH grants AI-45459 (LP), AI44374 (LP), AI39557 (FCF), AI44486 (FCF), AI77629 (FCF), AI91966 (FCF), HL059842 (AC), AI033774 (AC), AI033142 (AC), and AI052733 (AC). The funders had no role in study design, data collection and analysis, decision to publish, or preparation of the manuscript.
Competing interests: The authors have declared that no competing interests exist.
* E-mail: arturo.casadevall@einstein.yu.edu
Virulence as an Emergent Property
To those familiar with the concept of emergence (Box A2-1), it probably comes as no surprise that microbial virulence is an emerging property. However, the traditional view of microbial pathogenesis has been reductionist (Fang and Casadevall, 2011), namely, assigning responsibility for virulence to either the microbe or the host. Such pathogen- and host-centric views, and in turn the scientific approaches fostered by these viewpoints, differ significantly in their historical underpinnings and philosophy (Biron and Casadevall, 2010). In fact, neither alone can account for how new infectious diseases arise. The conclusion that virulence is an emergent property is obvious when one considers that microbial virulence can only be expressed in a susceptible host (Casadevall and Pirofski, 2001). Consequently, the very same microbe can be virulent in one host but avirulent in another (Casadevall and Pirofski, 1999). Furthermore, host immunity can negate virulence, as evidenced by the effectiveness of immunization that renders a microbe as deadly as the variola virus completely avirulent in individuals inoculated with the vaccinia virus. Infection with a microbe can result in diametrically opposed outcomes, ranging from the death of a host to
BOX A2-1
The Concept of Emergent Properties
Emergent properties are properties that cannot be entirely explained by their individual components (Ponge, 2005). An element of novelty is also considered to be an essential attribute of “emergent,” a term that contrasts with “resultant” with the latter denoting an outcome that is predicted from the combination of the two components, such that resultant properties are additive whereas emergent properties are non-additive (Ablowitz, 1939). Another facet of emergent properties is that they are irreducible to their constituent components. Most treatises on emergence have emphasized that emergent properties have two components: an outcome that is greater than the sum of the parts and some form of novelty (Ablowitz, 1939; Baylis, 1929; Henpel and Oppenheim, 2011). Although the concept of emergence dates back to antiquity when Aristotle stated that the “whole is not just the sum of its parts,” there is increasing interest in emergent properties as it becomes increasingly evident that reductionistic approaches cannot explain many phenomena in our world (Parrish et al., 2011). Examples of emergent properties in liquids are surface tension and viscosity, neither of which can be explained by analysis of individual molecules, as the properties pertain to the macroscopic world, and these phenomena have no corresponding analogs in the molecular realm. Biological systems have been described as characterized by emergent properties that exist at the edge of chaos, such that small fluctuations in their conditions can lead to sudden major changes (Mazzocchi, 2008). Similarly, self-organized movements of individuals, as in schools of fish, can result in a variety of forms that are thought to protect against predators (Parrish et al., 2011).
elimination of the microbe. Hence, virulence is inherently novel, unpredictable, and irreducible to first principles.
Critical to our understanding of virulence as a property that can only be expressed in a susceptible host is that both the microbe and the host bring their own emergent properties to their interaction. Host and microbial cells receive and process information by signaling cascades that manifest emergent properties (Bhalla and Iyengar, 1999); e.g., gene expression studies reveal heterogeneous or bi-stable expression in clonal cell populations with important implications for phenotypic variability and fitness (Dubnau and Losick, 2006; Veening et al., 2008). Other emergent properties that have been identified in microbial and cellular systems could influence pathogenesis. Intracellular parasitism is associated with genome reduction, a phenomenon that could confer emergent properties, given that deliberate genome reduction in E. coli has led to unexpected emergent properties, such as ease of electroporation and increased stability of cloned DNA and plasmids (Posfai et al., 2006).
On the host side, many aspects of the immune system have the potential to spawn emergent properties. The antigenic determinants of a microbe are defined by antibodies and processing by host cells, consequently existing only in the context of an immune system (Van Regenmortel, 2004). Microbial determinants can elicit host-damaging immune responses. Such deleterious responses exemplify a detrimental emergent property of the same host defense mechanisms that mediate antimicrobial effects. The outcome of a viral infection can depend on prior infection with related or unrelated viruses that express related antigens; hence, the infection history of a host affects the outcome of subsequent infections (Welsh et al., 2010).
For those accustomed to viewing host–microbe interactions from an evolutionary perspective (Dethlefsen et al., 2007), the emergent nature of virulence is also no surprise, for the evolution of life itself can be viewed as an emergent process (Corning, 2002). Even in relatively well-circumscribed systems such as Darwin’s finches on the Galápagos Islands, evolutionary trends over time became increasingly unpredictable as a consequence of environmental fluctuations (Grant and Grant, 2002).
Consequences of the Emergent Nature of Microbial Virulence
The fact that virulence is an emergent property of host, microbe, and their interaction has profound consequences for the field of microbial pathogenesis, for it implies that the outcome of host–microbe interaction is inherently unpredictable. Even with complete knowledge of microbes and hosts, the outcome of all possible interactions cannot be predicted for all microbes and all hosts. Lack of predictability should not be unduly discouraging. Even in systems in which emergent properties reveal novel functions, such as fluid surface tension and viscosity, recognition of these properties can be useful. For example, molecular structure
might not predict the hydrodynamics of a fluid, but the empirical acquisition of information can be exploited to optimize pipeline diameter and flow rates. Novelty is unpredictable but novel events can be interpreted and comprehended once they have occurred (Ablowitz, 1939). A pessimist might argue that living systems are significantly more complex than flowing liquids. However, such pessimism may be unwarranted. The appearance of new influenza virus strains every year is an emergent property resulting from high rates of viral mutation and host selection of variants (Lofgren et al., 2007). Hence, the time or place in which new pandemics will arise or the relative proportion of strains that will circulate each year cannot be predicted with certainty. Nevertheless, the likely appearance of new strains can be estimated from the history of population exposure to given strains and knowledge of recently circulating strains, and this information can be used to formulate the next year’s vaccine.
A Probabilistic Framework
Although the field of infectious diseases may never achieve the predictive certainty achieved in other branches of medicine, it may be possible to develop a probabilistic framework for the identification of microbial threats. Although all known pathogenic host–microbe interactions have unique aspects, and it is challenging to extrapolate from experiences with one microbe to another, a probabilistic framework can incorporate extant information and attempt to estimate risks. For example, the paucity of invasive fungal diseases in mammalian populations with intact immunity has been attributed to the combination of endothermy and adaptive immunity (Robert and Casadevall, 2009). This notion could be extrapolated to other environmental microbes, i.e., those that cannot survive at mammalian temperatures have a low probability of emerging as new human pathogens. On the other hand, the identification of known virulence determinants in new bacterial strains may raise concern. In this regard, the expression of anthrax toxin components in Bacillus cereus produces an anthrax-like disease that is not caused by Bacillus anthracis (Hoffmaster et al., 2004).
Given the experience of recent decades, we can predict with confidence that new infectious diseases are likely to continue to emerge and make some general predictions about the nature of the microbes that could constitute these threats. One possibility is that an emergent pathogen could come from elsewhere in the animal kingdom. A comprehensive survey revealed that three-fourths of emerging pathogens are zoonotic (Taylor et al., 2001). Crossing the species barrier can result in particularly severe pathology, as pathogen and host have not had the opportunity to co-evolve toward equilibrium. Another good bet is that an RNA virus could emerge as a pathogen. The high mutation rate and generally broad host range of RNA viruses may favor species jumps (Woolhouse et al., 2005), and many emergent human pathogens belong to this group, e.g., HIV, H5N1 influenza, SARS coronavirus, Nipah virus, and hemorrhagic fever viruses. On
the other hand, global warming could hasten the emergence of new mammalian pathogenic fungi through thermal adaptation (Garcia-Solache and Casadevall, 2010), given that the relative resistance of mammals to fungal diseases has been attributed to a combination of higher body temperatures and adaptive immunity (Bergman and Casadevall, 2010; Robert and Casadevall, 2009).
Despite abandoning hopes for certainty and determinism in predicting microbial pathogenic interactions, we can attempt to develop a probabilistic framework that endeavors to estimate the pathogenic potential of a microbe based on lessons from known host–microbe interactions. A variety of mathematical models based on game theory or quantitative genetics have been developed in attempts to understand the evolution of virulence (Boots et al., 2009; Day and Proulx, 2004). These have provided interesting new insights into host–pathogen interactions, including the tendency for evolutionary dynamics to produce oscillations and chaos rather than stable fitness-maximizing equilibria, the unpredictability that results when multiple games are played simultaneously, and the tendency for three-way co-evolution of virulence with host tolerance or resistance to select for greater virulence and variability (Carval and Ferriere, 2010; Hashimoto, 2006; Nowak and Sigmund, 2004).
Preparing for the Unpredictable
Emerging infections seem to be becoming more frequent, and it is not difficult to understand why. An interesting experimental system examining a viral pathogen of moth larvae demonstrated that host dispersal promotes the evolution of greater virulence (Boots and Mealor, 2007). When hosts remain local, this encourages more “prudent” behavior by pathogens, but host movement encourages more infections and greater disease severity (Buckling, 2007). Global travel in the modern world can rapidly spread pathogenic microbes, but what is less obvious is that travel may also enhance virulence. Other factors contributing to the emergence and re-emergence of new pathogens include changes in land use, human migration, poverty, urbanization, antibiotics, modern agricultural practices, and other human behaviors (Cleaveland et al., 2007; IOM, 1992). Microbial evolution and environmental change, anthropogenic or otherwise, will continue to drive this process. Another implication of the emergent nature of virulence is recognition of the hubris and futility of thinking that we can simply target resources to the human pathogens that we already know well. The discovery of HIV as the cause of AIDS (Barre-Sinoussi et al., 1983) was greatly facilitated by research on avian and murine retroviruses that had taken place decades before (Hsiung, 1987), at a time when the significance of retroviruses as agents of human disease was unknown.
We share the view that sentinel capabilities are more important than predictive models at the present time (Barre-Sinoussi et al., 1983; Hsiung, 1987), but are optimistic that it will be possible to develop general analytical tools that can
be applied to provide probabilistic assessments of threats from future unspecified agents. Comparative analysis of microbes with differing pathogenic potential and their hosts could provide insight into those interactions that are most likely to result in virulence. Hence, the best preparation for the unexpected and unpredictable nature of microbial threats will be the combination of enhanced surveillance with a broad exploration of the natural world to ascertain the range of microbial diversity from which new threats are likely to emerge.
References
Ablowitz R (1939) The theory of emergence. Phil Sci 6: 1–16.
Barre-Sinoussi F, Chermann JC, Rey F, Nugeyre MT, Chamaret S, et al. (1983) Isolation of a T-lymphotropic retrovirus from a patient at risk for acquired immune deficiency syndrome (AIDS). Science 220: 868–871.
Baylis CA (1929) The philosophic functions of emergence. Philos Rev 38: 372–384.
Beeson PB (1980) Some diseases that have disappeared. Am J Med 68: 806–811.
Bergman A, Casadevall A (2010) Mammalian endothermy optimally restricts fungi and metabolic costs. MBio 1: 00212–10.
Bhalla US, Iyengar R (1999) Emergent properties of networks of biological signaling pathways. Science 283: 381–387.
Biron CA, Casadevall A (2010) On immunologists and microbiologists: ground zero in the battle for interdisciplinary knowledge. MBio 1: e00280–10.
Blehert DS, Hicks AC, Behr M, Meteyer CU, Berlowski-Zier BM, et al. (2009) Bat white-nose syndrome: an emerging fungal pathogen? Science 323: 227.
Boots M, Best A, Miller MR, White A (2009) The role of ecological feedbacks in the evolution of host defence: what does theory tell us? Philos Trans R Soc Lond B Biol Sci 364: 27–36.
Boots M, Mealor M (2007) Local interactions select for lower pathogen infectivity. Science 315: 1284–1286.
Buckling A (2007) Epidemiology. Keep it local. Science 315: 1227–1228.
Carval D, Ferriere R (2010) A unified model for the coevolution of resistance, tolerance, and virulence. Evolution 64: 2988–3009.
Casadevall A, Pirofski L (1999) Host-pathogen interactions: redefining the basic concepts of virulence and pathogenicity. Infect Immun 67: 3703–3713.
Casadevall A, Pirofski L (2001) Host-pathogen interactions: the attributes of virulence. J Infect Dis 184: 337–344.
Cleaveland S, Haydon DT, Taylor L (2007) Overviews of pathogen emergence: which pathogens emerge, when and why? Curr Top Microbiol Immunol 315: 85–111.
Corning PA (2002) The re-emergence of ‘emergence’: a venerable concept in search for a theory. Complexity 7: 18–30.
Daszak P, Berger L, Cunningham AA, Hyatt AD, Green DE, et al. (1999) Emerging infectious diseases and amphibian population declines. Emerg Infect Dis 5: 735–748.
Day T, Proulx SR (2004) A general theory for the evolutionary dynamics of virulence. Am Nat 163: E40–E63.
Dethlefsen L, McFall-Ngai M, Relman DA (2007) An ecological and evolutionary perspective on human-microbe mutualism and disease. Nature 449: 811–818.
Dubnau D, Losick R (2006) Bistability in bacteria. Mol Microbiol 61: 564–572.
Fang FC, Casadevall A (2011) Reductionistic and holistic science. Infect Immun 79: 1401–1414.
Garcia-Solache MA, Casadevall A (2010) Global warming will bring new fungal diseases for mammals. MBio 1: e00061–10.
Grant PR, Grant BR (2002) Unpredictable evolution in a 30-year study of Darwin’s finches. Science 296: 707–711.
Hashimoto K (2006) Unpredictability induced by unfocused games in evolutionary game dynamics. J Theor Biol 241: 669–675.
Henpel CG, Oppenheim P (2011) Studies in the logic of explanation. Phil Sci 15: 135–175.
Hoffmaster AR, Ravel J, Rasko DA, Chapman GD, Chute MD, et al. (2004) Identification of anthrax toxin genes in a Bacillus cereus associated with an illness resembling inhalation anthrax. Proc Natl Acad Sci U S A 101: 8449–8454. Taylor LH, Latham SM, Woolhouse ME (2001) Risk factors for human disease emergence. Philos Trans R Soc Lond B Biol Sci 356: 983–989.
Hsiung GD (1987) Perspectives on retroviruses and the etiologic agent of AIDS. Yale J Biol Med 60: 505–514.
IOM (1992) Emerging infections: microbial threats to the United States. Washington (D.C.): Institute of Medicine.
Lofgren E, Fefferman NH, Naumov YN, Gorski J, Naumova EN (2007) Influenza seasonality: underlying causes and modeling theories. J Virol 81: 5429–5436.
Mazzocchi F (2008) Complexity in biology. Exceeding the limits of reductionism and determinism using complexity theory. EMBO Rep 9: 10–14.
Nowak MA, Sigmund K (2004) Evolutionary dynamics of biological games. Science 303: 793–799.
Parrish JK, Viscido SV, Grumbaum D (2011) Self organized fish schools: an example of emergent properties. Biol Bull 202: 296–305
Ponge JF (2005) Emergent properties from organisms to ecosystems: towards a realistic approach. Biol Rev Camb Philos Soc 80: 403–411.
Posfai G, Plunkett G, III, Feher T, Frisch D, Keil GM, et al. (2006) Emergent properties of reduced-genome Escherichia coli. Science 312: 1044–1046.
Pounds JA, Bustamante MR, Coloma LA, Consuegra JA, Fogden MP, et al. (2006) Widespread amphibian extinctions from epidemic disease driven by global warming. Nature 439: 161–167.
Quinn RW (1989) Comprehensive review of morbidity and mortality trends for rheumatic fever, streptococcal disease, and scarlet fever: the decline of rheumatic fever. Rev Infect Dis 11: 928–953.
Robert VA, Casadevall A (2009) Vertebrate endothermy restricts most fungi as potential pathogens. J Infect Dis 200: 1623–1626.
Tognotti E (2009) The rise and fall of syphilis in Renaissance Europe. J Med Humanit 30: 99–113.
Van Regenmortel MH (2004) Reductionism and complexity in molecular biology. Scientists now have the tools to unravel biological and overcome the limitations of reductionism. EMBO Rep 5: 1016–1020.
Veening JW, Smits WK, Kuipers OP (2008) Bistability, epigenetics, and bet-hedging in bacteria. Annu Rev Microbiol 62: 193–210.
Welsh RM, Che JW, Brehm MA, Selin LK (2010) Heterologous immunity between viruses. Immunol Rev 235: 244–266.
Woolhouse ME, Haydon DT, Antia R (2005) Emerging pathogens: the epidemiology and evolution of species jumps. Trends Ecol Evol 20: 238–244.
MICROBIAL GENOME SEQUENCING TO
UNDERSTAND PATHOGEN TRANSMISSION
Outbreak Investigation: A Brief Primer
In public health, we are often confronted with the task of “solving” an infectious disease outbreak—identifying all the cases, determining a source of the illness, and deploying an intervention to prevent further cases. A typical scenario unfolds as follows. A potential outbreak alert is issued when routine laboratory or population-based surveillance methods detect a statistically significant increase in case counts relative to historical norms for a particular disease, or when an astute clinician or public health official notes an unusual clustering of cases. This alert triggers an initial investigation combining descriptive epidemiology with laboratory work. Epidemiologists use interviews and questionnaires to review case data, such as travel history, food exposures, and attendance at social events, with the goal of revealing common behaviours across cases—eating the same food items, visiting the same locations, or shared contact with a particular individual.
At the same time, microbiologists carry out their own epidemiological investigation using genotyping techniques. Similar to the genetic fingerprinting methods used in paternity testing or in forensic crime scene analysis, these “molecular epidemiology” tools, including pulsed-field gel electrophoresis (PFGE) and multi-locus sequencing typing (MLST), can quickly reveal whether a collection of bacterial specimens share a common genetic fingerprint and likely represent a true outbreak, or whether they display a range of genotypes and simply reflect an unusual excess of cases of that particular illness, none of which are related to each other.
The results of the descriptive epidemiology and molecular epidemiology investigations are then compared, and a determination is made as to whether the cluster of cases is truly an outbreak meriting further investigation. If this is indeed the case, then a more robust field epidemiological investigation is typically undertaken. This includes enhanced case-finding using more detailed survey instruments as well as case-control studies in which behaviours of cases are compared to those of controls in order to quantify risk factors strongly associated with illness. Through these analyses, investigators are able to form and test a specific hypothesis regarding the source of the outbreak. Laboratory work is also critical at this stage—new cases are genotyped to determine whether they are part of the outbreak, while genotyping of isolates collected from food, water,
_______________________
7 Senior Scientist, Molecular Epidemiology, British Columbia Centre for Disease Control.
and other non-human sources can confirm or rule out these entities as potential sources of the outbreak.
Once a source of the outbreak has been confirmed, intervention measures can be put in place. For food- or water-borne outbreaks, these typically involve issuing a recall for the food item in question, eliminating access to the water source until it has been declared safe, and issuing extensive media alerts warning consumers of the risks associated with the entity in question. For outbreaks involving personal contact or attendance at a shared location, such as a specific hospital ward, active case-finding is used to find and treat all infected patients or potential carriers of an illness, while infection control approaches such as patient decolonization or enhanced cleaning are deployed to prevent further infections.
Unfortunately, not every outbreak can be neatly resolved. A number of factors greatly limit public health’s ability to investigate an outbreak from both the field epidemiology and molecular epidemiology perspectives (Figure A3-1). Field investigations are typically limited by resources—not having enough personnel, time, or money to be able to effect a complete investigation—and patients’ inability to recall specific events that might be relevant to the investigation. Molecular epidemiology approaches are also limited in their utility. For some pathogens, such as Salmonella Enteritidis, unrelated isolates from multiple outbreaks may show identical genetic fingerprints. For others, such as Campylobacter jejeuni, one outbreak may comprise multiple distinct genetic fingerprints due to frequent rearrangement of the pathogen’s genome. Genotyping typically requires the
organism in question to be cultured, which may add several weeks to an investigation in the case of slow-growing organisms such as Mycobacterium tuberculosis, and the costs of many molecular epidemiology assays are not insignificant, meaning they are often not routinely deployed.
One of the biggest limitations of current molecular epidemiology methods is the low level of resolution they provide. At best, such tools are only capable of determining whether or not an isolate belongs to an outbreak cluster. Further detail, such as the order of person-to-person transmission, the underlying pattern of spread—superspreader or ongoing chains of transmission—is beyond the scope of current laboratory methods.
An Illustrative Example
In May 2006, a case of pleural tuberculosis (TB) was diagnosed in an adult female in a medium-sized community in British Columbia, Canada. Although pleural TB is suggestive of recently acquired disease, inquiring after the case’s contacts did not suggest a potential source for her illness. Molecular analysis using a TB-specific technique called mycobacterial interspersed repetitive unit variable number tandem repeat (MIRU-VNTR) was performed. In MIRU-VNTR, 24 variable number tandem repeat loci around the M. tuberculosis genome are amplified using polymerase chain reaction (PCR), followed by capillary electrophoresis to enumerate the number of repeats present at each locus. The patient’s MIRU-VNTR genotype indicated she harboured the same strain of TB that had been circulating in her community for several years. She was assumed to represent one of the few annual cases of TB that community regularly observed in a year and was treated for her illness.
Some months later, a second case of TB was reported in the community, this time in an infant female with no epidemiological link to the May case. TB in children is considered to be a marker for recent community transmission, and when MIRU-VNTR revealed the infant to be infected with the same strain of TB as the earlier case, the local public health nurses began an intensive case-finding effort. Using an approach called reverse contact tracing, they identified individuals who had been in contact with the infant and screened them using a tuberculin skin test in an attempt to find out who had been the source of the child’s infection. This investigation led to the diagnosis of nine more cases of active TB in the community, and an outbreak was declared.
Extensive investigation soon followed. Each case was interviewed using a detailed questionnaire, and the resulting data—connections between individuals who reported social relationships with each other, links between people and the places they regularly spent time at, and links between people and specific behaviours associated with an increased risk of TB infection, such as smoking, alcohol use, or drug use—was visualized as a network. The network suggested a potential source for the outbreak—an individual who had been symptomatic
and undiagnosed for many months prior to detection of the first case, who had a number of risk factors, and who was a high-degree node in the network—they reported contact with many of the cases.
Although the investigation revealed the likely source case, who was immediately put on treatment, the outbreak eventually grew to include 41 individuals over the 2006–2008 period, with a handful of subsequent diagnoses from 2009 onward.
Attempting to reconstruct the path the organism took through the community proved to be impossible. Despite the rich epidemiological and clinical data available, the social network structure in the community was too dense to interpret—each individual case had an average of six contacts with other cases, and most everyone in the community reported spending time at the same locations, including a series of hotel pubs and crack houses, meaning there were many potential sources for each person’s infection (Figure A3-2). All cases had identical 24-loci MIRU-VNTR patterns, but the low resolution of this technique was incapable of identifying smaller subclusters within the outbreak.
While the outbreak eventually abated, our inability to reconstruct individual transmission events meant that an important learning opportunity was missed. We could not describe the underlying pattern of disease spread in the community, we could not compare it to other TB outbreaks to determine whether this organism behaves in a similar way across different outbreaks in different communities with
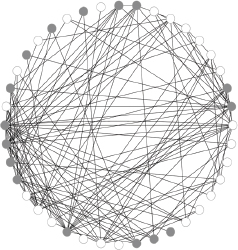
different social network structures, and we could not use our experience to guide future TB outbreak investigations.
This uncertainty about how an outbreak unfolds is not unique to tuberculosis. For the majority of communicable diseases, our understanding of how they behave “in the wild” is limited. Unfortunately, this lack of understanding of pathogens’ natural transmission tendencies precludes developing any sort of proactive evidence-based interventions. We do not know whether there are “one-size-fits-all” interventions for a given pathogen or a family of disease, or whether each outbreak is unique and will require a specifically tailored intervention.
The Rise of the Next Generation
We will return to the tuberculosis story in time; for now, we must climb into our microbial genomics time machine and rewind several years…. The complete genome has sometimes been described as “the ultimate genotype”—examining the total genetic content of an organism reveals the unique fingerprint that sets each of us apart from the other members of our species. Until recently, however, interrogating the complete genome of anything larger than a virus required a significant investment of time, money, and analytical resources. Sequencing of the first bacterial genome, Haemophilus influenzae, in 1995 took more than a year, cost nearly USD$1 million, and involved a large team of researchers running a not insignificant number of DNA sequencers. Subsequent microbial genomics efforts targeted individual bacteria selected to represent a range of common laboratory strains and interesting clinical isolates; experiments reporting the sequencing of more than one isolate were relatively rare and certainly outside the scope of most research groups’ technological abilities.
Tracking the number of bacterial genome projects recorded in the Genomes Online Database (GOLD) reveals that after approximately a decade of steady progress in microbial genomics, a sudden and dramatic upswing in the number of sequenced genomes began around 2006 (Figure A3-3). This sea change coincides with the commercial release of the so-called “next-generation” DNA-sequencing technologies. Previously, DNA sequencing was performed using the Sanger method, originally developed by Frederick Sanger in 1977, although subsequently modified to improve throughput. Next-generation sequencing methods, including the pyrosequencing platform commercialized by Roche, a reversible terminator platform marketed by Illumina, and the newer ion semiconductor-based approach available through Life Technologies, all take a fundamentally different approach to sequencing. They are based on the concept of “sequencing by synthesis,” in which DNA synthesis is essentially observed in real-time, with the sequencing instrument using one of the above technologies to extend a template base by base, and record which base was added at each step. Although the reads produced by these technologies are much shorter than those resulting from Sanger sequencing, the sheer magnitude of the parallel sequencing made possible by these approaches
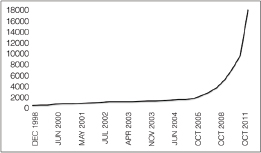
means that next-generation sequencing runs generate orders of magnitude more data in a single run than Sanger sequencers are capable of.
With these new platforms, the cost of sequencing a complete bacterial genome dropped dramatically. Now, many large genome centres operating optimized pipelines and high-volume sequencers are able to offer their clients full bacterial genome sequences for between USD$50-250 per genome. Run times can be as little as a few hours for certain platforms, meaning it is now possible to sequence tens or even hundreds of bacterial genomes within a week for only a few thousand dollars.
A New Tool: Genomic Epidemiology
Soon after the commercialization and adoption of next-generation sequencing technologies, a few astute clinicians and infectious disease researchers recognized the technology’s potential for transforming molecular epidemiology. In a wonderful example of convergent evolution, several independent research groups around the world embarked upon proof-of-concept projects in the new area of “genomic epidemiology,” with the first few papers in the field appearing in 2010 and 2011.
The basic premise behind genomic epidemiology is that the microevolutionary events occurring within a pathogen’s genome over the course of an outbreak can be used as markers of transmission. For example, consider an outbreak in which the first patient is colonized with a bacterium having the genome sequence AAAAA. Any individuals infected by that person would then be colonized with bacteria having the same genome sequence. As a result of the natural process of mutation, many of these second-generation organisms will accrue a small number of nucleotide changes (the number depends on the duration of infection
and the natural mutation rate of the pathogen in question). If we have three second-generation patients, one might accrue no mutations and continue to display the AAAAA genome sequence, one might show the sequence ACAAA, and one might contain the sequence AAAAG. The third generation of cases, those infected by these individuals, will then show genome sequences identical to or descended from these second-generation cases. By sequencing the genomes of all the outbreak organisms and identifying positions that vary over the course of the outbreak, one should, in theory, be able to infer the individual transmission events that gave rise to the outbreak (Figure A3-4).
The words “in theory” are very important in this case. The first two studies to use genomics to identify person-to-person transmission events both revealed that the answers are not so readily forthcoming.
In the first study (Lewis et al., 2010), genome sequence was obtained for six multidrug-resistant Acinetobacter baumannii isolates from a hospital outbreak occurring over a seven-week period—four from military patients and two from
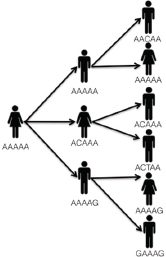
civilian patients. The hope was that the study would reveal how the bacterium was transferred from the military patients—who were presumed to have been infected in the field prior to hospital admission—to the civilian patients. Three positions across the approximately 4-megabase pair genome were found to vary between isolates, with patients showing four genotypes at these positions: CAG, TAG, TAT, and TTG. One of the civilian patients shared a genotype with two of the military patients, suggesting that one of these military patients was the source of the civilian’s infection. Examination of this hypothesis in the context of the available epidemiological information revealed that one of the military patients was housed in the bed next to the civilian, making him or her the most likely source. The other civilian patient displayed a unique genotype, and the study authors were not able to infer the source of that individual’s infection.
In the second study (Gardy et al., 2011), genomics was used to reconstruct the tuberculosis outbreak described earlier in this paper. Genome sequence was obtained for 36 M. tuberculosis isolates—32 from outbreak cases and 4 from patients diagnosed in the same community in the decade prior to the outbreak, all of which had the same 24-loci MIRU-VNTR fingerprint as the outbreak cases. More than 200 single nucleotide polymorphisms (SNPs) were found among the isolates, and the authors realized the nature of TB infection meant it would be impossible to trace the outbreak’s path SNP by SNP, as was done by Lewis et al. In TB, an individual may be infectious for a period of many months, during which time the colonizing organism is continuing to accrue mutations. If the individual transmits the disease to an individual on day 1 of his or her illness, to another individual on day 180, and to a third individual on day 270, and is diagnosed and his or her organism sampled at day 300, his or her isolate might show similarity to the isolate in patient 3, but could be very different from the isolate in patient 1, making it difficult to ascribe patient 1’s disease to the source case. The variable periods of latency associated with TB further complicate SNP-by-SNP reconstruction of transmission.
Instead, the authors used a phylogenetic tree of the data to demonstrate that two separate lineages of M. tuberculosis—labeled A and B—could be resolved within the single MIRU-VNTR genotype. Thus the genomic data acted as a sort of enhanced genotyping method, able to break one MIRU-VNTR cluster containing all the isolates into two distinct genome-based clusters, A and B. Although the original social network describing the relationships between all the outbreak cases was too complex to resolve, when it was broken down into two networks—one showing connections between A cases and one showing connections between B cases—the data became much more interpretable and several person-to-person transmission events could be identified. This revealed that several key individuals acting as superspreaders were associated with the majority of transmission events and that factors including delays in diagnosis, clinical presentation, and risk behaviours contributed toward these individuals’ role as sources of infection. Not every transmission event could be identified, however, and the genomic data also
suggested that some individuals in the network might have exhibited coinfection with both an A and a B strain.
Best Practices and Future Directions
The earliest genomic epidemiology studies suggested that when combined with epidemiological and clinical data, whole genome sequencing has the potential to inform reconstructions of communicable disease outbreaks. Since the publication of the first few studies, several other papers have described using whole genome sequencing to solve outbreaks of other organisms, including Clostridium difficile, methicillin-resistant Staphylococcus aureus, and Klebsiella pneumoniae. Projects are becoming larger and more ambitious, sequencing hundreds of isolates collected across large regions over many years, and the number of outbreak reconstructions available for an individual pathogen is growing as well.
As this emerging field continues to find its place in the realm of public health microbiology, it is important to note several “best practices” that must be considered when doing such a study.
1. Genomic data alone cannot reliably identify individual transmission events. The genomic data must be combined with epidemiological and clinical information if a plausible reconstruction of an outbreak is to be achieved.
2. The bioinformatics methods for identifying positions of variation across a series of isolates are not perfect. The results of any analysis must be carefully examined to ensure that errors in alignment or inappropriate scoring thresholds are not causing variants to be erroneously called or missed.
3. The data must be considered in terms of biological plausibility. An expected level of variation over an outbreak can be inferred from organisms’ mutation rates. If the observed variation is much less or much greater than the expected variation, then the analysis used to generate that data must be reexamined.
4. For others to evaluate a study’s accuracy and reproduce the results, the raw sequencing data for each isolate should be made freely available in a public repository. Manuscripts describing genomic epidemiology studies should include, as appendices, the analysis commands used to generate the data and a detailed description of how the data were filtered and processed after genome assembly and SNP calling.
5. There is a significant amount of interesting biology that can be mined from outbreak-derived genome sequences, particularly in the area of population genetics. To maximize the value of a sequencing data set, it is well worth identifying academic partners who can use a study data set for further analyses.
As more and more genomic epidemiology projects are undertaken, the natural behaviour of pathogens in the wild will slowly be revealed. We will know much more about their spatial and temporal patterns of spread, whether superspreading is as common as early reports are indicating, and the factors that influence an individual’s tendency to spread disease. It will then be up to public health agencies to use this valuable information to develop evidence-based interventions—for example, directing case-finding efforts around contacts of potential superspreaders, or designing prevention programs targeted to specific high-risk communities or individuals. In our own work, we are sequencing 20 years worth of TB in a single Canadian province to identify province-wide transmission routes, community-level transmission events, and socioeconomic and clinical risk factors for acting as a source or sink community for disease. It is our hope that the resulting data will allow us to reshape our current TB prevention and control programs, enabling us to use our limited resources for maximum effect.
As sequencing technologies improve—generating longer reads at lower costs—and as bioinformatics methods become more reliable at identifying variation, we anticipate even more accurate and detailed outbreak reconstructions. The coming decade will be an exciting time for genomic epidemiology as it moves from proof of concept to a routine component of clinical practice.
References
Gardy, J. L., J. C. Johnston, S. J. Ho Sui, V. J. Cook, L. Shah, E. Brodkin, S. Rempel, R. Moore, Y. Zhao, R. Holt, R. Varhol, I. Birol, M. Lem, M. K. Sharma, K. Elwood, S. J. M. Jones, F. S. L. Brinkman, R. C. Brunham, and P. Tang. 2011. Whole-genome sequencing and social-network analysis of a tuberculosis outbreak. New England Journal of Medicine 364:730-739.
Lewis, T., N. J. Loman, L. Bingle, P. Jumaa, G. M. Weinstock, D. Mortiboy, and M. J. Pallen. 2010. High-throughput whole-genome sequencing to dissect the epidemiology of Acinetobacter baumannii isolates from a hospital outbreak. Journal of Hospital Infection 75(1):37-41.
PRESENCE OF OSELTAMIVIR-RESISTANT PANDEMIC
A/H1N1 MINOR VARIANTS BEFORE DRUG THERAPY WITH
SUBSEQUENT SELECTION AND TRANSMISSION8
Elodie Ghedin,9,* Edward C. Holmes,10,11
Jay V. DePasse,8Lady Tatiana Pinilla,12Adam Fitch,8
Marie-Eve Hamelin,13Jesse Papenburg,12Guy Boivin11,*
Abstract
A small proportion (1-1.5%) of 2009 pandemic A/H1N1 influenza viruses (A(H1N1)pdm09) are oseltamivir-resistant, due almost exclusively to a H275Y mutation in the neuraminidase protein. However, many individuals infected with resistant strains had not received antivirals. Whether drug-resistant viruses are initially present as minor variants in untreated subjects before they emerge as the dominant strain in a virus population is of great importance for predicting the speed at which resistance will arise. To address this issue, we employed ultra-deep sequencing of viral populations from serial nasopharyngeal specimens from an immunocompromised child and from two individuals in a household outbreak. We observed that the Y275
_______________________
8 Reprinted with permission by permission of Oxford University Press. Originally published as Ghedin, E, et al. (2012) Presence of oseltamivir-resistant pandemic A/H1N1 minor variants before drug therapy with subsequent selection and transmission. Journal of Infectious Diseases 206(10), 1504-1511. doi: 10.1093/infdis/jis571.
9 Department of Computational & Systems Biology, Center for Vaccine Research, University of Pittsburgh School of Medicine, Pittsburgh, PA 15261, USA.
10 Center for Infectious Disease Dynamics, Department of Biology,
The Pennsylvania State University, University Park, PA 16802, USA.
11 Fogarty International Center, National Institutes of Health, Bethesda, MD 20892, USA.
12 Centre de Recherche du Centre Hospitalier Universitaire de Québec and Université Laval, Québec City, Québec, Canada.
13 McGill University Health Centre, Montréal, Québec, Canada.
Conflict of interest statement: E.G., E.C.H., J.V.D., T.P., A.F., M.-E.H., J.P.: No conflicts
G.B.: Research grant from GlaxoSmithKline
Funding statement: This work was supported in part by National Institute of Allergy and Infectious Diseases at the National Institutes of Health [grant number U54 GM088491]; National Institute of General Medical Sciences at the National Institutes of Health [grant number 2R01 GM080533-06 to E.C.H.] and the Canadian Institutes of Health Research [to G.B.].
* Corresponding authors: Dr. Elodie Ghedin, Center for Vaccine Research, University of Pittsburgh School of Medicine, 3501 5th Avenue, BST3 Room 9043b, Pittsburgh, PA 15261. Phone: (412) 383-5850. E-mail: elg21@pitt.edu. Dr. Guy Boivin, Centre de Recherche en Infectiologie, CHUL, room RC-709, 2705 Laurier, Québec City, QC, Canada. E-mail: guy.boivin@crchul.ulaval.ca
Key words: Influenza; A(H1N1)pdm09; drug resistance; deep sequencing; oseltamivir.
mutation was present as a minor variant in infected hosts prior to onset of therapy. We also found evidence for the transmission of this drug-resistant variant alongside drug-sensitive viruses. These observations provide important information on the relative fitness of the Y275 mutation in the absence of oseltamivir.
The 2009 pandemic A/H1N1 influenza virus (A(H1N1)pdm09) emerged following reassortment between two swine viruses circulating in North America and Eurasia (Garten et al., 2009). Between 1 and 1.5% of A(H1N1)pdm09 strains analyzed to date have been found to be resistant to oseltamivir, a neuraminidase (NA) inhibitor that constitutes the current standard of care (Pizzorno et al., 2011a). Virtually all oseltamivir-resistant A(H1N1)pdm09 viruses contain an H275Y amino acid substitution in the viral NA gene (Pizzorno et al., 2011b). Among the drug-resistant strains recovered from immunocompetent patients, approximately one-third have been recovered from untreated individuals (WHO, 2011). Whether drug-resistant variants are initially present as minor variants in untreated subjects due to transmission from a host harboring a minority drug-resistant population, or whether they emerge following de novo replication, is of great importance for predicting the speed at which resistance will arise: the selection of resistant mutations will occur more rapidly if they are already present within hosts as pre-existing minor variants (Bonhoeffer and Nowak, 1997). In addition, the presence (or not) of the H275Y mutation in pre-treatment samples provides important information on the relative fitness of drug resistance mutations in the absence of oseltamivir.
To determine whether the H275Y mutation is present as a minor variant within hosts infected with influenza A virus, we performed ultra-deep sequencing of viral populations from nasopharyngeal specimens of two sets of individuals infected with A(H1N1)pdm09 viruses. First, we examined longitudinal samples collected from an immunocompromised child who remained infected for more than 6 weeks, during which time a drug-resistant strain came to dominate the virus population. Second, we analyzed the emergence of oseltamivir-resistant viruses in an household outbreak of A(H1N1)pdm09 infections in which the contact case developed influenza symptoms 24 hours after starting post-exposure oseltamivir prophylaxis (Baz et al., 2009).
Materials and Methods
Study 1: Immunocompromised Child
A 31-month-old boy weighing 13.4 kg, diagnosed three months earlier with medulloblastoma, was admitted on January 5, 2011, for consolidation chemotherapy in preparation for the first of 3 consecutive autologous bone marrow transplants (ABMT). On admission, the child presented rhinorrhea and mild cough
but was afebrile. Members of his immediate family, including his older sister and his father, had cold-like symptoms 1-2 weeks prior; none of the family members, including the patient, had received the 2010-11 influenza vaccine, the monovalent A(H1N1)pdm09 vaccine or any antiviral drug. A nasopharyngeal aspirate (NPA) collected on admission was positive for the A(H1N1)pdm09 virus by real-time RT-PCR (Semret M et al., 2009) and by viral culture on A549 and Mink lung cells. Treatment with oseltamivir (30 mg, twice daily) was started on January 6. The following day, the patient developed fever (max. 39.2°C), coincident with dropping neutrophil counts. The child received his first ABMT on January 10. NPA specimens collected throughout admission remained positive for A(H1N1) pdm09 influenza virus by RT-PCR (Table A4-1). Oseltamivir therapy was continued during the hospitalisation and after discharge on January 22. The patient was readmitted from January 27 to February 14, 2011 for his second ABMT. A NPA specimen collected on January 28 was positive for A(H1N1)pdm09 by RT-PCR. Because of persistent viral excretion, oseltamivir was replaced by zanamivir (25 mg inhaled four times daily) on February 1 and continued until negative RT-PCR results on February 17. The patient received a third ABMT on February 18 and he recovered from his influenza infection without complications.
Study 2: Transmission in Household
A detailed description of the familial cluster of infections with A(H1N1) pdm09 virus has been reported elsewhere (Baz et al., 2009). Briefly, a 13-year-old asthmatic male developed infection with A(H1N1)pdm09 confirmed by RT-PCR testing of a NPA. The child was started on oseltamivir (60 mg twice daily for 5 days) and discharged home the same day. Simultaneously to treatment of the index case, post-exposure oseltamivir prophylaxis (75 mg once daily for 10 days) was prescribed to the 59-year-old father with chronic obstructive pulmonary disease. Approximately 24 hours after beginning oseltamivir prophylaxis, the father developed influenza-like symptoms. On day 8 of oseltamivir prophylaxis, he consulted his general practitioner for persistent cough. An NPA collected at that time was positive by RT-PCR and by culture for A(H1N1)pdm09. The father had an uneventful clinical course, and an NPA sampled at the end of his illness was negative. The son’s A(H1N1)pdm09 isolate collected before oseltamivir therapy was susceptible to oseltamivir (50% inhibitory concentration or IC50: 0.27 nM), whereas the father’s A(H1N1)pdm09 isolate was highly resistant to oseltamivir (IC50 > 400 nM). The complete (consensus sequence) virus genomes of the father (GenBank accession FN434454) differed by one amino substitution (H275Y) in the NA protein compared to the virus present in the son (GenBank FN434445).
TABLE A4-1 Virological testing of nasopharyngeal aspirates sampled from a young boy undergoing autologous bone marrow transplantation and infected with A(H1N1)pdm09 influenza. n.e. = not evaluated. CM1 and CM2 = Culture passages 1 and 2. S = Primary specimen (nasopharyngeal aspirates).
| Sample | Antiviral therapy (43 days) | Multiplex real time diagnostic PCR (pH1N1) | Discriminatory real-time RT-PCR | H275 % | Y275 % | Deep Sequencing | Phenotypic drug susceptibility | ||
| H275 copies/mL ± stdev (%) | Y275 copies/mL ± stdev (%) | C.I. | Coverage #reads | ||||||
| 05-01-2011—S1 | None | Positive | 1.78×10⁷ ± 0.71×10⁷ (99.91) | 1.44×10⁴ ± 0.29×10⁴ (0.08) | 95.7 | 3.7 | 1.7 | 488 | n.e. |
| 05-01-2011—CM2 | None | Positive | 3.15×10¹⁰± 2.05×10¹⁰ (99.99) | 3.16×10⁵ ± 3.41×10⁵ (0.001) | 96.9 | 2.7 | 0.7 | 1914 | Susceptible to oseltamivir, zanamivir, and peramivir |
| 10-01-2011—S2 | Oseltamivir | Positive | 5.99×10⁸ ± 3.15×10⁸ (99.75) | 1.53×10⁶ ± 1.26×10⁶ (0.25) | 94.6 | 4.4 | 1.0 | 1552 | n.e. |
| 17-01-2011—S3 | Oseltamivir | Positive | 4.21×10⁵ ± 4.09×10⁵ (3.13) | 1.30×10⁷ ± 6.57×10⁶ (96.87) | 2.3 | 97 | 0.8 | 1341 | n.e. |
| 20-01-2011—S4 | Oseltamivir | Positive | 2.24×10⁶ ±1.56106 (4.08) | 5.26×10⁷ ± 3.67×10⁷ (95.92) | 3.3 | 96 | 1.0 | 1170 | n.e. |
| 20-01-2011—CM1 | Oseltamivir | Positive | 6.25×10⁵ ± 5.73×10⁵ (4.62) | 1.29×10⁷ ± 0.83×10⁷ (95.38) | 3.3 | 96.5 | 0.8 | 1838 | n.e. |
| 20-01-2011—CM2 | Oseltamivir | n.e. | 0 | 9.40×10⁹ ± 3.24×10⁹ (100.00) | n.e. | n.e. | n.e. | n.e. | Resistant to peramivir and oseltamivir, susceptible to zanamivir |
| 28-01-2011—S5 | Zanamivir | Positive | 2.85×10⁴ ± 1.15×10⁴ (16.54) | 1.44×10⁵ ± 0.53×10⁵ (83.46) | 9.9 | 90 | 2.4 | 131 | n.e. |
| 08-02-2011—S6 | Zanamivir | Positive | 8.23×10⁵ ± 4.98×10⁵ (11.53) | 6.32×10⁶ ± 3.18×10⁶ (88.47) | 6.1 | 93.9 | 6.1* | 66 | n.e. |
| 17-02-2011—S7 | Zanamivir | Negative | 0 | 0 | n.e. | n.e. | n.e. | n.e. | n.e. |
*Not significant with 95% confidence.
Written consent was obtained for report of the case described in Study 1. Samples used in Study 2 were obtained as part of an investigation of the Public Health Department of the Ministry of Health, Quebec, Canada.
Clinical Specimens and Viral Culture
In Study 1 (immunocompromised child), 7 NPAs were collected between January 5 and February 17, 2011, for RT-PCR testing (Table A4-1 and Figure A4-1). Viral isolates were also obtained by culture from NPAs sampled on January 5 and January 20. In Study 2 (household transmission), the NPA from the index case (son) was collected prior to oseltamivir treatment whereas the NPA from his father was obtained on day 8 of oseltamivir prophylaxis (Figure A4-1).
NA Inhibition Assay
The drug resistance phenotype to NA inhibitors was determined by NA inhibition assays (Potier et al., 1979). The IC50 values were determined from the dose response curve. A virus was considered resistant to a drug if its IC50 value was 10-fold greater than that of the wild-type (WT) virus (Mishin et al., 2005).
RNA Extraction
Total RNA was extracted from 200 µL of thawed specimen or culture using the MagNA Pure instrument and the MagNA Pure LC total nucleic acid isolation kit (Roche Applied Science) according to the manufacturer’s instructions and stored at –80°C.
Discriminative Real-time PCR Assay
To discriminate between WT and H275Y oseltamivir-resistant strains of A(H1N1)pdm09, a modified version of a previously reported real-time RT-PCR method (van der Vries et al., 2010) was used to test samples. This technique requires a reverse (panN1-H275-sense 5′–cagtcgaaatgaatgcccctaa-3′) and a forward (panN1-H275-antisense 5′–tgcacacacatgtgatttcactag-3′) primer for both the WT and the H275Y viruses and two labelled allele-specific probes: panN1-275H-probe (5′–ttaTCActAtgAggaatga-6-FAM/BHQ-1) and panN1-275Y-probe (5′–ttaTTActAtgAggaatga-HEX/BHQ-1). In the aforementioned probe sequences, locked nucleic acid (LNA) nucleotides are denoted in upper case, DNA nucleotides are denoted in lower case, and the single nucleotide polymorphism (SNP) is underlined. The limits of detection for the assay are 50 copies for the H275Y target and between 10 and 50 copies for the WT target. RT-PCR conditions are available upon request. Data acquisition was performed in both FAM and HEX filters
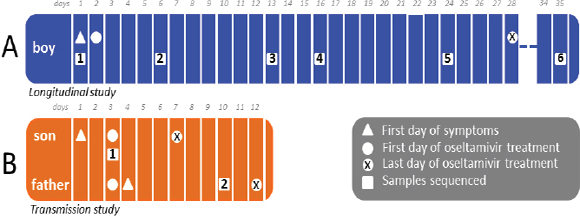
during the annealing/extension step. Standard curves were constructed using 10-fold serial dilutions of pJET1.2-NA-Y275 and pJET1.2-NA-H275 plasmids.
Sequencing and analysis RNA isolated from two cultured isolates and seven primary specimens collected for Study 1 (Figure A4-1A), and two primary specimens for Study 2 (Figure A4-1B), was subjected to a multisegment RT-PCR (M-RT-PCR) step (Zhou et al., 2009) and random priming with barcoding using the SISPA (sequence independent single primer amplification) protocol (Djikeng et al., 2008). For each RNA sample, we performed two M-RT-PCR reactions using the One Step Superscript III RT kit (Invitrogen). Reactions were purified independently using the Qiagen MinElute kit and quantitated on a Nanodrop spectrophotometer; 100-200 ng of each purified M-RT-PCR reaction was used in two separate SISPA reactions with two different barcode tags for a total of 4 tagged reactions per original RNA sample. Products were then separated on a 1% agarose gel and fragments from 200–400bp purified with the Qiagen MinElute kit. Pooled samples were sent for paired end (PE) library preparation and 100 base sequencing on the Illumina Hi-Seq2000 platform.
The barcoded amplification products were sequenced on one lane of the sequence run. Analyses were performed to reduce the distortion caused by SISPA amplification, account for both PCR and sequencing errors, and provide a “clean” comparison between the mapped reads of the experimental samples. The trimmed reads were mapped to A/Quebec/144147/2009(H1N1) (GenBank accession FN434457-FN434464) using the bowtie short-read aligner (Langmead et al., 2009).
The frequency of each codon observed in the set of mapped reads from each amplification replicate was tabulated across each of the 10 influenza genes. To account for sequence-specific errors (Minoche et al., 2011; Nakamura et al., 2011), the variant counts for the forward and reverse direction reads were calculated separately, and only those variants for which counts were within 50% of each other in both directions were retained. For these summaries, the unique reads from all amplification replicates were pooled and total coverage is reported for each codon site. The proportion of codons expected to differ from the consensus due to background mutation and technical error was estimated from a separate cell culture of the PR8 strain that was otherwise processed in exactly the same manner as the specimens in this study. This proportion, found to be 0.00392, lies well outside of the 95% confidence interval for any variant codon in our study that is (a) represented by more than 4 sequence reads, and (b) found in at least 2% of all sequence reads mapped to that position. The lower limit of the 95% confidence interval determined by computing the inverse of the appropriate cumulative Beta distribution is 0.00813.
Presence of Drug-Resistant Viruses Before Drug Treatment in an Immunocompromised Child (Study 1)
The results of the NA gene H275Y discriminatory real-time RT-PCR assay performed on the seven primary specimens and the two viral isolates (January 5 and 20) are presented in Table A4-1. In the first NPA collected on January 5 (day 1), prior to antiviral therapy (initiated January 6), 99.9% of the viral population was WT at NA position 275 by our discriminatory assay. Nevertheless, a very small sub-population of H275Y mutant was also detectable (0.08%). The corresponding viral isolate (05-01-2011—CM2 in Table 1) contained 99.9% of WT virus and was susceptible to oseltamivir (IC50=0.77 nM ± 0.02), zanamivir (IC50=0.15 nM ± 0.02), and peramivir (IC50=0.05 nM ± 0.01). Notably, the H275Y mutation could not be detected by conventional RT-PCR and Sanger sequencing in the original sample. A second NPA collected on January 10 (day 6) also demonstrated a predominance of the WT population (99.8%). However, the proportion of the H275Y mutant detected in NPAs collected on January 17, 20, and 28 increased to 96.9, 95.9, and 83.5%, respectively, during continuous oseltamivir treatment. Furthermore, the second passage on Madin Darby canine kidney (MDCK) cells of the January 20 viral isolate (20-01-2011-CM2 in Table A4-1) resulted in 100% H275Y mutant population compared with 95.4% from the primary culture recovered from A549 and Mink lung cells. This viral isolate exhibited an IC50 value of 556.75 nM ± 61.32 for oseltamivir, 0.22 nM ± 0.01 for zanamivir, and 34.81 nM ± 5.77 for peramivir, which indicates a resistance phenotype to oseltamivir and peramivir. Antiviral therapy was changed to zanamivir on February 1st. The February 8 sample contained a predominance of 88.5% of H275Y mutant virus, whereas the last NPA collected on February 17 was negative for A(H1N1)pdm09 by RT-PCR.
A number of the primary specimens (January 5, 10, 17, 20, 28, and February 8; corresponding to samples 1-6 in Figure A4-1A) for which M-RTPCR product could be generated, as well as the viral isolates, were subjected to deep sequencing to better evaluate the genetic diversity of the viral population, including the presence of drug-resistant mutants. Based on the average depth of coverage across each of the virus segments, we highlighted codons represented by at least 2% of the sequence reads covering each position (Table S1). This percentage is conservative enough that, even in low-coverage areas, it excludes potential sequence and PCR errors.
The positions on the NA and NS1 proteins that display evidence for the presence of minor variants at a frequency of 2% or above in more than one of the samples are shown in Figure A4-2. Similar patterns are observed for all other proteins (Table S1). Over time, the ratios of the minor variants to the dominant codon remain relatively stable, except for NA position 275 where a shift of H to Y is apparent on 17 January 2011. The ratios are similar to the ones observed in
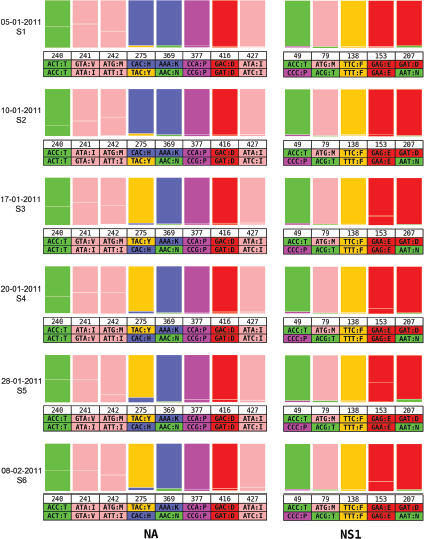
the real-time discriminatory RT-PCR assays for each of the samples tested (Table A4-1), although values across both assays are not identical. No other position on the NA protein appears to co-vary with the 275Y variant. The same pattern is observed in the culture isolates (05-01-2011-CM2 and 20-01-2011-CM1 in Table S2). However, position 153 in NS1 displays a similar switch, although involving a synonymous mutation (from codon GAG to GAA, for E (glutamic acid)). Hence, the sample from the original infection contained a drug-associated minor variant prior to the onset of drug treatment, and this minor variant differed from the dominant strain by only two nucleotide positions. Due to drug-associated selection pressure, this minor variant eventually became dominant in the host. The variant codons observed at the other positions are also possibly representative of other minor variants in the original virus population but, as they remained minor members of the viral population, they are unlikely to have a selective advantage.
Evidence for Transmission of Drug-Resistant Viruses in Household (Study 2)
In a separate study, we observed a similar phenomenon where oseltamivir resistance emerged quickly in the household contact (father) of an index case (son). Both family members were started on oseltamivir on the same day (Figure A4-1B) i.e., twice a day treatment for the son and once a day prophylaxis for the father. The latter developed influenza-like symptoms 24 hours after drug treatment was begun. Such a rapid clinical presentation suggests that he was already infected at the time prophylaxis was initiated, and that drug-resistant viruses were most likely already present.
We characterized the genetic diversity of the virus populations in both individuals by deep sequencing. An example for the HA and NA genes where most of the variants seen in the son are also observed in the father is shown in Figure A4-3. While the dominant viruses are drug-sensitive in the son and drug-resistant in the father, apparent by the switch from H275 to 275Y, it is striking that a minor population of viruses in the son already carries the drug resistance mutation; minor drug resistant variant residue 275Y is present in more than 2.4% of the reads in the son (which was not detected by conventional RT-PCR and Sanger sequencing). Hence, it is likely that viruses carrying this mutation were transmitted to the father along with drug sensitive viruses, and became dominant in that individual following selection associated with a subtherapeutic (prophylactic) dose of oseltamivir.
Also of note was that the same minor variants were found in both the father and the son at 60 residue positions across all 10 viral proteins (Table S3). We estimate that there were 8 days of replication in the father from the time he was possibly infected by the son (assuming it occurred 24 hours before any symptoms) to the time the specimen was collected. Over that time, variant representation could have fluctuated such that the set of 60 variants seen in both samples is likely to underestimate the true number. While the number of conserved variants points
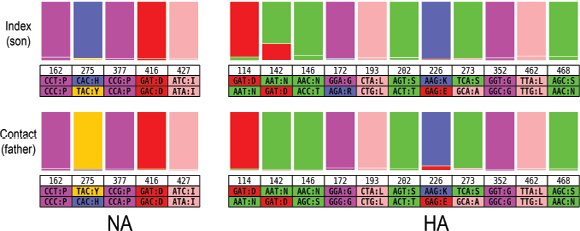
to possible transmission, and the probability that the same variants could appear in both the son and the father by chance alone is extremely low, we do not have other potential contacts or index cases to test in order to confirm this observation.
Discussion
The most striking observation from both of these studies is that the mutation most commonly associated with resistance to oseltamivir (H275Y) is present in the viral population of some individuals prior to the onset of drug treatment. In addition, this minor drug-resistant population could not be revealed by conventional methods such as phenotypic resistance tests and Sanger sequencing. This observation is important for a number of reasons. First, the prior existence of Y275 means that the selection for drug resistance will proceed much more rapidly following the onset of drug selection pressure than if only wild-type viruses are present in the population, as there is no waiting time for the correct mutation to appear (Bonhoeffer and Nowak, 1997). Further, that the Y275 mutation is present in untreated hosts indicates that this mutation is not strongly deleterious in the absence of oseltamivir, and likely does not need compensatory mutations to enable its fixation (Hamelin et al., 2010; Memoli et al., 2010; Seibert et al., 2010). Indeed, in both cases studied here, we observed no amino acid changes that were fixed concordant with Y275, and only a single synonymous mutation (in NS1) in the case of the immunocomprised child. In these circumstances, the pre-existence of Y275 means that oseltamivir resistance will likely spread rapidly as soon as there is drug selection pressure, especially in immunocompromised individuals and when suboptimal antiviral dosage is used.
If the Y275 mutation is present in individual hosts prior to the onset of drug treatment then it is also likely to have been transmitted between individuals as a minor variant. This in turn suggests that there may not often be a severe population bottleneck during the inter-host transmission of influenza virus. Indeed, mixed infections of multiple variants of influenza virus have been observed in both natural human infections (Ghedin et al., 2009; Ghedin et al., 2011; Pajak et al., 2011) and experimental animal infections (Murcia et al., 2010; Murcia et al., 2012), and hence may be commonplace. Co-infection with major and minor variants, captured by deep sequencing, was also observed during the course of human rhinovirus infections (Cordey et al., 2010), indicating that this phenomenon is not unique to influenza. In contrast, sequencing studies of HIV suggest that a small number of viral particles initiate infection, such that most variants are produced following replication within the newly infected host (Keele et al., 2008).
Such transmission of multiple variants is most clearly documented in the son-father case, where perhaps 60 mutational variants are passed between these two individuals, one of which confers oseltamivir resistance. However, the availability of only short sequence reads makes it impossible to determine the exact number of distinct viral haplotypes these correspond to. In addition, our sampling
protocol in the son-father transmission case dictates that we cannot exclude that there was rapid selection of oseltamivir resistance in the son after we sampled his virus population, such that a majority Y275 population was in fact transmitted to the father. However, this would entail extremely rapid selection for resistance and does not change the central observation that multiple variants are transmitted between hosts as both H275 and Y275 are found in the father.
That the Y275 mutation is present in the son prior to oseltamivir treatment and so soon after symptom onset suggests that this resistance mutation was also present in the viral population initially transmitted to the son. Similarly, the presence of Y275 in the immunocomprised child suggests that this mutation may have been transmitted to the child in a mixed infection containing both drug-sensitive and -resistant mutations, although it cannot be excluded that the variant appeared de novo. If Y275 is indeed present in the founding population in both individuals then it is possible that this mutation is present as a low frequency variant in many individuals infected with A(H1N1)pdm09, and that its presence reflects the combined action of past selection for drug resistance in patients receiving oseltamivir, incomplete reversion to the wild-type H275 mutation in patients that are not on the drug, and a lack of strongly deleterious fitness effects in the absence of drug. The large-scale ultra-deep sequencing of additional A(H1N1)pdm09 patients who have not received oseltamivir will clearly be central to answering this question.
Next generation ultra-deep sequencing of intra-host viral populations such as that undertaken here promises to transform our understanding of the evolution of drug resistance in acute viral infections, allowing the dissection of the mutational spectrum at an unprecedented level of precision. Indeed, it is striking that in the two cases conventional RT-PCR failed to detect the presence of oseltamivir resistance even though Y275 was present in the viral population. However, despite its undoubted potential, ultra-deep sequencing also comes with a number of inherent analytical difficulties. First, because the sequencing protocol leads to the generation of short sequence reads, nucleotide positions cannot be linked either within or among individual genes except if they are close enough to appear on the same sequence read, or if they have the same pattern of prevalence. More fundamentally, it is critical to ensure that minor genetic variants are not the result of PCR/sequencing artefacts. Amplification leads to the well-known problem of “PCR duplicates,” sometimes resulting in severe distortion to the observed proportions of true variant subpopulations and the possible creation of false variant sequences through PCR errors. To address these problems, each specimen from our study was amplified in four independent reactions using different barcodes, allowing us to track amplification products and their respective sequence reads. Future work will employ a simpler and more cost-effective approach using modified primers that include unique tags for each template (Jabara et al., 2011).
Baz, M., Y. Abed, J. Papenburg, X. Bouhy, M. E. Hamelin, and G. Boivin. 2009. Emergence of oseltamivir-resistant pandemic H1N1 virus during prophylaxis. New England Journal of Medicine 361(23):2296-2297.
Bonhoeffer, S., and M. A. Nowak. 1997. Pre-existence and emergence of drug resistance in HIV-1 infection. Proceedings: Biological Sciences 264(1382):631-637.
Cordey, S., T. Junier, D. Gerlach, F. Gobbini, L. Farinelli, E. M. Zdobnov, B. Winther, C. Tapparel, and L. Kaiser. 2010. Rhinovirus genome evolution during experimental human infection. PloS One 5(5):e10588.
Djikeng, A., R. Halpin, R. Kuzmickas, J. Depasse, J. Feldblyum, N. Sengamalay, C. Afonso, X. Zhang, N. G. Anderson, E. Ghedin, and D. J. Spiro. 2008. Viral genome sequencing by random priming methods. BMC Genomics 9:5.
Garten, R. J., C. T. Davis, C. A. Russell, B. Shu, S. Lindstrom, A. Balish, W. M. Sessions, X. Xu, E. Skepner, V. Deyde, M. Okomo-Adhiambo, L. Gubareva, J. Barnes, C. B. Smith, S. L. Emery, M. J. Hillman, P. Rivailler, J. Smagala, M. de Graaf, D. F. Burke, R. A. Fouchier, C. Pappas, C. M. Alpuche-Aranda, H. Lopez-Gatell, H. Olivera, I. Lopez, C. A. Myers, D. Faix, P. J. Blair, C. Yu, K. M. Keene, P. D. Dotson, Jr., D. Boxrud, A. R. Sambol, S. H. Abid, K. St George, T. Bannerman, A. L. Moore, D. J. Stringer, P. Blevins, G. J. Demmler-Harrison, M. Ginsberg, P. Kriner, S. Waterman, S. Smole, H. F. Guevara, E. A. Belongia, P. A. Clark, S. T. Beatrice, R. Donis, J. Katz, L. Finelli, C. B. Bridges, M. Shaw, D. B. Jernigan, T. M. Uyeki, D. J. Smith, A. I. Klimov, and N. J. Cox. 2009. Antigenic and genetic characteristics of swine-origin 2009 A(H1N1) influenza viruses circulating in humans. Science 325(5937):197-201.
Ghedin, E., A. Fitch, A. Boyne, S. Griesemer, J. DePasse, J. Bera, X. Zhang, R. A. Halpin, M. Smit, L. Jennings, K. St George, E. C. Holmes, and D. J. Spiro. 2009. Mixed infection and the genesis of influenza virus diversity. Journal of Virology 83(17):8832-8841.
Ghedin, E., J. Laplante, J. DePasse, D. E. Wentworth, R. P. Santos, M. L. Lepow, J. Porter, K. Stellrecht, X. Lin, D. Operario, S. Griesemer, A. Fitch, R. A. Halpin, T. B. Stockwell, D. J. Spiro, E. C. Holmes, and K. St George. 2011. Deep sequencing reveals mixed infection with 2009 pandemic influenza A (H1N1) virus strains and the emergence of oseltamivir resistance. Journal of Infectious Diseases 203(2):168-174.
Hamelin, M. E., M. Baz, Y. Abed, C. Couture, P. Joubert, E. Beaulieu, N. Bellerose, M. Plante, C. Mallett, G. Schumer, G. P. Kobinger, and G. Boivin. 2010. Oseltamivir-resistant pandemic A/H1N1 virus is as virulent as its wild-type counterpart in mice and ferrets. PLoS Pathogens 6(7):e1001015.
Jabara, C. B., C. D. Jones, J. Roach, J. A. Anderson, and R. Swanstrom. 2011. Accurate sampling and deep sequencing of the HIV-1 protease gene using a primer id. Proceedings of the National Academy of Sciences of the United States of America 108(50):20166-20171.
Keele, B. F., E. E. Giorgi, J. F. Salazar-Gonzalez, J. M. Decker, K. T. Pham, M. G. Salazar, C. Sun, T. Grayson, S. Wang, H. Li, X. Wei, C. Jiang, J. L. Kirchherr, F. Gao, J. A. Anderson, L. H. Ping, R. Swanstrom, G. D. Tomaras, W. A. Blattner, P. A. Goepfert, J. M. Kilby, M. S. Saag, E. L. Delwart, M. P. Busch, M. S. Cohen, D. C. Montefiori, B. F. Haynes, B. Gaschen, G. S. Athreya, H. Y. Lee, N. Wood, C. Seoighe, A. S. Perelson, T. Bhattacharya, B. T. Korber, B. H. Hahn, and G. M. Shaw. 2008. Identification and characterization of transmitted and early founder virus envelopes in primary HIV-1 infection. Proceedings of the National Academy of Sciences of the United States of America 105(21):7552-7557.
Langmead, B., C. Trapnell, M. Pop, and S. L. Salzberg. 2009. Ultrafast and memory-efficient alignment of short DNA sequences to the human genome. Genome Biology 10(3):R25.
Memoli, M. J., R. J. Hrabal, A. Hassantoufighi, B. W. Jagger, Z. M. Sheng, M. C. Eichelberger, and J. K. Taubenberger. 2010. Rapid selection of a transmissible multidrug-resistant influenza a/h3n2 virus in an immunocompromised host. Journal of Infectious Diseases 201(9):1397-1403.
Minoche, A. E., J. C. Dohm, and H. Himmelbauer. 2011. Evaluation of genomic high-throughput sequencing data generated on illumina hiseq and genome analyzer systems. Genome Biology 12(11):R112.
Mishin, V. P., F. G. Hayden, and L. V. Gubareva. 2005. Susceptibilities of antiviral-resistant influenza viruses to novel neuraminidase inhibitors. Antimicrobial Agents and Chemotherapy 49(11):4515-4520.
Murcia, P. R., G. J. Baillie, J. Daly, D. Elton, C. Jervis, J. A. Mumford, R. Newton, C. R. Parrish, K. Hoelzer, G. Dougan, J. Parkhill, N. Lennard, D. Ormond, S. Moule, A. Whitwham, J. W. McCauley, T. J. McKinley, E. C. Holmes, B. T. Grenfell, and J. L. Wood. 2010. Intra- and interhost evolutionary dynamics of equine influenza virus. Journal of Virology 84(14):6943-6954.
Murcia, P. R., J. Hughes, P. Battista, L. Lloyd, G. J. Baillie, R. H. Ramirez-Gonzalez, D. Ormond, K. Oliver, D. Elton, J. A. Mumford, M. Caccamo, P. Kellam, B. T. Grenfell, E. C. Holmes, and J. L. N. Wood. 2012. Evolution of an eurasian avian-like influenza virus in native and vaccinated pigs. PLoS Pathogens 8(5):e1002730.
Nakamura, K., T. Oshima, T. Morimoto, S. Ikeda, H. Yoshikawa, Y. Shiwa, S. Ishikawa, M. C. Linak, A. Hirai, H. Takahashi, M. Altaf-Ul-Amin, N. Ogasawara, and S. Kanaya. 2011. Sequence-specific error profile of illumina sequencers. Nucleic Acids Research 39(13):e90.
Pajak, B., I. Stefanska, K. Lepek, S. Donevski, M. Romanowska, M. Szeliga, L. B. Brydak, B. Szewczyk, and K. Kucharczyk. 2011. Rapid differentiation of mixed influenza A/H1N1 virus infections with seasonal and pandemic variants by multitemperature single-stranded conformational polymorphism analysis. Journal of Clinical Microbiology 49(6):2216-2221.
Pizzorno, A., Y. Abed, and G. Boivin. 2011a. Influenza drug resistance. Seminars in Respiratory and Critical Care Medicine 32(4):409-422.
Pizzorno, A., X. Bouhy, Y. Abed, and G. Boivin. 2011b. Generation and characterization of recombinant pandemic influenza A(H1N1) viruses resistant to neuraminidase inhibitors. Journal of Infectious Diseases 203(1):25-31.
Potier, M., L. Mameli, M. Belisle, L. Dallaire, and S. B. Melancon. 1979. Fluorometric assay of neuraminidase with a sodium (4-methylumbelliferyl-alpha-D-N-acetylneuraminate) substrate. Analytical Biochemistry 94(2):287-296.
Seibert, C. W., M. Kaminski, J. Philipp, D. Rubbenstroth, R. A. Albrecht, F. Schwalm, S. Stertz, R. A. Medina, G. Kochs, A. Garcia-Sastre, P. Staeheli, and P. Palese. 2010. Oseltamivir-resistant variants of the 2009 pandemic H1N1 influenza a virus are not attenuated in the guinea pig and ferret transmission models. Journal of Virology 84(21):11219-11226.
Semret, M., S. Fenn, H. Charest, J. McDonald, C. Frenette, and V. Loo. 2009 (18-21 June). A real- time RT-PCR assay for detection of influenza H1N1 (swine-type) and other respiratory viruses. Paper presented at 26th International Congress of Chemotherapy and Infection, Toronto, ON.
van der Vries, E., M. Jonges, S. Herfst, J. Maaskant, A. Van der Linden, J. Guldemeester, G. I. Aron, T. M. Bestebroer, M. Koopmans, A. Meijer, R. A. Fouchier, A. D. Osterhaus, C. A. Boucher, and M. Schutten. 2010. Evaluation of a rapid molecular algorithm for detection of pandemic influenza A (H1N1) 2009 virus and screening for a key oseltamivir resistance (H275Y) substitution in neuraminidase. Journal of Clinical Virology 47(1):34-37.
WHO. 2011. Weekly update on oseltamivir resistance in influenza A(H1N1)2009 viruses.
Zhou, B., M. E. Donnelly, D. T. Scholes, K. St George, M. Hatta, Y. Kawaoka, and D. E. Wentworth. 2009. Single-reaction genomic amplification accelerates sequencing and vaccine production for classical and swine origin human influenza a viruses. Journal of Virology 83(19):10309-10313.
DESIGN CONSIDERATIONS FOR HOME AND
HOSPITAL MICROBIOME STUDIES
Daniel P. Smith,14John C. Alverdy,15
Jeffrey A. Siegel,16,17and Jack A. Gilbert14,18
Milestones in Home and Hospital Microbiome Research
The populations of developed nations spend approximately 90 percent of their time indoors (Moschandreas, 1981), leading scientists and the public alike to take an interest in the microbial communities that share these spaces with us. This is especially true in healthcare environments, where hospital-acquired infections (HAIs) have long been among the leading causes of patient deaths (Anderson and Smith, 2005; Groseclose et al., 2004; Hall-Baker et al., 2010; Klevens et al., 2007). The first study of airborne pathogens in a hospital can be attributed to Bourdillon and Colebrook, who, in 1946, investigated the concentration of bacteria present in the air of a surgical changing room (Bourdillon and Colebrook, 1946). Their findings, and the findings of similar studies published over the following two decades, revealed levels of airborne bacteria that were cause for concern (Blowers and Wallace, 1960; Colebrook and Cawston, 1948; Cvjetanović, 1957; Greene et al., 1962a,b; Warner and Glassco, 1963) and prompted a rethinking of ventilation designs for hospitals.
The air-sampling techniques developed for hospitals were soon applied to other indoor spaces including subway trains (Williams and Hirch, 1950), classrooms (Williams et al., 1956), movie theaters (Cvjetanović, 1957), and apartments (Simard et al., 1983). Articles by Finch and colleagues in 1978 and Scott and colleagues in 1982 complemented these air-based studies with the first characterizations of bacteria living on bathroom and kitchen surfaces (Finch et al., 1978; Scott et al., 1982). The larger of the two studies, conducted by Scott and colleagues, examined 60 locations in 251 homes, and agreed well with the conclusions from an earlier study by Finch and colleagues of 21 homes that the dominant species on the studied surfaces were enterobacteria, Pseudomonads, micrococci, Bacillus, and Aeromonas hydrophila, with a lower incidence of Salmonella, Staphylococcus aureus, and Bacillus cereus.
_______________________
14 Argonne National Laboratory, Institute for Genomic and Systems Biology, Argonne, IL, USA.
15 Department of Surgery, The University of Chicago Medical Center, Chicago, IL, USA.
16 Department of Civil, Architectural and Environmental Engineering, The University of Texas at Austin, Austin, TX, USA.
17 Department of Civil Engineering, The University of Toronto, Toronto, ON, Canada.
18 Department of Ecology and Evolution, The University of Chicago, Chicago, IL, USA.
Current literature regarding the relationship between the indoor environment and humans primarily explores the development of fungal contamination with damp surfaces (Hyvarinen et al., 2002; Jaffal et al., 1997; Lignell et al., 2008; Nevalainen and Seuri, 2005), the role of hygiene in removing microbial communities (Bright et al., 2009; Grice and Segre, 2011), and the length of time microbes can survive on surfaces (Kramer et al., 2006). There have been a number of studies to explore the microbial diversity of communities associated with dust (Pitkäranta et al., 2008; Rintala et al., 2008; Sebastian and Larsson, 2003) and air (Huttunen et al., 2008; Tringe et al., 2008). One study that investigated temporal succession of microbial communities performed on indoor dust found seasonal patterns, and these were building specific, probably as a result of skin cells shed from inhabitants within the buildings (Rintala et al., 2008). These existing studies demonstrate fundamental principles regarding experimental design, explicitly regarding the types of environmental conditions that need to be monitored (e.g., surface material, moisture, HVAC system), and the observation that the architectural design of an indoor space influences the potential community structure and hence human health (Guenther and Vittori, 2008). The influence of air ventilation and the number of people in a space must be explored with regard to the impact on microbial community structure (Hospodsky et al., 2012; Kembel et al., 2012; Qian and Li, 2010; Qian et al., 2012). Additionally, the variability associated with body sites (Costello et al., 2009; Fierer et al., 2010; Grice et al., 2009) will have a major impact on the interpretation of the analyses, because different body sites interact with different surfaces differently. The most diverse skin sites are the driest areas and hence are less likely to be transferred to a surface with sebaceous exudates. This will affect the time that the microbial community maintains structural cohesion with reference to relative abundance of members on a surface (Kramer et al., 2006).
Studies of indoor microbiology are highly relevant in today’s age, because concern for protecting ourselves from microbial pathogens is ever-present. Studies in this field do much to put this threat in perspective by identifying incorrect preconceptions. For instance, using cleaning products containing the antibacterial agent triclosan over the course of a year does not result in an increase in antimicrobial drug-resistant bacteria in homes (Aiello et al., 2005; Cole et al., 2003). Several research groups have studied the beneficial effect of childhood exposure to dirty environments, which is particularly pronounced in the inverse correlation between children who live on farms and their reduced likelihood of later developing asthma and other respiratory problems (Adler et al., 2005; Alfvén et al., 2006; Klintberg et al., 2001; Leynaert et al., 2001; Merchant et al., 2005; Remes et al., 2005; Riedler et al., 2001; Schram et al., 2005). Hospitals have found that by opening the windows in patient rooms, the percentage of potentially pathogenic microbes in the air is significantly reduced (Escombe et al., 2007; Kembel et al., 2012). These are just a few examples of a larger trend toward questioning the culture of cleanliness, or as its come to be called—the hygiene hypothesis
(Bloomfield et al., 2006; Martinez, 2001; Rook, 2009; Rook and Stanford, 1998; Yazdanbakhsh and Matricardi, 2004). The study of pathogens in indoor environments is valuable, but perhaps even more valuable is gaining a better understanding of the competition between pathogenic and non-pathogenic microorganisms and how we might shift that balance in our favor.
A New Scientific Community
The expansion of indoor microbiome research from healthcare environments into homes and offices has been driven in large part by funding initiatives by the Alfred P. Sloan Foundation. This private agency stipulates a high degree of collaboration between its grantees and as a result has brought about the development of Internet portals designed to enable any indoor microbiome researcher to exchange raw data and results with other scientists as well as with reporters and the general public. One such nexus, the Microbiology of the Built Environment Network website,19 tracks investigators, projects, publications, computational resources, protocols, standards, press releases, social media, conferences, and workshops relating to indoor microbiology. A community data archive is hosted by the Microbiome of the Built Environment Data Analysis Core (MoBEDAC), which integrates with data analysis tools including visualization and analysis of microbial population structures (VAMPS), quantitative insights into microbial ecology (QIIME), meta-genome rapid annotation using system technology (MG-RAST), and FungiDB (Caporaso et al., 2010; Meyer et al., 2008; Stajich et al., 2011).
While microBE.net provides general information applicable to a wide range of indoor microbiology projects, working groups for specialists in this field have also emerged. The Berkeley Indoor Microbial Ecology Research Consortium (BIMERC) focuses on identifying the source populations and human influences on the microbial components of indoor air. Discovering the mechanisms and rates with which microbial communities spread throughout healthcare facilities is the goal of the Hospital Microbiome Consortium.20 The Biology and the Built Environment Center at the University of Oregon21 has begun training students in the investigation of how architecture can influence the structure of indoor microbiomes.
Indoor Microbiology Without Culturing?
Early studies of the indoor microbiome relied heavily on culture-based methods: agar plates were commonly pressed directly against the surface of interest,
_______________________
21 BioBE; http://biobe.uoregon.edu.
and the resultant colonies were counted and microscopically characterized in order to establish quantitative and taxonomic abundance metrics. However, with the introduction of next-generation sequencing technologies, rapid, high-throughput characterization of taxonomic marker genes (e.g., 16S/18S rRNA) and whole genomic DNA from environmental samples is now financially viable, altering the landscape of tools available to the researcher interested in the indoor microbiome.
The Pros and Cons of High-Throughput Sequencing
Since 2007, high-throughput sequencing technologies offered by Illumina, Roche, and ABI have enabled researchers to quickly and inexpensively profile the relative abundances of taxonomic groups in samples of environmental microbial communities. This approach to microbial ecology offers three advantages over culture-based methods. First, uncultivable species can be identified, thereby providing a more complete characterization of the microbial community. Second, organisms can be systematically classified by computer-aided alignment of DNA sequences to reference genes and genomes. And lastly, this entire process is relatively easily scalable from tens of samples to tens of thousands of samples.
Classical culturing, however, still yields important information that cannot be attained through high-throughput DNA sequencing of ribosomal genes. Measuring the absolute abundance of colony-forming units is very straightforward when working with agar press-plates, but it is a difficult metric to attain from nanogram quantities of DNA extracted from environmental samples. Growth of colonies on plates also provides concrete evidence that the cell taken from the environment was viable. In addition, sequencing ribosomal genes does not provide information on whether the detected microbial species harbor genetic cassettes encoding antibiotic-resistance genes, an important factor in evaluating the pathogenicity of microorganisms. The ability to retain bacterial colonies for further studies is a third advantage of plate-based culturing, allowing one to subject any detected species to thorough examination. In light of these considerations, a study seeking to characterize both currently uncultivable microorganisms and antibiotic-resistant human pathogens would need to draw on both classical and next-generation microbial community analysis techniques.
Microarrays for Rapid Identification of Antibiotic Resistance
A new approach to rapidly screening microbial communities for multiple antibiotic resistance markers has recently been developed by Taitt et al. (2012). Their Antimicrobial Resistance Determinant Microarray chips are designed to detect more than 250 resistance genes covering 12 classes of antibiotics and have been shown to be compatible with low concentrations of DNA extracted from swabs (personal communication). Advances such as this are quickly closing the
gap between the high-throughput sequencing technologies and classical culture-based phenotyping.
Sample and Metadata Collection
The selection of sampling locations and environmental parameters to monitor is fundamental to any microbiome project. Balancing the comprehensiveness of an investigation against logistical constraints has led to studies that examine highly specific aspects of the indoor microbiome (Hilton and Austin, 2000; Kelley et al., 2004; Kembel et al., 2012; Kopperud et al., 2004; Krogulski and Szczotko, 2011; Tang, 2009; Wiener-Well et al., 2011). As might be expected, the sampling locations that these studies chose are those that humans most come into contact with on a daily basis. A list of these locations for homes (Table A5-1) and hospitals (Table A5-2) are provided below.
Air
The air within built environments is arguably one of the most important mediums to consider when investigating the interaction between humans and the indoor microbiome. Air inside of buildings is biologically distinct from outdoor air, containing a greater proportion of human-associated microflora shed by its occupants (Bouillard et al., 2005; Clark, 2009; Fox et al., 2010; Hospodsky et al., 2012; Korves et al., 2012; Noble et al., 1976; Noris et al., 2011; Qian et al., 2012; Rintala et al., 2008; Täubel et al., 2009). Low air exchange rates and recycling of air for conditioning purposes can exacerbate the negative effects of aerosolized microorganisms that have effects on human health due to pathogenic, toxic, and/or allergic properties (D’Amato et al., 2005; Monto, 2002; Peccia et al., 2008; Pope et al., 1993).
Airborne particles are commonly collected using one of four methods: settle plates, impactors, impingers, and filtration, each of which offer differing advantages and efficiencies (Fahlgren et al., 2010; Griffin et al., 2010; Morrow et al., 2012). Settle plates offer a silent and inexpensive option for enumerating colony-forming units deposited by gravity onto agar petri dishes. Settle plates will preferentially sample larger particles, because they are more likely to be deposited by gravitational settling. Impactors increase the rate and control of particle deposition by accelerating air in an arc relative to the agar surface, utilizing centrifugal forces to select for a specific range of particle masses. The same design principle is used by impingers, where the deposition media is liquid rather than solid state. However, the mechanical stresses introduced by impactors and impingers can rupture cellular membranes, thereby reducing culturing viability. Filtration of air through a porous membrane is less mechanically stressful to cells, but may result in desiccation. Although active samplers—impactors, impingers, and filtering devices—offer the added benefit of providing a quantitative accounting of the volume of air sampled, the noise generated by the unit’s pump or fan may preclude their use in occupied buildings. Filters from central HVAC systems have also been used in lieu of portable sampling units (Bonetta et al., 2009; Drudge et al., 2011; Farnsworth et al., 2006; Hospodsky et al., 2012; Korves et al., 2012; Noris et al., 2009, 2011; Stanley et al., 2008).
TABLE A5-1 Home High-Touch Surfaces and Bacterial Reservoirs
|
All rooms |
Light switches, air, dust, floor, rugs, door knobs |
|
Kitchen |
Countertop, sink, faucet handles, drain, u-pipe, refrigerator handle, refrigerator shelves, microwave buttons, dish sponge, drying towels, drying rack |
|
Bathroom |
Countertop, sink, u-pipes, shower floor, shower curtain, showerhead, shower poufs, bar soap, toilet bowl, toilet water, toilet seat, toilet flush handle, hand towels |
|
Bedroom |
Pillows, sheets |
|
Living room |
Seats, arm rests, head rests, pillows, blankets, remote controls |
|
Office, etc. |
Keyboard, mouse, water from water heater, mop head, HVAC filters |
TABLE A5-2 Hospital High-Touch Surfaces and Bacterial Reservoirs
|
Patient area |
Bed rails, tray table, call boxes, telephone, bedside tables, patient chair, IV pole, floor, light switches, glove box, air, air exhaust filter |
|
Patient restroom |
Sink, faucet handles, inside faucet head, hot tap water, cold tap water, light switches, door knob, handrails, toilet seats, flush lever, bed pan cleaning equipment, floor, air, air exhaust filter |
|
Additional equipment |
IV Pump control panel, monitor control panel, monitor touch screen, monitor cables, ventilator control panel, blood pressure cuff, janitorial equipment |
|
Water |
Cold tap water, hot tap water, water used to clean floors |
|
Patient |
Stool sample, nasal swab, hand |
|
Staff |
Nasal swab, bottom of shoe, dominant hand, cell phone, pager, iPad, computer mouse, work phone, shirt cuff, stethoscope |
|
Travel areas |
Corridor floor, corridor wall, steps, stairwell door knobs, stairwell door kick plates, elevator buttons, elevator floor, handrails, air |
|
Lobby |
Front desk surface, chairs, coffee tables, floor, air |
|
Public restroom |
Floor, door handles, sink controls, sink bowl, soap dispenser, towel dispenser, toilet seats, toilet lever, stall door lock, stall door handle, urinal flush lever, air, air exhaust filter |
Water
Municipal water supplies have long been known to contain biofilm-forming and planktonic microorganisms, including Mycobacterium and Legionella
(Angenent, 2005; Boe-Hansen et al., 2002; du Moulin et al., 1988; Embil et al., 1997; Falkinham et al., 2001; Le Dantec et al., 2002; Lee et al., 1988; Leoni et al., 1999, 2001; Thomas et al., 2006; Vaerewijck et al., 2001, 2005). Tap water therefore may be an important source of microbes in built environments. Cell counts can be attained visually by microscopy using non-specific DNA stains such as SYBR Gold, or in an automated fashion with flow cytometry. Both methods can be adapted to fluorescent in situ hybridization (FISH) analysis, in which taxon-specific fluorescent probes replace or complement non-specific DNA stains. The particle size of aggregated cells can also be used to determine if cells are biofilm-originating or planktonic. Because biofilms may form on faucet heads, sampling strategies may opt to collect water samples as soon as water begins flowing from the tap (to favor collection of the tap’s biofilms) and/or wait until water has been flowing through the tap for several minutes (to measure systemic contaminants). Collection of both hot and cold tap water samples is crucial, because the different water temperatures can have an effect on the microorganisms that are able to persist in these water systems.
External Factors Influencing the Indoor Microbiome
Microbial community structure is highly habitat dependent. Therefore, the collection of metadata is fundamental to any project seeking to characterize the microbial community composition and structure. For constantly fluctuating parameters such as temperature, relative humidity, and brightness, one might consider recording not only the value at the time of sampling, but also the recent highs, lows, and averages for the sampled location. Table A5-3 lists parameters that may have an influence on microbial populations and communities. Many of these factors, such as temperature and humidity, are constantly
TABLE A5-3 Environmental Parameters
|
Building |
Room |
Surface |
|
Latitude, longitude, altitude |
Window closed vs. open |
Material (carpet, granite, etc.) |
changing, therefore measuring these variables continuously in order to observe maximums, minimums, and averages can be useful in generating a comprehensive site analysis.
To facilitate the adoption of a consistent metadata ontology for these types of measurements, a Minimum Information about any Sequence (MIxS) standard specific to the built environment (MIxS-BE) was presented to the Genomics Standards Consortium (GSC) on March 7, 2012 (Gilbert et al., 2012). At the time of this writing, the MIxS-BE standard is available as a working draft on the Microbiology of the Built Environment website (microBE.net) in order to solicit feedback and provide direction to early adopters. The MIxS GSC standards have been integral to generating comparable results among different research centers, with the existing GSC standards for genomics (MIGS), metagenomics (MIMS), and genetic markers (MIMARKS) (Field et al., 2008; Kottmann et al., 2008; Yilmaz et al., 2011) having enabled tens of thousands of environmental samples from dozens of laboratories and hundreds of geographic locations to be included in the Earth Microbiome Project (Gilbert et al., 2010a,b, 2011).
Automated Monitoring
Many of the parameters in Table A5-3 can be automatically measured and recorded at regular intervals by specialized data loggers designed for this purpose. Temperature and humidity monitors are relatively inexpensive, whereas devices for assessing air exchange rate, fraction of recirculated air, HVAC system flows, and occupancy and activities to a high level of precision can be a significant portion of a research budget and can require substantial post-processing. In selecting monitoring equipment, it is also important to consider the options of using battery versus electrical outlet power, and whether to store data locally on memory cards versus transmitting readings off site. In hospital settings, it is often necessary to obtain permission from technical administrators before installing wireless transmitters, because such devices may interfere with sensitive medical equipment.
Personnel- and asset-tracking infrastructure can also be of immense value to a study of microbial communities in an environment where human movement is hypothesized to be a driving factor in the introduction of new microbial species to surfaces and airborne particles. Through a combination of uniquely identifiable radio-frequency identification (RFID) tags worn by hospital occupants and RFID sensors placed throughout the building, this system is able to continuously monitor the location of personnel, thereby providing time-stamped information on person-to-person and person-to-room interactions. From this data, one can examine the connection between movement of staff between rooms and the movement of bacterial populations between rooms. Furthermore, by combining the observed number of occupants per room with the air exchange rate, it is possible to estimate the CO2 and airborne microbe concentrations at each point in time. RFID systems are commonly used to track equipment and can therefore
also provide information regarding which equipment is shared among patients, such as IVs and dialysis machines. These data enable researchers to observe not only microbial communities over time, but also the influence of human interaction with those communities.
Seasonal changes in outdoor humidity and temperature have previously been found to influence the composition of microbial communities in indoor environments (Augustowska and Dutkiewicz, 2006; Eber et al., 2011; Kaarakainen et al., 2009; Park et al., 2000; Pitkäranta et al., 2008; Rintala et al., 2008, 2012; Yamada, 2007). Therefore, the recording of meteorological conditions is an important aspect of indoor microbiome studies. This can be accomplished by retrieving publicly available National Oceanic and Atmospheric Administration records through the National Climatic Data Center website at www.ncdc.noaa.gov. This collection offers hourly measurements from a network of temperature, humidity, pressure, wind velocity, and precipitation sensors gathered from automated weather monitoring stations throughout the United States.
Special Considerations
Effect of Cleaning
Cleaning practices in indoor environments are inherently designed to affect the resident microbiota; therefore, it is important to take note of the strategies used to disinfect the environments under study and the time-points at which cleaning regimens were conducted. In previous studies, the effects of cleaning were found to be highly dependent upon the cleaning products used (Barker et al., 2004; Exner et al., 2004; Josephson et al., 1997; Marshall et al., 2012; Rusin et al., 1998; Rutala et al., 2000; Scott et al., 1984): antimicrobial agents, bleach, ethanol, peroxide, and Lysol were much more effective at sterilizing a surface than surfactants, detergents, vinegar, ammonia, or baking soda. Although there has been speculation that households using antimicrobial cleaning products may select for antibiotic-resistant bacteria, randomized studies investigating this hypothesis did not observe differences in bacterial population structure or antibiotic resistance in response to antimicrobial cleaning products (Aiello et al., 2005; Cole et al., 2003).
Healthcare Facility Sampling
Prior studies have identified numerous hospital-associated pathogens (HAPs) as well as routes of transmission between patients, staff, equipment, surfaces, and recycled air. HAPs that are of particular relevance are coagulase-negative staphylococci, Staphylococcus aureus, Enterococcus species, Candida species, Escherichia coli, Pseudomonas aeruginosa, Klebsiella pneumoniae, Enterobacter species, Acinetobacter baumannii, and Klebsiella oxytoca, which have been
previously found to collectively account for 84 percent of HAIs over a 21-month period in 463 hospitals (Hidron et al., 2008). These bacteria have been found on physician’s and nursing staff’s clothing (Babb et al., 1983; Biljan et al., 1993; Loh et al., 2000; Lopez et al., 2009; Perry et al., 2001; Snyder et al., 2008; Treakle et al., 2009; Wiener-Well et al., 2011; Wong et al., 1991; Zachary et al., 2001), cell phones (Akinyemi et al., 2009; Brady et al., 2006, 2009; Datta et al., 2009; Hassoun et al., 2004; Kilic et al., 2009; Ulger et al., 2009), stethoscopes (Marinella et al., 1997; Zachary et al., 2001), computer keyboards (Bures et al., 2000; Doğan et al., 2008), faucet handles (Bures et al., 2000), telemetry leads (Safdar et al., 2012), electronic thermometers (Livornese et al., 1992), blood-pressure cuffs (Myers, 1978), X-ray cassettes (Kim et al., 2012), gels for ultrasound probes (Schabrun et al., 2006), and in the air of patient rooms (Berardi and Leoni, 1993; Fleischer, 2006; Genet et al., 2011; Huang et al., 2006; Sudharsanam et al., 2008).
Patient microflora are one of the most significant drivers of microbial ecology within a hospital room (Bhalla et al., 2004; Drees et al., 2008b). Microorganisms are readily transferred from patients to hospital staff (Bhalla et al., 2004) and to the next occupant of the room after it has been cleaned (Drees et al., 2008a; Huang et al., 2006). Human traffic that enters and leaves multi-specialty medical centers includes patients with active diseases and infections as well as healthy patients undergoing invasive medical and surgical procedures. The inherent risk of cross-contamination from interactions between healthcare workers, patients, and their families presents a major obstacle to protecting patient health using only the practices of isolation and containment. Several studies have found that regular washing of patients’ skin with the bactericide chlorhexidine can reduce the likelihood of the patient acquiring a nosocomial antibiotic-resistant infection (Bleasdale, 2007; Climo et al., 2009; Kassakian et al., 2011; O’Horo et al., 2012; Paulson, 1993; Popovich et al., 2010; Vernon et al., 2006). Diagnostic testing performed by hospital laboratories in the course of patient treatment produces a detailed accounting of specific patient-associated microorganisms that, with institutional review board approval, can be included in study metadata to identify point sources of microbial populations within the larger hospital environment under observation.
Characterization of the Microbial Community
Ribosomal RNA sequencing is a common method to identify the microbial community structure in environmental samples. This approach involves PCR amplifying a variable region of the 16S (bacterial), 18S (eukaryotic), or ITS (fungal) rRNA gene using multifunctional DNA oligos that contain not only a complementary nucleotide sequence for priming the PCR reaction, but also a multiplex barcode for marking amplified sequences with a unique sample-specific DNA sequence and 5′ region encoding base pairs needed by the sequence technology.
The amplified, barcoded sequences from multiple samples are pooled together in equimolar concentrations for sequencing and then demultiplexed with computer algorithms based on their barcode sequence. Several software suites are freely available for processing high-throughput sequencing data including QIIME (Caporaso et al., 2010), MG-RAST (Meyer et al., 2008), mother (Schloss et al., 2009), Galaxy (Goecks et al., 2010), HUMAnN (Abubucker et al., 2012), and MEGAN (Huson et al., 2011).
The influence of environmental parameters on microbial populations can be quantified using multivariate non-parametric algorithms (e.g., principal coordinate analysis, principal component analysis, non-metric multidimensional scaling) for community composition and univariate analysis of variance (ANOVA) tests for diversity measures. These statistical tools calculate the percentages of variation that can be explained by individual parameters such as treatment, temperature, building material, adjacent microbiome, and any other environmental characteristic measured in concert with sample collections. Multivariate-crossed analyses are particularly useful in determining if specific combinations of environmental parameters (interactions) have a synergistic effect on population structure or composition. Univariate tests of diversity indices use higher-way ANOVA and are calculated with distribution-free, permutation-based (PERMANOVA) routines (Anderson, 2001). Additionally, following taxonomic characterization of the communities, using the QIIME pipeline (Caporaso et al., 2010), and production of an abundance matrix of operational taxonomic units against experimental condition, community similarity between samples can be represented by calculating a Bray-Curtis similarity matrix and UniFrac distances (Lozupone and Knight, 2005). Non-metric multidimensional scaling can be used to visualize the relationship between the experimental factors and formally tested using a combination of permutation-based PERMANOVA and fully non-parametric ANOSIM tests (Clarke, 1993). The QIIME, MoBEDAC, and VAMPS web servers calculate these metrics as well as facilitate the public release of such data sets. State-of-the-art artificial neural network software developed Larsen and colleagues can be employed to generate models for predicting the development of microbial communities based on the bacterial abundances observed in the study (Larsen et al., 2012). Source-tracking algorithms developed by Knights and colleagues identifies transference of communities from one sampling site to another (Knights et al., 2011). Taken together, these analyses provide insights into the driving factors behind microbial community development.
In addition to examining the relationships between microbial community structure and environmental variables, it is often desirable to compare population structures directly to one another. Such metrics include the diversity of species in a sample (alpha diversity) and the closely related measures of richness and evenness that describe the quantity of species and the range of population sizes (Whittaker, 1960, 1972). Beta diversity takes into account the average alpha diversity and the combined diversity of species across all samples (gamma
diversity) to evaluate the presence or absence of a core microbiome commonly shared across a significant subset of samples. This is particularly relevant in the study of disease-causing microorganisms, where it is important to differentiate between systemic populations of opportunistic pathogens that become disease-causing under specific conditions and microbes that are only associated with infections.
When describing the presence of potentially pathogenic microorganisms discovered in surveys of ribosomal sequences, care should be taken to place these results in context. Taxonomic assignment of reads is reliant on reference databases that contain a disproportionate number of sequences from disease-causing microbes, leading many novel operational taxonomic units to phylogenetically ordinate closest to a pathogen with which they may or may not share specific infectivity characteristics. The RDP Classifier (Wang et al., 2007) used in QIIME (Caporaso et al., 2010) and other taxonomic assignment software partially alleviates this issue by providing a confidence score for the assignment of a read into each taxonomic level—domain, kingdom, phylum, class, order, family, genus, and species. However, even correct species-level assignments fail to provide information on the presence or absence of genetic elements that are responsible for many pathogenic and antibiotic-resistant phenotypes.
Acknowledgments
The ideas presented in this article have been shaped in large part by Hospital Microbiome Consortium (hospitalmicrobiome.com/consortium) discussions held at the University of Chicago on June 7, 2012. We also thank the Arthur P. Sloan Foundation for funding the Home Microbiome Project (2011-6-05) and the Hospital Microbiome Consortium Workshop grant (2012-3-25).
References
Abubucker, S., N. Segata, J. Goll, A. M. Schubert, J. Izard, B. L. Cantarel, B. Rodriguez-Mueller, J. Zucker, M. Thiagarajan, B. Henrissat, O. White, S. T. Kelley, B. Methé, P. D. Schloss, D. Gevers, M. Mitreva, and C. Huttenhower. 2012. Metabolic reconstruction for metagenomic data and its application to the human microbiome. PLoS Computational Biology 8(6):e1002358. doi:10.1371/journal.pcbi.1002358.
Adler, A., I. Tager, and D. R. Quintero. 2005. Decreased prevalence of asthma among farm-reared children compared with those who are rural but not farm-reared. Journal of Allergy and Clinical Immunology 115(1):67-73. doi:10.1016/j.jaci.2004.10.008.
Aiello, A. E., B. Marshall, S. B. Levy, P. Della-Latta, S. X. Lin, and E. Larson. 2005. Antibacterial cleaning products and drug resistance. Emerging Infectious Diseases 11(10):1565-1570. doi:10.3201/eid1110.041276.
Akinyemi, K. O., A. D. Atapu, O. O. Adetona, and A. O. Coker. 2009. The potential role of mobile phones in the spread of bacterial infections. Journal of Infection in Developing Countries 3(8):628-632.
Alfvén, T., C. Braun-Fahrländer, B. Brunekreef, E. von Mutius, J. Riedler, A. Scheynius, M. van Hage, M. Wickman, M. R. Benz, J. Budde, K. B. Michels, D. Schram, E. Ublagger, M. Wasser, G. Pershagen, and PARSIFAL study group. 2006. Allergic diseases and atopic sensitization in children related to farming and anthroposophic lifestyle—the PARSIFAL Study. Allergy 61(4):414-421. doi:10.1111/j.1398-9995.2005.00939.x.
Anderson, M. J. 2001. A new method for non-parametric multivariate analysis of variance. Austral Ecology 26(1):32-46. doi:10.1111/j.1442-9993.2001.01070.pp.x.
Anderson, R. N., and B. L. Smith. 2005. Deaths: Leading causes for 2002. National Vital Statistics Reports: From the Centers for Disease Control and Prevention, National Center for Health Statistics, National Vital Statistics System 53(17):1-89.
Angenent, L. T. 2005. Molecular identification of potential pathogens in water and air of a hospital therapy pool. Proceedings of the National Academy of Sciences of the USA 102(13):4860-4865. doi:10.1073/pnas.0501235102.
Augustowska, M., and J. Dutkiewicz. 2006. Variability of airborne microflora in a hospital ward within a period of one year. Annals of Agricultural and Environmental Medicine: AAEM 13(1):99-106.
Babb, J. R., J. G. Davies, and G. A. J. Ayliffe. 1983. Contamination of protective clothing and nurses’ uniforms in an isolation ward. Journal of Hospital Infection 4(2):149-157. doi:10.1016/0195- 6701(83)90044-0.
Barker, J., I. B. Vipond, and S. F. Bloomfield. 2004. Effects of cleaning and disinfection in reducing the spread of norovirus contamination via environmental surfaces. Journal of Hospital Infection 58(1):42-49. doi:10.1016/j.jhin.2004.04.021.
Berardi, B. M., and E. Leoni. 1993. Indoor air climate and microbiological airborne: Contamination in various hospital areas. Zentralblatt Für Hygiene Und Umweltmedizin = International Journal of Hygiene and Environmental Medicine 194(4):405-418.
Bhalla, A., N. J. Pultz, D. M. Gries, A. J. Ray, E. C. Eckstein, D. C. Aron, and C. J. Donskey. 2004. Acquisition of nosocomial pathogens on hands after contact with environmental surfaces near hospitalized patients. Infection Control and Hospital Epidemiology 25(2):164-167. doi:10.1086/502369.
Biljan, M. M., C. A. Hart, D. Sunderland, P. R. Manasse, and C. R. Kingsland. 1993. Multicentre randomised double bind crossover trial on contamination of conventional ties and bow ties in routine obstetric and gynaecological practice. BMJ 307(6919):1582-1584. doi:10.1136/bmj.307.6919.1582.
Bleasdale, S. C. 2007. Effectiveness of chlorhexidine bathing to reduce catheter-associated blood-stream infections in medical intensive care unit patients. Archives of Internal Medicine 167(19): 2073. doi:10.1001/archinte.167.19.2073.
Bloomfield, S. F., R. Stanwell-Smith, R. W. R. Crevel, and J. Pickup. 2006. Too clean, or not too clean: The hygiene hypothesis and home hygiene. Clinical & Experimental Allergy 36(4):402- 425. doi:10.1111/j.1365-2222.2006.02463.x.
Blowers, R., and K. R. Wallace. 1960. Environmental aspects of staphylococcal infections acquired in hospitals. III. Ventilation of operating rooms—bacteriological investigations. American Journal of Public Health and the Nation’s Health 50:484-490.
Boe-Hansen, R., H-J. Albrechtsen, E. Arvin, and C. Jørgensen. 2002. Bulk water phase and biofilm growth in drinking water at low nutrient conditions. Water Research 36(18):4477-4486.
Bonetta, S., S. Bonetta, S. Mosso, S. Sampò, and E. Carraro. 2009. Assessment of microbiological indoor air quality in an Italian office building equipped with an HVAC system. Environmental Monitoring and Assessment 161(1-4):473-483. doi:10.1007/s10661-009-0761-8.
Bouillard, L., O. Michel, M. Dramaix, and M. Devleeschouwer. 2005. Bacterial contamination of indoor air, surfaces, and settled dust, and related dust endotoxin concentrations in healthy office buildings. Annals of Agricultural and Environmental Medicine: AAEM 12(2):187-192.
Bourdillon, R. B., and L. Colebrook. 1946. Air hygiene in dressing-rooms for burns or major wounds. Lancet 1(6400):601.
Brady, R. R. W., A. Wasson, I. Stirling, C. McAllister, and N. N. Damani. 2006. Is your phone bugged? The incidence of bacteria known to cause nosocomial infection on healthcare workers’ mobile phones. Journal of Hospital Infection 62(1):123-125. doi:10.1016/j.jhin.2005.05.005.
Brady, R. R. W., J. Verran, N. N. Damani, and A. P. Gibb. 2009. Review of mobile communication devices as potential reservoirs of nosocomial pathogens. Journal of Hospital Infection 71(4):295- 300. doi:10.1016/j.jhin.2008.12.009.
Bright, K. R., S. A. Boone, and C. P. Gerba. 2009. Occurrence of bacteria and viruses on elementary classroom surfaces and the potential role of classroom hygiene in the spread of infectious diseases. Journal of School Nursing 26(1):33-41. doi:10.1177/1059840509354383.
Bures, S., J. T. Fishbain, C. F. Uyehara, J. M. Parker, and B. W. Berg. 2000. Computer keyboards and faucet handles as reservoirs of nosocomial pathogens in the intensive care unit. American Journal of Infection Control 28(6):465-471. doi:10.1067/mic.2000.107267.
Caporaso, J. G., J. Kuczynski, J. Stombaugh, K. Bittinger, F. D. Bushman, E. K. Costello, N. Fierer, A. G. Peña, J. K. Goodrich, J. I. Gordon, G. A. Huttley, S. T. Kelley, D. Knights, J. E. Koenig, R. E. Ley, C. A. Lozupone, D. McDonald, B. D. Muegge, M. Pirrung, J. Reeder, J. R. Sevinsky, P. J. Turnbaugh, W. A. Walters, J. Widmann, T. Yatsunenko, J. Zaneveld, and R. Knight. 2010. QIIME allows analysis of high-throughput community sequencing data. Nature Methods 7(5):335-336. doi:10.1038/nmeth.f.303.
Clark, R. P. 2009. Skin scales among airborne particles. Journal of Hygiene 72(01):47. doi:10.1017/S0022172400023196.
Clarke, K. R. 1993. Non-parametric multivariate analyses of changes in community structure. Austral Ecology 18(1):117-143. doi:10.1111/j.1442-9993.1993.tb00438.x.
Climo, M. W., K. A. Sepkowitz, G. Zuccotti, V. J. Fraser, D. K. Warren, T. M. Perl, K. Speck, J. A. Jernigan, J. R. Robles, and E. S. Wong. 2009. The effect of daily bathing with chlorhexidine on the acquisition of methicillin-resistant Staphylococcus aureus, vancomycin-resistant Enterococcus, and healthcare-associated bloodstream infections: Results of a quasi-experimental multicenter trial. Critical Care Medicine 37(6):1858-1865. doi:10.1097/CCM.0b013e31819ffe6d.
Cole, E. C., R. M. Addison, J. R. Rubino, K. E. Leese, P. D. Dulaney, M. S. Newell, J. Wilkins, D. J. Gaber, T. Wineinger, and D. A. Criger. 2003. Investigation of antibiotic and antibacterial agent cross-resistance in target bacteria from homes of antibacterial product users and nonusers. Journal of Applied Microbiology 95(4):664-676. doi:10.1046/j.1365-2672.2003.02022.x.
Colebrook, L., and W. C. Cawston. 1948. Microbic content of air on roof of city hospital, at street level, and in wards. Medical Research Council, Special Report 262:233-241.
Costello, E. K., C. L. Lauber, M. Hamady, N. Fierer, J. I. Gordon, and R. Knight. 2009. Bacterial community variation in human body habitats across space and time. Science 326(5960):1694- 1697. doi:10.1126/science.1177486.
Cvjetanović, B. 1957. Determination of bacterial air pollution in various premises. Journal of Hygiene 56(02):163. doi:10.1017/S0022172400037657.
D’Amato, G., G. Liccardi, M. D’Amato, and S. Holgate. 2005. Environmental risk factors and allergic bronchial asthma. Clinical & Experimental Allergy 35(9):1113-1124. doi:10.1111/j.1365- 2222.2005.02328.x.
Datta, P., H. Rani, J. Chander, and V. Gupta. 2009. Bacterial contamination of mobile phones of health care workers. Indian Journal of Medical Microbiology 27(3):279-281. doi:10.4103/0255- 0857.53222.
Doğan, M., B. Feyzioğlu, M. Ozdemir, and B. Baysal. 2008. Investigation of microbial colonization of computer keyboards used inside and outside hospital environments. Mikrobiyoloji Bülteni 42(2):331-336.
Drees, M., D. R. Snydman, C. H. Schmid, L. Barefoot, K. Hansjosten, P. M. Vue, M. Cronin, S. A. Nasraway, and Y. Golan. 2008a. Prior environmental contamination increases the risk of acquisition of vancomycin-resistant enterococci. Clinical Infectious Diseases 46(5):678-685. doi:10.1086/527394.
Drees, M., D. R. Snydman, C. H. Schmid, L. Barefoot, K. Hansjosten, P. M. Vue, M. Cronin, S. A. Nasraway, and Y. Golan. 2008b. Antibiotic exposure and room contamination among patients colonized with vancomycin-resistant enterococci. Infection Control and Hospital Epidemiology 29(8):709-715. doi:10.1086/589582.
Drudge, C. N., S. Krajden, R. C. Summerbell, and J. A. Scott. 2011. Detection of antibiotic resistance genes associated with methicillin-resistant Staphylococcus aureus (MRSA) and coagulase-negative staphylococci in hospital air filter dust by PCR. Aerobiologia 28(2):285- 289. doi:10.1007/s10453-011-9219-x.
du Moulin, G. C., K. D. Stottmeier, P. A. Pelletier, A. Y. Tsang, and J. Hedley-Whyte. 1988. Concentration of Mycobacterium avium by hospital hot water systems. Journal of the American Medical Association 260(11):1599-1601.
Eber, M. R., M. Shardell, M. L. Schweizer, R. Laxminarayan, and E. N. Perencevich. 2011. Seasonal and temperature-associated increases in gram-negative bacterial bloodstream infections among hospitalized patients. PLoS ONE 6(9):e25298. doi:10.1371/journal.pone.0025298.
Embil, J., P. Warren, M. Yakrus, R. Stark, S. Corne, D. Forrest, and E. Hershfield. 1997. Pulmonary illness associated with exposure to mycobacterium-avium complex in hot tub water. Hypersensitivity pneumonitis or infection? Chest 111(3):813-816.
Escombe, A. R., C. C. Oeser, R. H. Gilman, M. Navincopa, E. Ticona, W. Pan, C. Martínez, J. Chacaltana, R. Rodríguez, D. A. Moore, J. S. Friedland, and C. A. Evans. 2007. Natural ventilation for the prevention of airborne contagion. PLoS Medicine 4(2):e68. doi:10.1371/journal. pmed.0040068.
Exner, M., V. Vacata, B. Hornei, E. Dietlein, and J. Gebel. 2004. Household cleaning and surface disinfection: New insights and strategies. Journal of Hospital Infection 56(Suppl 2):S70-S75. doi:10.1016/j.jhin.2003.12.037.
Fahlgren, C., G. Bratbak, R.-A. Sandaa, R. Thyrhaug, and U. Li Zweifel. 2010. Diversity of airborne bacteria in samples collected using different devices for aerosol collection. Aerobiologia 27(2):107-120. doi:10.1007/s10453-010-9181-z.
Falkinham, J. O., C. D. Norton, and M. W. LeChevallier. 2001. Factors influencing numbers of Mycobacterium avium, Mycobacterium intracellulare, and other mycobacteria in drinking water distribution systems. Applied and Environmental Microbiology 67(3):1225-1231. doi:10.1128/AEM.67.3.1225-1231.2001.
Farnsworth, J. E., S. M. Goyal, S. W. Kim, T. H. Kuehn, P. C. Raynor, M. A. Ramakrishnan, S. Anantharaman, and W. Tang. 2006. Development of a method for bacteria and virus recovery from heating, ventilation, and air conditioning (HVAC) filters. Journal of Environmental Monitoring 8(10):1006. doi:10.1039/b606132j.
Field, D., G. Garrity, T. Gray, N. Morrison, J. Selengut, P. Sterk, T. Tatusova, N. Thomson, M. J. Allen, S. V. Angiuoli, M. Ashburner, N. Axelrod, S. Baldauf, S. Ballard, J. Boore, G. Cochrane, J. Cole, P. Dawyndt, P. De Vos, C. dePamphilis, R. Edwards, N. Faruque, R. Feldman, J. Gilbert, P. Gilna, F. O. Glöckner, P. Goldstein, R. Guralnick, D. Haft, D. Hancock, H. Hermjakob, C. Hertz-Fowler, P. Hugenholtz, I. Joint, L. Kagan, M. Kane, J. Kennedy, G. Kowalchuk, R. Kottmann, E. Kolker, S. Kravitz, N. Kyrpides, J. Leebens-Mack, S. E. Lewis, K. Li, A. L. Lister, P. Lord, N. Maltsev, V. Markowitz, J. Martiny, B. Methe, I. Mizrachi, R. Moxon, K. Nelson, J. Parkhill, L. Proctor, O. White, S. Assunta-Sansone, A. Spiers, R. Stevens, P. Swift, C. Taylor, Y. Tateno, A. Tett, S. Turner, D. Ussery, B. Vaughan, N. Ward, T. Whetzel, I. San Gil, G. Wilson, and A. Wipat. 2008. The Minimum Information About a Genome Sequence (MIGS) Specification. Nature Biotechnology 26(5):541-547. doi:10.1038/nbt1360.
Fierer, N., C. L. Lauber, N. Zhou, D. McDonald, E. K. Costello, and R. Knight. 2010. Forensic identification using skin bacterial communities. Proceedings of the National Academy of Sciences of the USA 107(14):6477-6481. doi:10.1073/pnas.1000162107.
Finch, J. E., J. Prince, and M.Hawksworth. 1978. A bacteriological survey of the domestic environment. Journal of Applied Microbiology 45(3):357-364. doi:10.1111/j.1365-2672.1978. tb04236.x.
Fleischer, M. 2006. Microbiological control of airborne contamination in hospitals. Indoor and Built Environment 15(1):53-56. doi:10.1177/1420326X06062230.
Fox, K., A. Fox, T. Elssner, C. Feigley, and D. Salzberg. 2010. MALDI-TOF mass spectrometry speciation of staphylococci and their discrimination from micrococci isolated from indoor air of schoolrooms. Journal of Environmental Monitoring 12(4):917-923. doi:10.1039/b925250a.
Genet, C., G. Kibru, and W. Tsegaye. 2011. Indoor air bacterial load and antibiotic susceptibility pattern of isolates in operating rooms and surgical wards at Jimma University Specialized Hospital, southwest Ethiopia. Ethiopian Journal of Health Sciences 21(1):9-17.
Gilbert, J. A., F. Meyer, D. Antonopoulos, P. Balaji, C. T. Brown, N. Desai, J. A. Eisen, D. Evers, D. Field, W. Feng, D. Huson, J. Jansson, R. Knight, J. Knight, E. Kolker, K. Konstantindis, J. Kostka, N. Kyrpides, R. Mackelprang, A. McHardy, C. Quince, J. Raes, A. Sczyrba, A. Shade, and R. Stevens. 2010a. Meeting report: The Terabase Metagenomics Workshop and the Vision of an Earth Microbiome Project. Standards in Genomic Sciences 3(3):243-248. doi:10.4056/sigs.1433550.
Gilbert, J. A., F. Meyer, J. Jansson, J. Gordon, N. Pace, J. Tiedje, R. Ley, N. Fierer, D. Field, N. Kyrpides, F-O. Glöckner, H-P. Klenk, K. E. Wommack, E. Glass, K. Docherty, R. Gallery, Rick Stevens, and R. Knight. 2010b. The Earth Microbiome Project: Meeting report of the 1st EMP Meeting on Sample Selection and Acquisition at Argonne National Laboratory, October 6, 2010. Standards in Genomic Sciences 3(3):249-253. doi:10.4056/aigs.1443528.
Gilbert, J. A., M. Bailey, D. Field, N. Fierer, J. A. Fuhrman, B. Hu, J. Jansson, R. Knight, G. A. Kowalchuk, N. C. Kyrpides, F. Meyer, and R. Stevens. 2011. The Earth Microbiome Project: The Meeting Report for the 1st International Earth Microbiome Project Conference, Shenzhen, China, June 13-15, 2011. Standards in Genomic Sciences 5(2):243-247. doi:10.4056/sigs.2134923.
Gilbert, J. A., Y. Bao, H. Wang, S-A. Sansone, S. C. Edmunds, N. Morrison, F. Meyer, L. M. Schriml, N. Davies, P. Sterk, J. Wilkening, G. M. Garrity, D. Field, R. Robbins, D. P. Smith, I. Mizrachi, and C. Moreau. 2012. Report of the 13th Genomic Standards Consortium Meeting, Shenzhen, China, March 4-7, 2012. Standards in Genomic Sciences 6(2):276-286. doi:10.4056/sigs.2876184.
Goecks, J., A. Nekrutenko, J. Taylor, and The Galaxy Team. 2010. Galaxy: A comprehensive approach for supporting accessible, reproducible, and transparent computational research in the life sciences. Genome Biology 11(8):R86. doi:10.1186/gb-2010-11-8-r86.
Greene, V. W., D. Vesley, R. G. Bond, and G. S. Michaelsen. 1962a. Microbiological contamination of hospital air. I. Quantitative studies. Applied Environmental Microbiology 10:561-566.
Greene, V. W., D. Vesley, R. G. Bond, and G. S. Michaelsen. 1962b. Microbiological contamination of hospital air. II. Qualitative studies. Applied Environmental Microbiology 10:567-571.
Grice, E. A., H. H. Kong, S. Conlan, C. B. Deming, J. Davis, A. C. Young, NISC Comparative Sequencing Program, G. G. Bouffard, R. W. Blakesley, P. R. Murray, E. D. Green, M. L. Turner, and J. A. Segre. 2009. Topographical and temporal diversity of the human skin microbiome. Science 324(5931):1190-1192. doi:10.1126/science.1171700.
Grice, E. A., and J. A. Segre. 2011. The skin microbiome. Nature Reviews Microbiology 9(4):244-253. doi:10.1038/nrmicro2537.
Griffin, D. W., C. Gonzalez, N. Teigell, T. Petrosky, D. E. Northup, and M. Lyles. 2010. Observations on the use of membrane filtration and liquid impingement to collect airborne microorganisms in various atmospheric environments. Aerobiologia 27(1):25-35. doi:10.1007/s10453-010-9173-z.
Groseclose, S. L., W. S. Brathwaite, P. A. Hall, F. J. Connor, P. Sharp, W. J. Anderson, R. F. Fagan, J. J. Aponte, G. F. Jones, D. A. Nitschke, C. A. Worsham, N. Adekoya, M-H. Chang, T. Doyle, R. Dhara, and R. A. Jajosky. 2004. Summary of notifiable diseases—United States, 2002. Morbidity and Mortality Weekly Report 51(53):1-84.
Guenther, R., and G. Vittori. 2008. Sustainable healthcare architecture. Hoboken, NJ: John Wiley & Sons.
Hall-Baker, P. A., E. Nieves, R. A. Jajosky, D. A. Adams, P. Sharp, W. J. Anderson, J. J. Aponte, A. E. Aranas, S. B. Katz, M. Mayes, M. S. Wodajo, D. H. Onweh, J. Baillie, M. Park. 2010. Summary of notifiable diseases—United States, 2008. Morbidity and Mortality Weekly Report 57(54):1-100.
Hassoun, A., E. M. Vellozzi, and M. A. Smith. 2004. Colonization of personal digital assistants carried by healthcare professionals. Infection Control and Hospital Epidemiology 25(11):1000-1001. doi:10.1086/502334.
Hidron, A. I., J. R. Edwards, J. Patel, T. C. Horan, D. M. Sievert, D. A. Pollock, S. K. Fridkin, National Healthcare Safety Network Team, and Participating National Healthcare Safety Network Facilities. 2008. NHSN annual update: Antimicrobial-resistant pathogens associated with healthcare-associated infections: Annual summary of data reported to the National Healthcare Safety Network at the Centers for Disease Control and Prevention, 2006–2007. Infection Control and Hospital Epidemiology 29(11):996-1011. doi:10.1086/591861.
Hilton, A. C., and E. Austin. 2000. The kitchen dishcloth as a source of and vehicle for foodborne pathogens in a domestic setting. International Journal of Environmental Health Research 10(3):257-261. doi:10.1080/09603120050127202.
Hospodsky, D., J. Qian, W. W. Nazaroff, N. Yamamoto, K. Bibby, H. Rismani-Yazdi, and J. Peccia. 2012. Human occupancy as a source of indoor airborne bacteria. PLoS ONE 7(4):e34867. doi:10.1371/journal.pone.0034867.
Huang, L. L., I. F. Mao, M. L. Chen, and C. T. Huang. 2006. The microorganisms of indoor air in a teaching hospital. Taiwan Journal of Public Health 25(4):315-322.
Huang, S. S., R. Datta, and R. Platt. 2006. Risk of acquiring antibiotic-resistant bacteria from prior room occupants. Archives of Internal Medicine 166(18):1945-1951. doi:10.1001/archinte.166. 18.1945.
Huson, D. H., S. Mitra, H.-J. Ruscheweyh, N. Weber, and S. C. Schuster. 2011. Integrative analysis of environmental sequences using MEGAN4. Genome Research 21(9):1552-1560. doi:10.1101/gr.120618.111.
Huttunen, K., H. Rintala, M-R. Hirvonen, A. Vepsäläinen, A. Hyvärinen, T. Meklin, M. Toivola, and A. Nevalainen. 2008. Indoor air particles and bioaerosols before and after renovation of moisture-damaged buildings: The effect on biological activity and microbial flora. Environmental Research 107(3):291-298. doi:10.1016/j.envres.2008.02.008.
Hyvarinen, A., T. Meklin, A. Vepsäläinen, and A. Nevalainen. 2002. Fungi and actinobacteria in moisture-damaged building materials—concentrations and diversity. International Biodeterioration & Biodegradation 49(1):27-37. doi:10.1016/S0964-8305(01)00103-2.
Jaffal, A. A., I. M. Banat, A. A. El Mogheth, H. Nsanze, A. Bener, and A. S. Ameen. 1997. Residential indoor airborne microbial populations in the United Arab Emirates. Environment International 23(4):529-533. doi:10.1016/S0160-4120(97)00055-X. Josephson, K. L., J. R. Rubino, and I. L. Pepper. 1997. Characterization and quantification of bacterial pathogens and indicator organisms in household kitchens with and without the use of a disinfectant cleaner. Journal of Applied Microbiology 83(6):737-750.
Kaarakainen, P., H. Rintala, A. Vepsäläinen, A. Hyvärinen, A. Nevalainen, and T. Meklin. 2009. Microbial content of house dust samples determined with qPCR. Science of the Total Environment 407(16):4673-4680. doi:10.1016/j.scitotenv.2009.04.046.
Kassakian, S. Z., L. A. Mermel, J. A. Jefferson, S. L. Parenteau, and J. T. Machan. 2011. Impact of chlorhexidine bathing on hospital-acquired infections among general medical patients. Infection Control and Hospital Epidemiology 32(3):238-243. doi:10.1086/658334.
Kelley, S. T., U. Theisen, L. T. Angenent, A. St Amand, and N. R. Pace. 2004. Molecular analysis of shower curtain biofilm microbes. Applied and Environmental Microbiology 70(7):4187-4192. doi:10.1128/AEM.70.7.4187-4192.
Kembel, S. W., E. Jones, J. Kline, D. Northcutt, J. Stenson, A. M. Womack, B. J. M. Bohannan, G. Z. Brown, and J. L. Green. 2012. Architectural design influences the diversity and structure of the built environment microbiome. ISME Journal. doi:10.1038/ismej.2011.211.
Kilic, I. H., M. Ozaslan, I. D. Karagoz, Y. Zer, and V. Davutoglu. 2009. The microbial colonisation of mobile phone used by healthcare staffs. Pakistan Journal of Biological Sciences 12(11):882- 884. doi:10.3923/pjbs.2009.882.884.
Kim, J.-S., H.-S. Kim, J.-Y. Park, H.-S. Koo, C.-S. Choi, W. Song, H. C. Cho, and K. M. Lee. 2012. Contamination of X-ray cassettes with methicillin-resistant Staphylococcus aureus and methicillin-resistant Staphylococcus haemolyticus in a radiology department. Annals of Laboratory Medicine 32(3):206. doi:10.3343/alm.2012.32.3.206.
Klevens, R. M., J. R. Edwards, C. L. Richards Jr., T. C. Horan, R. P. Gaynes, D. A. Pollock, and D. M. Cardo. 2007. Estimating health care-associated infections and deaths in U.S. hospitals, 2002. Public Health Reports (Washington, D.C.: 1974) 122(2):160-166.
Klintberg, B., N. Berglund, G. Lilja, M. Wickman, and M. van Hage-Hamsten. 2001. Fewer allergic respiratory disorders among farmers’ children in a closed birth cohort from Sweden. European Respiratory Journal: Official Journal of the European Society for Clinical Respiratory Physiology 17(6):1151-1157.
Knights, D., J. Kuczynski, E. S. Charlson, J. Zaneveld, M. C. Mozer, R. G. Collman, F. D. Bushman, R. Knight, and S. T. Kelley. 2011. Bayesian community-wide culture-independent microbial source tracking. Nature Methods 8(9):761-763. doi:10.1038/nmeth.1650.
Kopperud, R. J., A. R. Ferro, and L. M. Hildemann. 2004. Outdoor versus indoor contributions to indoor particulate matter (PM) determined by mass balance methods. Journal of the Air & Waste Management Association (1995) 54(9):1188-1196.
Korves, T. M., Y. M. Piceno, L. M. Tom, T. Z. DeSantis, B. W. Jones, G. L. Andersen, and G. M. Hwang. 2012. Bacterial communities in commercial aircraft high-efficiency particulate air (HEPA) filters assessed by PhyloChip analysis. Indoor Air. doi:10.1111/j.1600- 0668.2012.00787.x. http://doi.wiley.com/10.1111/j.1600-0668.2012.00787.x.
Kottmann, R., T. Gray, S. Murphy, L. Kagan, S. Kravitz, T. Lombardot, D. Field, and F. O. Glöckner. 2008. A standard MIGS/MIMS compliant XML schema: Toward the development of the Genomic Contextual Data Markup Language (GCDML). OMICS: A Journal of Integrative Biology 12(2):115-121. doi:10.1089/omi.2008.0A10.
Kramer, A., I. Schwebke, and G. Kampf. 2006. How long do nosocomial pathogens persist on inanimate surfaces? A systematic review. BMC Infectious Diseases 6:130. doi:10.1186/1471-2334-6-130.
Krogulski, A., and M. Szczotko. 2011. Microbiological quality of hospital indoor air. Determinant factors for microbial concentration in air of operating theatres. Roczniki Państwowego Zakładu Higieny 62(1):109-113.
Larsen, P. E., D. Field, and J. A. Gilbert. 2012. Predicting bacterial community assemblages using an artificial neural network approach. Nature Methods. doi:10.1038/nmeth.1975.
Le Dantec, C., J.-P. Duguet, A. Montiel, N. Dumoutier, S. Dubrou, and V. Vincent. 2002. Occurrence of mycobacteria in water treatment lines and in water distribution systems. Applied and Environmental Microbiology 68(11):5318-5325. doi:10.1128/AEM.68.11.5318-5325.2002.
Lee, T. C., J. E. Stout, and V. L. Yu. 1988. Factors predisposing to Legionella pneumophila colonization in residential water systems. Archives of Environmental Health: An International Journal 43(1):59-62. doi:10.1080/00039896.1988.9934375.
Leoni, E., P. Legnani, M. T. Mucci, and R. Pirani. 1999. Prevalence of mycobacteria in a swimming pool environment. Journal of Applied Microbiology 87(5):683-688. doi:10.1046/j.1365- 2672.1999.00909.x.
Leoni, E., P. Legnani, M. A. Bucci Sabattini, and F. Righi. 2001. Prevalence of Legionella spp. in swimming pool environment. Water Research 35(15):3749-3753. doi:10.1016/S0043-1354(01) 00075-6.
Leynaert, B., C. Neukirch, D. Jarvis, S. Chinn, P. Burney, and F. Neukirch. 2001. Does living on a farm during childhood protect against asthma, allergic rhinitis, and atopy in adulthood? American Journal of Respiratory and Critical Care Medicine 164(10 Pt 1):1829-1834.
Lignell, U., T. Meklin, H. Rintala, A. Hyvärinen, A. Vepsäläinen, J. Pekkanen, and A. Nevalainen. 2008. Evaluation of quantitative PCR and culture methods for detection of house dust fungi and streptomycetes in relation to moisture damage of the house. Letters in Applied Microbiology 47(4):303-308. doi:10.1111/j.1472-765X.2008.02431.x.
Livornese, L. L., Jr., S. Dias, C. Samel, B. Romanowski, S. Taylor, P. May, P. Pitsakis, G. Woods, D. Kaye, and M. E. Levison. 1992. Hospital-acquired infection with vancomycin-resistant Enterococcus faecium transmitted by electronic thermometers. Annals of Internal Medicine 117(2):112-116.
Loh, W., V. V. Ng, and J. Holton. 2000. Bacterial flora on the white coats of medical students. Journal of Hospital Infection 45(1):65-68. doi:10.1053/jhin.1999.0702.
Lopez, P.-J., O. Ron, P. Parthasarathy, J. Soothill, and L. Spitz. 2009. Bacterial counts from hospital doctors’ ties are higher than those from shirts. American Journal of Infection Control 37 (1):79- 80. doi:10.1016/j.ajic.2008.09.018.
Lozupone, C., and R. Knight. 2005. UniFrac: A new phylogenetic method for comparing microbial communities. Applied and Environmental Microbiology 71(12):8228-8235. doi:10.1128/AEM.71.12.8228-8235.2005.
Marinella, M. A., C. Pierson, and C. Chenoweth. 1997. The stethoscope: A potential source of nosocomial infection? Archives of Internal Medicine 157(7):786-790. doi:10.1001/archinte.1997. 00440280114010.
Marshall, B. M., E. Robleto, T. Dumont, and S. B. Levy. 2012. The frequency of antibiotic-resistant bacteria in homes differing in their use of surface antibacterial agents. Current Microbiology 65(4):407-415. doi:10.1007/s00284-012-0172-x.
Martinez, F. D. 2001. The coming-of-age of the hygiene hypothesis. Respiratory Research 2(3):129- 132. doi:10.1186/rr48.
Merchant, J. A., A. L. Naleway, E. R. Svendsen, K. M. Kelly, L. F. Burmeister, A. M. Stromquist, C. D. Taylor, P. S. Thorne, S. J. Reynolds, W. T. Sanderson, and E. A. Chrischilles. 2005. Asthma and farm exposures in a cohort of rural Iowa children. Environmental Health Perspectives 113(3):350-356.
Meyer, F., D. Paarmann, M. D’Souza, R. Olson, E. Glass, M. Kubal, T. Paczian, A. Rodriguez, R. Stevens, A. Wilke, J. Wilkening, and R. A. Edwards. 2008. The metagenomics RAST Server—a public resource for the automatic phylogenetic and functional analysis of metagenomes. BMC Bioinformatics 9(1):386. doi:10.1186/1471-2105-9-386.
Monto, A. S. 2002. Epidemiology of viral respiratory infections. American Journal of Medicine 112(6):4-12. doi:10.1016/S0002-9343(01)01058-0.
Morrow, J. B., A. S. Downey, and J. Peccia. 2012. Challenges in microbial sampling in the indoor environment. National Institutes of Standards and Technology. http://www.nist.gov/customcf/get_pdf.cfm?pub_id=910577.
Moschandreas, D. J. 1981. Exposure to pollutants and daily time budgets of people. Bulletin of the New York Academy of Medicine 57(10):845-859.
Myers, M. G. 1978. Longitudinal evaluation of neonatal nosocomial infections: Association of infection with a blood pressure cuff. Pediatrics 61(1):42-45.
Nevalainen, A., and M. Seuri. 2005. Of microbes and men. Indoor Air 15(s9):58-64. doi:10.1111/j. 1600-0668.2005.00344.x.
Noble, W. C., J. D. F. Habbema, R. Van Furth, I. Smith, and C. De Raay. 1976. Quantitative studies on the dispersal of skin bacteria into the air. Journal of Medical Microbiology 9(1):53-61. doi:10.1099/00222615-9-1-53.
Noris, F., J. A. Siegel, and K. A. Kinney. 2009. Biological and chemical contaminants in HVAC filter dust. ASHRAE Transactions 115(2):484-491.
Noris, F., J. A. Siegel, and K. A. Kinney. 2011. Evaluation of HVAC filters as a sampling mechanism for indoor microbial communities. Atmospheric Environment 45(2):338-346. doi:10.1016/j. atmosenv.2010.10.017.
O’Horo, J. C., G. L. M. Silva, L. S. Munoz-Price, and N. Safdar. 2012. The efficacy of daily bathing with chlorhexidine for reducing healthcare-associated bloodstream infections: A meta-analysis. Infection Control and Hospital Epidemiology 33(3):257-267. doi:10.1086/664496.
Park, J. H., D. L. Spiegelman, H. A. Burge, D. R. Gold, G. L. Chew, and D. K. Milton. 2000. Longitudinal study of dust and airborne endotoxin in the home. Environmental Health Perspectives 108(11):1023-1028.
Paulson, D. S. 1993. Efficacy evaluaton of a 4% chlorhexidine gluconate as a full-body shower wash. American Journal of Infection Control 21(4):205-209. doi:10.1016/0196-6553(93)90033-Z. Peccia, J., D. K. Milton, T. Reponen, and J. Hill. 2008. A role for environmental engineering and science in preventing bioaerosol-related disease. Environmental Science & Technology 42(13):4631-4637. doi:10.1021/es087179e.
Perry, C., R. Marshall, and E. Jones. 2001. Bacterial contamination of uniforms. Journal of Hospital Infection 48(3):238-241. doi:10.1053/jhin.2001.0962.
Pitkäranta, M., T. Meklin, A. Hyvärinen, L. Paulin, P. Auvinen, A. Nevalainen, and H. Rintala. 2008. Analysis of fungal flora in indoor dust by ribosomal DNA sequence analysis, quantitative PCR, and culture. Applied and Environmental Microbiology 74(1):233-244. doi:10.1128/AEM.00692-07.
Pope, A. M., R. Patterson, H. Burge, and Institute of Medicine (U.S.). Committee on the Health Effects of Indoor Allergens. 1993. Indoor allergens assessing and controlling adverse health effects. Washington, DC: National Academy Press. http://search.ebscohost.com/login.aspx?direct=true&scope=site&db=nlebk&db=nlabk&AN=1100.
Popovich, K. J., B. Hota, R. Hayes, R. A. Weinstein, and M. K. Hayden. 2010. Daily skin cleansing with chlorhexidine did not reduce the rate of central-line associated bloodstream infection in a surgical intensive care unit. Intensive Care Medicine 36(5):854-858. doi:10.1007/s00134-010-1783-y.
Qian, H., and Y. Li. 2010. Removal of exhaled particles by ventilation and deposition in a multibed airborne infection isolation room. Indoor Air 20(4):284-297. doi:10.1111/j.1600- 0668.2010.00653.x.
Qian, J., D. Hospodsky, N. Yamamoto, W. W. Nazaroff, and J. Peccia. 2012. Size-resolved emission rates of airborne bacteria and fungi in an occupied classroom. Indoor Air. doi:10.1111/j. 1600-0668.2012.00769.x.
Remes, S. T., H. O. Koskela, K. Iivanainen, and J. Pekkanen. 2005. Allergen-specific sensitization in asthma and allergic diseases in children: The Study on Farmers’ and Non-farmers’ Children. Clinical and Experimental Allergy: Journal of the British Society for Allergy and Clinical Immunology 35(2):160-166. doi:10.1111/j.1365-2222.2005.02172.x.
Riedler, J., C. Braun-Fahrländer, W. Eder, M. Schreuer, M. Waser, S. Maisch, D. Carr, R. Schierl, D. Nowak, and E. von Mutius. 2001. Exposure to farming in early life and development of asthma and allergy: A cross-sectional survey. Lancet 358(9288):1129-1133. doi:10.1016/S0140-6736(01)06252-3.
Rintala, H., M. Pitkaranta, M. Toivola, L. Paulin, and A. Nevalainen. 2008. Diversity and seasonal dynamics of bacterial community in indoor environment. BMC Microbiology 8(1):56. doi:10.1186/1471-2180-8-56.
Rintala, H., M. Pitkäranta, and M. Täubel. 2012. Microbial communities associated with house dust. Advances in Applied Microbiology 78:75-120. Elsevier. http://linkinghub.elsevier.com/retrieve/pii/B978012394805200004X. Rook, G. A. W. 2009. Review series on helminths, immune modulation and the hygiene hypothesis: The broader implications of the hygiene hypothesis. Immunology 126(1):3-11. doi:10.1111/j. 1365-2567.2008.03007.x.
Rook, G. A. W., and J. L. Stanford. 1998. Give us this day our daily germs. Immunology Today 19(3):113-116. doi:10.1016/S0167-5699(98)80008-X.
Rusin, P., P. Orosz-Coughlin, and C. Gerba. 1998. Reduction of faecal coliform, coliform and heterotrophic plate count bacteria in the household kitchen and bathroom by disinfection with hypochlorite cleaners. Journal of Applied Microbiology 85(5):819-828.
Rutala, W. A., S. L. Barbee, N. C. Aguiar, M. D. Sobsey, and D. J. Weber. 2000. Antimicrobial activity of home disinfectants and natural products against potential human pathogens. Infection Control and Hospital Epidemiology 21(1):33-38. doi:10.1086/501694.
Safdar, N., J. Drayton, J. Dern, S. Warrack, M. Duster, and M. Schmitz. 2012. Telemetry leads harbor nosocomial pathogens. International Journal of Infection Control 8(2). doi:10.3396/ijic. v8i2.012.12.
Schabrun, S., L. Chipchase, and H. Rickard. 2006. Are therapeutic ultrasound units a potential vector for nosocomial infection? Physiotherapy Research International 11(2):61-71. doi:10.1002/pri.329.
Schloss, P. D., S. L. Westcott, T. Ryabin, J. R. Hall, M. Hartmann, E. B. Hollister, R. A. Lesniewski, B. B. Oakley, D. H. Parks, C. J. Robinson, J. W. Sahl, B. Stres, G. G. Thallinger, D. J. Van Horn, and C. F. Weber. 2009. Introducing Mothur: Open-source, platform-independent, community-supported software for describing and comparing microbial communities. Applied and Environmental Microbiology 75(23):7537-7541. doi:10.1128/AEM.01541-09.
Schram, D., G. Doekes, M. Boeve, J. Douwes, J. Riedler, E. Ublagger, E. Mutius, J. Budde, G. Pershagen, F. Nyberg, J. Alm, C. Braun-Fahrländer, M. Waser, B. Brunekreef, and the PARSIFAL Study Group. 2005. Bacterial and fungal components in house dust of farm children, Rudolf Steiner school children and reference children—the PARSIFAL Study. Allergy 60(5):611-618. doi:10.1111/j.1398-9995.2005.00748.x.
Scott, E., S. F. Bloomfield, and C. G. Barlow. 1982. An investigation of microbial contamination in the home. Journal of Hygiene 89(2):279-293.
Scott, E., S. F. Bloomfield, and C. G. Barlow. 1984. Evaluation of disinfectants in the domestic environment under ‘in use’ conditions. Journal of Hygiene 92(2):193-203.
Sebastian, A., and L. Larsson. 2003. Characterization of the microbial community in indoor environments: A chemical-analytical approach. Applied and Environmental Microbiology 69(6):3103- 3109. doi:10.1128/AEM.69.6.3103-3109.2003.
Simard, C., M. Trudel, G. Paquette, and P. Payment. 1983. Microbial investigation of the air in an apartment building. Journal of Hygiene 91(2):277-286.
Snyder, G. M., K. A. Thom, J. P. Furuno, E. N. Perencevich, M.-C. Roghmann, S. M. Strauss, G. Netzer, and A. D. Harris. 2008. Detection of methicillin-resistant Staphylococcus aureus and vancomycin-resistant enterococci on the gowns and gloves of healthcare workers. Infection Control and Hospital Epidemiology 29(7):583-589. doi:10.1086/588701.
Stajich, J. E., T. Harris, B. P. Brunk, J. Brestelli, S. Fischer, O. S. Harb, J. C. Kissinger, W. Li, V. Nayak, D. F. Pinney, C. J. Stoekert Jr., and D. S. Roos. 2011. FungiDB: An integrated functional genomics database for fungi. Nucleic Acids Research 40(D1):D675-D681. doi:10.1093/nar/gkr918.
Stanley, N. J., T. H. Kuehn, S. W. Kim, P. C. Raynor, S. Anantharaman, M. A. Ramakrishnan, and Sagar M. Goyal. 2008. Background culturable bacteria aerosol in two large public buildings using HVAC filters as long term, passive, high-volume air samplers. Journal of Environmental Monitoring 10(4):474. doi:10.1039/b719316e.
Sudharsanam, S., P. Srikanth, M. Sheela, and R. Steinberg. 2008. Study of the indoor air quality in hospitals in South Chennai, India—microbial profile. Indoor and Built Environment 17(5):435- 441. doi:10.1177/1420326X08095568.
Taitt, C. R., T. Leski, D. Stenger, G. J. Vora, B. House, M. Nicklasson, G. Pimentel, D. V. Zurawski, B. C. Kirkup, D. Craft, P. E. Waterman, E. P. Lesho, U. Bangurae, and R. Ansumana. 2012. Antimicrobial resistance determinant microarray for analysis of multi-drug resistant isolates. SPIE 8371: 83710X-83710X-10.
Tang, J. W. 2009. The effect of environmental parameters on the survival of airborne infectious agents. Journal of The Royal Society Interface 6(Suppl_6):S737-S746. doi:10.1098/rsif.2009.0227. focus.
Täubel, M., H. Rintala, M. Pitkäranta, L. Paulin, S. Laitinen, J. Pekkanen, A. Hyvärinen, and A. Nevalainen. 2009. The occupant as a source of house dust bacteria. Journal of Allergy and Clinical Immunology 124(4):834-840.e47. doi:10.1016/j.jaci.2009.07.045.
Thomas, V., K. Herrera-Rimann, D. S. Blanc, and G. Greub. 2006. Biodiversity of amoebae and amoeba-resisting bacteria in a hospital water network. Applied and Environmental Microbiology 72(4):2428-2438. doi:10.1128/AEM.72.4.2428-2438.2006.
Treakle, A. M., K. A. Thom, J. P. Furuno, S. M. Strauss, A. D. Harris, and E. N. Perencevich. 2009. Bacterial contamination of health care workers’ white coats. American Journal of Infection Control 37(2):101-105. doi:10.1016/j.ajic.2008.03.009.
Tringe, S. G., T. Zhang, X. Liu, Y. Yu, W. H. Lee, J. Yap, F. Yao, S. T. Suan, S. K. Ing, M. Haynes, F. Rohwer, C. L. Wei, P. Tan, J. Bristow, E. M. Rubin, and Y. Ruan. 2008. The airborne metagenome in an indoor urban environment. PLoS ONE 3(4):e1862. doi:10.1371/journal. pone.0001862.
Ulger, F., S. Esen, A. Dilek, K. Yanik, M. Gunaydin, and H. Leblebicioglu. 2009. Are we aware how contaminated our mobile phones with nosocomial pathogens? Annals of Clinical Microbiology and Antimicrobials 8(1):7. doi:10.1186/1476-0711-8-7.
Vaerewijck, M. J. M., G. Huys, J. Carlos Palomino, J. Swings, and F. Portaels. 2005. Mycobacteria in drinking water distribution systems: Ecology and significance for human health. FEMS Microbiology Reviews 29(5):911-934. doi:10.1016/j.femsre.2005.02.001.
Vernon, M. O., M. K. Hayden, W. E. Trick, R. A. Hayes, D. W. Blom, and R. A. Weinstein. 2006. Chlorhexidine gluconate to cleanse patients in a medical intensive care unit: The effectiveness of source control to reduce the bioburden of vancomycin-resistant Enterococci. Archives of Internal Medicine 166(3):306-312. doi:10.1001/archinte.166.3.306.
Wang, Q., G. M. Garrity, J. M. Tiedje, and J. R. Cole. 2007. Naive Bayesian classifier for rapid assignment of rRNA sequences into the new bacterial taxonomy. Applied and Environmental Microbiology 73(16):5261-5267. doi:10.1128/AEM.00062-07.
Warner, P., and A. Glassco. 1963. Enumeration of air-borne bacteria in hospital. Canadian Medical Association Journal 88:1280-1283.
Whittaker, R. H. 1960. Vegetation of the Siskiyou Mountains, Oregon and California. Ecological Monographs 30(3):279. doi:10.2307/1943563.
Whittaker, R. H. 1972. Evolution and measurement of species diversity. Taxon 21(2/3):213. doi: 10.2307/1218190.
Wiener-Well, Y., M. Galuty, B. Rudensky, Y. Schlesinger, D. Attias, and A. M. Yinnon. 2011. Nursing and physician attire as possible source of nosocomial infections. American Journal of Infection Control 39(7):555-559. doi:10.1016/j.ajic.2010.12.016.
Williams, R. E. O., and A. Hirch. 1950. Bacterial contamination of air in underground trains. Lancet 1(6595):128-131. doi:10.1016/S0140-6736(50)90081-X. Williams, R. E. O., O. M. Lidwell, and A. Hirch. 1956. The bacterial flora of the air of occupied rooms. Journal of Hygiene 54(04):512. doi:10.1017/S002217240004479X. Wong, D., K. Nye, and P. Hollis. 1991. Microbial flora on doctors’ white coats. BMJ 303(6817):1602- 1604. doi:10.1136/bmj.303.6817.1602.
Yamada, K. 2007. A study on the behavior and control of indoor airborne microbe in a clinic. Journal of the National Institute of Public Health 56(3):300-302.
Yazdanbakhsh, M., and P. M. Matricardi. 2004. Parasites and the hygiene hypothesis: Regulating the immune system? Clinical Reviews in Allergy & Immunology 26(1):15-24. doi:10.1385/CRIAI:26:1:15.
Yilmaz, P., R. Kottmann, D. Field, R. Knight, J. R. Cole, L. Amaral-Zettler, J. A. Gilbert, I. Karsch-Mizrachi, A. Johnston, G. Cochrane, R. Vaughan, C. Hunter, J. Park, N. Morrison, P. Rocca-Serra, P. Sterk, M. Arumugam, M. Bailey, L. Baumgartner, B. W. Birren, M. J. Blaser, V. Bonazzi, T. Booth, P. Bork, F. D. Bushman, P. L. Buttigieg, P. S. G. Chain, E. Charlson, E. K. Costello, H. Huot-Creasy, P. Dawyndt, T. DeSantis, N. Fierer, J. A. Fuhrman, R. E. Gallery, D. Gevers, R. A. Gibbs, I. San Gil, A. Gonzalez, J. I. Gordon, R. Guralnick, W. Hankeln, S. Highlander, P. Hugenholtz, J. Jansson, A. L. Kau, S. T. Kelley, J. Kennedy, D. Knights, O. Koren, J. Kuczynski, N. Kyrpides, R. Larsen, C. L. Lauber, T. Legg, R. E. Ley, C. A. Lozupone, W. Ludwig, D. Lyons, E. Maguire, B. A. Methé, F. Meyer, B. Muegge, S. Nakielny, K. E. Nelson, D. Nemergut, J. D. Neufeld, L. K. Newbold, A. E. Oliver, N. R. Pace, G. Palanisamy, J. Peplies, J. Petrosino, L. Proctor, E. Pruesse, C. Quast, J. Raes, S. Ratnasingham, J. Ravel, D. A. Relman, S. Assunta-Sansone, P. D. Schloss, L. Schriml, R. Sinha, M. I. Smith, E. Sodergren, A. Spor, J. Stombaugh, J. M. Tiedje, D. V. Ward, G. M. Weinstock, D. Wendel, O. White, A. Whiteley, A. Wilke, J. R. Wortman, T. Yatsunenko, and F. O. Glöckner. 2011. Minimum Information about a Marker Gene Sequence (MIMARKS) and Minimum Information About Any (x) Sequence (MIxS) Specifications. 2011. Nature Biotechnology 29(5):415-420. doi:10.1038/nbt.1823.
Zachary, K. C., P. S. Bayne, V. J. Morrison, D. S. Ford, L. C. Silver, and D. C. Hooper. 2001. Contamination of gowns, gloves, and stethoscopes with vancomycin-resistant Enterococci. Infection Control and Hospital Epidemiology 22(9):560-564. doi:10.1086/501952.
SEQUENCING ERRORS, DIVERSITY ESTIMATES
AND THE RARE BIOSPHERE
Susan M. Huse,22David B. Mark Welch, and Mitchell L. Sogin
Introduction
Our understanding of microbial communities is in a time of rapid change. The application of polymerase chain reaction (PCR), cloning, and DNA sequencing to microbial diversity research has rapidly expanded our appreciation of the extent of the microbial world. In particular, analysis of PCR amplicons from various regions of the small subunit ribosomal RNA (SSU rRNA or 16S) gene generated from culture-independent samples is now the accepted standard for cataloguing microbial communities. As sequencing technologies improved, it became feasible to assess community membership from more than 1,000 individual SSU rRNA amplicons. With the advent of next-generation sequencing (NGS) that did not require the cloning of individual amplicons, researchers transitioned from generating thousands of ~800–1,100 nt reads to hundreds of thousands of 100–500 nt sequencing reads (454 technology). Illumina technology can now
_______________________
22 Brown University.
produce millions of 100 nt reads from hundreds of samples in a single run, potentially providing a nearly exhaustive survey of microbes present in a sample.
While the NGS technologies provide deeper sampling, the trade-off for depth has been shorter read lengths. The ~800–1,100 nt reads produced by the late 1990s using Sanger sequencing on ABI or LICOR platforms could be used to reconstruct the entire SSU rRNA gene through multiple sequencing of the same clone. To make use of the shorter reads produced by NGS technology, Sogin et al. capitalized on the structure of the SSU rRNA gene. The gene includes a series of regions that are highly conserved across the bacterial domain, interspersed with a series of nine hypervariable regions. This structure lends itself conveniently to NGS because oligonucleotide primers that target conserved regions on either side of the hypervariable regions can amplify DNA from across the bacterial domain. The more rapidly evolving hypervariable regions in contrast are unique for most microbial genera and in many cases can differentiate below the genus level. Sogin et al. used primers to conserved flanking regions to amplify the V6 hypervariable region, which at 60–80 nt in length could reliably be completely sequenced on a 454 GS20. As with conventionally sequenced clone libraries, each read in principle represents an SSU rRNA operon and is a proxy for a microbe from the sample. By comparing the hypervariable region sequences against databases of SSU rRNA gene sequences from known taxonomy, such as RDP (Wang et al., 2007), SILVA (Pruesse et al., 2007), or Greengenes (DeSantis et al., 2006), the reads become tags for cataloging the taxonomy of the community being studied.
As the technology for microbial community research has evolved, so has our understanding of the communities we study. In the first published study implementing NGS in environmental samples, Sogin et al. (2006) examined several marine environments and discovered a richness and diversity in microbial community structures previously unknown. Each community exhibited a relatively small number of highly abundant taxa and a large number of low abundance taxa, a pattern often described as a long-tail distribution (Figure A6-1). Because of the unevenness of this community structure, previous studies using hundreds or thousands of sequencing reads were able to identify only the most abundant members and a small fraction of the taxa in the long tail. The greater sequencing depth of NGS methods revealed the breadth of the low abundance taxa—the “rare biosphere.”
Impact of Sequencing Errors and Clustering Methods
As NGS provided a means to explore ever deeper into microbial community structures, the gap between the number of named species and the number of sequence phylotypes increased. Unfortunately, the short read lengths of NGS technology, especially when applied to hypervariable regions with few stable phylogenetically informative positions, are poorly suited for the traditional phylogenetic analyses required for registering new taxa. Researchers turned to
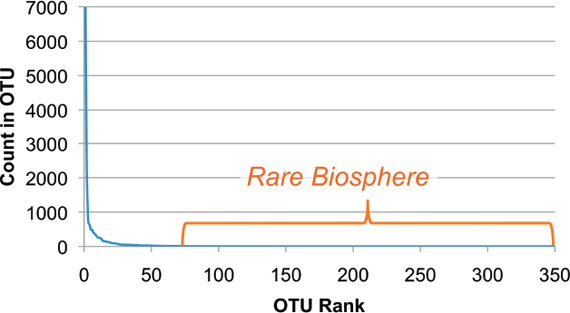
taxonomic-independent sequence clustering methods for characterizing microbial communities. By assuming that very similar sequences represent closely related organisms, and that more divergent sequences represent more distantly related organisms, the sequences can be clustered into groups of similar organisms, each cluster or “operational taxonomic unit” (OTU) presumed to represent a phylotype (Schloss and Handelsman, 2005). The width of the clustering, meaning the percent identity threshold for sequence tags to be placed in the same OTU, represents the similarity of the microbes in each OTU.
A critical element in taxonomy-independent analyses of diversity is sequencing error. Random errors can be tolerated in an assembly project where the goal is a consensus sequence. In OTU clustering, however, each read is assumed to represent an individual organism, and if a read has sufficient errors, then it will not cluster with its template, instead forming a new, spurious OTU. Thus, if not filtered out or unaccounted for, sequencing error can lead to inflation in the number of OTUs attributed to a community.
To address the issue of sequence quality, several authors developed quality filtering (Huse et al., 2007) and data de-noising (Quince et al., 2009) techniques for processing raw 454 sequencing reads to reduce sequencing errors and thereby reduce OTU inflation. In 2009, in a paper titled Wrinkles in the Rare Biosphere, Kunin et al. (2010) highlighted the impact of error rates on OTU analyses by sequencing a single strain of E. coli and generating more than 600 OTUs. Reeder and Knight followed this with a “News and Views” piece: The ‘rare biosphere’: A reality check (Reeder and Knight, 2009). The combination of these two publications spotlighted the very real concerns about the impact of sequencing error on microbial community diversity estimates. They posed a critical question: Is the rare biosphere real or simply an artifact of sequencing errors?
Even with very high-quality sequencing and stringent quality filtering, the depth of sampling afforded by NGS technology leads to more absolute OTU inflation than the earlier Sanger sequencing. This is for two reasons: First, when processing data from sequencing hundreds to thousands of Sanger capillary reads, individual chromatograms are often read by hand and confirmed by forward and reverse reads resulting in very high-quality sequence assemblies. While it is in principle possible to develop a similar skill reading 454 flowgrams, it is not conceivable to hand-edit hundreds of thousands of reads. In this regard it is worth noting that the generally accepted error rate in automated high-throughput capillary sequencing is 1 percent (i.e., an average Phred score of 20). The second reason is that the sheer number of reads produced by NGS will result in more spurious OTUs even if the error rate is much lower. Most OTU clustering methods are based only on the percent identity between sequences. If a read has sufficient errors that the difference between it and its template is greater than the clustering threshold, the clustering algorithm will place it in a new OTU. If a sequencing error rate leads to 1 read per thousand that fails to cluster with its template, a traditional clone library Sanger project with 1,000 reads will have, on average,
one spurious OTU. With NGS, with the same error rate, a data set of 100,000 reads will have, on average, 100 spurious OTUs. In practice, quality-controlled NGS reads tend to have a lower overall error rate (Schloss et al., 2011) than automated ABI capillary sequencing. So while, the relative rate of OTU inflation per read may have dropped with NGS, the absolute number of spurious OTUs has increased considerably because of dramatically increased depths of sequencing.
As it turns out, though, much of the OTU inflation observed in NGS projects was not due to sequencing errors. Ironing out the Wrinkles in the Rare Biosphere (Huse et al., 2010) demonstrated that the most commonly used method for OTU generation dramatically compounded the problem of sequencing error. Following on the Kunin technique, Huse et al. clustered DNA amplified from a single E. coli gene, and using only sequences with an error rate below the clustering threshold, showed that switching from a single multiple sequence (MS) alignment to multiple pairwise (PW) alignments, and from complete linkage (CL) clustering to average linkage (AL) clustering reduced the OTU inflation from 599 OTUs to 24. They introduced a single-linkage preclustering (SLP) to smooth errors prior to clustering. Using SLP-PWAL for clustering brought the OTU count to 1.
The effect of reads with more errors than the clustering threshold still needs to be taken into consideration. With established, simple sequence quality filtering, SLP clustering of reads generated on the Roche Genome Sequencer FLX platform from amplicons of the V6 SSU rRNA hypervariable region, errant reads produce spurious singleton OTUs at a rate of ~1 spurious OTU per 1,000 reads. When applied to analysis of control communities of limited diversity this rate can sound alarming. Processing 50,000 reads of a control community with 40 known members would generate 40 + 50,000/1,000 = 90 OTUs. However it is important to recognize that the number of spurious OTUs produced scales with the sequencing depth, not the complexity of the community. If a biological community sampled to a depth of 50,000 reads were to have 1,000 observed OTUs, then 50 of these would be due to sequencing error. As shown in Table A6-1, algorithm choice has a much greater effect on OTU inflation than sequencing error.
As NGS technologies produce longer reads (> 500 nt with Roche/454 and 300 nt with the Illumina MiSeq at the time of writing) the same error rate results in fewer errant reads generating new OTUs, because more errors per read are required for a sequence to fail to cluster with its template. Instead, a second type of error becomes of increasing importance: chimeric sequences from two or more templates during amplification. Chimeras are generated when a template is incompletely replicated during the elongation step of PCR. This truncated sequence can hybridize to other targets in subsequent PCR cycles and act as a primer, generating a single sequence from multiple templates. The frequency of chimeras scales with SSU rRNA amplicon length (Huber et al., 2009). The amplification of sample DNA is largely independent of sequencing platform (though the effect of platform-specific primer adapters has not been thoroughly explored) and several modifications of standard PCR result in reduced chimera formation (Acinas et al., 2004; Lahr and Katz, 2009; Qiu et al., 2001). However, chimeras remain
TABLE A6-1 OTU Inflation Due to Clustering Algorithm and Sequencing Error
| Sample | Number of Reads | MS-CL OTUs | SLP-PWAL OTUs | Estimated Spurious OTUs | Estimated Sequencing Inflation | Estimated Algorithm Inflation |
| Deep-sea vent Archaea | 63,133 | 709 | 470 | 63 | 15% | 59% |
| English Channel | 12,851 | 1,154 | 859 | 13 | 1.5% | 35% |
| Human gut | 15,239 | 803 | 566 | 15 | 2.7% | 43% |
| Sewage | 33,082 | 2,383 | 1,831 | 33 | 1.8% | 31% |
| North Atlantic deep water | 15,497 | 1,713 | 1,339 | 15 | 1.1% | 28% |
NOTE: OTUs found using multiple sequence alignment + complete linkage (MS-CL) and single linkage preclustering followed by pairwise average linkage (SLP-PWAL) in four example V6 data sets sequenced using a 454 GSFLX. The number of spurious SLP-PWAL OTUs is estimated to be 1 for every 1,000 sequence reads. The number of true OTUs is estimated to be the number of SLP-PWAL OTUs minus the estimated spurious OTUs. The estimated sequencing inflation is the ratio of estimated spurious OTUs to the number of estimated true OTUs. The estimated algorithm inflation is the ratio of the number of OTUs generated using MS-CL minus the number of spurious OTUs due to sequencing to the number of estimated true OTUs.
SOURCE: Adapted from Table 1 in Huse et al. (2010).
in most heterogeneous amplicon pools. Several methods have been developed for identifying and removing chimeric reads. Haas et al. (2011) developed Chimera Slayer to remove chimeras by comparing each sequence read against a curated database of non-chimeric, SSU rRNA genes. Quince et al. (2011) and Edgar et al. (2011) have developed chimera checkers (Perseus and UChime, respectively) using reference comparison, but optimized for shorter NGS reads. UChime also performs a de novo check by comparing triplets of reads in a data set to see if any reads appear to be a combination of two other reads from the same amplicon pool. Because chimeras have large sections of sequence substitutions, we can conservatively presume that each unique chimera will likely create a new OTU during clustering. Chimera checking, therefore, is just as important for improving OTU richness estimates as basic sequence quality filtering.
Sequencing and Clustering Best Practices
DNA Amplification
Given the known limitations of both NGS technologies and of clustering methods, it is particularly important to exercise best practices in both generation and use of NGS data. The first way to reduce the impact of sequencing errors on microbial ecology investigations is to reduce the rates of base incorporation errors and chimera formation in the DNA amplification step. This includes the use
of a high-fidelity polymerase such as Platinum Taq, reducing contaminants that interfere with polymerase processivity or proofreading, minimizing the number of PCR cycles, and optimizing the amount of input DNA (Acinas et al., 2004; Lahr and Katz, 2009; Qiu et al., 2001). Technical replicates of the amplification step facilitate discrimination of novel sequences from high-frequency errors or chimeras.
Quality Filtering
Several authors have provided extensive analyses of quality filtering methods for both 454 and Illumina sequencing technologies (Huse et al., 2007; Meacham et al., 2011; Minoche et al., 2011; Quince et al., 2011; Schloss et al., 2011). In brief, removing reads with ambiguous bases (Ns), with low-quality scores, that are truncated, and that have known mismatches in the primer region are computationally simple means of decreasing the error rate several-fold. More computationally intensive algorithms such as AmpliconNoise (Quince et al., 2011) (implemented either directly or as implemented in QIIME [Caporaso et al., 2010] or mothur [Schloss et al., 2009]) can be used as the first step for quality filtering pyrosequencing data. Illumina paired-end technology allows another, more traditional approach to quality filtering: each amplicon is sequenced in both directions, so if the amplicon length is less than twice the read length, overlap of the complementary sequences can be used to assess accuracy (Bartram et al., 2011; Gloor et al., 2010). If the two reads overlap completely, meaning the amplicon length is less than or equal to the read length, requiring no mismatches could lead to data sets with little or no sequencing error, although systematic errors that are the same in both directions, could still exist.
Sequence quality filtering should be followed by chimera checking. Using a reference database for chimera detection is the standard method for identifying and removing chimeras and is very effective. Unfortunately, sequencing of novel environments is fast outstripping curated database growth, and novel genes that are parents of chimeras will be missed by reference comparison methods. A combination of both reference comparison and de novo chimera checking should always be used.
Smoothing Imperfect Data by Aggregation
Even with the best quality filtering and chimera checking, sequencing data will still contain reads with base incorporation and base calling errors, chimeric reads, reads from contaminating DNA, and reads from amplification of non-target areas of sample DNA. The methods chosen for downstream analysis of the data will determine the degree of impact these errors will have on research results.
Assigning reads to their closest match in a database of sequences annotated with defined taxonomy is a simple, straightforward way to minimize the impact of small sequence differences, segregate chimeras, identify contaminants, and
eliminate reads from non-target amplification. For instance, many of the reference SSU rRNA databases provide taxonomy primarily to the genus level. While this may not be sufficient resolution for some analyses, the use of genus-level taxonomy for analysis will assign similar sequences to the same genus, so that sequences with even a moderate number of errors are likely to still be classified together with their template. Chimeras of sequences within the same genus will remain in that genus, and chimeras of sequences from different genera within a family will tend to not be classified at the genus level; these cross-genera chimeras will aggregate as sequences classified to the family level but no further. The presence of unexpected genera, such as Ralstonia in deep-sea sediment samples, can indicate contamination.
Routinely assigning taxonomy to all sequence reads has the additional advantage of quickly identifying non-target reads. Occasionally, the SSU rRNA primers can amplify DNA from a section of the genome other than the SSU rRNA gene. The resulting amplicons will be quite divergent from any 16S reference gene. Finally, PCR primers designed to be specific for domains or other groups often amplify the rRNA SSU gene from a subset of species outside that group, generally in a non-quantitative manner. Reads that map to taxa outside the group to which the primers were designed can easily be eliminated from downstream analyses.
The other common way to aggregate similar sequences is to cluster them into OTUs based on percent similarity, as described previously. This is often done after assigning taxonomy to reads so that reads from non-template amplicons or from taxonomic groups outside the target range of the primers can be eliminated. Clustering reads based on a similarity score of 97 percent has become a common way of approximating “species” or phylotype in the absence of taxonomic resolution. However, it is important to note that different algorithms create very different 97 percent OTUs, and some of these methods lead to OTU inflation, as discussed previously. Among those that do not inflate OTU counts are SLP-PWAL clustering, which uses a nearest-neighbor approach to link sequences likely to be derived from base incorporation error with average neighbor linkage to form OTUs, and methods known as greedy clustering algorithms. One of the more popular of these is UClust (Edgar, 2010). Briefly, the UClust ranks sequences in order of abundance and seeds the first OTU with the most abundant sequence. The next sequence is compared to the first, and if it is within the clustering threshold then it is added to the OTU, if not then it becomes the seed of a second OTU. Each sequence is compared to the OTU seeds, in order, until all reads have been assigned to an existing OTU or used to create a new OTU.
Diversity in an Imperfect World
Ecologists measure the diversity of a microbial community in a variety of ways. Richness is the number of different members (OTUs, species, genera, phylotypes, etc.) in a community. Evenness describes the distribution of relative
abundances of the members, whether they have similar abundances or are skewed with some highly abundant and others rare. A community’s diversity combines richness and evenness (although richness is often called diversity as well). The richness of a single community is often referred to as alpha diversity. The degree of similarity or difference between two or more communities in richness or evenness is beta diversity. One important conceptual difference between these two measures is that alpha diversity is nearly always used to designate an estimate of the true richness of the community from which a data sample was taken, while beta diversity is generally a metric describing the similarity between the observed richness or evenness of two samples (though there are methods for estimating community similarity from sample data [Chao, 2004], they are rarely used in molecular microbial ecology).
Algorithms used to calculate diversity differ in the stability of their results in the presence of residual sequencing errors and chimeras (as reflected in OTU inflation) and in the depth of sampling. Estimates of sample richness (alpha diversity) are particularly susceptible to the impacts of both. Rarefaction curves, while not true estimators of alpha diversity, are often used to illustrate the relationship between the observed number of community members (i.e., OTUs) and sampling depth. The number of OTUs observed for a range of subsampling sizes are plotted against the average number of OTUs observed for each subsample size, describing the number of new members discovered for an incremental increase in sampling effort. With very small subsamples, small increases in sampling depth lead to the discovery of many new members. As sampling depth increases, the number of new members found decreases and begins to asymptote as the sampling depth provides a more complete picture of the underlying community. If OTUs are created using a clustering method that inflates with sampling depth, the rarefaction curves cannot reach an asymptote and instead will increase linearly as a direct function of sampling depth. Superimposing multiple rarefaction curves from complete-linkage OTUs demonstrates the dependence of the slope of the rarefaction curve on the sample depth (Figure A6-2, Panel A). Rarefaction curves based on depth-independent OTUs (e.g., SLP-PWAL or UClust) have essentially identical slopes for sample depths ranging over two orders of magnitude (Figure A6-2, Panel B).
Some nonparametric methods of estimating alpha diversity remain sensitive to sampling depth independent of OTU inflation or other forms of error. Two of the most common estimators, ACE (Chao and Lee, 1992) and Chao1 (Chao, 1984), are well known to underestimate richness when used for populations where many of the members are “unseen” in the sample, and are more accurately considered lower bounds rather than true estimates. In other words, they do not perform well when a community is drastically undersampled, as is the case for most samples of microbial communities. Panel A of Figure A6-3 illustrates the impact of both sampling depth and clustering method on the estimated richness for a human gut microbiome sample. With increasing depth, the sample more
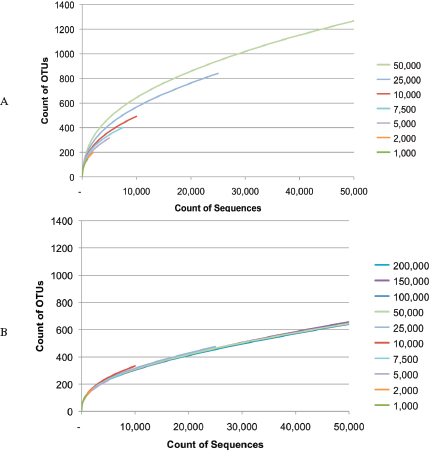
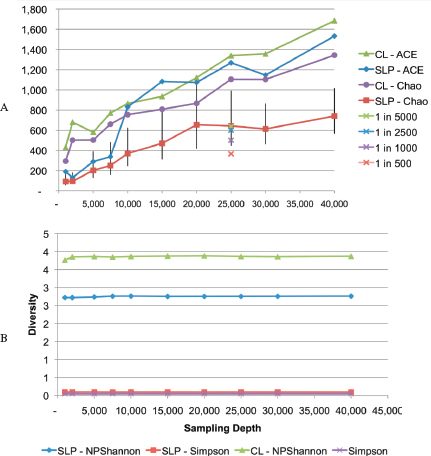
adequately reflects the underlying community, and the richness estimate can stabilize. In this example, Chao1 estimates rise rapidly with sampling depth from 1,000 to 20,000, but then the estimates level. Doubling the sample depth from 20,000 to 40,000 does not change the estimated richness beyond the error bars. Plots of richness against subsample depth may serve as a reality check on the stability (if not accuracy) of calculated richness for a given sample. Parametric estimators such as CatchAll (Bunge, 2011) are less sensitive to sample size and undersampling and also make use of a wider range of OTU sizes in extrapolating total richness.
Even with depth-independent OTU clustering methods, community richness estimates can be vulnerable to OTU inflation. Most algorithms for estimating richness heavily weight the number of OTUs with one or two reads (singleton and doubleton OTUs). We can assume that most spurious OTUs are singletons (this will not always be the case, for instance early-round chimeras can be amplified in a sample, but it is a conservative assumption). By removing the estimated number of spurious OTUs (e.g., 1 in 1,000) from the count of singletons in the species abundance data used to calculate richness, we can compensate for OTU inflation in estimating alpha diversity. We do not need to know which of our OTUs are spurious and which are true; we only need an estimated number. Panel A of Figure A6-3 shows the impact of several OTU inflation rates on richness estimates for a subsample of 25,000.
At any sampling depth, microbial communities consistently display a long-tail distribution, and therefore evenness will be low at all sampling depths. Both Simpson’s and Shannon’s diversity estimates show very little direct susceptibility to the sampling depth (Figure A6-3, Panel B), but they are still affected by the OTU clustering method. Clearly, choosing a clustering algorithm that minimizes OTU inflation and that is stable to sample size is critical at all times.
The list of beta diversity metrics that compare the degree of similarity or difference between two communities is very long. We highlight the importance of using metrics that are robust to both differences in sampling depth and under-sampling using three distance metrics: Jaccard presence/absence, Bray-Curtis, and Morisita-Horn. Results using the Yue-Clayton distance were consistently similar to Morisita-Horn (results not shown). We subsampled a large data set to provide pseudo-replicates that we expect to be similar. If we compare a subsample with itself, then the distance by any metric will be zero (or 1), and the expectation is that a comparison of two different random subsamples should give a very similar value. In Figure A6-4, Panel A, we take multiple subsamples of 5,000 reads from a sample of 50,000 reads and calculate the beta diversity of pairs of replicates. Although we would like the distances to approach zero, we know that microbial diversity is so great that there will still be differences between the replicates due to incomplete sampling. Morisita-Horn, Bray-Curtis, and Yue-Clayton (not shown) all return distances of about 5 percent or less. The Jaccard presence/absence metric, on the other hand, returns a community distance of 50-60 percent.
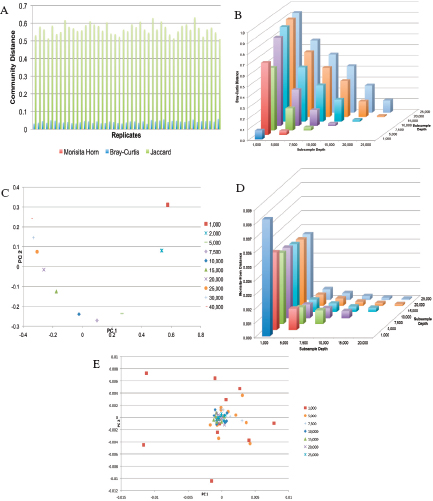
FIGURE A6-4 Panel A, Selecting multiple random subsamples of 5,000 reads from a larger data set of 50,000 reads, we created a set of pseudo-replicate samples. Because they all represent the same larger sample, the pairwise distances should be very small. The use of Jaccard presence/absence is highly affected by the membership within the rare biosphere. Bray-Curtis includes abundance and returns much smaller values. Morisita-Horn was specifically designed for smaller samples and to adjust for different sample sizes and returns values approaching zero. Panel B, Bray-Curtis uses absolute counts, rather than relative abundances, and displays increasing community distance values with increasing differences in sampling depth. Panel C, Even when considering only the Bray-Curtis distance between samples of the same depth, the values returned are still affected
The test of presence or absence in a community, where fewer members have been detected than not, will always show large differences between the communities. The small number of abundant members will be consistent across replicates, but rare members detected in any given replicate will vary. It is not surprising that upwards of half the members of a replicate pair can be different.
In the case of similar subsample size, both Bray-Curtis and Morisita-Horn returned suitably low beta diversity values. Unfortunately, NGS data sets vary greatly in the number of reads depending on the amount of the amplicon library loaded on the sequencer and the quality of the particular sequencing run. Bray-Curtis and Morisita-Horn compare not only which members are present, but also the abundance of each. To adjust for undersampling, Morisita-Horn emphasizes the abundant members, assuming that if a member is abundant in one sample and not detected in the other sample, then this reflects a true difference in the communities, while if a rare member is detected in one and not the other, this may be an artifact of undersampling. Bray-Curtis includes but does not differentially weight the abundance information.
In Panels B through E in Figure A6-4, we illustrate the effect of different sample sizes on beta diversity values. Bray-Curtis returns small diversity values for subsamples of the same size and increasingly larger values when comparing samples of different sizes; the average distance between subsamples of 1,000 and 25,000 is about 90 percent (Figure A6-4, Panel B). This disparity comes in part because the Bray-Curtis method uses absolute rather than relative abundance. Even if data are subsampled to the same depth, Bray-Curtis can still cause misinterpretations of results when combined with one of the most common visualization tools for illustrating community similarity, principal coordinate analysis (PCoA). Panel C of Figure A6-4, shows that Bray-Curtis measures of subsample similarity pairs subsamples based on read depth, even though they are subsamples from the very same community. Even though the absolute distances were low for pairs from the same subsampling depth, a PCoA plot does not report absolute differences but scales according to the set of distances used. For subtle changes in
_______________________
by the sampling depth. In a classic principal coordinate analysis plot, commonly used in microbial community studies, the clustering is affected by the sampling depth used. Panel D, The Morisita-Horn metric, which uses relative abundances and places more emphasis on the more abundant community members, is not appreciably affected by comparing samples of different sizes. The larger distances consistently reported for samples of 1,000 reads likely reflects the lower bound of sample depth required to be representative for this data set. Even so, the values returned are below 1 percent. Panel E, The distance values returned by Morisita-Horn cluster together for samples with more than 7,500 reads. The increasing spread of points for sampling depths less than 7,500 presumably reflects the lower bound of representative sampling for this data set, rather than an inherent limitation of the Morisita-Horn metric.
the community, a method such as Bray-Curtis could lead to erroneous interpretations of community shifts.
Morisita-Horn effectively compensates for sampling depth, returning beta diversity values less than 1 percent for all subsample comparisons (Figure A6-4, Panel D). Interestingly, the Morisita-Horn distances for pairs where one subsample was at 1,000 reads were noticeably higher than the other distances. With increasing depth this divergence disappears. In the PCoA plot, the 1,000 read depth pairs do not cluster either with each other or with any of the other data (Figure A6-4, Panel E). Depth pairs with 5,000 are still divergent but much less so than 1,000. In this particular data set, it appears that a minimum sampling depth of 10,000 is necessary to adequately reflect the community in the subsample.
Continued Evidence for the Rare Biosphere
In evaluating both the extent of the rare biosphere and our ability to meaningfully sample it, it is helpful to put the word “rare” into perspective. Estimates vary, but let us assume that there are at least 1×10¹¹ bacterial cells in a single gram dry weight of human stool (Franks et al., 1998). If we sequence DNA from a single gram of stool and analyze a relatively large data set of 50,000 (5×10⁴) reads, we are sampling a tiny fraction of the census population. An OTU found as a singleton may be present at a frequency of only 1/50,000, but that is 2×10⁶ cells/g, which may not be an insignificant number.
But is the long-tail distribution, while consistent across bacterial communities sampled from human and other hosts, marine, freshwater, soil, sand, leaves, sewage, and any number of other environments, merely an artifact of the known phenomenon of OTU inflation caused by deep sequencing? Returning to the empirically derived estimate of 1 spurious OTU per 1,000 reads, we can remove a fraction of singleton OTUs equal to those attributed to OTU inflation (Figure A6-5, Panel A). What we see is that even if we remove 1 out of every 500 singleton OTUs, the distribution retains its characteristic shape, because the fraction of singletons removed compared to the number observed is relatively small. Any spurious OTUs are simply extending the end of the tail incrementally; they are not fundamentally altering the shape of the species abundance curve.
Everything May or May Not Be Everywhere, but Everything Is Rare Somewhere
One of the stronger pieces of evidence supporting the existence of the rare biosphere comes from comparing the sequences found in different microbial communities. The human gut microbiome, for example, varies greatly between subjects. In practice, this leads to a wide range of relative abundances of even the most common OTUs. Panels B and C in Figures A6-5 show the 100 most abundant OTUs across 208 Human Microbiome Project subjects in rank order (Huse et al., 2012). The maximum abundance in a single subject for each OTU is
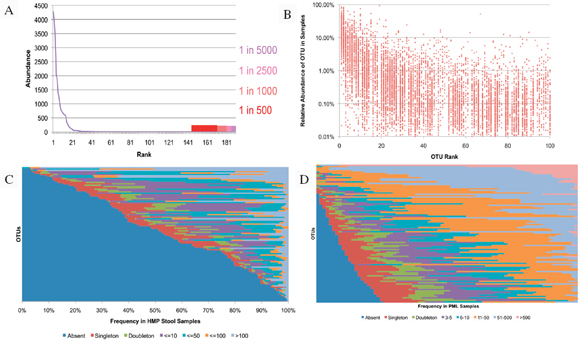
FIGURE A6-5 Panel A, The rank abundance curve shows only minor reductions in the long tail even assuming that as many as 1 in 500 reads generates a spurious OTU. Panel B, The relative abundance of the 100 most abundant OTUs in the Human Microbiome Project stool samples. Each dot represents a separate subject. Even the most abundant OTUs that dominant some samples, are also rare in other samples, indicating that an OTU that is rare in an individual is not necessarily either spurious or consistently rare. Low abundance taxa should not be dismissed based on only a few samples. Panel C, The same stool samples as plotted in Panel D, but here with absolute abundance in a sample. The blue expanse on the left represents the percentage of samples that do not contain the OTU. Even OTUs that are more absent across samples than present appear consistently in multiple samples with an abundance greater than 100. Panel D, An another example of the abundance graph in Panel C, with data from aquatic samples of the English Channel. Here the intersample variation is much lower.
1-100 percent (Figure A6-5, Panel B). The minimum abundance for each of these (except the first most abundant OTU) is within the rare biosphere for at least one subject. In other words, essentially all of the most abundant gut OTUs are highly abundant in some subjects and rare or not detected in others. Panel C of Figure A6-5 uses absolute rather than relative abundance and frequencies to portray the same data. Looking only at a single subject, we might be tempted to discount rare OTUs as noise in the data rather than a true rare biosphere signal. In the greater context of many samples, however, we realize that true rare members are prevalent across subjects, and these same members can dominate the microbiome in other subjects. This same pattern can be seen in other environments including the waters of the English Channel (Gilbert et al., 2009) (Figure A6-5, Panel D).
Conclusions
The use of NGS methods has revolutionized microbial ecology. But, as with any new technology, new challenges must be met. For accurate results, great care must be taken to reduce the rates of sequencing errors and to remove DNA amplification chimeras, using high-quality de-noising or paired-end overlap filtering, and chimera detection. These initial steps, however, are not enough. Researchers must also select bioinformatics tools that avoid artificially inflating the number of OTU clusters, alpha diversity estimates, and beta diversity estimates. OTU clustering methods such as SLP-PWAL and UClust reduce inflation, whereas methods employing multiple sequence alignments and complete linkage clustering overestimate the appropriate number of OTUs.
The selection of diversity metrics affects the research results. Simple richness estimates are sample size dependent. Because the most common estimators are known to be affected by undersampling, larger sample sizes (in the absence of depth-dependent OTU inflation) may provide the most accurate richness estimates. One means to enhance the interpretation of richness estimates is to plot the richness at subsample depths for a given sample to see whether the sample depth is sufficient for the estimate to be stable or whether the sample depth is still within the zone of distinct depth-dependence. Fortuitously, both Simpson’s and Shannon’s diversity estimates show independence of sample depth.
Beta diversity should only be calculated with an appropriately robust metric that can accommodate sample depth. Even in cases where multiple samples are subsampled to the same depth before calculating intercommunity distance, the use of a depth-dependent metric such as Bray-Curtis will still be affected by depth and can in cases of more subtle shifts in community structure skew PCoA plots, resulting in possible misinterpretation of results. The practice of subsampling to the minimum can introduce artifacts of undersampling as demonstrated in Figure A6-5. A much more robust method is to select a beta diversity algorithm such as Morisita-Horn or Yue-Clayton that does not require subsampling. For all alpha and beta diversity calculations there are thresholds of undersampling
that no metric selection can overcome. Therefore, in the absence of other depth-dependent overestimates (such as poor selection of clustering method), it is best to use full sample sizes rather than subselecting to a minimal and therefore less representative sample size.
Even in the best of all research worlds, errors, OTU inflation, chimeras, contamination, and other inaccuracies will still exist. In this light, the use of multiple samples for determining when low abundance “errare” OTUs or taxa are errors and when they are true rare members is necessary. One straightforward means for deciding to trust the validity is if an OTU occurs abundantly in any sample. By clustering OTUs or using taxonomy and performing bioinformatics analyses across multiple samples at once, it is easy to detect abundant members in the set of samples, validating those members in communities where they are rare. Given our current techniques, context is the best method for discerning truth from fiction in the rare biosphere.
References
Acinas, S. G., V. Klepac-Ceraj, D. E. Hunt, C. Pharino, I. Ceraj, D. L. Distel, and M. F. Polz. 2004. Fine-scale phylogenetic architecture of a complex bacterial community. Nature 430:551-554.
Bartram, A. K., M. D. J. Lynch, J. C. Stearns, G. Moreno-Hagelsieb, and J. D. Neufeld. 2011. Generation of multimillion-sequence 16s rRNA gene libraries from complex microbial communities by assembling paired-end illumina reads. Applied and Environmental Microbiology 77(11):3846-3852.
Bunge, J., 2011. Estimating the number of species with CatchAll. Proceedings of the 2011 Pacific Symposium on Biocomputing.
Caporaso, J. G., J. Kuczynski, J. Stombaugh, K. Bittinger, F. D. Bushman, E. K. Costello, N. Fierer, A. G. Pena, J. K. Goodrich, J. I. Gordon, G. A. Huttley, S. T. Kelley, D. Knights, J. E. Koenig, R. E. Ley, C. A. Lozupone, D. McDonald, B. D. Muegge, M. Pirrung, J. Reeder, J. R. Sevinsky, P. J. Turnbaugh, W. A. Walters, J. Widmann, T. Yatsunenko, J. Zaneveld, and R. Knight. 2010. QIIME allows analysis of high-throughput community sequencing data. Nature Methods 7(5):335-336.
Chao, A. 1984. Nonparametric estimation of the number of classes in a population. Scandinavian Journal of Statistics 11:265-270.
Chao, A., and S.-M. Lee. 1992. Estimating the number of classes via sample coverage. Journal of the American Statistical Association 87(417):210-217.
DeSantis, T. Z., P. Hugenholtz, N. Larsen, M. Rojas, E. L. Brodie, K. Keller, T. Huber, D. Dalevi, P. Hu, and G. L. Andersen. 2006. Greengenes, a chimera-checked 16s rRNA gene database and workbench compatible with ARB. Applied and Enviromental. Microbiology 72(7):5069-5072.
Edgar, R. C. 2010. Search and clustering orders of magnitude faster than BLAST. Bioinformatics 26(19):2460-2461.
Edgar, R. C., B. J. Haas, J. C. Clemente, C. Quince, and R. Knight. 2011. Uchime improves sensitivity and speed of chimera detection. Bioinformatics 27(16):2194-2200.
Franks, A. H., H. J. M. Harmsen, G. C. Raangs, G. J. Jansen, F. Schut, and G. W. Welling. 1998. Variations of bacterial populations in human feces measured by fluorescent in situ hybridization with group-specific 16s rRNA-targeted oligonucleotide probes. Applied and Environmental Microbiology 64(9):3336-3345.
Gilbert, J. A., F. Dawn, S. Paul, N. Lindsay, O. Anna, S. Tim, J. S. Paul, H. Sue, and J. Ian. 2009. The seasonal structure of microbial communities in the western English Channel. Environmental Microbiology 11(12):3132-3139.
Gloor, G. B., R. Hummelen, J. M. Macklaim, R. J. Dickson, A. D. Fernandes, R. MacPhee, and G. Reid. 2010. Microbiome profiling by illumina sequencing of combinatorial sequence-tagged PCR products. PLoS ONE 5(10):e15406.
Haas, B. J., D. Gevers, A. M. Earl, M. Feldgarden, D. V. Ward, G. Giannoukos, D. Ciulla, D. Tabbaa, S. K. Highlander, E. Sodergren, B. Methé, T. Z. DeSantis, C. The Human Microbiome, J. F. Petrosino, R. Knight, and B. W. Birren. 2011. Chimeric 16s rRNA sequence formation and detection in Sanger and 454-pyrosequenced PCR amplicons. Genome Research 21(3):494-504.
Huber, J. A., H. G. Morrison, S. M. Huse, P. R. Neal, M. L. Sogin, and D. B. Mark Welch. 2009. Effect of PCR amplicon size on assessments of clone library microbial diversity and community structure. Environmental Microbiology 11(5):1292-1302.
Huse, S., J. Huber, H. Morrison, M. Sogin, and D. Mark Welch. 2007. Accuracy and quality of massively parallel DNA pyrosequencing. Genome Biology 8(7):R143.
Huse, S. M., D. Mark Welch, H. G. Morrison, and M. L. Sogin. 2010. Ironing out the wrinkles in the rare biosphere through improved OTU clustering. Environmental Microbiology 12(7):1889-1898.
Huse, S. M., Y. Ye, Y. Zhou, and A. A. Fodor. 2012. A core human microbiome as viewed through 16s rRNA sequence clusters. PLoS ONE 7(6):e34242. doi:10.1371/journal.pone.0034242.
Kunin, V., A. Engelbrektson, H. Ochman, and P. Hugenholtz. 2010. Wrinkles in the rare biosphere: Pyrosequencing errors lead to artificial inflation of diversity estimates. Environmental Microbiology 12(1):118-123.
Lahr, D. J. G., and L. A. Katz. 2009. Reducing the impact of PCR-mediated recombination in molecular evolution and environmental studies using a new-generation high-fidelity DNA polymerase. BioTechniques 47:857-866.
Meacham, F., D. Boffelli, J. Dhahbi, D. Martin, M. Singer, and L. Pachter. 2011. Identification and correction of systematic error in high-throughput sequence data. BMC Bioinformatics 12(1):451.
Minoche, A., J. Dohm, and H. Himmelbauer. 2011. Evaluation of genomic high-throughput sequencing data generated on Illumina HiSeq and genome analyzer systems. Genome Biology 12(11):R112.
Pruesse, E., C. Quast, K. Knittel, B. M. Fuchs, W. Ludwig, J. Peplies, and F. O. Glockner. 2007. Silva: A comprehensive online resource for quality checked and aligned ribosomal RNA sequence data compatible with ARB. Nucleic Acids Research 35(21):7188-7196.
Qiu, X., L. Wu, H. Huang, P. E. McDonel, A. V. Palumbo, J. M. Tiedje, and J. Zhou. 2001. Evaluation of PCR-generated chimeras, mutations, and heteroduplexes with 16s rRNA gene-based cloning Applied and Environmental Microbiology 67:880-887.
Quince, C., A. Lanzen, T. P. Curtis, R. J. Davenport, N. Hall, I. M. Head, L. F. Read, and W. T. Sloan. 2009. Noise and the accurate determination of microbial diversity from 454 pyrosequencing data. Nature Methods 6(9):639-641.
Quince, C., A. Lanzen, R. Davenport, and P. Turnbaugh. 2011. Removing noise from pyrosequenced amplicons. BMC Bioinformatics 12(1):38.
Reeder, J., and R. Knight. 2009. The “rare biosphere”: A reality check. Nature Methods 6(9):636-637.
Schloss, P. D., D. Gevers, and S. L. Westcott. 2011. Reducing the effects of PCR amplification and sequencing artifacts on 16s rRNA-based studies. PLoS ONE 6(12):e27310.
Schloss, P. D., and J. Handelsman. 2005. Introducing DOTUR, a computer program for defining operational taxonomic units and estimating species richness. Applied and Environmental Microbiology 71(3):1501-1506.
Schloss, P. D., S. L. Westcott, T. Ryabin, J. R. Hall, M. Hartmann, E. B. Hollister, R. A. Lesniewski, B. B. Oakley, D. H. Parks, C. J. Robinson, J. W. Sahl, B. Stres, G. G. Thallinger, D. J. Van Horn, and C. F. Weber. 2009. Introducing mothur: Open source, platform-independent, community-supported software for describing and comparing microbial communities. Applied and Environmental Microbiology 75(23):7537-7541.
Sogin, M. L., H. G. Morrison, J. A. Huber, D. Mark Welch, S. M. Huse, P. R. Neal, J. M. Arrieta, and G. J. Herndl. 2006. Microbial diversity in the deep sea and the underexplored “rare biosphere.” Proceedings of the National Academy of Sciences 103(32):12115-12120.
Wang, Q., G. M. Garrity, J. M. Tiedje, and J. R. Cole. 2007. A naive Bayesian classifier for rapid assignment of rRNA sequences into the new bacterial taxonomy. Applied and Environmental Microbiology, 73(16):5261-5267.
PHYLOGEOGRAPHY AND MOLECULAR EPIDEMIOLOGY
OF YERSINIA PESTIS IN MADAGASCAR23
Amy J. Vogler,24Fabien Chan,25David M. Wagner,24
Philippe Roumagnac,26,¤aJudy Lee,24Roxanne Nera,24
Mark Eppinger,27Jacques Ravel,26Lila Rahalison,24,¤b
Bruno W. Rasoamanana,24,¤cStephen M. Beckstrom-Sternberg,24,28
Mark Achtman,24,29Suzanne Chanteau,24,¤dand Paul Keim24,27,*
Abstract
Background Plague was introduced to Madagascar in 1898 and continues to be a significant human health problem. It exists mainly in the central highlands, but
_______________________
23 Reprinted from PLoS Neglected Tropical Diseases. Originally published as: Vogler AJ, Chan F, Wagner DM, Roumagnac P, Lee J, et al. (2011) Phylogeography and Molecular Epidemiology of Yersinia pestis in Madagascar. PLoS Negl Trop Dis 5(9): e1319. doi:10.1371/journal.pntd.0001319
Editor: Mathieu Picardeau, Institut Pasteur, France.
24 Center for Microbial Genetics and Genomics, Northern Arizona University, Flagstaff, Arizona, USA.
25 Institut Pasteur de Madagascar, Antananarivo, Madagascar.
26 Max Planck Institut für Infektionsbiologie, Berlin, Germany.
27 Institute for Genomic Sciences (IGS), School of Medicine, University of Maryland, Baltimore, Maryland, USA.
28 Translational Genomics Research Institute, Phoenix, Arizona, United States of America.
29 Environmental Research Institute, University College Cork, Cork, Ireland.
Copyright: © 2011 Vogler et al. This is an open-access article distributed under the terms of the Creative Commons Attribution License, which permits unrestricted use, distribution, and reproduction in any medium, provided the original author and source are credited.
Competing Interests: The authors have declared that no competing interests exist.
* E-mail: Paul.Keim@nau.edu
¤a Current address: Unite Mixte de Recherche 6191, Centre National de la Recherche Scientifique-Commissariat à l’Energie Atomique-Aix-Marseille Université, Commissariat à l’Energie Atomique Cadarache, Saint Paul Lez Durance, France.
¤b Current address: Centers for Disease Control and Prevention, Atlanta, Georgia, USA.
¤c Current address: Laboratoire de Biologie Médicale du Tampon, Le Tampon, Reunion Island, France.
¤d Current address: Institut Pasteur de Nouvelle-Calédonie, Nouméa, New Caledonia.
in the 1990s it was reintroduced to the port city of Mahajanga, where it caused extensive human outbreaks. Despite its prevalence, the phylogeography and molecular epidemiology of Y. pestis in Madagascar has been difficult to study due to the great genetic similarity among isolates. We examine island-wide geographic-genetic patterns based upon whole-genome discovery of SNPs, SNP genotyping, and hypervariable variable-number tandem repeat (VNTR) loci to gain insight into the maintenance and spread of Y. pestis in Madagascar.
Methodology and principal findings We analyzed a set of 262 Malagasy isolates using a set of 56 SNPs and a 43-locus multi-locus VNTR analysis (MLVA) system. We then analyzed the geographic distribution of the subclades and identified patterns related to the maintenance and spread of plague in Madagascar. We find relatively high levels of VNTR diversity in addition to several SNP differences. We identify two major groups, Groups I and II, which are subsequently divided into 11 and 4 subclades, respectively. Y. pestis appears to be maintained in several geographically separate subpopulations. There is also evidence for multiple long distance transfers of Y. pestis, likely human mediated. Such transfers have resulted in the reintroduction and establishment of plague in the port city of Mahajanga, where there is evidence for multiple transfers both from and to the central highlands.
Conclusions and Significance The maintenance and spread of Y. pestis in Madagascar is a dynamic and highly active process that
relies on the natural cycle between the primary host, the black rat, and its flea vectors as well as human activity.
Author Summary
Plague, caused by the bacterium Yersinia pestis, has been a problem in Madagascar since it was introduced in 1898. It mainly affects the central highlands, but also has caused several large outbreaks in the port city of Mahajanga, after it was reintroduced there in the 1990s. Despite its prevalence, the genetic diversity and related geographic distribution of different genetic groups of Y. pestis in Madagascar has been difficult to study due to the great genetic similarity among isolates. We subtyped a set of Malagasy isolates and identified two major genetic groups that were subsequently divided into 11 and 4 subgroups, respectively. Y. pestis appears to be maintained in several geographically separate subpopulations. There is also evidence for multiple long distance transfers of Y. pestis, likely human mediated. Such transfers have resulted in the reintroduction and establishment of plague in the port city of Mahajanga where there is evidence for multiple transfers both from and to the central highlands. The maintenance and spread of Y. pestis in Madagascar is a dynamic and highly active process that relies on the natural cycle between the primary host, the black rat, and its flea vectors as well as human activity.
Introduction
Throughout recorded history, Yersinia pestis, etiologic agent of plague, has spread multiple times from foci in central Asia in greatly widening swaths as human-mediated transport became more efficient (Morelli et al., 2010). Plague attained its current global distribution during the current “third” pandemic, which began in 1855 in the Chinese province of Yünnan, when it was introduced to many previously unaffected countries via infected rats on steam ships (Perry and Fetherston, 1997). Plague caused widespread outbreaks during this introduction period (~1900 A.D.), and though disease incidence has since largely decreased, plague remains a significant human health threat due to the severe and often fatal nature of the disease, the many natural plague foci (Perry and Fetherston, 1997), and its potential as a bioterror agent (it is currently classified as a Class A Select Agent [Rotz et al., 2002]). Plague is of particular significance in Madagascar, which has reported some of the highest human plague case numbers (18%–60% of the world total each year between 1995 and 2009) (WHO, 2010) and was the origin of a natural multi-drug resistant strain of Y. pestis (Galimand et al., 1997; Welch et al., 2007).
Plague has been a problem in Madagascar since its introduction during the current pandemic. It was first introduced to Toamasina in 1898 (Brygoo, 1966), likely via India (Morelli et al., 2010), with outbreaks in other coastal cities soon after. In 1921, plague reached the capital, Antananarivo, likely via infected rats transported on the railroad linking Toamasina and Antananarivo. Subsequent rat epizootics signaled the establishment of plague in the central highlands (Brygoo, 1966). Plague then disappeared from the coast and now exists within two large areas in the central and northern highlands above 800 m in elevation (Chanteau et al., 1998). This elevational distribution of plague is linked to the presence of the flea vectors Xenopsylla cheopis and Synopsyllus fonquerniei, which are less abundant and absent, respectively, below 800 m (Duplantier, 2001; Duplantier et al., 1999). Plague has never disappeared from this region, and although it was relatively controlled in the 1950s due to public hygiene improvements and the introduction of antibiotics and insecticides, disease incidence began increasing in 1989 (Chanteau et al., 1998, 2000; Migliani et al., 2006). Human plague cases peaked in 1997 but continue to occur at high frequencies, making Madagascar among the top three countries for human plague cases during the past 15 years (WHO, 2010).
A third, newly emerged plague focus outside the central and northern highlands is the port city of Mahajanga, located ~400 km by air from Antananarivo (Chanteau et al., 1998). Plague first appeared in Mahajanga during an outbreak in 1902. Subsequent outbreaks occurred in 1907 and between 1924 and 1928
(Brygoo, 1966). Plague then disappeared from Mahajanga for a period of 62 years before reappearing during a large outbreak in 1991 (Laventure et al., 1991). Subsequent outbreaks occurred from 1995–1999 (Boisier et al., 1997, 2000; Rasolomaharo et al., 1995). During this time, the Mahajanga focus was responsible for ~30% of the reported human plague cases in Madagascar (Boisier et al., 2002). Interestingly, this focus likely represents one of the only examples of plague being reintroduced to an area where it had gone extinct, rather than emergence from a silently cycling rodent reservoir without telltale human cases (Duplantier et al., 2005).
Molecular subtyping of Y. pestis for epidemiological tracking has been difficult due to a lack of genetic diversity (Achtman et al., 1999). SNP genotyping (Achtman et al., 2004; Eppinger et al., 2010; Morelli et al., 2010), ribotyping (Guiyoule et al., 1994), IS100 insertion element restriction fragment length polymorphism (RFLP) analysis (Achtman et al., 1999), PCR-based IS100 genotyping (Achtman et al., 2004; Motin et al., 2002) and pulsed-field gel electrophoresis (PFGE) (Lucier and Brubaker, 1992) have been used to differentiate global isolate collections; however, SNP genotyping provides the most robust phylogenetic reconstructions. SNP genotyping (Morelli et al., 2010), ribotyping (Guiyoule et al., 1997), IS100 insertion element RFLP analysis (Huang et al., 2002), different region (DFR) analysis (Li et al., 2008), clustered regularly interspaced short palindromic repeats (CRISPR) analysis (Cui et al., 2008), ERIC-PCR (Kingston et al., 2009), ERIC-BOX-PCR (Kingston et al., 2009), and PFGE (Huang et al., 2002; Zhang et al., 2009) have shown limited to moderate ability in differentiating isolates on a regional scale. Of these, ribotyping has been applied to a set of 187 Malagasy isolates, but only revealed four ribotypes, three of which were unique to Madagascar (Guiyoule et al., 1997). SNP genotyping of 82 Malagasy isolates provided greater and more phylogenetically informative resolution, revealing two major groups and an additional 10 subgroups derived from these two major groups that were mostly isolate-specific (Morelli et al., 2010). In contrast to these other molecular subtyping methods, multi-locus variable-number tandem repeat (VNTR) analysis (MLVA) has shown high discriminatory power at global (Achtman et al., 2004; Klevytska et al., 2001; Pourcel et al., 2004), regional (Girard et al., 2004; Klevytska et al., 2001; Li et al., 2009; Lowell et al., 2007; Zhang et al., 2009), and local scales (Girard et al., 2004), indicating its likely usefulness for further differentiation among Y. pestis isolates from Madagascar.
The use of SNPs and MLVA together, in a hierarchical approach, has been successfully applied to clonal, recently emerged pathogens (Keim et al., 2004; Van Ert et al., 2007; Vogler et al., 2009). Point mutations that result in SNPs occur at very low rates, making SNPs relatively rare in the genome, but discoverable through intensive sampling (i.e., whole genome sequencing). In addition, since each SNP likely occurred only once in the evolutionary history of an organism, SNPs represent highly stable phylogenetic markers that can be used for identifying key phylogenetic positions (Keim et al., 2004). However, SNPs discovered
from a limited number of whole genome sequences will have limited resolving power (Keim et al., 2004) since they will only be able to identify phylogenetic groups along the evolutionary path(s) linking the sequenced genomes (Pearson et al., 2004). In contrast, VNTRs possess very high mutation rates and multiple allele states, allowing them to provide a high level of resolution among isolates. Unfortunately, these high mutation rates can lead to mutational saturation and homoplasy, which can obscure deeper phylogenetic relationships, leading to inaccurate phylogenies. Using these two marker types together, in a nested hierarchical approach, with SNPs used to identify major genetic groups followed by VNTRs to provide resolution within those groups, allows for both a deeply rooted phylogenetic hypothesis and high resolution discrimination among closely related isolates (Keim et al., 2004).
We investigated the phylogeography and molecular epidemiology of Y. pestis in Madagascar through extensive genotyping and mapping of genetic groups. We genotyped 262 Malagasy isolates from 25 districts from 1939–2005 using 56 SNPs and a 43-marker MLVA system to identify island specific subclades. We then spatially mapped the subclades to examine island-wide geographic-genetic patterns and potential transmission routes.
Methods
Ethics Statement
The DNAs analyzed in this study (Table S1) were extracted from Y. pestis cultures that were previously isolated by the Malagasy Central Laboratory for plague and Institut Pasteur de Madagascar as part of Madagascar’s national plague surveillance plan. The Malagasy Ministry of Health, as part of this national plague surveillance plan, requires declaration of all suspected human plague cases and collection of biological samples from those cases. These biological samples are analyzed by the Malagasy Central Laboratory for plague and Institut Pasteur de Madagascar, which also maintains any cultures derived from these samples. These cultures are all de-linked from the patients from whom they originated and analyzed anonymously if used in any research study. Thus, for purposes of this study, all of the DNAs derived from Y. pestis cultures from human patients were analyzed anonymously. No Malagasy review board existed during the collection period of the cultures (1939–2001) from which the DNAs used in this study were derived. In addition, the Institutional Review Board of Northern Arizona University, where the DNA genotyping was done, did not require review of the research due to the anonymous nature of the samples.
DNA was obtained from 262 isolates from 25 different districts from 1939– 2005 (Figure S1, Table S1). DNAs consisted of simple heat lysis preparations or whole genome amplification (WGA) (QIAGEN, Valencia, CA) products generated from the heat lysis preps. Most of the isolates were collected by the Malagasy Central Laboratory for plague supervised by the Institut Pasteur de Madagascar and were primarily isolated from human cases with a few isolated from other mammals or fleas. A handful of other isolates were from other institutions (still originally collected by the Malagasy Central Laboratory for plague) or represent publically available whole genome sequences (Table S1).
SNP Genotyping
A total of 56 SNPs were chosen to genotype the Malagasy isolates because they either marked the branches leading to or from the Madagascar clades in a worldwide analysis (Morelli et al., 2010) or were polymorphic among Malagasy isolates (Table S2). These SNPs were either previously identified in a worldwide SNP study on Y. pestis using a combination of denaturing high performance liquid chromatography (dHPLC) and whole genome sequence comparisons (Morelli et al., 2010) or identified here through whole genome sequence comparisons among 2 Malagasy whole genome sequences (MG05-1020 [GenBank:AAYS00000000] and IP275 [GenBank:AAOS00000000] [Morelli et al., 2010]) and 14 other Y. pestis strain sequences (CO92 [GenBank:AL590842] (Parkhill et al., 2001), FV-1 [GenBank:AAUB00000000] (Touchman et al., 2007), CA88-4125 [GenBank:ABCD00000000] (Auerbach et al., 2007), Antiqua [GenBank:CP000308], Nepal 516 [GenBank:CP000305] (Chain et al., 2006), UG05-0454 [GenBank:AAYR00000000] (Morelli et al., 2010), KIM 10 [GenBank:AE009952] (Deng et al., 2002), F1991016 [GenBank:ABAT00000000], E1979001 [GenBank:AAYV00000000], K1973002 [GenBank:AAYT00000000], B42003004 [GenBank:AAYU00000000] (Eppinger et al., 2009), Pestoides F [GenBank:CP000668] (Garcia et al., 2007), Angola [GenBank:CP000901] (Eppinger et al., 2010) and 91001 [GenBank:AE017042] [Song et al., 2004]). These whole genome sequence comparisons involved comparing the predicted gene sequences of the closed genome of Y. pestis strain CO92 (Parkhill et al., 2001) to the completed and draft genomes of all other strains using MUMmer and in-house Perl scripts (Delcher et al., 2002). For genomes with deposited underlying Sanger sequencing read information, a polymorphic site was considered of high quality when its underlying sequence in the query comprised at least three sequencing reads with an average Phred quality score >30 (Eppinger et al., 2010; Ewing et al., 1998).
A TaqMan-minor groove binding (MGB) assay or a melt mismatch amplification mutation assay (Melt-MAMA) was developed for each SNP for use in
genotyping the Malagasy DNAs. A TaqMan-MGB assay was designed around one SNP known to divide Malagasy isolates into two major groups (Mad-43, Table S2). Melt-MAMA assays were designed around the other 55 SNPs as previously described (Vogler et al., 2009). SNP locations, primer sequences, primer concentrations and other information for these assays are presented in Table S2. Primers and probes were designed using Primer Express 3.0 software (Applied Biosystems, Foster City, CA). Each 5 μl TaqMan-MGB reaction contained primers and probes (for concentrations see Table S2), 1× Platinum Quantitative PCR SuperMix-UDG with ROX (Invitrogen, Carlsbad, CA), water and 1 μl of template. Each 5 μl Melt-MAMA reaction contained 1× SYBR Green PCR Master Mix (Applied Biosystems) or 1× EXPRESS SYBR GreenER qPCR Supermix with Premixed ROX (Invitrogen) (for assay-specific master mix see Table S2), derived and ancestral allele-specific MAMA primers, a common reverse primer (for primer concentrations see Table S2), water and 1 μl of diluted DNA template. DNA templates were diluted 1/10 for heat lysis preparations or 1/50 for WGA products. All assays were performed on an Applied Biosystems 7900HT Fast Real-Time PCR System with SDS software v2.3. Thermal cycling conditions for the TaqMan-MGB assay were as follows: 50°C for 2 min, 95°C for 2 min and 50 cycles of 95°C for 15 s and 66°C for 1 min. Thermal cycling conditions for the Melt-MAMA assays were as follows: 50°C for 2 min, 95°C for 10 min and 40 cycles of 95°C for 15 s and 55–65°C for 1 min (see Table S2 for assay-specific annealing temperatures). Melt-MAMA results were interpreted as previously described (Vogler et al., 2009).
MLVA
All 262 Malagasy isolates were also genotyped using a 43-marker MLVA system as previously described (Girard et al., 2004).
Node Assignment
In general, missing SNP data (<0.5% of dataset) were not a factor in node assignment (see SNP phylogenetic analysis below) since data were usually available for an equivalent SNP, thus leading to unambiguous node assignments for most isolates. However, there were four cases where the node assignment was potentially ambiguous. For three isolates missing data for SNP Mad-21 (branch 1.ORI3.k-1.ORI3.o, Table S2), the ancestral allele state was assumed for that SNP for those isolates, since in this and in a previous worldwide analysis (Morelli et al., 2010), only a single isolate, not included among these three, belonged to node “o.” For a single isolate missing data for SNP Mad-46 (branch 1.ORI3.d-1. ORI3.h1, Table S2) the derived state was assumed, due to the placement of that isolate in MLVA subclade II.B in a neighbor-joining analysis and the observed
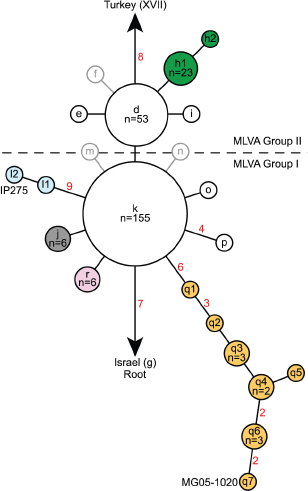
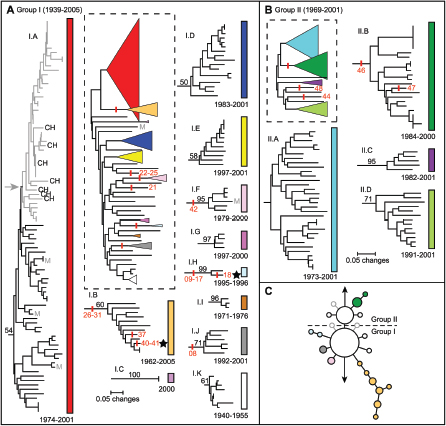
congruence between the “h” nodes and MLVA subclade II.B (see phylogenetic analyses below, Table S1).
Phylogenetic Analyses
A hierarchical approach was applied to the phylogenetic analysis of the Malagasy isolates. First, a SNP phylogeny was generated using data from all 56 SNPs (Figure A7-1). Second, neighbor-joining dendrograms based upon MLVA data were constructed using MEGA 3.1 (Kumar et al., 2001) for the two main groups in the SNP phylogeny, Groups I and II (Figure A7-2A–B). These groups corresponded to the two major Malagasy groups in a previous worldwide analysis (Morelli et al., 2010) and so were separated prior to analyzing with MLVA. The remaining SNPs showing variation among the Malagasy isolates mostly defined subclades observed in the MLVA phylogenies or were specific to single isolates, and so were not used to further separate the isolates prior to applying MLVA. The locations of these additional SNPs are marked on the two MLVA phylogenies where applicable (Figure A7-2A–B). A small set of SNPs provided very fine-scale resolution of the lineage leading to the whole genome sequenced MG05-1020 strain and are not marked on the MLVA phylogeny due to disagreement between the SNP and MLVA phylogenies on this small scale. Distance matrices for the two MLVA phylogenies were based upon mean character differences. Bootstrap values were based upon 1,000 simulations and were generated using PAUP 4.0b10 (D. Swofford, Sinauer Associates, Inc., Sunderland, MA). Branches with ≥50% bootstrap support and/or supported by one or more SNPs were identified as subclades. One other cluster (II.A) was also considered a subclade despite a lack of bootstrap support because of the proximity of a SNP-defined subclade (Figure A7-2B).
Geographic Distribution of Subclades
We mapped the geographic distributions of the Group I and II subclades we identified to determine their phylogeographic patterns (Figure A7-3).
Statistical Analyses
Analysis of similarity (ANOSIM) (Clarke, 1993) tests were performed using PRIMER software version 5 to test the hypotheses that 1) Groups I and II form distinct geographic groups and 2) the identified subclades form distinct geographic groups. These tests were performed on all subclades with ≥5 members (N = 221 isolates), thus excluding the unaffiliated isolates and subclades I.C, I.H, I.I and I.G (Table S1). The results of all 55 pairwise comparisons among the subgroups were evaluated at α = 0.000909 (global α of 0.05 divided by 55). To determine if there was a rank relationship between genetic distance and geographic
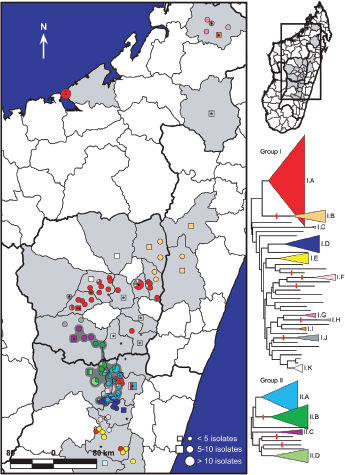
FIGURE A7-3 Geographic distribution of MLVA subclades in Madagascar. The MLVA phylogenies for Groups I and II from Figure A7-2A–B are presented with labeled subclades. Light gray shaded districts indicate Madagascar districts where Y. pestis isolates used in this study were obtained. Colors within the mapped circles and squares correspond to the subclade color designations in the MLVA phylogenies. Divisions within those circles and squares indicate that multiple subclades were found at that location. Circles represent isolates where the city/commune of origin is known. Squares represent isolates where only the district of origin is known and are placed within their corresponding districts near to cities/communes containing the same subclade(s) where possible. Six isolates had unknown districts of origin and were not mapped. Unaffiliated Group I and II isolates are indicated by an “*” and a “+,” respectively; these symbols surrounded by a square indicate unaffiliated isolates where only the district of origin is known. The dark gray-shaded area indicates the geographic area where Group II subclades are found. Note that some Group I subclades are also found in this area.
distance, a Spearman correlation coefficient was generated using the RELATE function in PRIMER software with significance of the resulting statistics determined using 10,000 random permutations of the data. This analysis utilized all isolates with any geographic data (N = 256), with district centroids used as the geographic location for isolates for which only district level geographic information was available (N = 33); city/commune point geographic data were used for the remaining 223 isolates. Six isolates lacking any geographic information were excluded from both statistical analyses (Table S1).
Results
Genetic Diversity of Y. Pestis in Madagascar
Our hypervariable-locus and genome-based approaches identified a relatively high level of genetic diversity among the 262 Malagasy isolates from 25 districts from 1939–2005. We confirmed the presence of two major genetic groups, Groups I and II, differentiated by a single SNP, Mad-43 (Figure A7-1, Table S2), and many VNTR mutational steps. Groups I and II were further differentiated into eleven (I.A–I.K, Figure A7-2A, Table S1) and four (II.A–II.D, Figure A7-2B, Table S1) subclades, respectively, based upon MLVA and/or SNPs. All but one of these subclades was at least weakly supported by bootstrap values ≥50 and/or one or more SNPs (Figure A7-2A–B). The high mutation rates at VNTR loci can lead to homoplasy and, consequently, to low bootstrap support for deeper phylogenetic relationships when analyzing isolates from regional or worldwide collections (Achtman et al., 2004; Johansson et al., 2004; Keim et al., 2004; Lowell et al., 2007). Nevertheless, subsequent analyses using more phylogenetically stable molecular markers (i.e., SNPs) have confirmed MLVA-determined clades with weak or even no bootstrap support (Achtman et al., 2004; Vogler et al., 2009), leading us to use even weak bootstrap support to validate subclades in this analysis. Of the two MLVA identified subclades without bootstrap support, II.A and II.B, subclade II.B was supported by SNP Mad-46 (Table S2) and subclade II.A was designated due to its proximity to and clear separation from the SNP-identified subclade II.B (Figure A7-2B). Subclades I.B, I.F, and I.H were supported by SNPs Mad-26 to 31, Mad-42, and Mad-09 to 17 (Table S2), respectively, and bootstrap analysis (Figure A7-2A). MLVA also identified 23 and 5 isolates in Groups I and II, respectively, that did not belong to any of the identified subclades within those groups (hereafter referred to as unaffiliated isolates) (Figure A7-2A–B, I.NONE and II.NONE isolates in Table S1). Four of these unaffiliated isolates and isolates in subclades I.B, I.H and II.B were also identified by apparently isolate-specific SNPs (Figure A7-2A–B). Overall, MLVA identified 226 genotypes among the 262 isolates, constituting far better resolution than that achieved using ribotyping (Guiyoule et al., 1997).
The SNP and MLVA analyses showed remarkable congruence. Nearly all of the nodes in the SNP phylogeny either corresponded to MLVA subclades or were specific to individual isolates, allowing the combined analysis of SNP and MLVA data discussed above. Three nodes (f, m and n, Figure A7-1) did not have representatives in this study, but appeared to be specific for individual isolates in a previous analysis (Morelli et al., 2010). The only exception to this congruence was within the lineage leading to the whole genome sequenced strain, MG05-1020 (q nodes in Figure A7-1 and subclade I.B in Figure A7-2A). In this case, the SNP phylogeny (q nodes, Figure A7-1) was more accurate than and provided nearly as much resolution as the corresponding MLVA phylogeny (I.B, Figure A7-2A). This fine-scale phylogenetic resolution was due to the use of a high resolution SNP discovery method, whole genome sequence comparisons, to discover SNPs along this lineage as opposed to the lower resolution dHPLC method used to discover most of the other Malagasy SNPs (Morelli et al., 2010). Interestingly, comparable resolution was not seen in the lineage leading to the other whole genome sequenced strain, IP275 (l nodes in Figure A7-1 and subclade I.H in Figure A7-2A), likely due to the very low number of isolates (N = 2) within that lineage in this analysis.
Missing data for two SNP assays suggested a potential genomic rearrangement (e.g., deletion) in some of the Malagasy strains. Twenty-five of the 262 isolates were missing data for two SNP assays despite repeated attempts at amplification (Table S1). The two SNPs, Mad-28 and Mad-41, were located <850 bp apart at CO92 positions 2,208,345 and 2,207,531, respectively (Table S2), suggesting that there may have been a genomic rearrangement affecting this region in these strains. Intriguingly, IS100 elements were located flanking these SNPs at CO92 positions 2,135,459-2,137,412 and 2,236,265-2,238,215. IS elements are important facilitators of genomic rearrangements in Y. pestis (Auerbach et al., 2007; Chain et al., 2006) and may have played a role in this result. If so, the same or a similar genomic rearrangement must have occurred multiple times since the 25 isolates were members of six different nodes in the SNP phylogeny (Table S1). This hypothesis is supported by the fact that IS100 elements are known potential hotspots for genomic rearrangements and excisions in Y. pestis (Achtman, 2004; Auerbach et al., 2007).
Geographic Distribution of Isolates
Significant geographic separation was observed among the identified subclades. Overall, there was a small, but highly significant relationship between genetic and geographic distance (Spearman correlation coefficient ρ = 0.226, p<0.0001). In addition, the two main genetic groups, Groups I and II, formed distinct geographic groups based upon an ANOSIM (R = 0.091, p = 0.0007). Group II isolates, which possessed the derived state for SNP Mad-43 (Table S2), were essentially restricted to three of the most active plague districts in the central
highlands, Betafo, Manandriana and Ambositra (Chanteau et al., 2000), and an adjacent district, Ambatofinandrahana (Figure A7-3, S1). The only exceptions to this were the five unaffiliated Group II isolates, which were scattered in districts to the east and north (+ symbols, Figure A7-3). In contrast, Group I isolates were found in all three foci, both the central and northern highlands and Mahajanga. Geographic separation among the individual Group I and II subclades was also apparent (Figure A7-3) and statistically supported in an ANOSIM (R = 0.232, p<0.0001). Post-hoc analyses of the pairwise comparisons among subclades indicated that most of the eleven tested subclades formed distinct geographic groups (data not shown). Indeed, several interesting geographic patterns were apparent for the different subclades, only some of which are described below. Separate Group I subclades were found in the northern (I.C, I.G, and I.I, Figure A7-3, Table S1) versus the central (I.A, I.B, I.D, I.E, I.F, I.H, I.J, and I.K, Figure A7-3, Table S1) highlands. Subclade I.A, the largest single subclade, was the dominant subclade found in the capital, Antananarivo, and the surrounding area (Figure A7-3, S1). With the exception of two isolates, it was also the only subclade found in Mahajanga (Figure A7-3, S1, Table S1), indicating a central highlands origin for the Y. pestis responsible for the series of Mahajanga plague outbreaks from 1991–1999 (Boisier et al., 1997, 2002; Laventure et al., 1991; Rasolomaharo et al., 1995). Subclade I.B was the only subclade found in the northeastern portion of the central highlands (Figure A7-3). Geographic analysis of the corresponding SNP phylogeny (q nodes, Figure A7-1) for this subclade revealed some additional geographic-genetic patterns. Isolates with the same SNP genotype tended to be clustered geographically, although no distinct spreading pattern could be discerned, possibly due to the limited number of isolates (Figure A7-4). Subclade I.E was predominantly found in the southern central highlands, in district Fianarantsoa, and also appears to be the subclade responsible for the reemergence of plague in the Ikongo district (Migliani et al., 2001), adjacent to Fianarantsoa on the southeast (Figure A7-3, S1).
Three subclades, I.F, I.H and I.K, did not show distinct geographic patterns (Figure A7-3). In the cases of subclades I.F and I.H, this may be due to the limited numbers of isolates within those subclades (Figure A7-2A, Table S1). The geographically widespread nature of subclade I.K isolates, however, may be related to their older dates of isolation. All of the subclade I.K isolates were isolated between 1940 and 1955 (Figure A7-2A, Table S1), just 19–34 years after plague was introduced to the central highlands. Therefore, these isolates may represent a subclade that was formerly spread throughout much of the central highlands but that currently does not exist in nature in Madagascar. Similarly, subclade I.I, although it was not geographically widespread (Figure A7-3), only contained isolates isolated from 1971–1976 (Figure A7-2A, Table S1) and may represent a former, now extinct subclade from the northern highlands. However, the limited number of isolates makes this difficult to determine. Alternatively,
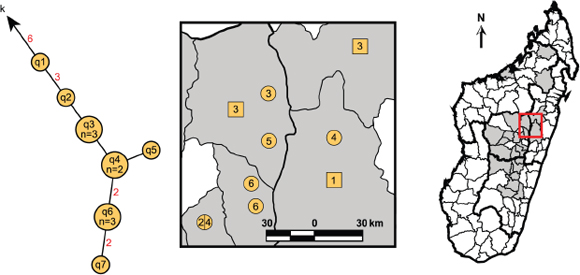
FIGURE A7-4 Geographic distribution of SNP-defined nodes in the strain MG05-1020 lineage. The strain MG05-1020 lineage portion of the SNP phylogeny from Figure A7-1 is indicated as well as an enlarged cutout of the map from Figure A7-3 showing the geographic distribution of isolates from this lineage. For an explanation of the mapped circles and squares see the figure legend for Figure A7-3. Circles, squares and pie chart slices in the map are numbered based upon the node number in the SNP phylogeny for the isolates represented by those shapes. The isolate in node “q7” is not mapped due to its geographic origin being unknown.
these subclades may still exist, but may have decreased in frequency and/or be very rare in nature.
Interestingly, the other older isolates tended to be the unaffiliated isolates. Eighteen of the 28 unaffiliated isolates were isolated between 1939 and 1978. Another 3 had unknown dates of isolation (Table S1). Given their older dates of isolation, these unaffiliated isolates may also be representatives of older, now extinct subclades from Madagascar. The lack of comparable isolates to these unaffiliated isolates among the rest of the isolate collection could be due to the limited sampling from earlier years (Table S1). Alternatively, the unaffiliated isolates may simply be representatives of very rare subclades. A final possibility could involve the accumulation of VNTR mutations due to repeated passages associated with prolonged storage in the laboratory, which could lead to the older isolates being inaccurate representatives of the original isolates. This is unlikely, however, as the rate of VNTR evolution in the laboratory, even with passaging, should be much slower than in nature. Thus, while these isolates may not be exactly the same as when they were first isolated, they should be close. Also, multiple copies of a subset of the Malagasy isolates in this study that were stored at different temperatures showed identical MLVA genotypes (data not shown), indicating that these VNTR loci are relatively stable in these isolates under the storage conditions used. Regardless, the unaffiliated nature of many of the older isolates is consistent with and most likely related to their older dates of isolation.
Several cities and communes yielded isolates of subclades predominantly found elsewhere, suggesting importation from other locations. Antananarivo, in particular, contained isolates from five subclades in addition to the dominant subclade (Figure A7-3, S1). Commune Andina Firaisana in the Ambositra district is another example, containing representatives of four different subclades (Figure 3, S1). One of these, subclade I.A, was also found in the nearby surrounding area. However, this area is considerably south of the area where the majority of subclade I.A isolates were found, suggesting that this subclade may have been imported to this area from further north or vice versa (Figure A7-3). Of the other three subclades found in Andina Firaisana, subclades II.A and II.B are also found in nearby areas and so may be naturally occurring in Andina Firaisana rather than due to transfer events. Subclade II.C, in contrast, appears to have been transferred to Andina Firaisana from the Betafo district in the northwest or vice versa (Figure A7-3, S1). Another nearby commune, Ivato, contained a single subclade I.E isolate, suggesting a transfer event from district Fianarantsoa in the south (Figure A7-3, S1).
Plague in Mahajanga
Our data suggest that Y. pestis was reintroduced to Mahajanga from the central highlands. The majority of the Mahajanga isolates (39 of 44) belonged to a single subcluster within subclade I.A (hereafter referred to as the Mahajanga
I.A subcluster) (Figure A7-2A), suggesting that there was an introduction to Mahajanga from the central highlands that became established in Mahajanga and then underwent local cycling. Though this Mahajanga I.A subcluster did not have either SNP or MLVA support (Figure A7-2A), close examination of the isolates within this subcluster revealed very close genetic relationships, with most differences involving only a single repeat change at a single VNTR locus (data not shown). This is consistent with an outbreak scenario originating from a single introduction and strengthens the identification of this subcluster as a genetic group. In contrast, subclade I.A isolates outside of the Mahajanga I.A subcluster exhibited much greater variation both in the number of VNTR loci displaying polymorphisms and the number of alleles observed at those loci (data not shown), consistent with an older, more geographically dispersed and more differentiated set of isolates.
Our data also suggest that there have been multiple transfers of Y. pestis between Mahajanga and the central highlands. Specifically, seven isolates within the Mahajanga I.A subcluster were isolated from central highland locations rather than from Mahajanga (Figure A7-2A), suggesting that Y. pestis was also transferred back from Mahajanga to the central highlands. Two other Mahajanga isolates belonged to subclade I.F and were unaffiliated, respectively (Figure A7-2A), suggesting that there has been more than one introduction of Y. pestis to Mahajanga as well. The final three Mahajanga isolates, although they belonged to subclade I.A, were not part of the Mahajanga I.A subcluster and were instead more closely related to subclade I.A isolates from the central highlands (Figure A7-2A), again suggesting multiple introductions. However, it is unclear as to whether any of these other introductions became established in Mahajanga due to the lack of other Mahajanga isolates similar to these five outliers. Finally, although our data suggest that there have been multiple transfers of Y. pestis between Mahajanga and the central highlands, there is no evidence in these data for an introduction to Mahajanga from the northern highlands, as was previously suggested by PFGE analyses (Boisier et al., 2002; Duplantier et al., 2005).
Discussion
Madagascar is one of the most active plague regions in the world. However, few studies have investigated the molecular epidemiology of Y. pestis from Madagascar and none have done so using very high resolution genomic methodologies. Here, we investigated the phylogeography and molecular epidemiology of Y. pestis in Madagascar by using a combination of SNPs and MLVA to analyze 262 Malagasy isolates from 25 districts from 1939–2005. In contrast with previous analyses that utilized ribotyping or SNPs alone (Guiyoule et al., 1997; Morelli et al., 2010), we identified a very high level of genetic diversity with 226 MLVA genotypes among the 262 isolates. These genotypes were distributed amongst 15
subclades that displayed significant geographic separation (Figure A7-3), leading to insights into the maintenance and spread of plague in Madagascar.
The use of MLVA was particularly effective at identifying genetic groups in Madagascar. SNPs, though useful, mostly provided confidence in genetic groups that were already apparent via MLVA. This is somewhat counter to the conventional hierarchical approach wherein SNPs are used first to identify major genetic groups followed by MLVA to provide resolution within those groups, thus minimizing the problems of mutational saturation/homoplasy that can occur with highly variable markers such as VNTRs (Keim et al., 2004). In this study, only SNP Mad-43 (Table S2), which differentiated Groups I and II, was useful in this conventional sense to identify “major genetic groups” that were obscured in the MLVA phylogeny (data not shown). All of the other subclades identified by SNPs were also identified by MLVA, suggesting that at this regional scale, MLVA alone may be effective at identifying robust genetic groups. Importantly, though MLVA was excellent at identifying these genetic groups, the relationships among those groups, such as the division between Groups I and II, remained unclear using MLVA alone (data not shown) whereas they were very clearly depicted as a star phylogeny in the SNP phylogeny (Figure A7-1). Where knowledge of deeper genetic relationships or fine-scale phylogenetic analysis of specific lineages (e.g., the strain MG05-1020 lineage here) is desired, SNPs will remain the preferred methodology for clonal pathogens such as Y. pestis. However, until whole genome sequencing for entire isolate collections becomes feasible, MLVA will continue to be a useful tool for examining genetic diversity whether used in conjunction with SNPs or alone.
Our analyses suggest that plague is being maintained in Madagascar in multiple geographically separated subpopulations. We revealed significant geographic separation among the identified subclades (Figure A7-3), suggesting that these subclades are undergoing local cycling with limited gene flow from other subclades. This is consistent with the population genetics and ecology of the black rat (Rattus rattus), the primary plague host in rural Madagascar (Brygoo, 1966; Duplantier, 2001). The black rat in Madagascar exhibits limited gene flow between subpopulations (Gilabert et al., 2007) as well as limited geographic ranges (Rahelinirina et al., 2010). This limited mobility, a high reproduction rate (Duplantier and Rakotondravony, 1999), and the development of some resistance to plague (Tollenaere et al., 2010) are all likely important factors that allow the black rat to maintain plague in these genetically distinct, geographically separated subpopulations. The two flea vectors, X. cheopis and S. fonquerniei (Duplantier, 2001; Duplantier and Rakotondravony, 1999), may also play a role in maintaining genetically distinct subpopulations (i.e., Groups I and II), though more data would be needed to confirm this hypothesis.
In contrast, transport of Y. pestis across longer distances in Madagascar is likely human-mediated. Historically, there is ample evidence for the influence of human traffic on the spread of plague, including transport along trade routes
such as the Silk Road in the early pandemics and transport via steam ship to numerous new locations during the “third” pandemic (Morelli et al., 2010; Perry and Fetherston, 1997). The SNP phylogeny determined by Morelli et al. (2010) suggests the progression of plague from Israel to Madagascar to Turkey (Figure A7-1), a series of transfer events that were almost certainly human-mediated, though the details remain unknown. In Madagascar, plague was most likely transported from its introduction point on the coast to the central highlands, where it became permanently established, via the railroad linking Toamasina and Antananarivo (Brygoo, 1966). More recently, plague was most likely reintroduced to Mahajanga via the transport of infected rats and fleas together with foodstuffs from the central highlands. Indeed, our data suggest multiple transfers between Mahajanga and the central highlands, all likely human-mediated. Additional long distance transfers of Y. pestis in Madagascar are suggested by the multiple subclades identified in cities/communes such as Antananarivo and Andina Firaisana (Figure A7-3, S1, Table S1).
Though long distance transfers of Y. pestis undoubtedly occur, it is unclear how often such transfers result in the successful establishment of the transferred genotypes in new locations. At least one transfer to Mahajanga became successfully established and underwent local cycling as evidenced by the Mahajanga I.A subcluster described here (Figure A7-2A). However, many of the other examples of long distance transfers where multiple subclades were found in a single location are not as clear regarding the establishment of the transferred subclade(s). Antananarivo, for example, is clearly dominated by subclade I.A with only 1–2 representatives of each of the other five subclades identified there (Figure A7-3, S1, Table S1), suggesting that the presence of these alternative subclades may have been only transitory.
Successful establishment of subclades in new locations following a long distance transfer may be related to adaptive advantages possessed by some genotypes (Keim and Wagner, 2009). For instance, subclade I.A appears to be particularly successful in our analysis. The earliest subclade I.A isolate in our dataset was collected in 1974 from the Ambositra district (Table S1), one of the most active plague districts in Madagascar (Chanteau et al., 2000). Subsequent isolates indicate that this subclade continued to exist in a small area of the Ambositra district but also became well established over a large geographic area including and surrounding the capital, Antananarivo. This subclade was also successfully introduced to and established in Mahajanga and appears to have been transferred to the Fianarantsoa district, though it is unclear whether or not it became established there (Figure A7-3, S1, Table S1). This widespread geographical success may indicate that this subclade possesses an adaptive advantage that enhances its ability to be transferred long distances and become established in new locations (Keim and Wagner, 2009). Alternatively, the particular success of this subclade may simply be due to chance.
The central highlands focus remains the most active plague focus in Madagascar (Chanteau et al., 2000) and is, consequently, a likely place for new genotypes to emerge. This is particularly true for those central highlands districts with the highest plague activity. For instance, the three unique ribotypes identified in a previous study belonged to isolates from two highly active districts, Ambositra and Ambohimahasoa (Guiyoule et al., 1997). Here, isolates belonging to Group II and its subclades were found in three highly active districts, Betafo, Manandriana, and Ambositra (Figure A7-3, S1). As discussed above, Ambositra may also have been the district of origin for the highly successful subclade I.A. Overall, the Ambositra district was one of the two most diverse districts in our analysis, containing representatives from six different subclades (Figure A7-3, Table S1). This diversity is consistent with the Ambositra district’s status as one of the three most important plague districts in Madagascar (Chanteau et al., 1998; 2000).
The maintenance and spread of Y. pestis in Madagascar is a dynamic and highly active process, depending on the natural cycle between the black rat and its flea vectors as well as human activity. Y. pestis in Madagascar is maintained in multiple, genetically distinct, geographically separated subpopulations, likely via the black rat. The exact geographic landscape of these subpopulations is probably ever changing, with some subclades going extinct or decreasing in frequency (e.g., subclade I.K), new subclades emerging and becoming established, and some subclades being transferred to new locations, where they may become established either temporarily or more long-term. Much of the long distance spread of Y. pestis in Madagascar is likely due to human activities that allow for the transport of plague infected rats and fleas from one location to another.
Acknowledgments
We would like to thank Dr. Kimothy Smith for initially suggesting the collaboration that led to this work. Note that the use of products/names does not constitute endorsement by the DHS of the United States.
Author Contributions
Conceived and designed the experiments: AJV DMW SC PK. Performed the experiments: AJV FC JL RN. Analyzed the data: AJV DMW. Contributed reagents/materials/analysis tools: FC PR ME JR LR BWR SMB-S MA SC. Wrote the paper: AJV PK.
Funding
This work was funded by the Department of Homeland Security Science and Technology Directorate (award numbers NBCH2070001 and HSHQDC-08-C-00158), the Cowden Endowment in Microbiology at Northern Arizona
University, and the National Institute of Allergy and Infectious Diseases (NIAID), US National Institutes of Health (NIH), Department of Health and Human Services (HHS) (award number AI065359). This work was also supported by the Science Foundation of Ireland (award number 05/FE1/B882) (MA), the NIAID NIH HHS (award number N01 AI-30071) (ME JR), the Malagasy Ministry of Health (contract Nu01/95 IDA 2252-MAG) (FC LR BWR SC), and the French Cooperation (FAC Nu 94008 300) (FC LR BWR SC). The funders had no role in study design, data collection and analysis, decision to publish, or preparation of the manuscript.
References
Achtman M, Morelli G, Zhu P, Wirth T, Diehl I, et al. (2004) Microevolution and history of the plague bacillus, Yersinia pestis. Proc Natl Acad Sci U S A 101: 17837-17842.
Achtman M, Zurth K, Morelli G, Torrea G, Guiyoule A, et al. (1999) Yersinia pestis, the cause of plague, is a recently emerged clone of Yersinia pseudotuberculosis. Proc Natl Acad Sci U S A 96: 14043-14048.
Auerbach RK, Tuanyok A, Probert WS, Kenefic L, Vogler AJ, et al. (2007) Yersinia pestis evolution on a small timescale: comparison of whole genome sequences from North America. PLoS One 2: e770.
Boisier P, Rahalison L, Rasolomaharo M, Ratsitorahina M, Mahafaly M, et al. (2002) Epidemiologic features of four successive annual outbreaks of bubonic plague in Mahajanga, Madagascar. Emerg Infect Dis 8: 311-316.
Boisier P, Rasolomaharo M, Ranaivoson G, Rasoamanana B, Rakoto L, et al. (1997) Urban epidemic of bubonic plague in Majunga, Madagascar: epidemiological aspects. Trop Med Int Health 2: 422-427.
Brygoo ER (1966) Epidémiologie de la peste à Madagascar. Arch Inst Pasteur Madagascar 35: 9-147.
Chain PS, Hu P, Malfatti SA, Radnedge L, Larimer F, et al. (2006) Complete genome sequence of Yersinia pestis strains Antiqua and Nepal516: evidence of gene reduction in an emerging pathogen. J Bacteriol 188: 4453-4463.
Chanteau S, Ratsifasoamanana L, Rasoamanana B, Rahalison L, Randriambelosoa J, et al. (1998) Plague, a reemerging disease in Madagascar. Emerg Infect Dis 4: 101-104.
Chanteau S, Ratsitorahina M, Rahalison L, Rasoamanana B, Chan F, et al. (2000) Current epidemiology of human plague in Madagascar. Microbes Infect 2: 25-31.
Clarke KR (1993) Non-parametric multivariate analyses of changes in community structure. Aust J Ecol 18: 117-143.
Cui Y, Li Y, Gorgé O, Platonov ME, Yan Y, et al. (2008) Insight into microevolution of Yersinia pestis by clustered regularly interspaced short palindromic repeats. PLoS ONE 3: e2652.
Delcher AL, Phillippy A, Carlton J, Salzberg SL (2002) Fast algorithms for large-scale genome alignment and comparison. Nucleic Acids Res 30: 2478-2483.
Deng W, Burland V, Plunkett G, 3rd, Boutin A, Mayhew GF, et al. (2002) Genome sequence of Yersinia pestis KIM. J Bacteriol 184: 4601-4611.
Duplantier JM (2001) The black rat’s role in spreading human plague in Madagascar. L’Institut de recherche pour le développement Scientific Bulletin 131: 1-3.
Duplantier JM, Duchemin JB, Chanteau S, Carniel E (2005) From the recent lessons of the Malagasy foci towards a global understanding of the factors involved in plague reemergence. Vet Res 36: 437-453.
Duplantier JM, Rakotondravony D (1999) The rodent problem in Madagascar: agricultural pest and threat to human health. In: Singleton G, Hinds L, Leirs H, Zhang Z, editors. Ecologically-based management of rodent pests. Canberra: Australian Centre for International Agricultural Research. pp. 441-459.
Eppinger M, Guo Z, Sebastian Y, Song Y, Lindler LE, et al. (2009) Draft genome sequences of Yersinia pestis isolates from natural foci of endemic plague in China. J Bacteriol 191: 7628-7629.
Eppinger M, Worsham PL, Nikolich MP, Riley DR, Sebastian Y, et al. (2010) Genome sequence of the deep-rooted Yersinia pestis strain Angola reveals new insights into the evolution and pangenome of the plague bacterium. J Bacteriol 192: 1685-1699.
Ewing B, Hillier L, Wendl MC, Green P (1998) Base-calling of automated sequencer traces using Phred. I. Accuracy assessment. Genome Res 8: 175-185.
Galimand M, Guiyoule A, Gerbaud G, Rasoamanana B, Chanteau S, et al. (1997) Multidrug resistance in Yersinia pestis mediated by a transferable plasmid. N Engl J Med 337: 677-680.
Garcia E, Worsham P, Bearden S, Malfatti S, Lang D, et al. (2007) Pestoides F, an atypical Yersinia pestis strain from the former Soviet Union. Adv Exp Med Biol 603: 17-22.
Gilabert A, Loiseau A, Duplantier JM, Rahelinirina S, Rahalison L, et al. (2007) Genetic structure of black rat populations in a rural plague focus in Madagascar. Can J Zool 85: 965-972.
Girard JM, Wagner DM, Vogler AJ, Keys C, Allender CJ, et al. (2004) Differential plague-transmission dynamics determine Yersinia pestis population genetic structure on local, regional, and global scales. Proc Natl Acad Sci U S A 101: 8408-8413.
Guiyoule A, Grimont F, Iteman I, Grimont PA, Lefévre M, et al. (1994) Plague pandemics investigated by ribotyping of Yersinia pestis strains. J Clin Microbiol 32: 634-641.
Guiyoule A, Rasoamanana B, Buchrieser C, Michel P, Chanteau S, et al. (1997) Recent emergence of new variants of Yersinia pestis in Madagascar. J Clin Microbiol 35: 2826-2833.
Huang XZ, Chu MC, Engelthaler DM, Lindler LE (2002) Genotyping of a homogeneous group of Yersinia pestis strains isolated in the United States. J Clin Microbiol 40: 1164-1173.
Johansson A, Farlow J, Larsson P, Dukerich M, Chambers E, et al. (2004) Worldwide genetic relationships among Francisella tularensis isolates determined by multiple-locus variable-number tandem repeat analysis. J Bacteriol 186: 5808-5818.
Keim P, Van Ert MN, Pearson T, Vogler AJ, Huynh LY, et al. (2004) Anthrax molecular epidemiology and forensics: using the appropriate marker for different evolutionary scales. Infect Genet Evol 4: 205-213.
Keim PS, Wagner DM (2009) Humans and evolutionary and ecological forces shaped the phylogeography of recently emerged diseases. Nat Rev Microbiol 7: 813-821.
Kingston JJ, Tuteja U, Kapil M, Murali HS, Batra HV (2009) Genotyping of Indian Yersinia pestis strains by MLVA and repetitive DNA sequence based PCRs. Antonie Van Leeuwenhoek 96: 303-312.
Klevytska AM, Price LB, Schupp JM, Worsham PL, Wong J, et al. (2001) Identification and characterization of variable-number tandem repeats in the Yersinia pestis genome. J Clin Microbiol 39: 3179-3185.
Kumar S, Tamura K, Jakobsen IB, Nei M (2001) MEGA2: molecular evolutionary genetics analysis software. Bioinformatics 17: 1244-1245.
Laventure S, Andrianaja V, Rasoamanana B (1991) Epidémie de peste à Majunga en 1991. Rapport de mission de l’Institut Pasteur de Madagascar 1991: 1-26. 1-26.
Li Y, Cui Y, Hauck Y, Platonov ME, Dai E, et al. (2009) Genotyping and phylogenetic analysis of Yersinia pestis by MLVA: insights into the worldwide expansion of Central Asia plague foci. PLoS One 4: e6000.
Li Y, Dai E, Cui Y, Li M, Zhang Y, et al. (2008) Different region analysis for genotyping Yersinia pestis isolates from China. PLoS ONE 3: e2166.
Lowell JL, Zhansarina A, Yockey B, Meka-Mechenko T, Stybayeva G, et al. (2007) Phenotypic and molecular characterizations of Yersinia pestis isolates from Kazakhstan and adjacent regions. Microbiology 153: 169-177.
Lucier TS, Brubaker RR (1992) Determination of genome size, macrorestriction pattern polymorphism, and nonpigmentation-specific deletion in Yersinia pestis by pulsed-field gel electrophoresis. J Bacteriol 174: 2078-2086.
Migliani R, Chanteau S, Rahalison L, Ratsitorahina M, Boutin JP, et al. (2006) Epidemiological trends for human plague in Madagascar during the second half of the 20th century: a survey of 20,900 notified cases. Trop Med Int Health 11: 1228-1237.
Migliani R, Ratsitorahina M, Rahalison L, Rakotoarivony I, Duchemin JB, et al. (2001) [Resurgence of the plague in the Ikongo district of Madagascar in 1998. 1. Epidemiological aspects in the human population]. Bull Soc Pathol Exot 94: 115-118.
Morelli G, Song Y, Mazzoni CJ, Eppinger M, Roumagnac P, et al. (2010) Yersinia pestis genome sequencing identifies patterns of global phylogenetic diversity. Nat Genet 42: 1140-1143.
Motin VL, Georgescu AM, Elliott JM, Hu P, Worsham PL, et al. (2002) Genetic variability of Yersinia pestis isolates as predicted by PCR-based IS100 genotyping and analysis of structural genes encoding glycerol-3-phosphate dehydrogenase (glpD). J Bacteriol 184: 1019-1027.
Parkhill J, Wren BW, Thomson NR, Titball RW, Holden MT, et al. (2001) Genome sequence of Yersinia pestis, the causative agent of plague. Nature 413: 523-527.
Pearson T, Busch JD, Ravel J, Read TD, Rhoton SD, et al. (2004) Phylogenetic discovery bias in Bacillus anthracis using single-nucleotide polymorphisms from whole-genome sequencing. Proc Natl Acad Sci U S A 101: 13536-13541.
Perry RD, Fetherston JD (1997) Yersinia pestis-etiologic agent of plague. Clin Microbiol Rev 10: 35-66.
Pourcel C, André-Mazeaud F, Neubauer H, Ramisse F, Vergnaud G (2004) Tandem repeats analysis for the high resolution phylogenetic analysis of Yersinia pestis. BMC Microbiol 4: 22.
Rahelinirina S, Duplantier JM, Ratovonjato J, Ramilijaona O, Ratsimba M, et al. (2010) Study on the movement of Rattus rattus and evaluation of the plague dispersion in Madagascar. Vector Borne Zoonotic Dis 10: 77-84.
Rasolomaharo M, Rasoamanana B, Andrianirina Z, Buchy P, Rakotoarimanana N, et al. (1995) Plague in Majunga, Madagascar. Lancet 346: 1234.
Rotz LD, Khan AS, Lillibridge SR, Ostroff SM, Hughes JM (2002) Public health assessment of potential biological terrorism agents. Emerging infectious diseases 8: 225-230.
Song Y, Tong Z, Wang J, Wang L, Guo Z, et al. (2004) Complete genome sequence of Yersinia pestis strain 91001, an isolate avirulent to humans. DNA Res 11: 179-197.
Tollenaere C, Rahalison L, Ranjalahy M, Duplantier JM, Rahelinirina S, et al. (2010) Susceptibility to Yersinia pestis experimental infection in wild Rattus rattus, reservoir of plague in Madagascar. Ecohealth 7: 242-247.
Touchman JW, Wagner DM, Hao J, Mastrian SD, Shah MK, et al. (2007) A North American Yersinia pestis draft genome sequence: SNPs and phylogenetic analysis. PLoS One 2: e220.
Van Ert MN, Easterday WR, Huynh LY, Okinaka RT, Hugh-Jones ME, et al. (2007) Global genetic population structure of Bacillus anthracis. PLoS One 2: e461.
Vogler AJ, Birdsell D, Price LB, Bowers JR, Beckstrom-Sternberg SM, et al. (2009) Phylogeography of Francisella tularensis: global expansion of a highly fit clone. J Bacteriol 191: 2474-2484.
Welch TJ, Fricke WF, McDermott PF, White DG, Rosso ML, et al. (2007) Multiple antimicrobial resistance in plague: an emerging public health risk. PLoS One 2: e309.
World Health Organization (WHO) (2010) Human plague: review of regional morbidity and mortality, 2004–2009. Wkly Epidemiol Rec 85: 40-45.
Zhang X, Hai R, Wei J, Cui Z, Zhang E, et al. (2009) MLVA distribution characteristics of Yersinia pestis in China and the correlation analysis. BMC Microbiol 9: 205.
Zhang Z, Hai R, Song Z, Xia L, Liang Y, et al. (2009) Spatial variation of Yersinia pestis from Yunnan Province of China. Am J Trop Med Hyg 81: 714-717.
Folker Meyer30and Elizabeth M. Glass30
Introduction
Next-generation sequencing (NGS) has opened up access to genomic data from diverse microbial communities, and studies are emerging that cover a wide variety of systems (Gilbert et al., 2010; Human Microbiome Project, 2012; Nealson and Venter, 2007; Tara Expeditions, 2012; Terragenome Consortium, 2012). A number of techniques are used to extract genome-based information either using single reference genes (usually 16s rDNA) or random shotgun metagenomics using entire genomes. There is an abundance of reviews of the subject (Desai et al., 2012; Thomas et al., 2012). Systems such as MG-RAST (Meyer et al., 2008) now provide access to thousands of metagenomic data sets (see Figure A8-1).
However this newly found data richness is not without its challenges. The main problem stems from dramatic changes that converted an ecosystem that was until recently data poor, to one that is now overflowing with data. Environmental biology and molecular ecology went from being overwhelmed by several hundred megabytes of data generated in 2005 by the Global Ocean Survey (Nealson and Venter, 2007) to generating many terabytes of data in 2012. Biology and medicine, however, lack the tradition and experience to handle big data—only a few areas such as cancer diagnosis have established stable pipelines and data formats that allow exchange.
Shotgun Metagenomics as an Example
Metagenomic shotgun sequencing using NGS technology can serve as a blueprint for how biology is and will be impacted by big data. With sequence data already significantly cheaper than the corresponding analysis (Wilkening et al., 2009), and as the cost of sequencing drops by a factor of 10 annually, it seems clear that a paradigm shift will be required to handle data analysis and storage.
There is significant value in the comparative analysis of metagenomic data sets, yet comparison requires data sets to have undergone more or less the same
_______________________
30 Argonne National Laboratory, Institute for Genomics and Systems Biology, 9700 S. Cass Ave, Lemont, IL 60439, U.S.A.
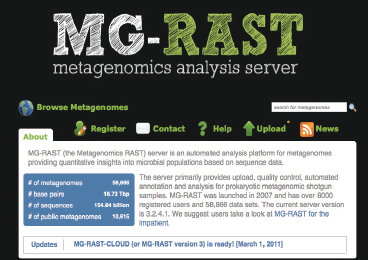
analytical processes. The existing paradigm of publishing the raw data and summary statistics in tabular form as auxiliary material does not allow any third parties to benefit from the work already done; instead it requires any future authors to re-analyze data. Consider the Human Microbiome Project (Turnbaugh et al., 2007) that has recently published more than 5 terabases of sequence data from 172 human subjects. Any researcher attempting to compare their finding to the data will discover that they need to re-analyze all of the data.
As an interesting side note, the value and need for comparative analyses also necessitates asking questions of how the reviewing process was handled. Did the reviewers in fact take a look at any of the analysis performed, or did they take the results produced by a complex sequence analysis pipeline at face value? Often the information that was derived from the data is a product of a complex pipeline that was not described in sufficient detail. Further, the reviewer has no way to know whether the same results could be obtained from the same data. A rigorous review process cannot possibly be maintained under current mechanisms and requirements. The prohibitive cost renders such analyses effectively irreproducible. Thus, it is all the more critical to require detailed documentation of data handling in analyses.
One of the key missing concepts is the notion of rigorous analysis of data quality prior to deriving any statements about biology from the data. Many factors contribute to data quality; in DNA sequencing, noise can be added at various steps in the pipeline. While some vendor-specific schemes exist to determine sequence
noise, in the past there were no generally accepted vendor-neutral ways to characterize the noise in sequence data. For 16s rDNA-based amplicon metagenomic data, this has already led to a major debate over the amount of microbial diversity (Reeder and Knight, 2010), leading to a number of approaches that will de-noise sequence data prior to analysis (Quince et al., 2009; Reeder and Knight, 2010). For shotgun metagenomics the DRISEE approach (Keegan et al., 2012) provides a vendor-neutral estimate of sequence error. Interestingly, results show that the errors found are not specific to sequencing platforms; variations in quality within the platforms are significant, as highlighted by Figure A8-2.
Taking the data sets underlying Figure A8-2 as an example, the sequence analysis pipelines will be required to use different approaches for data with less than 1 percent error and with more than 45 percent error. The MG-RAST analysis pipeline was the first to include the examination of sequence quality systematically and to highlight sequence quality issues. A surprising amount of data sets submitted to the system are rejected initially because they are, for example, too low in quality or contain contamination.
In addition to “low-level” sequence error, a number of other significant sources of problems exist. Tom Schmidt’s group described the existence of artificially duplicated reads in 454 data (Gomez-Alvarez et al., 2009). (These artifacts also exist in Ion Torrent and Illumina data.) If left uncorrected, such duplicates
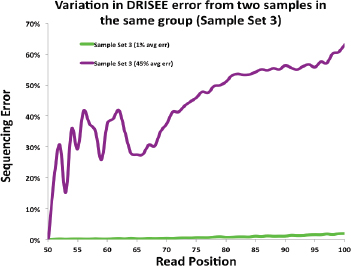
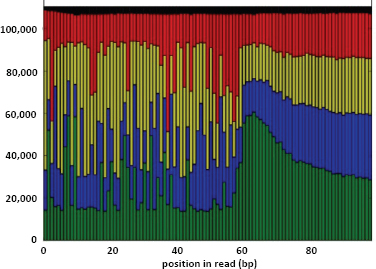
lead to significant biases in the interpretation of sequence data, as some areas of sequence are misrepresented.
Other frequently found artifacts include leftover adapter sequences or primer di-mers (see Figure A8-3 for an example of both problems). Most researchers will agree that for a shotgun sample, a more or less even distribution of each base on each position of all reads is to be expected. Unfortunately, in cases that deviate from the expected distribution, as in Figure A8-3, the only information that can be derived from the sequence data is that the sequencing run has failed. Yet, the data shown in Figure A8-3 have been interpreted biologically and were accepted for publication.
Once the potential obstacles with data quality have been eliminated, a number of bioinformatics tools can be used to predict genes of interest for downstream analysis. While significant progress has been made in recent years for the prediction of genes in more or less complete microbial genomes (Overbeek et al., 2007), the same cannot be said for the state of the art for predicting genes in noisy metagenomic data. Trimble et al. (2012) show that only one of the existing tools accounts for the possibility that sequences might contain sequencing error, despite that, as we have mentioned above, the presence of noise (or imperfect
data) is a reality in shotgun metagenomics where data are frequently not or only partially assembled.
A side effect of assuming all data to be perfect is the significant impairment of tool performance when tools are used on data with realistic error properties. This mismatch of assumption with reality leads to performance reductions of 10–20 percent accuracy in the presence of 3 percent error (see Trimble et al., 2012).
Following gene prediction, functional assignments are computed by mapping the prediction features against a database of known proteins in some form. Again different pipelines apply different approaches; however, they all rely on some flavor of sequence similarity searching (e.g., BLAST [Altschul et al., 2009], BLAT [Kent, 2002], HMMer [Eddy, 1998]). What all these approaches have in common is their failure to identify novelty. Any unknown gene will remain uncharacterized, and a non-homologous replacement for a known protein function (no matter how important for the sample) will be represented as an unknown protein in the metagenomic analysis presented.
While this might present a problem in some cases, the majority of the protein databases contain a variety of annotations for proteins of the same function. Often, multiple annotations for proteins that are 100 percent sequence identical can be found (e.g., the alcohol dehydrogenase gene from various Streptococcus strains has 20 different annotations). While some annotations would be informative for a human reader, in the majority of cases, a computer would not be able to recognize the fact that the two functions described are identical. When comparing the relative abundance of alcohol dehydrogenase genes, results would be affected by the fact that several alcohol dehydrogenase genes would have slightly different names. As a result, annotations derived from similarity searches are less then useful for quantitative studies in microbial ecology unless carried out on a higher functional level as for example KEGG (Kanehisa, 2002) pathways or the very successful SEED subsystems (Overbeek et al., 2005). These higher-level aggregations subsume a significant number of genes in categories (e.g., KEGG pathways).
Using those categories to represent gene function abundance, we can represent the genetic material in environmental samples as an abundance vector, allowing cross-sample comparison of gene abundance. With the newly minted BIOM (McDonald et al., 2012) format, various existing tools, such as MG-RAST (Meyer et al., 2008) and QIIME (Caporaso et al., 2010) can be used together to analyze functional abundance data.
An Attempt to Estimate the Scale of the Problem
“Raw” sequence data can be transformed into abundance vectors that describe the abundance of specific gene categories in environmental samples. However even slight variations in one of the transforming steps will introduce
significant variations in the outcome, as would be the case for two data sets that have used different gene prediction algorithms with different levels of tolerance for sequence error.
Because there is no culture of sharing data beyond raw sequences in the INSDC archives, consumers of data from any specific study can either rely on tables published as auxiliary material with a study, or they can re-analyze the data. As mentioned before, the computational cost makes that undesirable (Wilkening et al., 2009), Imagine yourself in the position of comparing your data to the Human Microbiome Project jump-start project (described above). Instead of simply analyzing their own data, researchers would find themselves re-analyzing various other data sets they are using in comparison. While this type of approach was common in the early days of genomics and still is used for single microbial genomes—such as SEED (Aziz et al., 2008), IMG (Markowitz et al., 2006), and GenDB (Meyer et al., 2003)—using the same approach for more computationally demanding data types like metagenomes will lead to a situation in which groups are no longer limited by their ability to acquire sequence data, but by their ability to analyze it. While it is likely that metagenomic data analysis will undergo significant improvements (as compared to the improvements for individual microbial genomes discussed in Overbeek et al. [2007]), that will not suffice. With sequencing costs continuing to drop, data acquisition costs will soon be a small fraction of the data analysis cost.
Sharing of computational results (e.g., gene calling results, computed similarities, and other intermediate data types) would alleviate this problem. But this only works if the community can agree on a small number of standard formats to represent the data, and only if the majority of the tools support those standards.
Ways Out of the Current Dilemma
While for the first time biology now has access to abundant data, the challenges in handling the data and using the data in a robust way to define new research hypotheses seem insurmountable. We have described the challenge of using big data in the context of metagenomics above.
A number of aspects to this challenge need to be addressed separately. Perhaps the most important aspect is a change of culture recognizing that in the presence of abundant data, the standard operating procedures from before are no longer sufficient. Among the things that need to change are data archives that now can no longer attempt to capture all data, computational approaches that need to take computational costs into account, and last but not least the individual researchers that need to learn that data analysis must be planned and budgeted for appropriately.
One suggestion likely acceptable to most readers is that, in the presence of big data, computational data analysis needs to take a more prominent role in the training of the next generation of bio-scientists.
There are also some technical steps that can be taken to improve the current situation. Standards for describing sequence data have been established by the Genomics Standards Consortium (GSC) (Field et al., 2011). These standards are currently enabling data exchange at a hitherto unprecedented scale, enabling data consumption by many third parties for many purposes.
Based on these positive experiences, the GSC now has initiated a long-term project to define standards for sharing processed data. The results of this M5 project will enable researchers to consume data from a published study for their analysis without having to re-analyze everything from scratch and yet allowing them to both change and understand all the fine details of these studies.
In addition, the M5 project aims to define encodings for data that will allow existing and new analysis service providers to exchange analyzed data. This ability will allow comparison of different analytical approaches and will help with the evolution of analysis approaches. We predict that this new openness will lead to more acceptance for the established analysis approaches and reduce the number of ad hoc analysis pipelines that reinvent analysis processes. By embracing the needed cultural changes, adhering to standards, and promoting openness, many third parties will be liberated to innovate like never before.
References
Altschul, S. F., E. M. Gertz, R. Agarwala, A. A. Schaffer, and Y. K. Yu. 2009. PSI-BLAST pseudocounts and the minimum description length principle. Nucleic Acids Research 37(3):815-824.
Aziz, R. K., D. Bartels, A. A. Best, M. DeJongh, T. Disz, R. A. Edwards, K. Formsma, S. Gerdes, E. M. Glass, M. Kubal, F. Meyer, G. J. Olsen, R. Olson, A. L. Osterman, R. A. Overbeek, L. K. McNeil, D. Paarmann, T. Paczian, B. Parrello, G. D. Pusch, C. Reich, R. Stevens, O. Vassieva, V. Vonstein, A. Wilke, and O. Zagnitko. 2008. The RAST server: Rapid annotations using subsystems technology. BMC Genomics 9:75.
Caporaso, J. G., J. Kuczynski, J. Stombaugh, K. Bittinger, F. D. Bushman, E. K. Costello, N. Fierer, A. G. Pena, J. K. Goodrich, J. I. Gordon, G. A. Huttley, S. T. Kelley, D. Knights, J. E. Koenig, R. E. Ley, C. A. Lozupone, D. McDonald, B. D. Muegge, M. Pirrung, J. Reeder, J. R. Sevinsky, P. J. Turnbaugh, W. A. Walters, J. Widmann, T. Yatsunenko, J. Zaneveld, and R. Knight. 2010. QIIME allows analysis of high-throughput community sequencing data. Nature Methods 7(5):335-336.
Desai, N., D. Antonopoulos, J. A. Gilbert, E. M. Glass, and F. Meyer. 2012. From genomics to metagenomics. Current Opinion in Biotechnology 23(1):72-76.
Eddy, S. R. 1998. Profile hidden Markov models. Bioinformatics 14(9):755-763.
Field, D., L. Amaral-Zettler, G. Cochrane, J. R. Cole, P. Dawyndt, G. M. Garrity, J. Gilbert, F. O. Glöckner, L. Hirschman, and I. Karsch-Mizrachi. 2011. The Genomic Standards Consortium. PLoS Biology 9(6):e1001088.
Gilbert, J. A., F. Meyer, J. Jansson, J. Gordon, N. Pace, J. Tiedje, R. Ley, N. Fierer, D. Field, N. Kyrpides, F. O. Glöckner, H. P. Klenk, K. E. Wommack, E. Glass, K. Docherty, R. Stevens, and R. Knight. 2010. The Earth Microbiome Project: Meeting report of the “1 EMP meeting on sample selection and acquisition” at Argonne National Laboratory, October 6, 2010. Standards in Genomic Sciences 3(3):249-253.
Gomez-Alvarez, V., T. K. Teal, and T. M. Schmidt. 2009. Systematic artifacts in metagenomes from complex microbial communities. ISME Journal 3(11):1314-1317.
HMP (Human Microbiome Project). 2012. Human Microbiome Project. http://nihroadmap.nih.gov/hmp (accessed October 2, 2012).
Kanehisa, M. 2002. The KEGG database. Novartis Foundation symposium 247:91-101; discussion 101-103, 119-128, 244-252.
Keegan, K. P., W. L. Trimble, J. Wilkening, A. Wilke, T. Harrison, M. D’Souza, and F. Meyer. 2012. A platform-independent method for detecting errors in metagenomic sequencing data: DRISEE. PLoS Computational Biology 8(6):e1002541.
Kent, W. J. 2002. BLAT—the BLAST-like alignment tool. Genome Research 12(4):656-664.
Markowitz, V. M., F. Korzeniewski, K. Palaniappan, E. Szeto, G. Werner, A. Padki, X. Zhao, I. Dubchak, P. Hugenholtz, I. Anderson, A. Lykidis, K. Mavromatis, N. Ivanova, and N. C. Kyrpides. 2006. The integrated microbial genomes (IMG) system. Nucleic Acids Research 34 (Database issue):D344-D348.
McDonald, D., J. C. Clemente, J. Kuczynski, J. Rideout, J. Stombaugh, D. Wendel, A. Wilke, S. Huse, J. Hufnagle, F. Meyer, R. Knight, and J. Caporaso. 2012. The Biological Observation Matrix (BIOM) format or: How I learned to stop worrying and love the ome-ome. Gigascience 1:7.
Meyer, F., A. Goesmann, A. C. McHardy, D. Bartels, T. Bekel, J. Clausen, J. Kalinowski, B. Linke, O. Rupp, R. Giegerich, and A. Pühler. 2003. GenDB—an open source genome annotation system for prokaryote genomes. Nucleic Acids Research 31(8):2187-2195.
Meyer, F., D. Paarmann, M. D’Souza, R. Olson, E. M. Glass, M. Kubal, T. Paczian, A. Rodriguez, R. Stevens, A. Wilke, J. Wilkening, and R. A. Edwards. 2008. The metagenomics RAST server—A public resource for the automatic phylogenetic and functional analysis of metagenomes. BMC Bioinformatics [electronic resource] 9:386.
Nealson, K. H., and J. C. Venter. 2007. Metagenomics and the global ocean survey: What’s in it for us, and why should we care? ISME Journal 1(3):185-187.
Overbeek, R., T. Begley, R. M. Butler, J. V. Choudhuri, N. Diaz, H-Y. Chuang, M. Cohoon, V. de Crécy-Lagard, T. Disz, R. Edwards, M. Fonstein, E. D. Frank, S. Gerdes, E. M. Glass, A. Goesmann, A. Hanson, D. Iwata-Reuyl, R. Jensen, N. Hamshidi, L. Krause, M. Kubal, N. Larsen, B. Linke, A. C. McHardy, F. Meyer, H. Neuweger, G. Olsen, R. Olson, A. Osterman, V. Portnoy, G. D. Pusch, D. A. Rodionov, C. Rückert, J. Steiner, R. Stevens, I. Thiele, O. Vassieva, Y. Ye, O. Zagnitko, and V. Vonstein. 2005. The subsystems approach to genome annotation and its use in the Project to Annotate 1000 Genomes. Nucleic Acids Research 33(17).
Overbeek, R., D. Bartels, V. Vonstein, and F. Meyer. 2007. Annotation of bacterial and archaeal genomes: Improving accuracy and consistency. Chemical Reviews 107(8):3431-3447.
Quince, C., A. Lanzen, T. P. Curtis, R. J. Davenport, N. Hall, I. M. Head, L. F. Read, and W. T. Sloan. 2009. Accurate determination of microbial diversity from 454 pyrosequencing data. Nature Methods 6(9):639-641.
Reeder, J., and R. Knight. 2010. Rapidly denoising pyrosequencing amplicon reads by exploiting rank-abundance distributions. Nature Methods 7(9):668-669.
Tara Expeditions. 2012. http://oceans.taraexpeditions.org (accessed October 2, 2012).
Terragenome Consortium. 2012. http://www.terragenome.org (accessed October 2, 2012).
Thomas, T., J. Gilbert, and F. Meyer. 2012. Metagenomics—a guide from sampling to data analysis. Microbial Informatics and Experimentation 2(1):3.
Trimble, W. L., K. P. Keegan, M. D’Souza, A. Wilke, J. Wilkening, J. Gilbert, and F. Meyer. 2012. Short-read reading-frame predictors are not created equal: Sequence error causes loss of signal. BMC Bioinformatics [electronic resource] 13(1):183.
Turnbaugh, P. J., R. E. Ley, M. Hamady, C. M. Fraser-Liggett, R. Knight, and J. I. Gordon. 2007. The human microbiome project. Nature 449(7164):804-810.
Wilkening, J., A. Wilke, N. Desai, and F. Meyer. 2009. Using clouds for metagenomics: A case study. In: IEEE Cluster 2009.
HIGH-THROUGHPUT BACTERIAL GENOME SEQUENCING:
AN EMBARRASSMENT OF CHOICE, A WORLD OF OPPORTUNITY31
Nicholas J. Loman,32Chrystala Constantinidou,32
Jacqueline Z. M. Chan,32Mihail Halachev,32Martin Sergeant,32
Charles W. Penn,32Esther R. Robinson,33and Mark J. Pallen32
Abstract
Here, we take a snapshot of the high-throughput sequencing platforms, together with the relevant analytical tools, that are available to microbiologists in 2012, and evaluate the strengths and weaknesses of these platforms in obtaining bacterial genome sequences. We also scan the horizon of future possibilities, speculating on how the availability of sequencing that is ‘too cheap to metre’ might change the face of microbiology forever.
In bacteriology, the genomic era began in 1995, when the first bacterial genome was sequenced using conventional Sanger sequencing (Fleischmann et al., 1995). Back then, sequencing projects required six-figure budgets and years of effort. A decade later, in 2005, the advent of the first high-throughput (or “next-generation”) sequencing technologies signalled a significant advance in the ease and cost of sequencing (Metzker et al., 2005), delivering bacterial genome sequences in hours or days rather than months or years. High-throughput sequencing now delivers sequence data thousands of times more cheaply than is possible with Sanger sequencing. The availability of a growing abundance of platforms and instruments presents the user with an embarrassment of choice. Better still, vigorous competition between manufacturers has resulted in sustained
_______________________
31 Reprinted with kind permission from Nature Publishing Group.
32 Nicholas J. Loman, Chrystala Constantinidou, Jacqueline Z. M. Chan, Mihail Halachev, Martin Sergeant, Charles W. Penn and Mark J. Pallen are at the Institute of Microbiology and Infection, University of Birmingham, Birmingham B15 2TT, UK.
33 Esther R. Robinson is at the Nuffield Department of Clinical Laboratory Sciences, University of Oxford, Oxford OX3 9DU, UK.
Correspondence to: Mark J. Pallen—Email: m.pallen@bham.ac.uk
technical improvements on almost all platforms. This means that in recent years our sequencing capability has been doubling every 6–9 months—much faster than Moore’s law.
Here, we describe the sequencing technologies themselves, examine the practicalities of producing a sequence-ready template from bacterial cultures and clinical samples, and weigh up the costs of labour and kits. We look at the types of data that are delivered by each instrument, and describe the approaches, programs and pipelines that can be used to analyse these data and thus move from draft to complete genomes.
Several high-throughput sequencing platforms are now chasing the US$1,000 human genome (Venter, 2010). Given that the average bacterial genome is less than one-thousandth the size of the human genome, a back-of-the-envelope calculation suggests that a $1 bacterial genome sequence is an imminent possibility. In closing, we assess how close to reality the $1 bacterial genome actually is and explore the ways in which high-throughput sequencing might change the way that all microbiologists work.
A Variety of Approaches
High-throughput sequencing platforms can be divided into two broad groups depending on the kind of template used for the sequencing reactions. The earliest, and currently most widely used, platforms depend on the production of libraries of clonally amplified templates. These are produced through amplification of immobilized libraries made from a single DNA molecule in the initial sample. More recently, we have seen the arrival of single-molecule sequencing platforms, which determine the sequence of single molecules without amplification. Within these broad categories, there is considerable variation in performance—including in throughput, read length and error rate—as well as in factors affecting usability, such as cost and run time.
Template amplification technologies In general terms, all of the platforms that are currently on the market rely on a three-stage workflow of library preparation, template amplification and sequencing (Figure A9-1). Library preparation begins with the extraction and purification of genomic DNA. Depending on the protocol, the amount of DNA required can vary from a few nanograms to tens of micrograms, meaning that success in this step depends on the ability to grow sufficient biomass. For some microorganisms, obtaining suitable DNA—in terms of quantity and quality—can prove difficult. Therefore, before using expensive reagents for library preparation and sequencing, it is advisable to confirm, by fluorometry, that DNA of sufficient quantity and quality has been obtained. However, purchasing a suitable instrument to do this adds to the costs of establishing a sequencing capability (Box A9-1).
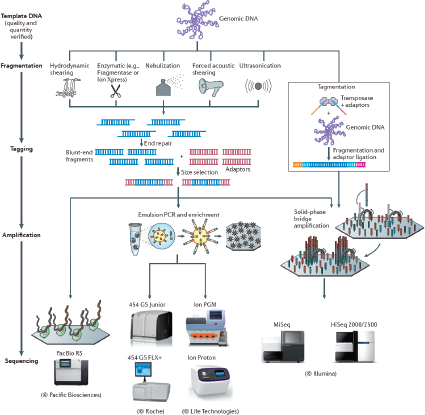
For shotgun sequencing, an initial fragmentation step is required to generate random, overlapping DNA fragments. Depending on the platform and application, these fragments can range from 150 bp to 800 bp in length; size selection either involves harvesting from agarose gels or exploits paramagnetic-bead-based technology. The selected fragments must also be sufficiently abundant to provide comprehensive and even coverage of the target genome. Two types of fragmentation are widely used: mechanical and enzymatic. Early protocols relied on mechanical methods such as nebulization or ultrasonication. Nebulization is an
BOX A9-1
The Add-on Cost of Sequencing
The costs of sequencing instruments and reagents are not the only issues that need to be taken into account when setting up a sequencing facility for microbial applications. So, what else do you need? Well, first you have to buy a high-end fluorometer such as a Life Technologies Qubit (around US$2,000) and/or an Agilent Technologies 2100 Bioanalyzer (around $18,000). Then, if you want to save time by parallel processing, you should consider investing in an ultrasonicator (for example, from Covaris, at around $45,000) and a liquid-handling robot (for example, the Biomek FXP, at around $310,000, or one of the SPRIworks systems, at around $45,000; both from Beckman Coulter). To carry out sequencing on the 454 GS FLX+ instrument from Roche, you need a bead counter for emulsion PCR (up to $20,000), and for the Genome Analyzer IIx or HiSeq machines from Illumina, you need to buy an Illumina cBot (~$55,000). For some platforms, you may have to buy additional centrifuges and/or rotors; for example, the ULTRA-TURRAX Tube Drive system from IKA ($1,000) is required by the Ion Torrent platform (from Life Technologies) if the OneTouch system is not used. You also need to buy a server to take receipt of the data coming off your instrument (for example, a $5,000 desktop), and then a cluster of servers for analysing and storing the data (ranging from $20,000 upwards). In addition, you may have to update your laboratory infrastructure by investing in a dedicated electrical connection and appropriate air-conditioning units for your sequencing instrument, and uninterruptible power supplies for your sequencer and servers. Most laboratories also want to invest in a backup solution that is both fast and available. This may be a mirrored set of hard drives, or even a shelf full of disconnected USB drives. Illumina offers a cloud-based backup and basic-analysis solution called BaseSpace which can store sequence results as they are generated on the Illumina MiSeq. Currently, this is a free solution, but users are likely to have to pay a subscription in the future.
inexpensive method that can be easily adopted by any laboratory, but it results in large losses of input material and a broad range of fragment sizes, runs the risk of cross-contamination and cannot handle parallel processing. By contrast, ultrasonication instruments such as systems from Covaris or the Bioruptor systems from Diagenode allow parallel sample processing and minimize hands-on time and sample loss but come at a price that could be prohibitive for small laboratories. Mechanically generated fragments require repair and end-polishing before platform-specific adaptors can be ligated to the ends of the target molecules. These adaptors act as primer-binding sites for the subsequent template amplification reaction.
More recently, enzymatic methods have provided an alternative approach to producing random fragments of the desired length. These require less input DNA and offer easier, faster sample processing. Fragmentase (from New England Biolabs) is a mixture of a nuclease, which randomly nicks double-stranded
DNA, and a T7 endonuclease, which cleaves the DNA. Together, these enzymes generate random double-strand DNA breaks in a time-dependent manner, allowing the user to tailor protocols in order to obtain products of the required length. Adaptors can then be ligated to these fragments in the usual way. Tagmentation (Caruccio, 2011) is a promising transposase-based approach that, in a single step, fragments DNA and incorporates sequence tags, which then take the place of adaptors. Currently, the only available implementation of tagmentation is within the Nextera system, which is only available for the Illumina platform. Several companies have produced automated liquid-handling machines that greatly reduce the hands-on time required for fragmentation approaches but significantly increase costs (Box A9-1).
In addition to supporting fragment-based sequencing, all template amplification platforms support mate pair sequencing, in which the ends of DNA fragments of a certain size (typical sizes are 3 kb, 6 kb, 8 kb or 20 kb) are joined together to form circular molecules. These molecules are then fragmented a second time. Fragments flanking the joins are then selected and end adaptors added. Sequencing through the joins provides valuable information about the location of sequences dispersed across the genome, facilitating assembly.
Paired-end sequencing has similarities to mate pair sequencing, but DNA fragments are sequenced from each end without the need for additional library preparation steps. The Illumina platform has direct support for paired-end sequencing. Short fragments that are less than the read length from the forward and reverse ends (for example, 180 bp fragments combined with 2 × 100 base sequencing) permits overlapping pseudo long reads to be generated. Alternatively, fragments of up to ~800 bp can be used. Longer fragments may result in a loss of amplification efficiency. The Ion Personal Genome Machine (PGM) (using the Ion Torrent platform, from Life Technologies) also has a bidirectional sequencing protocol that requires the removal of the chip after the initial run, a digestion step and a second sequencing run using a different sequencing primer. All platforms can handle PCR products, allowing adaptor sequences to be incorporated into the 5′ ends of primers.
For all platforms, it is highly advisable to assess the quality and quantity of the sequence library before subjecting it to amplification. Different instruments for quality assessment are recommended by different manufacturers. Examples include the 2100 Bioanalyzer (from Agilent Technologies), fluorometers such as the NanoDrop 3300 (from Thermo Scientific) or the Qubit (from Life Technologies), and quantitative PCR using any of a number of available quantitative PCR machines along with either own-design or commercially available assays. Purchasing a suitable instrument for this step can add several thousand dollars to the costs of establishing a sequencing capability (Box A9-1).
In preparation for amplification, template molecules are immobilized on a solid surface, which is a flow cell for sequencing with the Illumina platform and solid beads or ion sphere particles for other approaches. Simultaneous solid-phase
amplification of millions or billions of spatially separated template fragments prepares the way for massively parallel sequencing. For the Illumina platform, template amplification is automated and is performed either directly on the instrument (for the MiSeq, and the HiSeq 2500 sequencer in rapid-run mode) or using the cBot, a separate instrument that is dedicated to this task (used in conjunction with the Genome Analyzer IIx and the HiSeq 2000 machine). Clusters are generated by bridge amplification on the surface of the flow cell. For platforms that use bead-based immobilization (the SOLiD [from Life Technologies], 454 and Ion Torrent platforms), amplified template sequence libraries are prepared off-instrument, relying on an emulsion PCR, in which the beads are enclosed in aqueous-phase microreactors and are kept separated from each other in a water-in-oil emulsion.
Sequencing chemistry Although these platforms rely on a sequencing-by-synthesis design, they differ in the details of the sequencing chemistry and the approach used to read the sequence. The Illumina sequencing platform depends on Solexa chemistry (Bentley et al., 2008), which includes reversible termination of sequencing products. In each sequencing cycle, a mixture of fluorescently labelled ‘reversible terminator’ nucleotides with protected 3′-OH groups (and a different emission wavelength for each nucleotide) is perfused across the flow cell. Wherever a complementary nucleotide is present on the template strand, the terminator is incorporated and imaged, and then the signal is quenched and the terminator nucleotide is chemically deprotected at the 3′-OH group.
The 454 and Ion Torrent sequencing platforms avoid the use of terminators. Instead, in each cycle a single kind of dNTP is flowed across the template. When there is base complementarity between the dNTP and the next available position in the template, the DNA polymerase incorporates the base onto the extending strand, liberating pyrophosphate and hydrogen ions. When there is no complementarity, DNA synthesis is halted temporarily; each type of dNTP is flowed across the template in turn according to the dispensing cycle, and DNA synthesis is thus re-initiated when the next complementary dNTP is added. The 454 platform exploits a pyrosequencing approach (Margulies et al., 2005; Ronaghi et al., 1998) whereby the presence of pyrophosphate is signalled by visible light as the result of an enzyme cascade. The order and intensity of the light peaks are recorded as “flowgrams.” The Ion Torrent platform relies on a modified silicon chip to detect hydrogen ions that are released during base incorporation; the resulting lack of reliance on imaging makes this platform the first “post-light” sequencing instrument (Rothberg et al., 2011).
The SOLiD platform (Valouev et al., 2008) and the platform from Complete Genomics (Drmanac et al., 2010) depend on sequencing by ligation. In this approach, fluorescent probes undergo iterative steps of hybridization and ligation to complementary positions in the template strand at the 5′ end of the extending strand, followed by fluorescence imaging to identify the ligated probe.
Single-molecule sequencing Single-molecule sequencing brings the promise of freedom from amplification artefacts as well as from onerous sample and library preparations. The HeliScope Single-Molecule Sequencer (from Helicos BioSciences) was the first platform for single-molecule sequencing to hit the market place in 2009 (Bowers et al., 2009). This technology applies one-colour reversible-terminator sequencing to unamplified single-molecule templates. However, this platform has been hampered by its high price and poor instrument sales and, following the delisting of the company from the stock market, there are significant doubts over the future of the platform.
More recently, Pacific Biosciences has delivered “real-time sequencing,” in which dye-labelled nucleotides are continuously incorporated into a growing DNA strand by a highly processive, strand-displacing ø29-derived DNA polymerase (Eid et al., 2009). Each DNA polymerase molecule is tethered within a zero-mode waveguide detector, which allows continuous imaging of the labelled nucleotides as they enter the strand (Levene et al., 2003).
Choosing a Platform
High-end instruments The high-throughput sequencing market presents the user with a challenging choice between bulky, expensive high-end instruments and the new generation of bench-top instruments (Tables A9-1, A9-2). The high-end machines include PacBioRS (from Pacific Bioseciences), the HiSeq instruments, Genome Analyzer IIx, the SOLiD 5500 series and the 454 GS FLX+ system. These deliver a high throughput and/or long read lengths but come with set-up costs of hundreds of thousands of dollars, placing them beyond the reach of the average research laboratory or even department. These machines are thus only suitable for large sequencing centres or core facilities. This raises the important question of where an ‘average’ microbiologist should source sequencing from.
These instruments can deliver dozens to thousands of bacterial genomes per run, as illustrated by several high-impact publications on bacterial genomes and metagenomes (Harris et al., 2012; Hess et al., 2011; Mutreja et al., 2011; Qin et al., 2010). However, to achieve efficiencies in time and cost, optimum sequencing of microbial samples on such instruments requires onerous and expensive bar-coding and multiplexing of samples and/or subdivision of runs (for example, through gaskets or the use of single channels on the Illumina platform), as well as a sophisticated scheduling system. Compare sequencing a single human genome with the equivalent sequencing throughput for 1,000 average-sized bacterial genomes: although the sequencing run itself may be comparable in both scenarios, >1,000 samples and libraries need to be prepared for the bacterial run, compared with just one for the human genome. The costs and effort involved in sequencing 1,000 bacterial genomes therefore vastly outweigh the requirements for sequencing a single human genome, so the hasty calculation that one human
TABLE A9-1 Comparison of Next-Generation Sequencing Platforms
| Machine (manufacturer) | Chemistry | Modal read length* (bases) | Run time | Gb per run | Current approximate cost (US$)† | Advantages | Disadvantages |
| 454 GS FLX+ (Roche) | Pyrosequencing | 700–800 | 23 hours | 0.7 | 500,000 | • Long read lengths |
• Appreciable hands-on time • High reagent costs • High error rate in homopolymers |
| HiSeq 2000/2500 (Illumina) | Reversible terminator | 2 × 100 | 11 days (regular mode) or 2 days (rapid run mode)§ | 600 (regular mode) or 120 (rapid run mode)§ | 750,000 | • Cost-effectiveness • Steadily improving read lengths • Massive throughput • Minimal hands-on time |
• Long run time • Short read lengths • HiSeq 2500 instrument upgrade not available at time of writing (available end 2012) |
| 5500xl SOLiD (Life Technologies) | Ligation | 75+35 | 8 days | 150 | 350,000 | • Low error rate • Massive throughput |
• Very short read lengths • Long run times |
| PacBio RS (Pacific Biosciences) | Real-time sequencing | 3,000 (maximum 15,000) | 20 minutes | 3 per day | 750,000 | • Simple sample preparation • Low reagent costs • Very long read lengths |
• High error rate • Expensive system • Difficult installation |
| Machine (manufacturer) | Chemistry | Modal read length* (bases) | Run time | Gb per run | Current approximate cost (US$)† | Advantages | Disadvantages |
| 454 GS Junior (Roche) | Pyrosequencing | 500 | 8 hours | 0.035 | 100,000 | • Long read lengths |
• Appreciable hands-on time • High reagent costs • High error rate in homopolymers |
| Ion Personal Genome Machine (Life Technologies) | Proton detection | 100 or 200 | 3 hours | 0.01–0.1 (314 chip), 0.1–0.5 (316 chip) or up to 1 (318 chip) | 80,000 (including OneTouch and server) | • Short run times • Appropriate throughput for microbial applications |
• Appreciable hands-on time • High error rate in homopolymers |
| Ion Proton (Life Technologies) | Proton detection | Up to 200 | 2 hours | Up to 10 (Proton I chip) or up to 100 (Proton II chip) | 145,000 + 75,000 for compulsory server | • Short run times • Flexible chip reagents |
• Instrument not available at time of writing |
| MiSeq (Illumina) | Reversible terminator | 2 × 150 | 27 hours | 1.5 | 125,000 | • Cost-effectiveness • Short run times • Appropriate throughput for microbial applications • Minimal hands-on time |
• Read lengths too short for efficient assembly |
* Average read length for a fragment-based run
† Approximate cost per machine plus additional instrumentation and service contract. See Glenn(2011).
§ Available only on the HiSeq 2500.
TABLE A9-2 The Applicability of the Major High-Throughput Sequencing Platforms
| Example application in bacteriology | Desirable characteristics | Machine* | ||||||
| 454 GS Junior† | 454 GS FLX+† | Ion Personal Genome Machine (318 chip)§ | MiSeq|| | HiSeq 2000|| | 5500xl SOLiD§ | PacBio |
||
• Long reads • Paired-end protocol and/or long mate-pair protocol • Even coverage of genome |
✓ | ✓✓ | ✓ | ✓ | ✓ | ✗ | ✓✓ | |
| Rapid characterization of a novel pathogen (draft |
• Total run time (library preparation plus sequencing) of under 48 hours • Sufficient coverage of a bacterial genome in a single run |
✓ | ✓✓ | ✓✓ | ✓✓ | ✗ | ✗ | ✓✓ |
| Rough-draft |
• Long or paired-end reads • High throughput • Ease of library and sequencing workflow • Cost-effective |
✗ | ✓ | ✓ | ✓✓ | ✓✓ | ✓ | ✓ |
| Re-sequencing of many similar strains (>50) for the discovery of single nucleotide polymorphisms and for phylogenetics | • Very high throughput • Low-cost, high-throughput sequence library construction • High accuracy |
✗ | ✗ | ✓ | ✓ | ✓✓ | ✓ | ✓ |
| Small-scale transcriptomics-by-sequencing experiments (for example, two strains under four growth conditions with two biological replicates, so 16 strains) | • High per-isolate coverage |
✗ | ✓ | ✓ | ✓ | ✓✓ | ✓✓ | ✓✓ |
| Example application in bacteriology | Desirable characteristics | Machine* | ||||||
| 454 GS Junior† | 454 GS FLX+† | Ion Personal Genome Machine (318 chip)§ | MiSeq|| | HiSeq 2000|| | 5500xl SOLiD§ | PacBio |
||
| Phylogenetic profiling to genus-level using partial 16S rRNA gene amplicon sequencing | • High coverage • Long amplicon input (≥500 bp) • Long reads • High single-read accuracy (error rate <1%) |
✓ | ✓✓ | ✓ | ✓✓ | ✓ | ✓ | ✗ |
| Whole-genome metagenomics for the reconstruction of multiple genomes in a single sample | • Long reads or paired-end reads • Very high throughput • Low error rate |
✗ | ✓ | ✓ | ✓ | ✓✓ | ✓ | ✓ |
* ![]() particularly well suited;
particularly well suited; ![]() suitable;
suitable; ![]() not suitable.
not suitable.
‡ From Roche; § From Life Technologies; || From Illumina; ¶ From Pacific Biosciences.
genome-sequencing project equates to 1,000 bacterial genome-sequencing projects starts to look rather optimistic.
Bench-top instruments Three modestly priced bench-top instruments with throughputs and workflows that are well suited to microbial applications have recently hit the market. The 454 GS Junior was released in early 2010 and is a smaller, lower-throughput version of the 454 GS FLX+ machine, exploiting similar emulsion PCR and pyrosequencing approaches but with lower set-up and running costs (Loman et al., 2012). The Ion PGM was launched in early 2011 and saw almost immediate use in the crowd-sourced analysis of the Shiga toxin-producing Escherichia coli (STEC) outbreak in Germany (Rohde et al., 2011; Mellmann et al., 2011). This platform has also shown the greatest improvement in performance in recent months: an assembly for the STEC outbreak strain was generated in May 2011 using data from five Ion Torrent 314 chips and consisted of more than 3,000 contigs, whereas comparable data from a single newer 316 chip assembled into fewer than 400 contigs. The MiSeq, which began to ship to customers in late 2011, is based on the existing Solexa chemistry but has dramatically reduced run times compared with the HiSeq (hours rather than days). This is made possible by the use of a smaller flow cell, leading to a reduced imaging time and faster microfluidics.
Each of these bench-top instruments is capable of sequencing a whole bacterial genome in days. The performance of all three instruments was recently compared by sequencing a British isolate from the German STEC outbreak of 2011 (Loman et al., 2012). In this evaluation, all three bench-top sequencing platforms generated useful draft genome sequences with assemblies that mapped to ≥95% of the reference genome, so by these criteria all could be judged fit for purpose. However, no instrument was able to generate accurate one-contig-per-replicon assemblies that might equate to a finished genome.
The MiSeq was found to have the highest throughput per run, lowest error rate and most user-friendly workflow of the three instruments: hands-on time is low because template amplification is carried out directly on the instrument without manual intervention. However, a paired-end 150-base sequencing run took more than 27 hours. The MiSeq is notable for being able to sequence fragments from both ends (paired-end mode) without changes to the library preparation stage or additional intervention during sequencing.
The 454 GS Junior produced the longest reads (mean 522 bases) and generated the least fragmented assemblies but had the lowest throughput and a cost-per-base that was at least one order of magnitude higher than the cost for the other two platforms. The Ion PGM delivered the fastest throughput per hour (80–100 Mb) and had the shortest run time (around 3 hours) but also had the shortest reads (mean 121 bases), although kits producing 200 bases have since been made available for this instrument. The Ion PGM and 454 GS Junior were both prone to making mistakes in homopolymeric tracts, and these mistakes caused assembly
errors that resulted in frame-shifts in coding regions, even when data were assembled at high read coverage.
Coping with the Data
The high-end sequencing platforms make considerable demands on the local information technology infrastructure in terms of data tracking and analysis, short-term storage and long-term archiving. Bench-top instruments have more modest information technology requirements. However, each platform delivers data in a slightly different format, and saying that one has sequenced a bacterial genome means different things on different platforms and can create difficulties when comparing or combining data generated on different platforms (Table A9-2).
There are two main analytical approaches to the exploitation of high-throughput sequencing data: reads can be aligned—that is, mapped—to a known reference sequence or subjected to de novo assembly. The choice of strategy depends on the read length obtained (short reads are better mapped to a reference), the availability of a good reference sequence and the intended biological application (for example, genomic epidemiology versus pathogen biology).
To document genetic variation in the genomes of multiple highly related strains, a mapping approach is efficient and often sufficient. In this situation, sequence variants can be called by aligning reads to a reference genome using short-read-mapping tools (see Supplementary information S1 (table)). A mapping approach is problematic when dealing with reads from repetitive regions or from parts of the genome that are absent from the reference genome, or when a closely related reference genome is unavailable.
De novo assembly is more informative when dealing with a new pathogen or a new strain of a well-known pathogen. Sequencing errors can have a significant impact on assembly. When platforms produce random errors, the effect of these errors on assembly can be overcome by increasing the depth of coverage. However, when errors are systematic and occur in predictable contexts (for example, in homopolymers), increasing the depth of coverage is unlikely to help, and it may be necessary to sequence the troublesome regions using an alternative technology. Very high-quality, near complete references may be obtained by a hybrid approach, such as in recent studies combining Pacific Biosciences and Illumina data (Bashir et al., 2012; Koren et al., 2012).
A variety of commonly used assemblers is now available (see Supplementary information S1 (table)), ranging from the platform specific (for example, Newbler from Roche) to the more generally applicable (for example, MIRA (Chevreax, et al., 2004), Velvet (Zerbino and Birney, 2008), and the CLC Genomics Workbench from CLC Bio). De novo assemblies can be compared using Mauve (Darling et al., 2004) or Mugsy (Angiuoli and Salzberg, 2011), and the assemblies can be manually examined using the Tablet viewer (Milne et al., 2010). For
annotation of assemblies, Glimmer (Delcher et al., 1999) works well for coding-sequence prediction, while tRNAScan-SE (Schattner et al., 2005) and RNAmmer (Lagesen et al., 2007) work well for stable-RNA prediction. There are numerous pipelines for automatic annotation of de novo assemblies, including RAST (Aziz et al., 2008), IMG/ER (Markowitz et al., 2009) and the IGS Annotation Engine (developed by the Institute for Genome Sciences, University of Maryland School of Medicine, USA), although care must be taken when interpreting results from such services, as the public databases used contain annotation errors that are then propagated to newly sequenced genomes (Richardson and Watson, 2012).
For microbial applications, all of the above programs run quickly (in minutes or hours) and are not particularly processor intensive. Some workflows combine a series of programs and provide an accessible interface for microbiologists who are not bioinformatics specialists. For example, xBASE-NG provides a “one-stop shop” for assembly, annotation and comparison of bacterial genome sequences (Chaudhuri et al., 2008). Sophisticated phylogenetic analyses are more demanding and may be beyond the capability of the average research group. One particular issue when constructing bacterial whole-genome phylogenies is the clouding of phylogenetic signal by recombination events and homoplasy (Marttinen et al., 2012). Algorithms such as ClonalFrame (Didelot and Falush, 2007) and ClonalOrigin (Didelot et al., 2010) take multiple whole-genome alignments as input and attempt to identify blocks of recombination. These approaches are computationally very expensive, and there is no “off the shelf” solution to comparing hundreds or thousands of bacterial genomes. There is a growing interest in alignment-free approaches for constructing bacterial phylogenies, as it is thought that these approaches may help address the computational challenges of these analyses (Köser et al., 2012).
A recurring problem with data from high-throughput sequencing is meeting the requirement, as stipulated by journals and funders, that data be lodged in the public domain. Unannotated assembled sequences can be uploaded to conventional sequence databases, such as GenBank, fairly easily. However, submission of annotated sequences can be onerous, slowing down the process of publication even further. Submission of sequence reads to short-read archives may be hampered by slow data transfer rates, and it remains uncertain how sustainable such archives will prove to be in the future. There may come a time when the easiest way to obtain such data will be to re-sequence the sample, rather than upload, archive and retrieve large data sets.
Current Applications and Future Prospects
High-throughput sequencing has already transformed microbiology. Rapid, low-cost genome sequencing has helped make genomic epidemiology a reality, allowing us to track the spread of pathogens through hospitals (Köser et al., 2012; Lewis et al., 2010), communities (Gardy et al., 2011; Mellmann et al., 2011;
Rohde et al., 2011) and across the globe (Beres et al., 2010; Harris et al., 2011; Mutreha et al., 2011). High-throughput sequencing has already had a huge impact on our understanding of microbial evolution, whether within a single patient over years or decades (for example, Pseudomonas aeruginosa in a patient with cystic fibrosis [Cramer et al., 2011]) or globally across the centuries (for example, influenza virus in the 1918 influenza pandemic [Dunham et al., 2009] or mediaeval Yersinia pestis in the Black Death [Bos et al., 2011]). Genome sequences have even been obtained from single microbial cells (Woyke et al., 2009).
There are many applications beyond mere genome sequencing. High-throughput sequencing has opened up new avenues for sequence-based profiling and metagenomics of complex microbial communities, including those associated with human health and disease (Hess et al., 2011; Qin et al., 2010). Particularly exciting is the promise of culture-independent approaches to pathogen discovery and detection (Lipkin, 2010). In the research laboratory, sequencing is taking over from microarrays as the method of choice for studying gene expression (using RNA sequencing (RNA-seq)) (Passalacqua et al., 2009; Sharma et al., 2010; Sorek and Cossart, 2010), mutant libraries (using Tn-seq and transposon-directed insertion site sequencing (TraDIS)) (Langridge et al., 2009; van Opinjnen et al., 2009) and protein–DNA interactions (using chromatin immunoprecipitation followed by sequencing (ChIP–Seq)) (Grainger et al., 2009).
So, what does the future hold? For current platforms, we can expect to see cheaper, easier library preparation methods and ever-higher sequencing throughputs. However, with the arrival of transformative new technologies (Branton et al., 2008) (Box A9-2), this might be seen as tinkering around the edges. The tipping point has already been reached such that the staff and infrastructure costs of handling and analysing sequence data outweigh the costs of generating that data. If the promise of portable, single-molecule, long-read-length sequencing bears fruit and these technologies show the same steady increase in functionality and cost-effectiveness that we have seen with earlier high-throughput sequencing platforms, we could be just a few years away from user-friendly, “$1-a-pop” bacterial genome sequencing.
As we have argued elsewhere (Pallen and Loman, 2011), high-throughput sequencing may well be poised to make a decisive impact on clinical microbiology, but there are still many difficulties to be overcome—for example, in presenting complex information to clinicians, in agreeing common formats for data sharing, in integrating genomics with clinical informatics and clinical practice, in benchmarking novel technologies and in gaining regulatory approval (from the US FDA and other bodies) for clinical applications of these technologies. One thing is certain: thanks to the expected relentless progress in sequencing technology, microbiology in the next 20 years will look nothing like it does now.
BOX A9-2
Oxford Nanopore: The Game Changer?
In February 2012, at a conference in the United States, the British company Oxford Nanopore Technologies announced a new, near-market “strand sequencing” technology that exploits protein nanopores embedded in an industrially fabricated polymer membrane. As a DNA strand is fed through a nanopore by a processive enzyme, the trinucleotides in contact with the pore are detected through electrochemistry.
The manufacturers have already claimed that they can sequence the 50 kb phage λ genome on both strands, and they claim that there is no theoretical read length limit. They also claim that sequencing can be paused, the sample recovered and replaced, and sequencing then started again. Plus, there is no need for onerous sample preparations: sequences can be read directly from blood (and probably also bacterial lysates).
Oxford Nanopore Technologies has announced two products, both scheduled to ship in late 2012. The MinION is a disposable US$900 sequencer housed in a USB stick, with 512 nanopores, each capable of running 120–1,000 bases per minute per pore for up to 6 hours. The MinION can generate 150 Mb of sequence per hour, all without fluidics or imaging, and bases are streamed live to a laptop through the USB connection. The GridION is a rack-mountable sequencer with 2,000 nanopores and is capable of generating tens of gigabases over 24 hours. Both machines promise astonishing read lengths at low cost and with minimal sample preparation. However, this technology currently suffers from a high error rate (~4%) that is chiefly due to deletion errors but, according to their February 2012 press conference, the manufacturers are confident that they can fix this.
How will access to a disposable sequencer change the way we do microbiology? With no capital costs or cumbersome set-up and installation, this technology certainly has the power to democratize sequencing even further. Will prices fall enough for it to be worth sequencing one bacterial genome per MinION, or will the long read lengths mean that we can mix samples and then disaggregate the genomes with little effort? If read lengths really can be obtained in the ≥100 kb range, then all the existing problems of short-read assembly in genomics and metagenomics will be rendered obsolete.
Furthermore, we can now take the sequencer to the patient’s bedside or out into the field. Microbial ecologists need no longer depend on molecular bar codes such as the 16S rRNA gene when they can have whole genomes instead, and latter-day John Snows can use disposable sequencing, not just to detect cholera, but also to track its evolution and spread.
Of course, the reality may not match the hype, and we eagerly await the first independent evaluation of this technology. But if the dream comes true, most of the rest of this article will soon be redundant.
The authors thank the anonymous reviewers for their help and suggestions.
Competing Interests Statement
The authors declare competing financial interests. Mark J. Pallen was a winner of an Ion Personal Genome Machine (PGM) (from Ion Torrent, part of Life Technologies) in the European Ion PGM Grant Programme. Nicholas J. Loman has received expenses to speak at an Ion Torrent meeting organized by Life Technologies and has received honoraria and expenses from Illumina to speak at Illumina meetings. Chrystala Constantinidou, Jacqueline Z. M. Chan, Mihail Halachev, Martin Sergeant, Charles W. Penn and Esther R. Robinson declare no competing financial interests.
References
Adey, A. et al. Rapid, low-input, low-bias construction of shotgun fragment libraries by high-density in vitro transposition. Genome Res. 11, R119 (2010).
Angiuoli, S. V. & Salzberg, S. L. Mugsy: fast multiple alignment of closely related whole genomes. Bioinformatics 27, 334–342 (2011).
Aziz, R. K. et al. The RAST Server: rapid annotations using subsystems technology. BMC Genomics 9, 75 (2008).
Bashir, A. et al. A hybrid approach for the automated finishing of bacterial genomes. Nature Biotech. 1 Jul 2012 (doi: 10.1038/nbt.2288).
Bentley, D. R. et al. Accurate whole human genome sequencing using reversible terminator chemistry. Nature 456, 53–59 (2008).
Beres, S. B. et al. Molecular complexity of successive bacterial epidemics deconvoluted by comparative pathogenomics. Proc. Natl Acad. Sci. USA 107, 4371–4376 (2010).
Bos, K. I. et al. A draft genome of Yersinia pestis from victims of the Black Death. Nature 478, 506–510 (2011).
Bowers, J. et al. Virtual terminator nucleotides for next-generation DNA sequencing. Nature Methods 6, 593–595 (2009).
Branton, D. et al. The potential and challenges of nanopore sequencing. Nature Biotech. 26, 1146– 1153 (2008).
Caruccio, N. in High-Throughput Next Generation Sequencing: Methods and Applications. Methods in Molecular Biology Vol. 733 (eds Kwon, Y. M. & Ricke, S. C.) 241–255 (Humana Press, 2011).
Chaudhuri, R. R. et al. xBASE2: a comprehensive resource for comparative bacterial genomics. Nucleic Acids Res. 36, D543–D546 (2008).
Chevreux, B. et al. Using the miraEST assembler for reliable and automated mRNA transcript assembly and SNP detection in sequenced ESTs. Genome Res. 14, 1147–1159 (2004).
Cramer, N. et al. Microevolution of the major common Pseudomonas aeruginosa clones C and PA14 in cystic fibrosis lungs. Environ. Microbiol. 13, 1690–1704 (2011).
Darling, A. C., Mau, B., Blattner, F. R. & Perna, N. T. Mauve: multiple alignment of conserved genomic sequence with rearrangements. Genome Res. 14, 1394–1403 (2004).
Delcher, A. L., Harmon, D., Kasif, S., White, O. & Salzberg, S. L. Improved microbial gene identification with GLIMMER. Nucleic Acids Res. 27, 4636–4641 (1999).
Didelot, X. & Falush, D. Inference of bacterial microevolution using multilocus sequence data. Genetics 175, 1251–1266 (2007).
Didelot, X., Lawson, D., Darling, A. & Falush, D. Inference of homologous recombination in bacteria using whole-genome sequences. Genetics 186, 1435–1449 (2010).
Domazet-Lošo, M. & Haubold, B. Alignment-free detection of local similarity among viral and bacterial genomes. Bioinformatics 27, 1466–1472 (2011).
Drmanac, R. et al. Human genome sequencing using unchained base reads on self-assembling DNA nanoarrays. Science 327, 78–81 (2010).
Dunham, E. J. et al. Different evolutionary trajectories of European avian-like and classical swine H1N1 influenza A viruses. J. Virol. 83, 5485–5494 (2009).
Eid, J. et al. Real-time DNA sequencing from single polymerase molecules. Science 323, 133–138 (2009).
Fleischmann, R. D. et al. Whole-genome random sequencing and assembly of Haemophilus influenzae Rd. Science 269, 496–512 (1995).
Gardy, J. L. et al. Whole-genome sequencing and social-network analysis of a tuberculosis outbreak. N. Engl. J. Med. 364, 730–739 (2011).
Glenn, T. C. A field guide to next generation DNA sequencers. Mol. Ecol. Res. 11, 759–769 (2011).
Grainger, D. et al. Direct methods for studying transcription regulatory proteins and RNA polymerase in bacteria. Curr. Opin. Microbiol. 12, 531–535 (2009).
Harris, S. R. et al. Evolution of MRSA during hospital transmission and intercontinental spread. Science 327, 469–474 (2011).
Harris, S. R. et al. Whole-genome analysis of diverse Chlamydia trachomatis strains identifies phylogenetic relationships masked by current clinical typing. Nature Genet. 44, 413–419 (2012).
Hess, M. et al. Metagenomic discovery of biomass-degrading genes and genomes from cow rumen. Science 331, 463–467 (2011).
Koren, S. et al. Hybrid error correction and de novo assembly of single-molecule sequencing reads. Nature Biotech. 1 Jul 2012 (doi: 10.1038/nbt.2280).
Köser, C. U. et al. Rapid whole-genome sequencing for investigation of a neonatal MRSA outbreak. N. Engl. J. Med. 366, 2267–2275 (2012).
Lagesen, K. et al. RNAmmer: consistent and rapid annotation of ribosomal RNA genes. Nucleic Acids Res. 35, 3100–3108 (2007).
Langridge, G. C. et al. Simultaneous assay of every Salmonella typhi gene using one million transposon mutants. Genome Res. 19, 2308–2316 (2009).
Levene, M. J. et al. Zero-mode waveguides for single-molecule analysis at high concentrations. Science 299, 682–686 (2003).
Lewis, T. et al. High-throughput whole-genome sequencing to dissect the epidemiology of Acinetobacter baumannii isolates from a hospital outbreak. J. Hosp. Infect. 75, 37–41 (2010).
Lipkin, W. I. Microbe hunting. Microbiol. Mol. Biol. Rev. 74, 363–377 (2010).
Loman, N. J. et al. Performance comparison of bench-top high-throughput sequencing platforms. Nature Biotech. 30, 434–439 (2012).
Margulies, M. et al. Genome sequencing in microfabricated high-density picolitre reactors. Nature 437, 376–380 (2005).
Markowitz, V. M. et al. IMG ER: a system for microbial genome annotation expert review and curation. Bioinformatics 25, 2271–2278 (2009).
Marttinen, P. et al. Detection of recombination events in bacterial genomes from large population samples. Nucleic Acids Res. 40, e6 (2012).
Mellmann, A. et al. Prospective genomic characterization of the German enterohemorrhagic Escherichia coli O104:H4 outbreak by rapid next generation sequencing technology. PLoS ONE 6, e22751 (2011).
Metzker, M. L. Emerging technologies in DNA sequencing. Genome Res. 15, 1767–1776 (2005).
Milne, I. et al. Tablet—next generation sequence assembly visualization. Bioinformatics 26, 401–402 (2010).
Mutreja, A. et al. Evidence for several waves of global transmission in the seventh cholera pandemic. Nature 477, 462–465 (2011).
Pallen, M. J. & Loman, N. J. Are diagnostic and public health bacteriology ready to become branches of genomic medicine? Genome Med. 3, 53 (2011).
Passalacqua, K. D. et al. Structure and complexity of a bacterial transcriptome. J. Bacteriol. 191, 3203–3211 (2009).
Qin, J. et al. A human gut microbial gene catalogue established by metagenomic sequencing. Nature 464, 59–65 (2010).
Richardson, E. J. & Watson, M. The automatic annotation of bacterial genomes. Brief. Bioinform. 9 Mar 2012 (doi: 10.1093/bib/bbs007).
Rohde, H. et al. Open-source genomic analysis of Shiga-toxin-producing E. coli O104:H4. N. Engl. J. Med. 365, 718–724 (2011).
Ronaghi, M., Uhlen, M. & Nyren, P. A sequencing method based on real-time pyrophosphate. Science 281 363–365 (1998).
Rothberg, J. M. et al. An integrated semiconductor device enabling non-optical genome sequencing. Nature 475, 348–352 (2011).
Schattner, P., Brooks, A. N. & Lowe, T. M. The tRNAscan-SE, snoscan and snoGPS web servers for the detection of tRNAs and snoRNAs. Nucleic Acids Res. 33, W686–W689 (2005).
Sharma, C. M. et al. The primary transcriptome of the major human pathogen Helicobacter pylori. Nature 464, 250–255 (2010).
Sorek, R. & Cossart, P. Prokaryotic transcriptomics: a new view on regulation, physiology and pathogenicity. Nature Rev. Genet. 11, 9–16 (2010).
Valouev, A. et al. A high-resolution, nucleosome position map of C. elegans reveals a lack of universal sequence-dictated positioning. Genome Res. 18, 1051–1063 (2008).
van Opijnen, T., Bodi, K. L. & Camilli, A. Tn-seq: high-throughput parallel sequencing for fitness and genetic interaction studies in microorganisms. Nature Methods 6, 767–772 (2009).
Venter, J. C. Multiple personal genomes await. Nature 464, 676–677 (2010).
Woyke, T. et al. Assembling the marine metagenome, one cell at a time. PLoS ONE 4, e5299 (2009).
Zerbino, D. R. & Birney, E. Velvet: algorithms for de novo short read assembly using de Bruijn graphs. Genome Res. 18, 821–829 (2008).
EVIDENCE FOR SEVERAL WAVES OF GLOBAL TRANSMISSION
IN THE SEVENTH CHOLERA PANDEMIC34
Ankur Mutreja,35,* Dong Wook Kim,36,37,* Nicholas R. Thomson,35,*
Thomas R. Connor,35Je Hee Lee,36,38Samuel Kariuki,39
Nicholas J. Croucher,35Seon Young Choi,36,38Simon R. Harris,35
Michael Lebens,40Swapan Kumar Niyogi,41Eun Jin Kim,36T. Ramamurthy,41
Jongsik Chun,38James L. N. Wood,42John D. Clemens,36Cecil Czerkinsky,36
G. Balakrish Nair,41Jan Holmgren,40Julian Parkhill,35and Gordon Dougan35
Vibrio cholerae is a globally important pathogen that is endemic in many areas of the world and causes 3–5 million reported cases of cholera every year. Historically, there have been seven acknowledged cholera pandemics; recent outbreaks in Zimbabwe and Haiti are included in the seventh and on-going pandemic (Chin et al., 2011). Only isolates in serogroup O1 (consisting of two biotypes known as “classical” and “El Tor”) and the derivative O139 (Chun et al., 2009; Hochhut and Waldor, 1999) can cause epidemic cholera (Chun et al., 2009). It is believed that the first six cholera pandemics were caused by the classical biotype, but El Tor has subsequently spread globally and replaced the classical biotype in the current pandemic (Chin et al., 2011). Detailed molecular epidemiological mapping of cholera has been compromised by a reliance on sub-genomic regions such as mobile elements to infer relationships, making El Tor isolates associated with the seventh pandemic seem superficially diverse. To understand the underlying phylogeny of the lineage responsible for the current pandemic, we identified high-resolution
_______________________
34 Reprinted with kind permission from Nature Publishing Group.
35 Wellcome Trust Sanger Institute, Wellcome Trust Genome Campus, Hinxton, Cambridge CB10 1SA, UK.
36 International Vaccine Institute, SNU Research Park, Bongchun 7 dong, Kwanak, Seoul 151-919, Korea.
37 Department of Pharmacy, College of Pharmacy, Hanyang University, Kyeonggi-do 426-791, Korea.
38 Seoul National University, 1 Gwanak-ro, Gwanak-gu, Seoul 151-742, Korea.
39 Centre for Microbiology Research, KEMRI at Kenyatta Hosp Compound, Off Ngong Road, PO Box 43640-00100, Kenya.
40 Department of Microbiology and Immunology and University of Gothenburg Vaccine Research Institute, The Sahlgrenska Academy at the University of Gothenburg, Box 435, 40530 Göteborg, Sweden.
41 National Institute of Cholera and Enteric Diseases, P-33, CIT Scheme XM, Beliaghata, Kolkata 700 010, India.
42 University of Cambridge, Department of Veterinary Medicine, Madingley Road, Cambridge CB3 0ES, UK.
* These authors contributed equally to this work.
markers (single nucleotide polymorphisms; SNPs) in 154 whole-genome sequences of globally and temporally representative V. cholerae isolates. Using this phylogeny, we show here that the seventh pandemic has spread from the Bay of Bengal in at least three independent but overlapping waves with a common ancestor in the 1950s, and identify several transcontinental transmission events. Additionally, we show how the acquisition of the SXT family of antibiotic resistance elements has shaped pandemic spread, and show that this family was first acquired at least ten years before its discovery in V. cholerae.
Main
Whole-genome analysis is perhaps the ultimate approach to building a robust phylogeny in recently emerged pathogens, through the identification of SNPs and other rare genetic variants (Harris et al., 2010). Therefore, we sequenced the genomes of 136 isolates of V. cholerae, the causative agent of several million cholera cases each year (http://www.who.int/mediacentre/factsheets/fs107/en/). These sequences, including 113 isolates from the seventh pandemic, were added to 18 previously published genomes (CDC, 2010; Chin et al., 2011; Chun et al., 2009) to produce a global genomic database from isolates collected in the course of a century. We included representative El Tor isolates collected in the past four decades and compared these to previously reported and novel genome sequences of both classical and non-O1 types (Chin et al., 2011; Chun et al., 2009).
The sequence reads were mapped to the reference sequence of El Tor N16961 (Heidelberg et al., 2000), a seventh-pandemic V. cholerae that was isolated in Bangladesh in 1975 (see footnote to Supplementary) and the resulting consensus tree identified eight distinct phyletic lineages (L1–L8, see Supplementary Fig. 1 and Supplementary Table 1 for strain and lineage information), six of which incorporated O1 clinical isolates. The classical isolates formed a distinct, highly clustered group (L1), distant from the El Tor isolates of the seventh pandemic (L2). It is clear from Supplementary Fig. 1 that the classical and El Tor clades did not originate from a recent common ancestor and instead seem to be independent derivatives with distinct phylogenetic histories, consistent with previous proposals (Chun et al., 2009). Isolates of L4 share a common ancestor with previously reported non-conventional O1 isolates (Chun et al., 2009) (Supplementary Fig. 2), and are likely to have acquired the O1 antigen genes by a recombination event onto a genetically distinct genome backbone. Isolates of L7 also have a distinct backbone, whereas L2, L3 (USA Gulf coast strains), L5, L6 and L8 share a more “El-Tor-like” genome backbone, and the L1 backbone is of the “classical” type.
Genome-wide SNP analysis showed that the 123 El Tor isolates in the L2 cluster (Supplementary Fig. 1) differed from the reference by only 50–250 SNPs. With this large sample size we were able to construct a high-resolution phylogeny that shows unequivocally that the current pandemic is monophyletic and
originated from a single source, providing a framework for future epidemiological and phenotypic analysis of V. cholerae, including transmission-tracking and typing.
Predicted recombined regions were identified, and along with genomic islands and mobile genetic elements, these were initially excluded from the phylogenetic analysis of seventh-pandemic isolates, to determine the underlying phylogeny. Notably, analysis of the tree (Figure A10-1; see Supplementary Fig. 3 for a tree with strain names) provides clear evidence of a clonal expansion of the
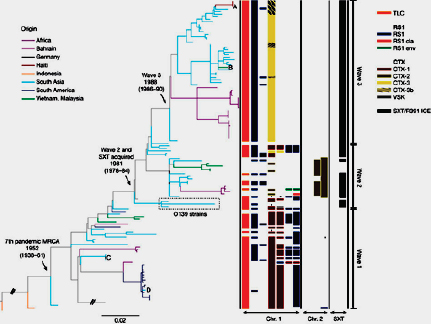
lineage, with a strong temporal signature. This is most clearly illustrated by the fact that the most divergent isolates from the N16961 reference are represented by the oldest seventh-pandemic isolate in our collection, A6, collected in 1957, together with the most recent Haitian isolates (CDC, 2010) from late 2010. We performed a linear regression analysis on all the L2 isolates to calculate the rate of SNP accumulation on the basis of the date of isolation and the root-to-tip distance. The shape of the tree and temporal signatures in Fig. A10-1 show a very consistent rate of SNP accumulation, 3.3 SNPs year–1 (R2 = 0.73, Supplementary Fig. 4) in the core genome, emphasizing the tree’s robustness and utility for transmission studies. The only exception to this is V. cholerae A4, a repeatedly passaged laboratory strain that was originally isolated in 1973 (Supplementary Figs 3 and 4). The estimated rate of mutation for our seventh-pandemic V. cholerae collection was 8.3×10⁻⁷ SNPs site–1 year–1: between 5 and 2.5 times slower than the rate estimated for recent clonal expansions of some other human-pathogenic bacteria (Croucher et al., 2011; Harris et al., 2010).
The seventh-pandemic tree can be subdivided into three major groups or clades by clustering using Bayesian analysis of population structure (Corander et al., 2003, 2008) (shown as waves 1–3 in Figure A10-1); this clustering is mostly consistent with the cholera toxin (CTX) type of the three clades, which represent independent waves of transmission. Although examples of genetic determinants differentiating these three CTX types have previously been published (Safa et al., 2010), they have not been put into a phylogenetic context, undermining efforts to investigate the evolutionary aspects of their emergence. Perhaps as a result, there has been substantial uncertainty in naming new CTX types as they have been discovered. Our data shows that the first CTX type is canonical CTX El Tor and we propose that it is renamed CTX-1; for the other two we propose a new expandable nomenclature and class them as CTX-2 and CTX-3 (Supplementary Table 2).
Isolates spanning A18 to PRL5 (the lower clade in Figure A10-1) represent wave 1, covering about 16 years (1977–1992). All isolates in this group lack the integrative and conjugative element (ICE) of the SXT/R391 family, encoding resistance to several antibiotics (Garriss et al., 2009; Wozniak et al., 2009). It is within this time period that seventh-pandemic cholera occurred in South America (Heidelberg et al., 2000). Our data show that the South American isolates form a discrete cluster, which also includes a single Angolan isolate collected in 1989. The position of the Angolan isolate at the base of the South American group indicates that transmission to South America may have been via Africa, as previously proposed (Lam et al., 2010). We used BEAST (Drummond et al., 2006) to translate evolutionary distance in SNPs into time (Supplementary Fig. 5) and this indicated that transmission to South America is likely to have occurred between 1981 and 1985. The branch harbouring this West African–South American (WASA) clade is distinguished from all other V. cholerae by the acquisition of novel VSP-2 genes (O’Shea et al., 2004) and a novel genomic island that we
have denoted WASA1 (Supplementary Table 3). Notably, the Angolan isolate A5 and all the South American isolates are discriminated by just ten SNPs. Based on the accumulation rate of 3.3 SNPs year-1 (Supplementary Fig. 4), the 3-year time period between the isolation of A5 and the oldest South American isolate included in this study, A32, is consistent with previous studies indicating that cholera spread as a single epidemic (Lam et al., 2010).
The first acquisition of an SXT/R391 ICE lies at the point of transition from the wave-1 cluster to the wave-2 cluster. Using our dated phylogeny (Supplementary Fig. 5) (Drummond et al., 2006), we were able to date this transition and the first acquisition of SXT/R391 ICE to 1978–84, ten years before its discovery in O139 strains, which also fits with the otherwise surprising discovery of SXT in a Vietnamese strain isolated before 1992 (Bani et al., 2007). This date would also correspond to the most recent common ancestor (MRCA) of the O1 and O139 serogroup isolates. Analysis of the diversity of the common regions of SXT/R391 ICEs in our seventh-pandemic collection (Supplementary Fig. 6) shows that they are discriminated by 3,161 SNPs, compared to only 1,757 SNPs used to define the core whole-genome phylogeny in Figure A10-1. This indicates either that there have been several recombination events within these ICEs, or that they have been acquired independently several times on the tree (Garriss et al., 2009). Isolates from wave 2 represent a discrete cluster that shows a complex pattern of accessory elements in the CTX locus (Figure A10-1) and a wide phylogeographical distribution. It is also notable that isolates collected in Vietnam in 1995–2004 and strain A109 are the only wave-2 isolates studied from this time period that lack an SXT/R391 ICE. We examined the genomic locus in these clones that marks the point of insertion of SXT/R391 ICE in all other V. cholerae isolates and found no remnants of this conjugative element, which may have been lost from this lineage (no “scar” in DNA sequence is expected after the precise excision of SXT/R391 ICE).
Ignoring the CTX-related genomic regions, the seventh-pandemic L2 isolates show relatively little evidence of recombination either within or from outside the tree. On the basis of the SNP distribution, 1,930 out of 2,027 SNPs (Supplementary Table 4) are congruent with the tree, leaving 97 homoplasies that could be due to selection or homologous recombination among the L2 isolates. Only 270 SNPs were predicted to be due to homologous recombination from outside the tree. The only two branches in which the SNP distribution indicated considerable recombination were those leading to the WASA cluster (Supplementary Fig. 7) and the O139 serogroup. Aside from the acquisitions of CTX and the SXT/R391 ICEs, we found evidence of gene flux affecting only 155 other genes (Supplementary Figs 8 and 9 and Supplementary Table 3).
Also represented in our collection are two isolates of serogroup O139, which are known to have arisen from a homologous replacement of their O-antigen determinant into an El Tor genomic backbone (Chun et al., 2009; Hochhut and Waldor, 1999; Lam et al., 2010). CTX types that are different from El Tor,
classical, CTX-2 and CTX-3 have been reported for the O139 serogroup (Basu et al., 2000; Faruque and Mekalanos, 2003; Faruque et al., 2000; Nair et al., 1994); however, the phylogenetic position of the two strains included in this study shows that O139 was derived from O1 El Tor and therefore represents another distinct but spatially restricted wave from the common source.
We were also able to date the ancestor of the El Tor seventh-pandemic lineage, L2, as having existed in 1827–1936 (Supplementary Fig. 5), which is consistent with the predicted date of origin from the linear regression plot (1910, Supplementary Fig. 4). This also corresponds well with the date of isolation of the first El Tor biotype strain in 1905 (Cvjetanovic and Barua, 1972).
It is apparent from Figure A10-1 that V. cholerae wave 1, which spread globally, was later replaced by the more geographically restricted wave 2 and wave 3, a phenomenon supported by local clinical observations and phage analysis (Safa et al., 2010). This also reflects the fact that V. cholerae epidemics since 2003–2010 have been restricted to Africa and south Asia. Notably, the rates of SNP accumulation calculated independently for wave 1, wave 3 and wave 2 (2.3, 2.6 and 3.5 SNPs year–1 respectively) are consistent with the rate calculated over the whole collection period (Supplementary Fig. 4).
The clonal clustering of L2 isolates, the constant rate of SNP accumulation and the temporal and geographical distribution support the concept that the seventh pandemic has spread by periodic radiation from a single source population located in the Bay of Bengal, followed by local evolution and ultimately local extinction in non-endemic areas. This is evidenced by the disappearance of wave-1 isolates, followed by the independent expansion of waves 2 and 3, both derived from the same original population, occurring within seven years of each other. These two waves are clearly distinguished from the first by the acquisition of SXT/R391 ICEs (Figure A10-1). Plotting the intercontinental spread of each wave onto the world map (Figure A10-2) clearly shows that the V. cholerae seventh pandemic is sourced from a single, restricted geographical location but has spread in overlapping waves. In these ancestral waves, there are at least four recent long-range transmission events (A–D in Figure A10-1), in which isolates clearly share a common ancestor with recent strains at distant locations, indicating that such events are not uncommon. The most recent example of this is the Haitian outbreak, in which strains share a very recent common ancestor with south-Asian strains at the tip of wave 3. The number of SNP differences, even at whole-genome resolution, between the Haitian and the most closely related Indian and Bangladeshi strains is very low. This demonstrates that the Haitian strains must have come from south Asia, at most within the last six years. However, the limited discrimination means that it may prove challenging to make country-specific inferences as to the origins of the Haitian strains on the basis of DNA sequence alone. For such conclusions to be robust, great care must be taken in the selection of samples for analysis.
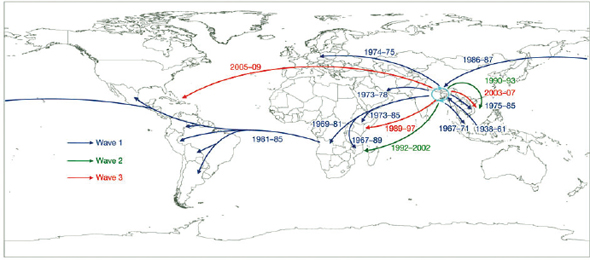
Despite clear evidence of sporadic long-range transmission events that are likely to be associated with direct human carriage, the overall pattern seen in our data is one of continued local evolution of V. cholerae in the Bay of Bengal, with several independent waves of global transmission resulting in short-term epidemics in non-endemic countries. Although our sample set is substantial, there are clearly areas where geographical coverage is limited. However, the structure of the tree, with deep branches between the major waves, means that increasing the number of strains and the resolution further should only identify further independent waves of transmission. Indeed, we cannot rule out the possibility of an El Tor population persisting or evolving as a new wave of the seventh pandemic; for example, in areas such as China that were not sampled in this study.
One notable factor in the ongoing evolution of pandemic cholera was the acquisition of the SXT/R391-family antibiotic resistance element. The clinical use of the antibiotics tetracycline and furazolidone for cholera treatment started in 1963 and 1968 respectively, about 15 years before our prediction of the first acquisition of an SXT/R391 ICE (1978–1984). Our analysis provides a robust framework for elucidating the evolution of the seventh pandemic further, and for studying the local evolution, particularly in the Bay of Bengal, that has such a key role in the evolution of cholera.
Methods
Genomic Library Creation and Multiplex Sequencing
Unique index-tagged libraries for each sample were created, and up to 12 separate libraries were sequenced in each of eight channels in Illumina Genome Analyser GAII cells with 54-base paired-end reads. The index-tag sequence information was used for downstream processing to assign reads to the individual samples (Harris et al., 2010).
Detection of SNPs in the Core Genome
The 54-base paired-end reads were mapped against the N16961 El Tor reference (accession numbers AE003852 and AE003853) and SNPs were identified as described in Croucher et al. (2011). The unmapped reads and the sequences that were not present in all genomes were not considered a part of the core genome, and therefore SNPs from these regions were not included in the analysis. Appropriate SNP cutoffs were chosen to minimize the number of false-positive and false-negative calls; SNPs were filtered to remove those at sites with a SNP quality score lower than 30, and SNPs at sites with heterogeneous mappings were filtered out if the SNP was present in fewer than 75% of reads at that site. From the seventh-pandemic data set, high-density SNP clusters indicating possible recombination were excluded (Croucher et al., 2011). In total, 2,027 SNPs
were detected in the core genome of the El Tor lineage. Of these, 270 SNPs were predicted to be due to recombination. Removing these provided a data set characterized by 1,757 SNPs: these were used to produce the final phylogeny.
Comparative Genomics
Raw Illumina data were split to generate paired-end reads, and assembled using a de novo genome-assembly program, Velvet v0.7.03 (Zerbino et al., 2008), to generate a multi-contig draft genome for each of 133 V. cholerae strains (Harris et al., 2010). The overlap parameters were optimized to give the highest N50 value. Because seventh-pandemic V. cholerae strains are closely related in the core, Abacas (Assefa et al., 2009) was used to order the contigs using the N16961 El Tor strain as a reference, followed by annotation transfer from the reference strain to each draft genome (Harris et al., 2010). Using the N16961 sequence as a database to perform a TBLASTX (Altschul et al., 1990) for each draft genome, a genome comparison file was generated that was subsequently used in the Artemis comparison tool (Carver et al., 2008) to compare the genomes manually and search for novel genomic islands.
Phylogenetic Analysis
A phylogeny was drawn for V. cholerae using RAxML v0.7.4 (Stamatakis, 2006) to estimate the trees for all SNPs called from the core genome. The general time-reversible model with gamma correction was used for among-site rate variation for ten initial trees (Harris et al., 2010). USA Gulf coast strains A215 and A325, which have substantially different core genomes from all other strains in our collection, were used as an outgroup to root the global phylogeny (Supplementary Fig. 1), whereas a pre-seventh-pandemic strain, M66 (accession numbers CP001233 and CP001234), and strain A6 (from our collection), were used to root the seventh-pandemic phylogenetic tree (Figure A10-1).
CTX Prophage Analysis
For each strain, the CTX structure and the sequence of rstA, rstR and ctxB was determined as in Lee et al. (2009) and Nguyen et al. (2009).
Linear Regression and Bayesian Analysis
The phylogram for the seventh pandemic was exported to Path-O-Gen v1.3 (http://tree.bio.ed.ac.uk/software/pathogen) and a linear regression plot for isolation date versus root-to-tip distance was generated. The same plot was also constructed individually for the three waves, but A4, being a laboratory strain, was excluded from the latter analysis.
The presence of three waves was checked, and their makeup was determined, using a BAPS analysis performed on the SNP alignment containing the unique SNP patterns from the seventh-pandemic isolates. The program was run using the BAPS individual mixture model, and three independent iterations were performed using an upper limit for the number of populations of 20, 21 and 22 to obtain optimal partitioning of the sample. The dates for the acquisition of SXT and the ancestors of the three waves were inferred using the Bayesian Markov chain Monte Carlo framework BEAST (Drummond and Rambaut, 2007). We used the final SNP alignment with recombinant sites removed and fixed the tree topology to the phylogeny produced by RAxML, as described above. We used BEAST to estimate the rates of evolution on the branches of the tree using a relaxed molecular clock (Drummond et al., 2006), which allows rates of evolution to vary amongst the branches of the tree. BEAST produced estimates for the dates of branching events on the tree by sampling dates of divergence between isolates from their joint posterior distribution, in which the sequences are constrained by their known date of isolation. The data were analysed using a coalescent constant population size and a general time-reversible model with gamma correction. The results were produced from three independent chains of 50 million steps each, sampled every 10,000 steps to ensure good mixing. The first 5 million steps of each chain were discarded as a burn-in. The results were combined using Log Combiner, and the maximum clade credibility tree was generated using Tree Annotator, both parts of the BEAST package (http://tree.bio.ed.ac.uk/software/beast/). Convergence and the effective sample-size values were checked using Tracer 1.5 (available from http://tree.bio.ed.ac.uk/software/tracer). ESS values in excess of 200 were obtained for all parameters.
Nomenclature
The seventh-pandemic cholera strains were clearly distinguished by three waves and we therefore propose their CTX types to be CTX-1, CTX-2 and CTX-3 under the new nomenclature scheme (see Supplementary Table 2). Our nomenclature system is expandable and would be suitable for naming any new seventh-pandemic V. cholerae strains. With CTX-1 representing canonical El Tor, we followed the rationale: (1) For CTX-1 to CTX-2, because there was a shift of rstREl Tor to rstRClassical, rstAEl Tor to rstAClassical + El Tor and ctxBEl Tor to ctxBClassical, we called it CTX-2; (2) for CTX-1 to CTX-3, because there was a shift of ctxBEl Tor to ctxBClassical, we called it CTX-3; (3) for CTX-3 to CTX-3b, because there was only one SNP mutation in ctxBClassical from CTX-2 and rest was identical, we called it the next variant of CTX-3, which is CTX-3b.
In summary, if there is a shift of any gene from one biotype to another, the new CTX will be called CTX-n: thus the next strains fitting these criteria will be called CTX-4. However, if there is a mutation(s) that does not lead to a shift
of the gene to another biotype gene, CTX-1b, CTX-1c or CTX-2b; CTX-2c or CTX-3b; CTX-3c and so on should be followed as appropriate.
Methods Summary
Genomic libraries were created for each sample, followed by multiplex sequencing on an Illumina GAIIx analyser. The 54-base paired-end reads obtained were mapped against N16961 El Tor as a reference and SNPs in the core genome were identified as described in Methods. The SNPs were used to draw a whole coregenome phylogeny as described in Harris et al. (2010). The final SNP alignment was used to perform BEAST (Drummond et al., 2006) analysis and to confirm the output of linear regression analysis. The three cholera waves reported in the seventh-pandemic phylogeny were confirmed using BAPS (Corander et al., 2003, 2008). The raw Illumina data were also assembled de novo (see Methods) so that pairwise genome comparisons could be made. A new and expandable nomenclature system describing the CTX trends seen in the last 40 years was proposed following the rationale described in Methods.
Full methods and any associated references are available in the online version of the paper at www.nature.com/nature.
Acknowledgements
This work was supported by The Wellcome Trust grant 076964. The IVI is supported by the Governments of Korea, Sweden and Kuwait. D.W.K. was partially supported by grant RTI05-01-01 from the Ministry of Knowledge and Economy (MKE), Korea and by R01-2006-000-10255-0 from the Korea Science and Engineering Foundation; and J.L.N.W. was supported by the Alborada Trust and the RAPIDD program of the Science & Technology Directorate, Department of Homeland Security. Thanks to A. Camilli at Tufts University Medical School for providing the corrected N16961 sequence, to B.M. Nguyen at NIHE, Vietnam, and M. Ansaruzzaman at ICDDR, Bangladesh for providing strains, and to M. Fookes at WTSI for training support.
Author Contributions
A.M., D.W.K. and N.R.T. collected the data, analysed it and performed phylogenetic analyses and comparative genomics. J.H.L., S.Y.C., E.J.K. and J.C. analysed the CTX types. S.K., S.K.N. and T.R. were involved in strain collection and serogroup analysis. T.R.C. performed Bayesian analysis; N.J.C. and S.R.H. did the computational coding. J.L.N.W., J.D.C., C.C., G.B.K., J.H., N.R.T., J.P. and G.D. were involved in the study design. A.M., N.R.T., J.P., G.D., J.H., G.B.K., N.J.C., S.R.H., T.R.C., D.W.K. and M.L. contributed to the manuscript writing.
Altschul, S. F., Gish, W., Miller, W., Myers, E. W. & Lipman, D. J. Basic local alignment search tool. J. Mol. Biol. 215, 403–410 (1990)
Assefa, S., Keane, T. M., Otto, T. D., Newbold, C. & Berriman, M. ABACAS: algorithm-based automatic contiguation of assembled sequences. Bioinformatics 25, 1968–1969 (2009)
Bani, S. et al. Molecular characterization of ICEVchVie0 and its disappearance in Vibrio cholerae O1 strains isolated in 2003 in Vietnam. FEMS Microbiol. Lett. 266, 42–48 (2007)
Basu, A. et al. Vibrio cholerae O139 in Calcutta, 1992–1998: incidence, antibiograms, and genotypes. Emerg. Infect. Dis. 6, 139–147 (2000)
Carver, T. et al. Artemis and ACT: viewing, annotating and comparing sequences stored in a relational database. Bioinformatics 24, 2672–2676 (2008)
CDC. 2010. Update: cholera outbreak—Haiti, 2010. MMWR Morb. Mortal Wkly Rep. 59, 1473–1479 (2010)
Chin, C. S. et al. The origin of the Haitian cholera outbreak strain. N. Engl. J. Med. 364,33–42 (2011)
Chun, J. et al. Comparative genomics reveals mechanism for short-term and long-term clonal transitions in pandemic Vibrio cholerae. Proc. Natl Acad. Sci. USA 106,15442–15447 (2009)
Corander, J., Marttinen, P., Siren, J. & Tang, J. Enhanced Bayesian modelling in BAPS software for learning genetic structures of populations. BMC Bioinformatics 9, 539 (2008)
Corander, J., Waldmann, P. & Sillanpaa, M. J. Bayesian analysis of genetic differentiation between populations. Genetics 163, 367–374 (2003)
Croucher, N. J. et al. Rapid pneumococcal evolution in response to clinical interventions. Science 331, 430–434 (2011)
Cvjetanovic, B. & Barua, D. The seventh pandemic of cholera. Nature 239, 137–138 (1972)
Drummond, A. J. & Rambaut, A. BEAST: Bayesian evolutionary analysis by sampling trees. BMC Evol. Biol. 7, 214 (2007)
Drummond, A. J., Ho, S. Y., Phillips, M. J. & Rambaut, A. Relaxed phylogenetics and dating with confidence. PLoS Biol. 4, e88 (2006)
Faruque, S. M. & Mekalanos, J. J. Pathogenicity islands and phages in Vibrio cholerae evolution. Trends Microbiol. 11, 505–510 (2003)
Faruque, S. M. et al. The O139 serogroup of Vibrio cholerae comprises diverse clones of epidemic and nonepidemic strains derived from multiple V. cholerae O1 or non-O1 progenitors. J. Infect. Dis. 182, 1161–1168 (2000)
Garriss, G., Waldor, M. K. & Burrus, V. Mobile antibiotic resistance encoding elements promote their own diversity. PLoS Genet. 5, e1000775 (2009)
Harris, S. R. et al. Evolution of MRSA during hospital transmission and intercontinental spread. Science 327, 469–474 (2010)
Heidelberg, J. F. et al. DNA sequence of both chromosomes of the cholera pathogen Vibrio cholerae. Nature 406, 477–483 (2000)
Hochhut, B. & Waldor, M. K. Site-specific integration of the conjugal Vibrio cholerae SXT element into prf. C. Mol. Microbiol. 32, 99–110 (1999)
Lam, C., Octavia, S., Reeves, P., Wang, L. & Lan, R. Evolution of seventh cholera pandemic and origin of 1991 epidemic, Latin America. Emerg. Infect. Dis. 16, 1130–1132 (2010)
Lee, J. H. et al. Classification of hybrid and altered Vibrio cholerae strains by CTX prophage and RS1 element structure. J. Microbiol. 47, 783–788 (2009)
Nair, G. B., Bhattacharya, S. K. & Deb, B. C. Vibrio cholerae O139 Bengal: the eighth pandemic strain of cholera. Indian J. Public Health 38, 33–36 (1994)
Nguyen, B. M. et al. Cholera outbreaks caused by an altered Vibrio cholerae O1 El Tor biotype strain producing classical cholera toxin B in Vietnam in 2007 to 2008. J. Clin. Microbiol. 47, 1568–1571 (2009)
O’Shea, Y. A. et al. The Vibrio seventh pandemic island-II is a 26.9 kb genomic island present in Vibrio cholerae El Tor and O139 serogroup isolates that shows homology to a 43.4 kb genomic island in V. vulnificus. Microbiology 150, 4053–4063 (2004)
Safa, A., Nair, G. B. & Kong, R. Y. Evolution of new variants of Vibrio cholerae O1. Trends Microbiol. 18, 46–54 (2010)
Stamatakis, A. RAxML-VI-HPC: maximum likelihood-based phylogenetic analyses with thousands of taxa and mixed models. Bioinformatics 22, 2688–2690 (2006)
Wozniak, R. A. et al. Comparative ICE genomics: insights into the evolution of the SXT/R391 family of ICEs. PLoS Genet. 5, e1000786 (2009)
Zerbino, D. R. & Birney, E. Velvet: algorithms for de novo short read assembly using de Bruijn graphs. Genome Res. 18, 821–829 (2008)
MULTI-PARTNER INTERACTIONS IN CORALS
IN THE FACE OF CLIMATE CHANGE43
Koty H. Sharp44,* and Kim B. Ritchie45
Abstract
Recent research has explored the possibility that increased sea-surface temperatures and decreasing pH (ocean acidification) contribute to the ongoing decline of coral reef ecosystems. Within corals, a diverse microbiome exerts significant influence on biogeochemical and ecological processes, including food webs, organismal life cycles, and chemical and nutrient cycling. Microbes on coral reefs play a critical role in regulating larval recruitment, bacterial colonization, and pathogen abundance under ambient conditions, ultimately governing the overall resilience of coral reef systems. As a result, microbial processes may be involved in reef ecosystem-level responses to climate change. Developments of new molecular technologies, in addition to multidisciplinary collaborative research on coral reefs, have led to the rapid advancement in our understanding of bacterially mediated reef responses to environmental change. Here we review new discoveries regarding (1) the onset of coral-bacterial associations; (2) the functional roles that bacteria play in healthy corals; and (3) how bacteria influence coral reef response to environmental change, leading to a model describing how reef microbiota direct ecosystem-level response to a changing global climate.
_______________________
43 Sharp, K. H., and K. B. Ritchie. 2012. Biological Bulletin 174: 319–329. Used with permission from the Marine Biological Laboratory, Woods Hole, MA.
44 Eckerd College, 4200 54th Avenue South, St. Petersburg, Florida 33711.
45 Mote Marine Laboratory, 1600 Ken Thompson Parkway, Sarasota, Florida 34236.
* To whom correspondence should be addressed. E-mail: sharpkh@eckerd.edu.
The health of coral reefs is declining on a global scale and continues to be threatened by overfishing and habitat destruction. Anthropogenically induced global climate change has been identified as a significant threat to these sensitive ecosystems. As temperatures rise, bleaching and diseases are increasing, and excess atmospheric carbon dioxide is greatly altering reef ecosystems by changing seawater chemistry through decreases in pH (Anthony et al., 2011).
In a recent review, Bosch and McFall-Ngai (2011) highlight the significance of viewing animals as “metaorganisms”—multicellular organisms consisting of a macroscopic host and multiple microorganisms that interact synergistically to shape the ecology and evolution of the entire association. In this sense, the term metaorganism can be applied to a broad range of animal-microbe symbioses, ranging from humans to sponges (Bosch and McFall-Ngai, 2011). Coral research within this perspective has revolutionized the way that researchers study corals. In scleractinian (hard) corals, the term “holobiont” (Knowlton and Rohwer, 2003) was adapted to indicate that corals are dynamic, multi-domain assemblages consisting of an animal host, symbiotic dinoflagellates in the genus Symbiodinium, bacteria, archaea, fungi, and viruses (Rohwer et al., 2001, 2002; Stat et al., 2006; Wegley et al., 2007; Thurber et al., 2009). The term metaorganism is especially useful for describing corals and reflecting that corals’ response to environmental change is driven by physiological interactions among the various microorganisms associated with the tissue, skeleton, and mucous layer. Corals harbor Symbiodinium, which provides fixed carbon to the host via photosynthesis, serving as the trophic foundation for coral reef ecosystems. It has been proposed that corals have additionally evolved to exploit specific bacterial metabolic capabilities that, in turn, directly modulate the survival of the coral holobiont in the marine environment (Zilber-Rosenberg and Rosenberg, 2008). An extensive characterization of the diverse microorganisms in corals will guide our understanding of the ecology of corals and coral reef ecosystems in response to a changing global climate.
Coral microbiology is a rapidly growing area of study. Early culture-based studies of coral-associated bacteria provided a foundation from which genomics, metagenomics, and transcriptomics approaches were established in corals, leading to exciting new advances in our current understanding of the diversity and dynamics of coral-associated bacterial communities. Evidence is accumulating that bacteria have an enormous influence on coral health and resilience, particularly with respect to changing reef environments (Azam and Worden, 2004; Rosenberg et al., 2007; Bourne et al., 2009; Ainsworth et al., 2010; Garren and Azam, 2012). The field of marine microbial ecology underwent a revolution in the 1990s, when culture-independent molecular techniques revealed that bacterial diversity from culture-based assessments was largely underestimated (Azam, 1998). Studies of persistent associations between corals and bacteria, both beneficial and pathogenic, were enhanced by new methods and approaches from this revolution. Those techniques were adopted by coral microbiologists, resulting in
the discovery that particular components of bacterial communities are specific to some coral host species (Rohwer et al., 2002).
The cost and time associated with characterizing these complex bacterial assemblages initially posed a challenge to scientists attempting to identify patterns of diversity across a large scale. However, the gradually decreasing cost and increasing efficiency of high-throughput methods, including 454 pyrosequencing technology, allowed researchers to perform community 16S rRNA gene profiling and metagenome sequencing in a broad range of coral specimens. Recent applications of 16S pyrosequencing in corals have produced hundreds of thousands of 16S sequences—in contrast to hundreds of sequences from cloning methods. Results from pyrosequencing-based studies provide evidence of the presence of “coral-specific” groups of bacterial ribotypes (Reis et al., 2009; Kvennefors et al., 2010; Sunagawa et al., 2010; Ceh et al., 2011). Experiments investigating the bacterial component of coral surface mucous layers suggest that the composition of bacterial communities in coral mucus is distinct from other surface-associated biofilms and is influenced by the physical and biochemical properties of the mucus (Barott et al., 2011; Sweet et al., 2011b). Although corals maintain specific groups of bacteria, variation among individuals of a coral species may occur according to location (Guppy and Bythell, 2006; Littman et al., 2009; Kvennefors et al., 2010; Ceh et al., 2011).
Bacterial communities are maintained in microhabitats within an individual coral host, spatially structured within chemical micro-niches, or compartments, in the skeleton, tissues, and surface mucous layer of corals (Rohwer et al., 2001, 2002; Daniels et al., 2011; Sweet et al., 2011a). This spatial microheterogeneity is similar to previously described trends in the speciation of the dinoflagellate Symbiodinium in branching acroporid corals (Rowan and Knowlton, 1995). With that in mind, new collection techniques and apparatuses have recently been developed to enable collection from specific compartments of the coral, with minimized contamination by bacteria from other compartments (Sweet et al., 2011a).
Recent research surveying bacterial communities in a large number of marine sponges suggests that bacteria detected in sponges can be classified in three categories (Schmitt et al., 2011): core (groups of bacteria that are shared across many sponges), species-specific (groups of bacteria that are specific to certain sponge hosts), and variable (groups of bacteria that are transiently associated with the host, probably due to passive attachment from seawater). The recent composition analyses of bacterial assemblages in corals indicate that a similar classification scheme can be applied to coral-associated bacteria. An interesting difference between corals and sponges is that while many sponges have been documented to transmit diverse, specific bacterial communities in their gametes or larvae (Schmitt et al., 2007; Sharp et al., 2007), most corals appear to acquire specific bacteria from the seawater each generation (Apprill et al., 2009; Sharp et al., 2010). The mechanisms by which corals selectively and specifically recruit their core and specific bacterial components are largely undescribed, but they
likely involve the physical properties and the chemical structure of the mucous layer, which is thought to be unique in specific coral species (Bythell and Wild, 2011). Bacteria that successfully colonize the mucus are, in turn, involved in cycling nutrients and organic compounds in corals and on the reefs, and the resident microbes have the potential to modulate the bacterial community structure in coral mucus and tissue.
Here we review recent advances in the study of the coral metaorganism and specifically address (1) the onset of coral-bacterial associations; (2) the functional roles that bacteria play in healthy corals; and (3) how bacteria influence coral reef response to environmental change. These new discoveries are the basis for a model of how coral-associated and reef-inhabiting microbiota influence ecosystem-level responses to global climate change.
Onset of Coral-Bacterial Associations
The Caribbean coral Porites astreoides has been shown to transmit a bacterial component to its offspring (Sharp et al., 2012). However, this seems to be an exception to the rule in scleractinian corals. In eight other coral species that have been examined (Apprill et al., 2009; Sharp et al., 2010), corals do not appear to inherit bacteria from parents; rather, bacterial colonization occurs in planula larvae or post-settlement stages. Many bacterial phylotypes detected in planulae and post-settlement stages of P. astreoides have also been documented in the adult (Wegley et al., 2007), suggesting that corals acquire specific bacterial phylotypes.
Exploration of bacterial communities in early life stages of corals has not only provided new information about bacterial infection in corals, but it has also simplified analysis of diversity and dynamics of bacterial communities in corals across spatiotemporal scales. In contrast to their adult counterparts, swimming planula larvae of most corals have not yet accumulated a high bacterial load from the surrounding environment or by feeding (Apprill et al., 2009; Sharp et al., 2010); as a result, it is more tractable to characterize and quantify the associated bacterial component in these larvae. Similar phylogenetic clades of bacteria were detected in 16S rRNA gene sequence clone libraries from multiple larval specimens of the Caribbean coral Porites astreoides (Sharp et al., 2012) and in the Pacific coral Pocillopora meandrina (Apprill et al., 2009), suggesting that some groups of bacteria are common across different coral species. A number of bacterial types have been commonly detected in multiple species of corals, but of particular interest are those belonging to the phylum α-proteobacteria (Apprill et al., 2009; Raina et al., 2009; Sharp et al., 2012). The α-proteobacteria (particularly the Roseobacteriales) are abundant in the oceans, often constituting a third of the bacterioplankton (Wagner-Dobler and Biebl, 2006). This same group of bacteria is also closely associated with phytoplankton, including the dinoflagellate coral endosymbiont Symbiodinium (Webster et al., 2004). Many of these bacteria, now classified as Ruegeria spp., were originally designated Silicibacter
spp. (Yi et al., 2007). It is unknown whether these bacteria play a functional role in corals, but their consistent detection in early life stages of corals and in seawater during coral spawning may be an indication that they are significant to the health of larvae, or even to adult colonies (Apprill et al., 2009; Apprill and Rappe, 2011; Sharp et al., 2012).
New research focusing on the molecular basis of bacterial colonization of the coral tissues or surface mucous layer indicates that coral mucous biofilm communities are a result of selection processes driven by the coral holobiont rather than by incidental attachment by bacteria in the seawater (Sweet et al., 2011b). This is consistent with recent findings from studies in the cnidarians Hydra, in which researchers found that the composition of the surface-associated bacterial community is driven directly by host metabolism and production of compounds in the surface layer of Hydra (Augustin et al., 2010). It is likely that there are specific molecules that influence colonization in the coral mucous layer. Lectin-mediated uptake of Symbiodinium has been demonstrated in corals (Wood-Charlson et al., 2006), but very little is known about bacterial uptake or invasion in corals.
Functional immunological molecules with bacterial binding capacity have been found in corals, describing a means by which the host may control associated microbial composition (Kvennefors et al., 2008; Kvennefors and Roff, 2009). Molecules that control the activities of other coral-associated microbes are thought to be derived from the coral host and in some cases from the associated bacteria (Ritchie, 2006; Teplitski and Ritchie, 2009; Vidal-Dupiol et al., 2011a,b). As previously described in a broad range of other animal-microbe systems (McFall-Ngai et al., 2012), molecules that direct bacterial infection of animal tissue-associated bacteria may be conserved, regardless of whether the bacteria are beneficial, commensal, or pathogenic.
Role of Bacteria in Health of Coral and Coral Reefs
Recent coral microbiology research has described how bacterial communities contribute to the overall physiology and ecology of apparently healthy corals. These discoveries were made possible both by new molecular technologies and by novel fieldwork-based approaches. Bacteria within corals govern the biogeochemical cycling within coral tissues. In addition, bacteria on surfaces in the reef environment influence and facilitate settlement of coral larval, and resident microbes in corals play a role in defining the composition of the bacterial community in corals.
Studies over the past several years indicate that coral-associated bacteria influence biogeochemical cycling within corals and on reefs. Metagenomic data from the bacterial fraction of DNA from the coral Porites astreoides indicate the presence of numerous genes capable of degrading diverse aromatic compounds (Wegley et al., 2007). Coral-associated bacteria have been shown to be involved in cycling mucous-derived particulate and dissolved organic compounds in the
reef environment (Wild et al., 2004, 2009; Huettel et al., 2006). In addition, the bacterial metagenome of P. astreoides consists of genes encoding enzymes involved in cycling nitrogen via nitrogen fixation, ammonification, nitrification, and denitrification (Wegley et al., 2007). The detection of bacterial nitrogen fixation genes is consistent with previous biochemical research in which cyanobacterial nitrogen fixation was detected (Lesser et al., 2007). Further research focusing on nifH gene diversity in two species of Montipora (Olson et al., 2009) suggests that nitrogen-fixing bacteria in corals are not limited to cyanobacteria but also belong to taxa representing the α-, β-, γ-, and δ-proteobacterial classes (Olson et al., 2009). Bacteria have been shown to be significant players in transforming nitrogen (Fiore et al., 2010) as well as sulfur and carbon compounds (Ferrier-Pages et al., 2001; Raina et al., 2009; Kimes et al., 2010) in corals and on coral reefs.
Bacteria outside of the coral animal also exert influence on the behavior of corals during their early life stages. Particular species of crustose coralline algae (CCAs) have been shown to facilitate larval settlement of the threatened coral species Acropora cervicornis and A. palmata in the Florida Keys and the Caribbean (Ritson-Williams et al., 2010). The integration of microbiological and chemical ecology approaches suggests that the facilitation of larval settlement by CCAs may be regulated by bacteria growing in biofilms on the surface of CCAs (Negri et al., 2001; Webster et al., 2004; Tebben et al., 2011). To date, all of the CCA-associated bacteria implicated in inducing coral metamorphosis and settlement belong to the γ-proteobacteria. A strain of the γ-proteobacterium Pseudoalteromonas sp. isolated from the surface of the CCA species Hydrolithon onkodes induces significant levels of larval metamorphosis in the corals Acropora willisae and A. millepora in laboratory experiments (Negri et al., 2001). Researchers have recently shown that exposure to Pseudoalteromonas isolates cultured from Negoniolithon fosliei and Hydrolithon onkodes significantly increases rates of metamorphosis on the Pacific coral Acropora millepora (Tebben et al., 2011). Bioassay-guided isolation identified the inductive molecule as tetrabromopyrrole (Tebben et al., 2011). Other strains of Pseudoalteromonas and Thalassomonas have also been shown to induce larval settlement and metamorphosis in the coral Pocillopora damicornis (Tran and Hadfield, 2011). Not all tested isolates of Pseudoalteromonas and Thalassomonas were inductive in that study, indicating that the ability to induce settlement is taxon-specific. In addition, the isolation source of the bacteria (algal surface vs. coral surface) was not linked to the strains’ inductive properties (Tran and Hadfield, 2011). Together, these studies indicate that coral recruitment and successful larval attachment and metamorphosis (which is crucial for continued repopulation of coral reef ecosystems) is strongly governed by the activity of specific bacteria in reef environments.
Recent research has focused on the role of bacteria native to the coral surface mucous layer that control bacterial colonization within the mucus, ultimately regulating resistance to disease. Corals have been shown to protect themselves
against pathogen infection via the presence of allelopathic properties in the mucus (Geffen and Rosenberg, 2005; Ritchie, 2006) or the coral tissue (Koh, 1997; Kelman et al., 2006; Gochfeld and Aeby, 2008). However, antimicrobial assays with numerous Red Sea corals reveal that the capabilities of coral species for antibiotic production are highly variable (Kelman et al., 2006). Bacteria isolated from corals are able to inhibit the colonization and growth of many other types of bacteria, including potentially invasive coral pathogens (Reshef et al., 2006; Ritchie, 2006; Wegley et al., 2007; Gochfeld and Aeby, 2008; Nissimov et al., 2009; Shnit-Orland and Kushmaro, 2009; Sharon and Rosenberg, 2010; Kvennefors et al., 2012). In addition, the presence of a high number of genes involved in antibacterial compound biosynthesis have been detected in metagenomes from multiple corals (Wegley et al., 2007; Thurber et al., 2009). It is not clear to what extent these bacteria and the metabolites they produce play a role in community structure. In situ antibiotic production by bacteria is known to be a means of securing a niche by controlling microbial populations competing for the same resources (Nielsen et al., 2000; Rao et al., 2005). It is therefore likely that bacteria in and on the coral host govern the dynamics of coral microbiota.
Although the mechanisms by which mucous-associated bacteria prevent pathogenic infection are still unknown, the data indicate that a sophisticated system of bacterial cell-cell chemical signaling known as quorum sensing (QS) may be involved in microbial pathogenesis in corals. QS is modulated by small diffusible compounds called autoinducers, which are molecules that, when accumulated to a threshold concentration within a diffusion-limited environment, result in synchronized group behaviors. This density-dependent regulation allows bacterial populations to act in unison, effectively magnifying their ecological impact. Though the cell-cell communication systems differ among bacterial species, QS has been demonstrated to regulate many bacterial behaviors, including biofilm formation, antibiotic production, bioluminescence, and pathogenesis (Ng and Bassler, 2009), and it commonly drives important interactions between bacterial communities and their hosts (Rasmussen and Givskov, 2006; Dobretsov et al., 2009).
Quorum sensing in bacterial pathogens is the mechanism by which virulence genes are expressed relative to pathogen density in the host, thereby initiating a coordinated attack once bacterial cell numbers reach a critical mass (Dobretsovet al., 2009). Both eukaryotes and prokaryotes have evolved to recognize and counter QS in pathogens, and there is evidence that eukaryotic signal-mimics can stimulate QS responses in bacteria (Teplitski et al., 2011). Other bacteria can counter-attack by producing quorum-quenching acylases or lactonases that break down signaling molecules (Teplitski et al., 2011). In addition to the signal-degrading enzymes, eukaryotes can inhibit or activate bacterial QS by producing compounds that mimic QS signals. For example, Rajamani et al. (2008) demonstrated that lumichrome, a derivative of the vitamin riboflavin that
is produced by the unicellular alga Chlamydomonas reinhardtii (as well as other prokaryotes and eukaryotes) can interact with the bacterial receptor for QS signals and elicit QS responses.
Quorum sensing may inhibit or activate pathogenesis, antibiotic production, exoenzyme production, and attachment by beneficial bacteria within coral tissues and on surfaces. Coral extracts contain compounds capable of interfering with QS activities (Skindersoe et al., 2008; Alagely et al., 2011) that may be involved in regulating the colonization of coral mucus by pathogens, commensal bacteria, or beneficial bacteria. The source of this activity is difficult to pinpoint and could originate from the coral, the dominant endosymbiont, or any associated bacteria. Alagely et al. (2011) recently showed that both coral- and Symbiodinium-associated bacteria alter swarming and biofilm formation in the coral pathogen Serratia marcescens. These phenotypes are typically controlled by QS, although inhibition of QS by these isolates remains to be demonstrated. There are few studies on the in situ roles of QS in corals, but this process is likely to be used in both pathogenesis and mutualistic interactions (Krediet et al., 2009a,b; Teplitski and Ritchie, 2009; Tait et al., 2010). While it is clear that at least some coral-associated commensals and pathogens produce QS signals under laboratory conditions (Tait et al., 2010; Alagely et al., 2011), it is not clear whether these signals accumulate to threshold concentrations in natural environments.
It is feasible that Symbiodinium spp. also produce signaling molecules that control bacterial cell-cell communication, which would influence the specific complement of bacteria that associate with corals. Perhaps bacterial species-specificity in corals is, in part, driven by Symbiodinium within the coral, but this has yet to be tested. The potential for Symbiodinium to be a source of antibacterial compounds in corals represents an aspect of bioactive compound production that is not yet described. It is likely that the source of antibacterial activity in corals is a combination of allelopathic chemicals produced by the coral, by associated bacteria, or by endosymbiotic dinoflagellates. In a study conducted by Marquis et al. (2005), eggs from 11 coral species were tested for antibacterial activity, and the only species exhibiting antibiotic activity was the one coral species in the study that incorporates Symbiodinium into the egg before the egg is released, suggesting a potential allelopathic contribution of Symbiodinium. It is also possible that coral-associated bioactive compounds are derived from bacteria whose presence or activity is influenced by Symbiodinium, but this has yet to be tested.
Role of Bacteria in Reef Ecosystem Responses to Environmental Change
The latest research on how coral-associated bacterial communities mediate responses of corals and coral reef ecosystems to environmental change addresses shifts in both the phylogenetic structure and metabolic capabilities of bacterial assemblages in corals. Multiple approaches and tools from microbiology, molecular biology, microscopy, and chemical ecology have been used to identify the role
of bacterial communities in response to threats such as increased sea-surface temperature, increased organic carbon and nutrient levels in seawater, increased macroalgal and cyanobacterial cover on reefs, and decreased seawater pH.
Rising sea-surface temperatures are linked to increases in coral diseases worldwide. However, the study of microbial coral diseases has been challenging due to many factors including microbial dynamics in the marine environment, the complications of proving unequivocal disease causation, and insufficient diagnostic tools (Pollock et al., 2011; Weil and Rogers, 2011). Some bacteria identified as coral pathogens include Serratia marcescens (Sutherland et al., 2011), Aurantimonas coralicida (Denner et al., 2003), and a consortium of bacterial and cyanobacteria phylotypes that make up what is known as Black Band Disease (Sekar et al., 2008). The most common bacteria present and problematic for corals are members of the Vibrionaceae that have been implicated in coral bleaching (Kushmaro et al., 1997; Ben-Haim and Rosenberg, 2002) and a myriad of coral diseases (Patterson et al., 2002; Frias-Lopez et al., 2003, 2004; Kline et al., 2006; Cervino et al., 2008). The Vibrionaceae are a common but diverse group of heterotrophic marine bacteria, collectively referred to as vibrios. Vibrios have been shown to be present in higher abundance on coral surfaces before obvious signs of distress (Ritchie, 2006; Mao-Jones et al., 2010). This group includes human pathogens and benign planktonic and animal-associated marine bacteria. Bleaching of the scleractinian coral Oculina patagonica in the eastern Mediterranean Sea was shown to be caused by Vibrio shiloi (Kushmaro et al., 1997). Vibrio coralliilyticus was isolated from bleached corals of the genus Pocillopora damicornis and shown to cause coral bleaching and tissue sloughing (Ben-Haim and Rosenberg, 2002). In these pathogens, toxin production and the ability to infect coral tissue have a strong temperature dependence (Kushmaro et al., 1997; Ben-Haim and Rosenberg, 2002). Vibrio dynamics are affected by water temperature and salinity, yet little else is known about environmental drivers of their abundance and distribution in the marine environment (Johnson et al., 2010). These organisms are often cultured rapidly and are able to utilize a wide range of carbon sources, suggesting that the biogeochemical significance of vibrios may vary with the nutrient state of the environment (Thompson et al., 2004). Some reef organisms are thought to be vectors for coral disease agents, specifically vibrios. These include organisms that come into contact with, or feed on, corals such as fireworms, snails, and corallivorous fishes (Weil and Rogers, 2011). Several recent reviews offer a comprehensive summary of the occurrence and possible environmental determinants of coral diseases (Rosenberg et al., 2009; Pollock et al., 2011; Weil and Rogers, 2011). Research on processes governing pathogen dynamics, abundance, and pathogenesis has informed us on coral defense mechanisms.
The coral surface mucous layer and its resident microbes appear to be significant in defending corals from microbial diseases. Mucus harvested from the coral Acropora palmata during a period of increased seawater temperatures does
not exhibit significant antibiotic activity compared to mucus sampled at lower temperatures (Ritchie, 2006). This suggests that the protective capacity of some corals may be lost when temperatures increase, providing a mechanism to explain how increased temperatures lower coral resistance and increase susceptibility to diseases. In addition, when temperatures increase, the dominant bacterial flora in coral mucus shifts from antibiotic-producing bacteria to pathogens (Ritchie, 2006). This finding indicates that a balance of potentially beneficial microbes may be important for the overall physiological health of reef corals. Rising sea-surface temperatures can cause a breakdown of coral-Symbiodinium symbiosis. In addition, shifting seawater temperatures can simultaneously affect interactions among other microbes, particularly bacteria present in or on the coral, rendering the host susceptible to opportunistic or secondary infection by certain bacteria (Ritchie, 2006; Lesser et al., 2007). Research on the Pacific coral Acropora millepora indicates that after bleaching (the loss of Symbiodinium) there is a dramatic shift to a Vibrio-dominated community (Bourne et al., 2007), but it is unclear whether the bacterial communities are responding to the absence of the Symbiodinium, to physiological changes in the coral host, or to the increased light and sea-surface temperature. Following bleaching-induced coral mortality, nitrogen-fixing bacteria increase in abundance on coral skeletons (Holmes and Johnstone, 2010). The resulting increase in available nitrogen in the seawater has the potential to affect the growth of macroalgae and other nitrogen-limited primary producers, including benthic cyanobacteria (Holmes and Johnstone, 2010). Taken together, these results demonstrate that temperature stress and coral bleaching have the potential to alter the composition and metabolism of coral-associated bacterial assemblages, with significant impacts on the health of corals and coral reef communities.
As a result of heightened fishing pressure, decline in herbivore populations, and increased nutrient levels, reefs are undergoing a “phase shift” from coral-dominated ecosystems to algal-dominated ecosystems (Pandolfi et al., 2003). Overgrowth by turf macroalgae and benthic cyanobacteria has been documented on adult coral colonies on reefs (Ritson-Williams et al., 2005). Concern is growing for how this shift in ecosystems affects bacterial communities within coral reefs (Dinsdale et al., 2008). Recent research demonstrates that allelochemicals from macroalgae and benthic cyanobacteria have the potential to mediate shifts in abundance and community composition of microbiota associated with adult corals (Morrow et al., 2011). When tested against a library of strains isolated from algal surfaces, from mucus of the Caribbean corals Montastraea faveolata and Porites astreoides in direct contact with algal surfaces, and from the mucus without direct contact of algae, chemical extracts from six species of macroalgae and two species of benthic cyanobacteria stimulated the growth of some strains but inhibited the growth of other strains (Morrow et al., 2011). While some of the algal extracts had broad-spectrum activity against the collection of test isolates from phylogenetically diverse environmental bacteria, other extracts specifically
increased the growth rates of the bacterial genus Vibrio (Morrow et al., 2011). Many of the active compounds in the study were hydrophilic, indicating that the bioactive compounds from algae or cyanobacteria may be readily solubilized and transported throughout seawater, providing a potential mechanism for algae to regulate microbial activity without direct contact, especially in low-flow benthic systems (Morrow et al., 2011). Allelopathic interactions among algae and corals have been shown to have detrimental effects on coral larval behavior, recruitment, and survival (Kuffner and Paul, 2004; Kuffner et al., 2006; Ritson-Williams et al., 2009). It is unknown how the bioactive compounds influence health of the early life stages, but it is feasible that the observed effects are linked to shifting bacterial communities associated with the coral planulae and recruits.
Smith et al. (2006) explored the effects of macroalgae on bacterial growth in the coral surface mucopolysaccharide layer. The results of that research, together with prior work on controlled exposure of coral fragments to seawater with increased dissolved organic carbon (DOC) levels (Kline et al., 2006), suggest that an excess of DOC, exuded from macroalgae, leads to coral mortality (Smith et al., 2006). In addition, Barott et al. (2011) found that the community composition of bacteria on surfaces of multiple reef macroalgal species is distinct from those found on coral surface mucous layers.
On the basis of these studies, it is clear that macroalgae have the potential to act as reservoirs of specific bacteria (beneficial, commensal, or pathogenic) not usually native to the coral mucous layer. Macroalgae also release compounds into the surrounding seawater that can have direct inhibitory or stimulatory effects on the coral-associated microbiota and, hence, on the health of the coral host.
Ocean acidification is a major concern for marine ecosystems in general—particularly those dependent on calcifying organisms, as secretion of calcium carbonate skeletons depends directly on carbonate saturation state in seawater (Caldeira et al., 2007). Recent research suggests that a decrease in seawater pH can alter marine bacterial communities, but very little is known about the large-scale impacts of those changes (Joint et al., 2011). Laboratory manipulations of seawater pH have shown that acidification can result in loss of Symbiodinium endosymbionts, decrease in calcification, depression of overall net productivity in corals (Anthony et al., 2008), and dissolution or slowed deposition of coral skeletons (Fine and Tchernov, 2007). In addition, decreased seawater pH levels have been attributed to a decline in overall abundance of crustose coralline algae (Kuffner et al., 2008), some of which have been shown to facilitate coral recruitment in reefs (Ritson-Williams et al., 2010). Experiments demonstrate that lower PCO2 levels in seawater result in significant detrimental effects on early life stages of the coral Porites astreoides, including fertilization success, larval settlement rates, post-settlement growth, and post-settlement skeleton deposition (Albright et al., 2008, 2010).
Several laboratory-based studies have focused specifically on the impacts of ocean acidification on coral microbiota. Meron et al. (2011) explored shifts in
microbial assemblages associated with the coral Acropora eurystoma exposed to ambient seawater and seawater with pH 7.3 over a period of 2 mon using denaturing gradient gel electrophoresis profiles and 16S rRNA gene clone libraries. According to the resulting cluster analysis, a decrease in pH results in an increase in detection of Rhodobacteraceae and a decrease in detection of Bacteroidetes and Deltaproteobacteria (Meron et al., 2011). Relative to libraries from corals exposed to ambient seawater, clone libraries from A. eurystoma exposed to pH 7.3 conditions exhibited a higher percentage of clones representing bacteria closely related to those detected in stressed, injured, or diseased invertebrates (Meron et al., 2011). In another study with the Pacific coral Porites compressa, individuals exposed to an extremely low pH (6.7) exhibited shifts in bacterial community diversity (Thurber et al., 2009). Though the mechanism by which this occurs is not yet clear, it has been suggested that the altered seawater pH indirectly causes a shift in the bacterial diversity by impacting host metabolism, which results in a shift of nutrients and carbon available to the associated microbiota (Meron et al., 2011).
Metagenomic analysis of P. compressa mucus revealed potential functional shifts in the associated microbiota as a result of decreased pH and increased temperature (Thurber et al., 2009), most notably an increase in the number of detected genes for antibiotic and toxin production. Mucus from corals exposed to a decreased pH exhibits low antimicrobial activity (Meron et al., 2011), and mucus of Acropora palmata exhibits lower antibacterial activity after prolonged warm periods (Ritchie, 2006). Together, these results warn that even slight changes in seawater pH and temperature can have ecologically significant effects on coral-associated microbiota and, hence, on coral’s susceptibility to bacterial pathogens. The shift in the coral microbiome phylogenetic profile has been proposed as a potential indicator for declining coral health before the corals exhibit more obvious signs of stress or disease (Thurber et al., 2009; Ainsworth et al., 2010; Garren and Azam, 2012).
A Model for Climate-Change-Induced Shifts in the Coral Metaorganism
The research reviewed here suggests that alterations in sea surface temperature, algal and cyanobacterial abundance on reefs, and seawater pH can have detrimental effects on corals by decreasing protective qualities of the coral mucous layer, via inhibition of growth or compound production in beneficial bacteria or by alteration of host-associated compound biosynthesis. Another aspect of coral-bacterial interactions that has garnered much attention is the ability of bacteria on reef substrates to influence successful larval recruitment. These surfaces include crustose coralline algae (CCAs), which are coated with microbial biofilms and are thought to be involved in mediating coral larval settlement (Webster et al., 2001, 2011; Ritson-Williams et al., 2009, 2010; Tebben et al., 2011).
Figure A11-1 represents the current model of corals and their interdependence on associated microbes. Both coral tissue and coral mucus contain abundant and diverse microbial communities (Figure A11-1a). When sea-surface temperatures increase, antibacterial compounds in the coral mucus disappear. Simultaneously, antibacterial-producing bacteria normally associated with healthy corals decrease while bacteria with pathogenic capabilities increase (Figure A11-1b).
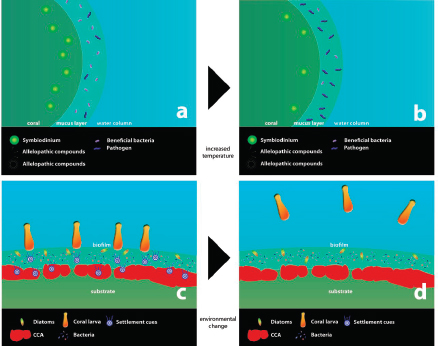
Mathematical modeling of this system suggests that once this shift to pathogen dominance is established, this state persists long after conditions return to those favorable for the reestablishment of beneficial microbes (Mao-Jones et al., 2010). Recent data from coral mucus bacterial metagenomes exposed to decreased pH (Thurber et al., 2009; Meron et al., 2011) indicate that ocean acidification may also result in a similar shift in the protective properties of coral mucus.
On the basis of this model and the data reviewed in this paper, we present a second model of coral-bacterial interactions in which environmental changes lead to shifts in bacterial communities on reef surfaces (Figure A11-1c and d). It has been shown that increased temperatures change the phylogenetic composition of CCA-associated bacterial communities and the success of larval recruitment (Webster et al., 2011). In addition, it was recently shown that decreased pH inhibits settlement of the coral Porites astreoides (Albright et al., 2008, 2010). Temperature may affect the growth, abundance, or bioactive metabolite biosynthesis of beneficial bacteria, particularly Pseudoalteromonas spp., on reef surfaces that are important for successful recruitment, which can ultimately result in a decline of new recruitment on reefs. Though the effects of decreased pH on surface biofilms have not been well described, this condition may alter the bacterial biofilm community and influence larval settlement success. Figure A11-1c and d shows a schematic model of reef surface-associated microbes before (c) and after (d) increased sea-surface temperature or ocean acidification. In ambient conditions on the reef, CCAs, or bacteria growing on CCA surfaces, produce compounds that facilitate larval settlement (Figure A11-1c). When sea-surface temperatures increase, bacterial communities on CCAs change, resulting in lower larval recruitment rates (Figure A11-1d). Similarly, as pH decreases, larval settlement decreases (Albright et al., 2008, 2010). It is hypothesized that the inductive properties of CCAs, whether they are due to compounds released by bacterial biofilms on CCAs or by the CCAs themselves, decrease (Figure A11-1d). As in the coral mucus (Figure A11-1a and b), there is a shift in the bacterial community of the reef surfaces. In this case, under increased sea-surface temperatures, the bacterial community dominated by inductive bacteria, such as Pseudoalteromonas and Thalassomonas, moves to a community dominated by bacteria that may not have inductive properties.
Next Questions: Microbe-Microbe Interactions in Corals
One of the next steps in increasing our understanding of coral fitness is a comprehensive characterization of coral-associated microbial interactions. For example, it is unclear if Symbiodinium plays a role in selectively recruiting bacteria to corals, if Symbiodinium affects bacterial physiology or secondary metabolite biosynthesis, or if bacterial metabolism influences Symbiodinium activity.
Little is known about the nature of free-living Symbiodinium, including what bacterial mutualisms may be present before coral acquisition of Symbiodinium,
in the case that the algal symbiont is not transmitted vertically. Members of the Roseobacteriales group are specifically present in association with Symbiodinium cultures and are able to increase Symbiodinium growth rates in vivo (Ritchie, 2011). This observed association between α-proteobacteria and dinoflagellates may be a true mutualism with benefits for both the bacteria and the algal host. The bacteria may benefit by having a readily available source of organic compounds such as dimethylsulfoniopropionate (DMSP), a preferred source of reduced sulfur (Miller and Belas, 2004; Raina et al., 2010). The algae may derive benefits from the bacterial production of antimicrobials such as tropodithietic acid (Geng and Belas, 2010) and bioactive compounds such as vitamin B-12 (Geng and Belas, 2010). A genomic comparison of the Roseobacter clade of α-proteobacteria indicates that some type of surface-associated lifestyle is central to the ecology of all members of the group (Slightom and Buchan, 2009).
Very little is known about how Symbiodinium affects bacterial communities in corals (or vice versa) or how these interactions impact the fitness of the coral host. Recent studies suggest that bacterial communities in juvenile corals differ significantly if they were initially colonized by different strains of Symbiodinium (Littman et al., 2009) with different photosynthetic efficiencies (Littman et al., 2010). It has been hypothesized that DMSP production by Symbiodinium plays a role in structuring bacterial communities in corals by attracting certain bacteria to the surface mucous layer of corals (Raina et al., 2009, 2010).
An important adaptive property of many α-proteobacteria is the presence of a bacterial system for diversity generation facilitated by gene transfer agents (GTAs) (Paul, 2008). GTAs are defective bacteriophages that are able to randomly package bacterial host DNA and transfer DNA to other α-proteobacteria (Paul, 2008). It has recently been shown that Symbiodinium-associated α-proteobacteria produce GTAs and are able to transfer genes to a range of bacteria in the marine environment (McDaniel et al., 2010). Furthermore, gene transfer via this mechanism is much higher in the coral reef environment than in other marine environments, suggesting an alternate mode of adaptation via swapping of potentially beneficial genes among marine bacteria (McDaniel et al., 2010) and possibly the coral holobiont.
A fundamental requirement of model systems is that they address interspecies interactions in a metaorganism. Research on host-microbe interactions can greatly benefit from a well-documented host-microbe study that spans the spectrum from pathogenicity to mutualism. Much work has been done on the basal metazoan Hydra to illustrate the value of a model systems approach (Weis et al., 2008; Bosch et al., 2009). Because Hydra is associated with a limited number of bacteria, it has provided valuable insight into the molecular basis of immunity and symbiosis in simple animals. Cnidarian and dinoflagellate models can also be used to elucidate roles of bacteria in both coral and Symbiodinium biology. Ideally, these models require cultured symbionts (bacterial and dinoflagellate) and an easily maintained cnidarian host (Weis et al., 2008). Our ability to culture many
of these bacterial symbionts will aid in exploring functions that are otherwise impossible to study due to the complex nature of the coral holobiont. Generation of genome sequence data from animal hosts and their associated microorganisms will exponentially enhance our basic understanding of symbiotic associations at the molecular level. This includes reconstruction of host-symbiont phylogenies, analysis of genes important in specific interactions, comparative genomics, and advanced technologies. The sea anemone Aiptasia pallida has recently been proposed as a model for coral biology for a number of reasons (Weis et al., 2008). While corals are difficult to grow in captivity, this species is hardy to laboratory manipulation and grows quickly in aquaria. Many protocols have been developed to manipulate Symbiodinium density in A. pallida without lethal effects on the host, and as a result, this organism has successfully been used to describe mechanisms of coral bleaching (Dunn et al., 2007) and disease (Alagely et al., 2011). Aiptasia pallida represents an opportunity to integrate a model systems approach with novel technologies from the “omics age” to learn more about multipartner interactions in corals in a moment of great environmental change.
Acknowledgments
This work was funded in part by the Mote Marine Laboratory Protect Our Reefs Grants Program and by the Dart Foundation. We thank Cathleen Sullivan (MML) for assistance with EndNote formatting, and two anonymous reviewers for improvements in the manuscript.
References
Ainsworth, T. D., R. V. Thurber, and R. D. Gates. 2010. The future of coral reefs: a microbial perspective. Trends Ecol. Evol. 25: 233-240.
Alagely, A., C. J. Krediet, K. B. Ritchie, and M. Teplitski. 2011. Signaling-mediated cross-talk modulates swarming and biofilm formation in a coral pathogen Serratia marcescens. ISME J. 5: 1609-1620.
Albright, R., B. Mason, and C. Langdon. 2008. Effect of aragonite saturation state on settlement and post-settlement growth of Porites astreoides larvae. Coral Reefs 27: 485-490.
Albright, R., B. Mason, M. Miller, and C. Langdon. 2010. Ocean acidification compromises recruitment success of the threatened Caribbean coral Acropora palmata. Proc. Natl. Acad. Sci. USA 107: 20400-20404.
Anthony, K. R. N., D. I. Kline, G. Diaz-Pulido, S. Dove, and O. Hoegh-Guldberg. 2008. Ocean acidification causes bleaching and productivity loss in coral reef builders. Proc. Natl. Acad. Sci. USA 105: 17442-17446.
Anthony, K. R. N., J. A. Kleypas, and J.-P. Gattuso. 2011. Coral reefs modify their seawater carbon chemistry—implications for impacts of ocean acidification. Glob. Change Biol. 17: 3655-3666.
Apprill, A., and M. S. Rappe. 2011. Response of the microbial community to coral spawning in lagoon and reef flat environments of Hawaii, USA. Aquat. Microb. Ecol. 62: 251-266.
Apprill, A., H. Q. Marlow, M. Q. Martindale, and M. S. Rappe. 2009. The onset of microbial associations in the coral Pocillopora meandrina. ISME J. 3: 685-699.
Augustin, R., S. Fraune, and T. C. Bosch. 2010. How Hydra senses and destroys microbes. Semin. Immunol. 22: 54-58.
Azam, F. 1998. Microbial control of oceanic carbon flux: the plot thickens. Science 280: 694-696.
Azam, F., and A. Z. Worden. 2004. Microbes, molecules, and marine ecosystems. Science 303: 1622-1624.
Barott, K. L., B. Rodriguez-Brito, J. Janouskovec, K. L. Marhaver, J. E. Smith, P. Keeling, and F. L. Rohwer. 2011. Microbial diversity associated with four functional groups of benthic reef algae and the reef-building coral Montastraea annularis. Environ. Microbiol. 13: 1192-1204.
Ben-Haim, Y., and E. Rosenberg. 2002. A novel Vibrio sp. pathogen of the coral Pocillopora damicornis. Mar. Biol. 141: 47-55.
Bosch, T. C. G., and M. J. McFall-Ngai. 2011. Metaorganisms as the new frontier. Zoology 114: 185-190.
Bosch, T. C., R. Augustin, F. Anton-Erxleben, S. Fraune, G. Hemmrich, H. Zill, P. Rosenstiel, G. Jacobs, S. Schreiber, M. Leippe et al. 2009. Uncovering the evolutionary history of innate immunity: the simple metazoan Hydra uses epithelial cells for host defence. Dev. Comp. Immunol. 33: 559-569.
Bourne, D., Y. Iida, S. Uthicke, and C. Smith-Keune. 2007. Changes in coral-associated microbial communities during a bleaching event. ISME J. 2: 350-363.
Bourne, D. G., M. Garren, T. M. Work, E. Rosenberg, G. W. Smith, and C. D. Harvell. 2009. Microbial disease and the coral holobiont. Trends Microbiol. 17: 554-562.
Bythell, J. C., and C. Wild. 2011. Biology and ecology of coral mucus release. J. Exp. Mar. Biol. Ecol. 408: 88-93.
Caldeira, K., D. Archer, J. P. Barry, R. G. J. Bellerby, P. G. Brewer, L. Cao, A. G. Dickson, S. C. Doney, H. Elderfield, V. J. Fabry et al. 2007. Comment on “Modern-age buildup of CO2 and its effects on seawater acidity and salinity” by Hugo A. Loaiciga. Geophys. Res. Lett. 34: 10.1029/2006gl027288. L18608.
Ceh, J., M. van Keulen, and D. G. Bourne. 2011. Coral-associated bacterial communities on Ningaloo Reef, Western Australia. FEMS Microbiol. Ecol. 75: 134-144.
Cervino, J. M., F. L. Thompson, B. Gomez-Gil, E. A. Lorence, T. J. Goreau, R. L. Hayes, K. B. Winiarski-Cervino, G. W. Smith, K. Hughen, and E. Bartels. 2008. The Vibrio core group induces yellow band disease in Caribbean and Indo-Pacific reef-building corals. J. Appl. Microbiol. 105: 1658-1671.
Daniels, C. A., A. Zeifman, K. Heym, K. B. Ritchie, C. A. Watson, I. Berzins, and M. Breitbart. 2011. Spatial heterogeneity of bacterial communities in the mucus of Montastraea annularis. Mar. Ecol. Prog. Ser. 426: 29-40.
Denner, E. B. M., G. W. Smith, H. J. Busse, P. Schumann, T. Narzt, S. W. Polson, W. Lubitz, and L. L. Richardson. 2003. Aurantimonas coralicida gen. nov., sp nov., the causative agent of white plague type II on Caribbean scleractinian corals. Int. J. Syst. Evol. Microbiol. 53: 1115-1122.
Dinsdale, E. A., O. Pantos, S. Smriga, R. A. Edwards, F. Angly, L. Wegley, M. Hatay, D. Hall, E. Brown, M. Haynes et al. 2008. Microbial ecology of four coral atolls in the Northern Line Islands. PLoS One 3: e1584.
Dobretsov, S., M. Teplitski, and V. Paul. 2009. Mini-review: quorum sensing in the marine environment and its relationship to biofouling. Biofouling 25: 413-427.
Dunn, S. R., C. E. Schnitzler, and V. M. Weis. 2007. Apoptosis and autophagy as mechanisms of dinoflagellate symbiont release during cnidarian bleaching: every which way you lose. Proc. R. Soc. B Biol. Sci. 274: 3079-3085.
Ferrier-Pages, C., V. Schoelzke, J. Jaubert, L. Muscatine, and O. Hoegh-Guldberg. 2001. Response of a scleractinian coral, Stylophora pistillata, to iron and nitrate enrichment. J. Exp. Mar. Biol. Ecol. 259: 249-261.
Fine, M., and D. Tchernov. 2007. Ocean acidification and scleractinian corals—Response. Science 317: 1032-1033.
Fiore, C. L., J. K. Jarett, N. D. Olson, and M. P. Lesser. 2010. Nitrogen fixation and nitrogen transformations in marine symbioses. Trends Microbiol. 18: 455-463.
Frias-Lopez, J., G. T. Bonheyo, Q. S. Jin, and B. W. Fouke. 2003. Cyanobacteria associated with coral black band disease in Caribbean and Indo-Pacific reefs. Appl. Environ. Microbiol. 69: 2409-2413.
Frias-Lopez, J., J. S. Klaus, G. T. Bonheyo, and B. W. Fouke. 2004. Bacterial community associated with black band disease in corals. Appl. Environ. Microbiol. 70: 5955-5962.
Garren, M., and F. Azam. 2012. New directions in coral reef microbial ecology. Environ. Microbiol. 14: 833–844.
Geffen, Y., and E. Rosenberg. 2005. Stress-induced rapid release of antibacterials by scleractinian corals. Mar. Biol. 146: 931-935.
Geng, H. F., and R. Belas. 2010. Molecular mechanisms underlying roseobacter-phytoplankton symbioses. Curr. Opin. Biotechnol. 21: 332-338.
Gochfeld, D., and G. Aeby. 2008. Antibacterial chemical defenses in Hawaiian corals provide possible protection from disease. Mar. Ecol. Prog. Ser. 362: 119-128.
Guppy, R., and J. C. Bythell. 2006. Environmental effects on bacterial diversity in the surface mucus layer of the reef coral Montastraea faveolata. Mar. Ecol. Prog. Ser. 328: 133-142.
Holmes, G., and R. W. Johnstone. 2010. The role of coral mortality in nitrogen dynamics on coral reefs. J. Exp. Mar. Biol. Ecol. 387: 1-8.
Huettel, M., C. Wild, and S. Gonelli. 2006. Mucus trap in coral reefs: formation and temporal evolution of particle aggregates caused by coral mucus. Mar. Ecol. Prog. Ser. 307: 69-84.
Johnson, C. N., A. R. Flowers, N. F. Noriea III, A. M. Zimmerman, J. C. Bowers, A. DePaola, and D. J. Grimes. 2010. Relationships between environmental factors and pathogenic Vibrios in the northern Gulf of Mexico. Appl. Environ. Microbiol. 76: 7076-7084.
Joint, I., S. C. Doney, and D. M. Karl. 2011. Will ocean acidification affect marine microbes? ISME J. 5: 1-7.
Kelman, D., Y. Kashman, E. Rosenberg, A. Kushmaro, and Y. Loya. 2006. Antimicrobial activity of Red Sea corals. Mar. Biol. 149: 357-363.
Kimes, N. E., J. D. Van Nostrand, E. Weil, J. Z. Zhou, and P. J. Morris. 2010. Microbial functional structure of Montastraea faveolata, an important Caribbean reef-building coral, differs between healthy and yellow-band diseased colonies. Environ. Microbiol. 12: 541-556.
Kline, D. I., N. M. Kuntz, M. Breitbart, N. Knowlton, and F. Rohwer. 2006. Role of elevated organic carbon levels and microbial activity in coral mortality. Mar. Ecol. Prog. Ser. 314: 119-125.
Knowlton, N., and F. Rohwer. 2003. Multispecies microbial mutualisms on coral reefs: the host as a habitat. Am. Nat. 162: S51-S62.
Koh, E. G. L. 1997. Do scleractinian corals engage in chemical warfare against microbes? J. Chem. Ecol. 23: 379-398.
Krediet, C. J., K. B. Ritchie, M. Cohen, E. K. Lipp, K. P. Sutherland, and M. Teplitski. 2009a. Utilization of mucus from the coral Acropora palmata by the pathogen Serratia marcescens and by environmental and coral commensal bacteria. Appl. Environ. Microbiol 75: 3851-3858.
Krediet, C. J., K. B. Ritchie, and M. Teplitski. 2009b. Catabolite regulation of enzymatic activities in a white pox pathogen and commensal bacteria during growth on mucus polymers from the coral Acropora palmata. Dis. Aquat. Org. 87: 57-66.
Kuffner, I. B., and V. J. Paul. 2004. Effects of the benthic cyanobacterium Lyngbya majuscula on larval recruitment of the reef corals Acropora surculosa and Pocillopora damicornis. Coral Reefs 23: 455-458.
Kuffner, I. B., L. J. Walters, M. A. Becerro, V. J. Paul, R. Ritson-Williams, and K. S. Beach. 2006. Inhibition of coral recruitment by macroalgae and cyanobacteria. Mar. Ecol. Prog. Ser. 323: 107-117.
Kuffner, I. B., A. J. Andersson, P. L. Jokiel, K. u. S. Rodgers, and F. T. Mackenzie. 2008. Decreased abundance of crustose coralline algae due to ocean acidification. Nat. Geosci. 1: 114-117.
Kushmaro, A., E. Rosenberg, M. Fine, and Y. Loya. 1997. Bleaching of the coral Oculina patagonica by Vibrio AK-1. Mar. Ecol. Prog. Ser. 147: 159-165.
Kvennefors, E. C. E., and G. Roff. 2009. Evidence of cyanobacterialike endosymbionts in Acroporid corals from the Great Barrier Reef. Coral Reefs 28: 547-547.
Kvennefors, E. C. E., W. Leggat, O. Hoegh-Guldberg, B. M. Degnan, and A. C. Barnes. 2008. An ancient and variable mannose-binding lectin from the coral Acropora millepora binds both pathogens and symbionts. Dev. Comp. Immunol. 32: 1582-1592.
Kvennefors, E. C. E., E. M. Sampayo, T. Ridgway, A. C. Barnes, and O. Hoegh-Guldberg. 2010. Bacterial communities of two ubiquitous Great Barrier Reef corals reveals both site- and species-specificity of common bacterial associates. PLoS One 5: e10401.
Kvennefors, E., E. Sampayo, C. Kerr, G. Vieira, G. Roff, and A. Barnes. 2012. Regulation of bacterial communities through antimicrobial activity by the coral holobiont. Microb. Ecol. 63: 605-618.
Lesser, M. P., L. I. Falcon, A. Rodriguez-Roman, S. Enriquez, O. Hoegh-Guldberg, and R. Iglesias-Prieto. 2007. Nitrogen fixation by symbiotic cyanobacteria provides a source of nitrogen for the scleractinian coral Montastraea cavernosa. Mar. Ecol. Prog. Ser. 346: 143-152.
Littman, R. A., B. L. Willis, and D. G. Bourne. 2009. Bacterial communities of juvenile corals infected with different Symbiodinium (dinoflagellate) clades. Mar. Ecol. Prog. Ser. 389: 45-59.
Littman, R. A., D. G. Bourne, and B. L. Willis. 2010. Responses of coral-associated bacterial communities to heat stress differ with Symbiodinium type on the same coral host. Mol. Ecol. 19: 1978-1990.
Mao-Jones, J., K. B. Ritchie, L. E. Jones, and S. P. Ellner. 2010. How microbial community composition regulates coral disease development. PLoS Biol. 8: e1000345.
Marquis, C. P., A. H. Baird, R. de Nys, C. Holmstrom, and N. Koziumi. 2005. An evaluation of the antimicrobial properties of the eggs of 11 species of scleractinian corals. Coral Reefs 24: 248-253.
McDaniel, L. D., E. Young, J. Delaney, F. Ruhnau, K. B. Ritchie, and J. H. Paul. 2010. High frequency of horizontal gene transfer in the oceans. Science 330: 50-50.
McFall-Ngai, M., E. A. Heath-Heckman, A. A. Gillette, S. M. Peyer, and E. A. Harvie. 2012. The secret languages of coevolved symbioses: insights from the Euprymna scolopes-Vibrio fischeri symbiosis. Semin. Immunol. 24: 3-8.
Meron, D., E. Atias, L. Iasur Kruh, H. Elifantz, D. Minz, M. Fine, and E. Banin. 2011. The impact of reduced pH on the microbial community of the coral Acropora eurystoma. ISME J. 5: 51-60.
Miller, T. R., and R. Belas. 2004. Dimethylsulfoniopropionate metabolism by Pfiesteria-associated Roseobacter spp. Appl. Environ. Microbiol. 70: 3383-3391.
Morrow, K. M., V. J. Paul, M. R. Liles, and N. E. Chadwick. 2011. Allelochemicals produced by Caribbean macroalgae and cyanobacteria have species-specific effects on reef coral microorganisms. Coral Reefs 30: 309-320.
Negri, A. P., N. Webster, R. T. Hill, and A. J. Heyward. 2001. Metamorphosis of broadcast spawning corals in response to bacteria isolated from crustose algae. Mar. Ecol. Prog. Ser. 223: 121-131.
Ng, W.-L., and B. L. Bassler. 2009. Bacterial quorum-sensing network architectures. Annu. Rev. Genet. 43: 197-222.
Nielsen, A. T., T. Tolker-Nielsen, K. B. Barken, and S. Molin. 2000. Role of commensal relationships on the spatial structure of a surface-attached microbial consortium. Environ. Microbiol. 2: 59-68.
Nissimov, J., E. Rosenberg, and C. B. Munn. 2009. Antimicrobial properties of resident coral mucus bacteria of Oculina patagonica. FEMS Microbiol. Lett. 292: 210-215.
Olson, N. D., T. D. Ainsworth, R. D. Gates, and M. Takabayashi. 2009. Diazotrophic bacteria associated with Hawaiian Montipora corals: diversity and abundance in correlation with symbiotic dinoflagellates. J. Exp. Mar. Biol. Ecol. 371: 140-146.
Pandolfi, J. M., R. H. Bradbury, E. Sala, T. P. Hughes, K. A. Bjorndal, R. G. Cooke, D. McArdle, L. McCLenachan, M. J. H. Newman, G. Paredes, R. R. Warner, and J. B. C. Jackson. 2003. Global trajectories of the long-term decline of coral reef ecosystems. Science 301: 955-958.
Patterson, K. L., J. W. Porter, K. E. Ritchie, S. W. Polson, E. Mueller, E. C. Peters, D. L. Santavy, and G. W. Smiths. 2002. The etiology of white pox, a lethal disease of the Caribbean elkhorn coral, Acropora palmata. Proc. Natl. Acad. Sci. USA 99: 8725-8730.
Paul, J. H. 2008. Prophages in marine bacteria: dangerous molecular time bombs or the key to survival in the seas? ISME J. 2: 579-589.
Pollock, F. J., P. J. Morris, B. L. Willis, and D. G. Bourne. 2011. The urgent need for robust coral disease diagnostics. PLoS Pathog. 7: e1002183.
Raina, J.-B., D. Tapiolas, B. L. Willis, and D. G. Bourne. 2009. Coral-associated bacteria and their role in the biogeochemical cycling of sulfur. Appl. Environ. Microbiol 75: 3492-3501.
Raina, J. B., E. A. Dinsdale, B. L. Willis, and D. G. Bourne. 2010. Do the organic sulfur compounds DMSP and DMS drive coral microbial associations? Trends Microbiol. 18: 101-108.
Rajamani, S., W. D. Bauer, J. B. Robinson, J. M. Farrow III, E. C. Pesci, M. Teplitski, M. Gao, R. T. Sayre, and D. A. Phillips. 2008. The vitamin riboflavin and its derivative lumichrome activate the LasR bacterial quorum-sensing receptor. Mol. Plant Microbe Interact. 21: 1184-1192.
Rao, D., J. S. Webb, and S. Kjelleberg. 2005. Competitive interactions in mixed-species biofilms containing the marine bacterium Pseudoalteromonas tunicata. Appl. Environ. Microbiol 71: 1729-1736.
Rasmussen, T. B., and M. Givskov. 2006. Quorum-sensing inhibitors as anti-pathogenic drugs. Int. J. Med. Microbiol. 296: 149-161.
Reis, A. M., S. D. Araujo, Jr., R. L. Moura, R. B. Francini-Filho, G. Pappas, Jr., A. M. Coelho,
R. H. Kruger, and F. L. Thompson. 2009. Bacterial diversity associated with the Brazilian endemic reef coral Mussismilia braziliensis. J. Appl. Microbiol. 106: 1378-1387.
Reshef, L., O. Koren, Y. Loya, I. Zilber-Rosenberg, and E. Rosenberg. 2006. The coral probiotic hypothesis. Environ. Microbiol. 8: 2068-2073.
Ritchie, K. B. 2006. Regulation of microbial populations by coral surface mucus and mucus-associated bacteria. Mar. Ecol. Prog. Ser. 322: 1-14.
Ritchie, K. B. 2011. Bacterial symbionts of corals and Symbiodinium. Pp. 139-150 in Beneficial Microorganisms in Multicellular Life Forms, E. Rosenberg and U. Gophna, eds. Springer, Heidelberg.
Ritson-Williams, R., V. J. Paul, and V. Bonito. 2005. Marine benthic cyanobacteria overgrow coral reef organisms. Coral Reefs 24: 629-629.
Ritson-Williams, R., S. N. Arnold, N. D. Fogarty, R. S. Steneck, M. J. A. Vermeij, and V. J. Paul. 2009. New perspectives on ecological mechanisms affecting coral recruitment on reefs. Pp. 437-457 in Proceedings of the Smithsonian Marine Science Symposium: Smithsonian Contributions to the Marine Sciences, M. A. Lang, I. G. Macintyre, and K. Ru¨tzler, eds. Smithsonian Institution Scholarly Press, Washington, D.C.
Ritson-Williams, R., V. J. Paul, S. N. Arnold, and R. S. Steneck. 2010. Larval settlement preferences and post-settlement survival of the threatened Caribbean corals Acropora palmata and A. cervicornis. Coral Reefs 29: 71-81.
Rohwer, F. R., M. B. Breitbart, J. J. Jara, F. A. Azam, and N. K. Knowlton. 2001. Diversity of bacteria associated with the Caribbean coral Montastraea franksi. Coral Reefs 20: 85-91.
Rohwer, F., V. Seguritan, F. Azam, and N. Knowlton. 2002. Diversity and distribution of coral-associated bacteria. Mar. Ecol. Prog. Ser. 243: 1-10.
Rosenberg, E., O. Koren, L. Reshef, R. Efrony, and I. Zilber-Rosenberg. 2007. The role of micro-organisms in coral health, disease and evolution. Nat. Rev. Microbiol. 5: 355-362.
Rosenberg, E., A. Kushmaro, E. Kramarsky-Winter, E. Banin, and L. Yossi. 2009. The role of microorganisms in coral bleaching. ISME J. 3: 139-146.
Rowan, R., and N. Knowlton. 1995. Intraspecific diversity and ecological zonation in coral-algal symbiosis. Proc. Natl. Acad. Sci. USA 92: 2850-2853.
Schmitt, S., J. B. Weisz, N. Lindquist, and U. Hentschel. 2007. Vertical transmission of a phylogenetically complex microbial consortium in the viviparous sponge Ircinia felix. Appl. Environ. Microbiol. 73: 2067-2078.
Schmitt, S., P. Tsai, J. Bell, J. Fromont, M. Ilan, N. Lindquist, T. Perez, A. Rodrigo, P. J. Schupp, J. Vacelet, N. Webster, U. Hentschel, and M. W. Taylor. 2011. Assessing the complex sponge microbiota: core, variable and species-specific bacterial communities in marine sponges. ISME J. 6: 564-576.
Sekar, R., L. T. Kaczmarsky, and L. L. Richardson. 2008. Microbial community composition of black band disease on the coral host Siderastrea siderea from three regions of the wider Caribbean. Mar. Ecol. Prog. Ser. 362: 85-98.
Sharon, G., and E. Rosenberg. 2010. Healthy corals maintain Vibrio in the VBNC state. Environ. Microbiol. Rep. 2: 116-119.
Sharp, K. H., B. Eam, D. J. Faulkner, and M. G. Haygood. 2007. Vertical transmission of diverse microbes in the tropical sponge Corticium sp. Appl. Environ. Microbiol. 73: 622-629.
Sharp, K. H., K. B. Ritchie, P. J. Schupp, R. Ritson-Williams, and V. J. Paul. 2010. Bacterial acquisition in juveniles of several broadcast spawning coral species. PLoS One 5: e10898.
Sharp, K. H., D. Distel, and V. J. Paul. 2012. Diversity and dynamics of bacterial communities in early life stages of the Caribbean coral Porites astreoides. ISME J. 6: 790–801.
Shnit-Orland, M., and A. Kushmaro. 2009. Coral mucus-associated bacteria: a possible first line of defense. FEMS Microbiol. Ecol. 67: 371-380.
Skindersoe, M. E., P. Ettinger-Epstein, T. B. Rasmussen, T. Bjarnsholt, R. de Nys, and M. Givskov. 2008. Quorum sensing antagonism from marine organisms. Mar. Biotechnol. 10: 56-63.
Slightom, R. N., and A. Buchan. 2009. Surface colonization by marine roseobacters: integrating genotype and phenotype. Appl. Environ. Microbiol. 75: 6027-6037.
Smith, J. E., M. Shaw, R. A. Edwards, D. Obura, O. Pantos, E. Sala, S. A. Sandin, S. Smriga, M. Hatay, and F. L. Rohwer. 2006. Indirect effects of algae on coral: algae-mediated, microbe-induced coral mortality. Ecol. Lett. 9: 835-845.
Stat, M., D. Carter, and O. Hoegh-Guldberg. 2006. The evolutionary history of Symbiodinium and scleractinian hosts—symbiosis, diversity, and the effect of climate change. Perspect. Plant Ecol. Evol. Syst. 8: 23-43.
Sunagawa, S., C. M. Woodley, and M. Medina. 2010. Threatened corals provide underexplored microbial habitats. PLoS One 5: e9554.
Sutherland, K. P., S. Shaban, J. L. Joyner, J. W. Porter, and E. K. Lipp. 2011. Human pathogen shown to cause disease in the threatened elkhorn coral Acropora palmata. PLoS One 6: e23468.
Sweet, M. J., A. Croquer, and J. C. Bythell. 2011a. Bacterial assemblages differ between compartments within the coral holobiont. Coral Reefs 30: 39-52.
Sweet, M. J., A. Croquer, and J. C. Bythell. 2011b. Development of bacterial biofilms on artificial corals in comparison to surface-associated microbes of hard corals. PLoS One 6: e21195.
Tait, K., Z. Hutchison, F. L. Thompson, and C. B. Munn. 2010. Quorum sensing signal production and inhibition by coral-associated vibrios. Environ. Microbiol. Rep. 2: 145-150.
Tebben, J., D. M. Tapiolas, C. A. Motti, D. Abrego, A. P. Negri, L. L. Blackall, P. D. Steinberg, and T. Harder. 2011. Induction of larval metamorphosis of the coral Acropora millepora by tetrabromopyrrole isolated from a Pseudoalteromonas bacterium. PLoS One 6: e19082.
Teplitski, M., and K. Ritchie. 2009. How feasible is the biological control of coral diseases? Trends Ecol. Evol. 24: 378-385.
Teplitski, M., K. Warriner, J. Bartz, and K. R. Schneider. 2011. Untangling metabolic and communication networks: interactions of enterics with phytobacteria and their implications in produce safety. Trends Microbiol. 19: 121-127.
Thompson, J. R., M. A. Randa, L. A. Marcelino, A. Tomita-Mitchell, E. Lim, and M. F. Polz. 2004. Diversity and dynamics of a north Atlantic coastal Vibrio community. Appl. Environ. Microbiol 70: 4103-4110.
Thurber, R. V., D. Willner-Hall, B. Rodriguez-Mueller, C. Desnues, R. A. Edwards, F. Angly, E. Dinsdale, L. Kelly, and F. Rohwer. 2009. Metagenomic analysis of stressed coral holobionts. Environ. Microbiol. 11: 2148-2163.
Tran, C., and M. G. Hadfield. 2011. Larvae of Pocillopora damicornis (Anthozoa) settle and metamorphose in response to surface-biofilm bacteria. Mar. Ecol. Prog. Ser. 433: 85-96.
Vidal-Dupiol, J., O. Ladriere, D. Destoumieux-Garzon, P. E. Sautiere, A. L. Meistertzheim, E. Tambutte, S. Tambutte, D. Duval, L. Foure, M. Adjeroud, and G. Mitta. 2011a. Innate immune responses of a scleractinian coral to vibriosis. J. Biol. Chem. 286: 22688-22698.
Vidal-Dupiol, J., O. Ladriere, A. L. Meistertzheim, L. Foure, M. Adjeroud, and G. Mitta. 2011b. Physiological responses of the scleractinian coral Pocillopora damicornis to bacterial stress from Vibrio coralliilyticus. J. Exp. Biol. 214: 1533-1545.
Wagner-Dobler, I., and H. Biebl. 2006. Environmental biology of the marine Roseobacter lineage. Annu. Rev. Microbiol. 60: 255-280.
Webster, N. S., R. I. Webb, M. J. Ridd, R. T. Hill, and A. P. Negri. 2001. The effects of copper on the microbial community of a coral reef sponge. Environ. Microbiol. 3: 19-31.
Webster, N. S., L. D. Smith, A. J. Heyward, J. E. M. Watts, R. I. Webb, L. L. Blackall, and A. P. Negri. 2004. Metamorphosis of a scleractinian coral in response to microbial biofilms. Appl. Environ. Microbiol. 70: 1213-1221.
Webster, N. S., R. Soo, R. Cobb, and A. P. Negri. 2011. Elevated seawater temperature causes a microbial shift on crustose coralline algae with implications for the recruitment of coral larvae. ISME J. 5: 759-770.
Wegley, L., R. Edwards, B. Rodriguez-Brito, H. Liu, and F. Rohwer. 2007. Metagenomic analysis of the microbial community associated with the coral Porites astreoides. Environ. Microbiol. 9: 2707-2719.
Weil, E., and C. S. Rogers. 2011. Coral reef diseases in the Atlantic-Caribbean. Pp. 465-491 in Coral Reefs: An Ecosystem in Transition, Z. Dubinsky and N. Stambler, eds. Springer, Science Business Media, Dordrecht, The Netherlands.
Weis, V. M., S. K. Davy, O. Hoegh-Guldberg, M. Rodriguez-Lanetty, and J. R. Pringe. 2008. Cell biology in model systems as the key to understanding corals. Trends Ecol. Evol. 23: 369-376.
Wild, C., M. Huettel, A. Klueter, S. G. Kremb, M. Y. M. Rasheed, and B. B. Jorgensen. 2004. Coral mucus functions as an energy carrier and particle trap in the reef ecosystem. Nature 428: 66-70.
Wild, C., M. S. Naumann, A. Haas, U. Struck, F. W. Mayer, M. Y. Rasheed, and M. Huettel. 2009. Coral sand O2 uptake and pelagicbenthic coupling in a subtropical fringing reef, Aqaba, Red Sea. Aquat. Biol. 6: 133-142.
Wood-Charlson, E. M., L. L. Hollingsworth, D. A. Krupp, and V. M. Weis. 2006. Lectin/glycan interactions play a role in recognition in a coral/dinoflagellate symbiosis. Cell. Microbiol. 8: 1985-1993.
Yi, H., Y. W. Lim, and J. Chun. 2007. Taxonomic evaluation of the genera Ruegeria and Silicibacter: a proposal to transfer the genus Silicibacter Petursdottir and Kristjansson 1999 to the genus Ruegeria Uchino et al. 1999. Int. J. Syst. Evol. Microbiol. 57: 815-819.
Zilber-Rosenberg, I., and E. Rosenberg. 2008. Role of microorganisms in the evolution of animals and plants: the hologenome theory of evolution. FEMS Microbiol. Rev. 32: 723-735.
GENOMIC TRANSITION TO PATHOGENICITY
IN CHYTRID FUNGI46
Suzanne Joneson,47Jason E. Stahich,48Shin-Han Shiu,49
and Erica Bree Rosenblum47,*
Abstract
Understanding the molecular mechanisms of pathogen emergence is central to mitigating the impacts of novel infectious disease agents. The chytrid fungus Batrachochytrium dendrobatidis (Bd) is an emerging pathogen of amphibians that has been implicated in amphibian declines worldwide. Bd is the only member of its clade known to attack vertebrates. However, little is known about the molecular determinants of—or evolutionary transition to—pathogenicity in Bd. Here we sequence the genome of Bd’s closest known relative—a non-pathogenic chytrid Homolaphlyctis polyrhiza (Hp). We first describe the genome of Hp, which is comparable to other chytrid genomes in size and number of predicted proteins. We then compare the genomes of Hp, Bd, and 19 additional fungal genomes to identify unique or recent evolutionary elements in the Bd genome. We identified 1,974 Bd-specific genes, a gene set that is enriched for protease, lipase, and microbial effector gene ontology terms. We describe significant lineage-specific expansions in three Bd protease families (metallo-, serine-type, and aspartyl proteases). We show that these protease gene family expansions occurred after the divergence
_______________________
46 Reprinted from PLoS Pathogens. Originally published as Joneson S, Stajich JE, Shiu S-H, Rosenblum EB (2011) Genomic Transition to Pathogenicity in Chytrid Fungi. PLoS Pathogens 7(11): e1002338. doi:10.1371/
journal.ppat.1002338.
Copyright: ©2011 Joneson et al. This is an open-access article distributed under the terms of the Creative Commons Attribution License, which permits unrestricted use, distribution, and reproduction in any medium, provided the original author and source are credited.
Funding: We acknowledge NIH funding from the COBRE Program administered by the Initiative for Bioinformatics and Evolutionary Studies (P20RR0116454) and the INBRE Program of the National Center for Research Resources (P20RR016448) to E.B.R., Initial Complement funding provided by the University of California to J.E.S., and NSF funding (DBI-0939454) to the BEACON Center for the Study of Evolution in Action. The funders had no role in study design, data collection and analysis, decision to publish, or preparation of the manuscript.
Competing Interests: The authors have declared that no competing interests exist.
* E-mail: rosenblum@uidaho.edu
47 Department of Biological Sciences, University of Idaho, Moscow, Idaho, USA.
48 Department of Plant Pathology and Microbiology, University of California, Riverside, California, USA.
49 Department of Plant Biology, Michigan State University, East Lansing, Michigan, USA.
of Bd and Hp from their common ancestor and thus are localized to the Bd branch. Finally, we demonstrate that the timing of the protease gene family expansions predates the emergence of Bd as a globally important amphibian pathogen.
Author Summary
The chytrid fungus Batrachochytrium dendrobatidis (Bd) is an emerging pathogen that has been implicated in decimating amphibian populations around the world. Bd is the only member of an ancient group of fungi (called the Chytridiomycota) that is known to attack vertebrates. The question of how an amphibian-killing fungus evolved from non-pathogenic ancestors is vital to protecting the world’s remaining amphibians from Bd. We sequenced the genome of Bd’s closest known relative—a non-pathogenic chytrid named Homolaphlyctis polyrhiza (Hp). We compared the genomes of Bd, Hp and 18 additional fungi to identify what makes Bd unique. We identified a large number of Bd-specific genes, a gene set that contains a number of possible pathogenicity factors. In particular, we describe a large number of protease genes in the Bd genome and show that these genes were duplicated after the divergence of Bd and Hp from their common ancestor. Studying Bd’s pathogenesis in an evolutionary context provides new evidence for the role of protease genes in Bd’s ability to kill amphibians.
Introduction
Understanding the emergence of novel pathogens is a central challenge in epidemiology, disease ecology, and evolutionary biology. Emerging pathogens of humans, wildlife, and agriculturally important crops generally have a dynamic recent evolutionary past. For example, many emerging pathogens have become adapted to new environmental conditions, shifted their host range, and/or evolved more virulent forms (Hoskisson and Trevors, 2010; Smith and Guegan, 2010; Woolhouse and Gaunt, 2007). Identifying the genetic basis of these evolutionary shifts can lend insight into the mechanisms of pathogen emergence.
Studies of the amphibian-killing fungus Batrachochytrium dendrobatidis (Bd) provide an opportunity to better understand evolutionary transitions to pathogenicity. Bd is considered the leading cause of amphibian declines worldwide and is found on every continent where amphibians occur (Berger et al., 1998; Lips et al., 2006). Bd infects amphibian skin and the resulting disease, chytridiomycosis, is responsible for population declines and extirpations in hundreds of amphibian species (Lötters et al., 2004; Skerratt et al., 2007). Bd is the only documented vertebrate pathogen in a diverse, early-branching lineage of fungi called the Chytridiomycota. Some chytrids are pathogens of plants, but most chytrids are primarily known to survive on decaying organic material as saprobes (James et al., 2006). The question of how an amphibian-killing fungus evolved
from an ancestor that was not a vertebrate pathogen is vital to understanding and mitigating the chytridiomycosis epidemic and will also shed light on the evolution of novel pathogens more broadly.
Investigating the transition to pathogenicity in chytrid fungi requires an explicitly evolutionary perspective. Specifically, identifying elements of the genome that have undergone recent evolution in the branch leading to Bd may help us determine how Bd attacks its amphibian hosts. Previously we identified several families of proteases that may be involved in Bd’s ability to infect amphibian skin. Specifically, we found expanded gene families of metallo- and serine proteases in the Bd genome that exhibit life-stage specific gene expression patterns (Rosenblum et al., 2008). These proteases have been hypothesized to play a role in the ability of other fungal pathogens to invade and degrade host tissue (Burmester et al., 2011; da Silva et al., 2006; Monod, 2008; Monod et al., 2002). However, previous studies could not resolve if these gene family expansions occurred along the branch leading to Bd because the fungal genomes available for comparison were only distantly related to Bd.
To determine what unique features of the Bd genome might relate to its ability to colonize amphibian skin, we compared genomes of Bd and its closest known relative, Homolaphlyctis polyrhiza (Hp) (this isolate has been described by Joyce Longcore [pers. comm.] and has been referred to as “JEL142” in previous publications [James et al., 2006]). Bd and Hp are in the same Rhizophydiales order (Letcher et al., 2006), and Bd is the only member of this clade known to be a vertebrate pathogen (James et al., 2006). We first confirmed that Hp cannot survive on amphibian skin alone. We then sequenced and characterized the genome of Hp using Roche-454 pyrosequencing. Finally, we used a comparative genomics approach to identify differences between Bd and Hp using additional fungal species as outgroups. Based on identified unique elements of the Bd genome, we develop hypotheses for the mechanisms and evolution of Bd pathogenicity.
Materials and Methods
Taxon Sampling
Our focal isolates were the JAM81 strain of Bd and the JEL142 strain of Hp. JAM81 was isolated from Rana muscosa in the Sierra Nevada Mountains in California, where Bd has caused catastrophic declines in R. muscosa populations (Rachowicz et al., 2006). Hp was collected from leaf litter in Maine and is a presumed saprobe. We also used the information from publically available genomes of an additional Bd isolate—JEL423 (http://www.broadinstitute.org/annotation/genome/batrachochytrium_dendrobatidis/MultiHome.html), and an additional chytrid, Spizellomyces punctatus, a terrestrial saprobe (Origins of Multicellularity Sequencing Project, Broad Institute of Harvard and MIT [http://www.broadinstitute.org/]). Finally we used the genome information from 17 additional
publicly available fungal genomes (Table S1). We chose these outgroups to represent a broad phylogenetic survey of fungi that span four additional fungal phyla: Blastocladiomycota (Allomyces macrogynus), Zygomycota (Phycomyces blakesleeanus), Basidiomycota (Coprinopsis cinerea, Cryptococcus neoformans, Puccinia graminis f. sp. tritici, Ustilago maydis), and Ascomycota (Arthroderma benhamiae, Aspergillus nidulans, Blastomyces dermatitidis, Botrytis cinerea, Coccidioides immitis, Fusarium graminearum, Microsporum canis, Neurospora crassa, Pyrenophora tritici-repentis, Trichophyton rubrum, and Uncinocarpus reesii). Arthroderma benhamiae, M. canis, and T. rubrum were chosen in particular because they are dermatophytes (i.e., fungal pathogens that infect skin).
We reconstructed the phylogenetic relationships among the 19 taxa used in this study using Bayesian phylogenetic analyses of 51 single-copy genes. The alignment was comprised of 21,182 total trimmed amino acid residues. The orthologous sequences were aligned with T-Coffee (Notredame et al., 2000), concatenated, and trimmed with trimAl (Capella-Gutiérrez et al., 2009). The Basidiomycota phylum was constrained by members Ustilago maydis and Puccinia graminis, and the tree rooted with the Chytridiomycota clade based on James et al. (2006). Bayesian posterior probabilities are shown below internal nodes and ML bootstrap values from 100 replicates above the nodes.
Growth of Bd and Hp on Amphibian Skin
We grew Bd (JAM81) and Hp on the standard growth medium PmTG (made from peptonized milk, tryptone and glucose) (Barr, 1986). After one week of growth, we transferred 3.8×10⁶ zoospores from each isolate to 3 mL of two liquid growth conditions: standard growth media and amphibian skin. For standard growth media we used 1% liquid PmTG, and for amphibian skin we used 10% w/v pulverized and autoclaved cane-toad skin in water. We established six technical replicates of each isolate in each condition. Liquid cultures were gently shaken in 6-well tissue culture plates. To test how long Bd and Hp survived in each growth condition, we tested an aliquot from each culture every day for 14 days. Each day we removed 15 μL from each of the technical replicates, pooled aliquots for each isolate in each treatment group, and inoculated PmTG-agar growth plates. We inspected growth plates every day using 200× magnification to visualize whether active zoospores were produced.
Hp Genome Sequence, Assembly, and Annotation
We grew Hp at room temperature (23–25C) in liquid PmTG medium with gentle agitation for approximately 2 weeks. We extracted Hp DNA using a Zolan and Pukkila (Zolan and Pukkila, 1986) protocol modified by the use of 2% sodium dodecyl sulphate as extraction buffer in place of CTAB. We sequenced the
Hp genome using a Roche 454 Genome Sequencer FLX with Titanium chemistry and standard Roche protocol. We screened and trimmed 1,100,797 reads of vector sequences and assembled them with Roche’s GS De Novo Assembler. We improved the assembly by synteny-based alignment to the JAM81 genome sequence with Mercator (Dewey, 2007).
We annotated the Hp genome with predicted proteins using the MAKER annotation pipeline (Cantarel et al., 2008). MAKER predicts proteins based on homology with protein-coding sequences of other species, and with the consensus of the ab initio gene prediction algorithms GeneMark, AUGUSTUS, and SNAP. GeneMark is self-training so we simply applied it to determine ab initio parameters. We trained AUGUSTUS using parameters provided in the MAKER package and previously determined Bd training parameters. We trained SNAP by iteratively running MAKER with SNAP Bd models and then retraining on the most confident gene model parameters from the initial run. All parameters files are available in http://fungalgenomes.org/public/Hp_JEL142/. Because MAKER’s final set of predicted proteins (referred to hereafter as “Hp_Maker”) is a conservative estimate that relies upon the consensus of different prediction algorithms, we also used the set of ab initio predicted proteins in MAKER by GeneMark-ES (Ter-Hovhannisyan et al., 2008) as an upper limit (referred to hereafter as “Hp_GeneMark”). Hp_Maker is not a perfect subset of Hp_GeneMark, so we considered both datasets when characterizing the proteome of Hp. We annotated Hp protein models by comparison to the Pfam database of protein domains (Finn et al., 2010) using HMMER 3.0 (http://hmmer.org/).
We used two methods that rely on different algorithms to confirm that we successfully identified the majority of Hp proteins. First, we used the eukaryotic genome annotation pipeline CEGMA to predict the number of core eukaryotic genes in the Hp alignment (Parra et al., 2007). Second we determined the number of “chytrid-specific” orthologous groups that were present in the Hp genome. We defined chytrid-specific orthologous groups as those groups shared between all available Chytridiomycota genomes: two Bd isolates (JAM81 and JEL423) and one Spizellomyces punctatus isolate (DAOM BR117) (Table S1). We identified chytrid-specific orthologous groups using BLASTP (Altschul et al., 1990) and OrthoMCL (Li et al., 2003), and determined how many of these were also found within either set of Hp predicted proteins (i.e., Hp_Maker and Hp_GeneMark).
Bd Unique Genomic Features
We also used BLASTP and OrthoMCL to determine orthologous groups for all sampled taxa. These orthologous groups were used to determine “Bd-specific” genes which we defined as those groups or genes that were present in both sequenced Bd genomes (JAM81 and JEL423) but absent from all other sampled fungi. [Note that the Bd-specific gene set is distinct from the more broadly defined
chytrid-specific gene set discussed above]. We used GO::TermFinder (Boyle et al., 2004) to determine if the Pfam annotations for the set of Bd-specific genes showed enrichment for particular GO terms.
Bd Gene Family Expansions
We identified several gene family expansions in Bd through inspection of the top ten largest Bd-specific orthologous groups and inspection of enriched GO categories. We found gene family expansions in families with genes containing M36, S41, and Asp (both Asp and Asp_protease) protease Pfam signature domains (see Table S2 for sequences and their Pfam domain delimitation). We conducted an exhaustive search in the focal genomes for M36, S41, and Asp domains using HMMER3 (http://hmmer.org/). For Hp we conducted the HMMER3 search in both the MAKER and GENEMARK datasets. For S41 and Asp, the predicted proteins from Maker were subsets of those from GeneMark, so we only report GeneMark names. For M36 there were several Maker predicted proteins that were not included in the GeneMark set, so we report both Maker and GeneMark names. We then aligned the sequences of the protein domains for all members in each expanded family for the three Chytridiomycota genomes (Bd, Hp, and Spizellomyces punctatus) and one Blastocladiomycota outgroup (Allomyces macrogynus). We generated these alignments using the iterative alignment program MUSCLE (Edgar, 2004). After inspecting the alignments, we found that 8 M36 and 13 Asp protein sequences were missing >50% of their domain sequences. These partial sequences were likely mis-annotation or pseudogenes so we excluded them from further analysis (see Table S2B for identities of excluded partial sequences). After aligning the protein domain sequences of the remaining proteins (see Figure S1 for alignments), we reconstructed gene trees for each family using the Maximum Likelihood method implemented in RAxML (Stamatakis et al., 2005). We used the rapid bootstrap algorithm (400 replicates) with the Jones-Taylor-Thornton substitution matrix assuming a gamma model of rate heterogeneity. We report the Maximum Likelihood trees with the highest log likelihood score and bootstrap support values.
We calculated synonymous and non-synonymous substitution rates (Ks and Ka, respectively) with the yn00 program implemented in the PAML package (Yang, 2007) using full length annotated coding sequences. For each expanded protease gene family (containing M36, S41, and Asp domains) we calculated Ks and Ka of putative orthologs between all focal taxa pairs [i.e., chytrids (Bd, Hp, and Spizellomyces punctatus) and between all focal taxa and the outgroup (Allomyces macrogynus)]. We identified putative orthologs based on a cross-species reciprocal best match between any species pairs (Hanada et al., 2008). In addition, we used a second, more stringent approach that required sequence distances between reciprocal best matches to follow the relationships between the
four focal species. Because the rate distributions from these two approaches were similar, we only report results from the first approach. Because yn00 does not robustly correct for multiple substitutions (Yang and Bielawski, 2000), and because Ks values are large between our focal taxa, we use Ks values to make a general comparison (within versus between species) for rates of molecular evolution.
We made rough divergence time estimates for the duplication events in the three expanded protease gene families using “node-Ks” as a proxy of time. The node Ks is defined as follows: for each node N in the mid-point rooted phylogeny, its Ks is the averaged Ks values between all operational taxonomic unit pairs across the two lineages that originated from N. There are no empirical estimates of chytrid substitution rates, so we do not propose specific dates for the duplication events. However, we do use a rough approximation for a reasonable substitution rate (following previous molecular evolution studies in fungi [Lynch and Conery, 2000]) to test whether the timing of gene duplications was likely coincident with the emergence of Bd as a deadly amphibian pathogen.
Results
Taxon Sampling
The phylogenetic relationship among all 19 taxa in this study can be seen in Figure A12-1. As described above, we sampled genomes from across the diversity of five fungal phyla (i.e., Chytridiomycota, Blastocladiomycota, Zygomycota, Basidiomycota, Ascomycota). Our sampling scheme allowed us to determine, in a phylogenetic context, which elements of Bd’s genome are shared with Hp and other fungal taxa.
Growth of Bd and Hp on Amphibian Skin
Both Bd and Hp grew well in standard PmTG growth media and produced viable zoospores throughout the entire 14 day observation period. However, only Bd survived on frog skin alone. Bd produced viable zoospores in the cane-toad skin treatment throughout the entire observation period, and after 14 days of incubation the Bd—frog skin solution was cloudy with chytrid growth and degraded skin (Figure A12-2). Conversely, Hp did not survive and reproduce on cane-toad skin alone. We observed viable zoospores for Hp in the cane-toad skin treatment only for the first three days (these zoospores most likely persisted from the initial inoculation), and after 14 days of incubation the Hp—cane-toad skin solution remained clear of chytrid growth and the cane-toad skin remained intact and not further degraded (Figure A12-2). We did not observe the growth of any bacterial or fungal contaminants in any of the treatments.
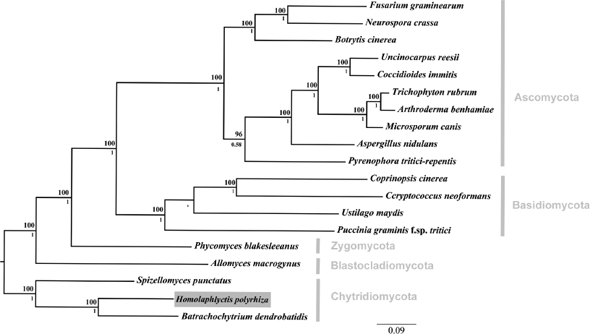
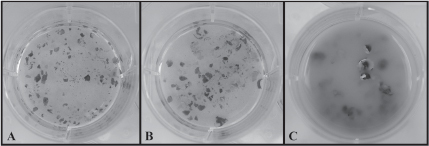
Hp Genome Sequence, Assembly, and Annotation
We achieved a roughly 11.2× coverage of the Hp genome (total number of aligned bases divided by final genome length, assuming that most of the genome is represented in the aligned reads). We assembled 922,085 screened and trimmed sequencing reads into 16,311 contigs (N50 = 36,162). We inferred a haploid genome size for Hp of 26.7 Mb, comparable to other Chytridiomycota genomes [Bd (JAM81) = 24.3 Mb, and Spizellomyces punctatus = 24.1 Mb]. We have deposited the Hp 454 reads in GenBank through the NCBI Sequence Read Archives under the accession SRA037431.1, and we have deposited the Whole Genome Shotgun project at DDBJ/EMBL/GenBank under the accession AFSM00000000 (the version described here is the first version, AFSM01000000).
We generated 5,355 high confidence MAKER predictions and 11,857 GeneMark ab initio predictions for Hp’s protein coding genes. The number of predicted Hp proteins falls within the range of other annotated chytrid genomes (8,732 predicted proteins in Bd (JAM81) and 8,804 in Spizellomyces punctatus). The difference in number of Hp predicted protein numbers between MAKER and GeneMark is due to MAKER’s conservative approach, which relies upon homology with protein-coding sequences of other species, and with the consensus of multiple ab initio gene prediction algorithms. We did not directly validate the number of expressed genes in our predicted protein sets with EST or RNA sequencing. However, we did compare the Hp predicted protein set to gene content in other species, which provides confidence in the Hp annotation and assembly. We recovered 92% (228/249) of the core eukaryotic genes using CEGMA in the Hp_Maker dataset. Similarly, we identified 3,216 orthologous groups of “chytrid-specific” proteins shared among both Bd isolates and S. punctatus (Table S3). Of the predicted chytrid-protein set we recovered 90% (2,885/3,216) in one or both Hp predicted protein sets (2,271 in Hp_Maker and 2,817 in Hp_GeneMark).
Together, these results indicate that our sequencing efforts recovered a large proportion of genes that are predicted to occur in the Hp genome.
Bd Unique Genomic Features
We identified Bd-specific genes using the genomes of Hp and 17 additional fungi. We considered genes to be Bd-specific if they were present in orthologous groups in both sequenced Bd genomes (JAM81 and JEL423) and absent from all other fungi including Hp. Using OrthoMCL clustered proteins we defined 6,556 orthologous groups in Bd (Table S4). Of the 6,556 orthologous groups in Bd, 1700 were Bd-specific by the above definition. The Bd-specific orthologous groups were comprised of 1,974 protein encoding genes, 417 (21%) of which could be functionally categorized by a Pfam domain (with an e-value <0.01) (Table S4). We did not find any orthologous groups uniquely shared between Bd and the dermatophytes to the exclusion of all other fungal outgroups (Table S4). Although we defined orthologous groups using the sequenced genomes of both Bd isolates (JAM81 and JEL423), below we report gene IDs from JAM81 for simplicity.
We conducted enrichment analyses using gene ontology (GO) terms from the set of 417 Bd-specific genes associated with a Pfam domain and found enrichment in all 3 GO structured vocabularies: Cellular Component, Biological Process, and Molecular Function. We present all significantly enriched GO terms (with a corrected P-value of ≤ = 0.05) for the Bd-specific gene set in Table A12-1. Briefly, in the Biological Process ontology we found enrichment for genes involved in metabolic processes and regulation of carbohydrates, proteins, and transcription. In the Cellular Component ontology we found enrichment of genes located extracellularly, in the nucleus, and in membranes. In the Molecular Function ontology we found enrichment for genes involved in zinc-ion binding, protein dimerization, DNA-binding, hydrolase activity, and protease and triglyceride lipase activity.
Within the set of Bd-specific and GO-enriched genes were several functional groups of particular interest for their possible role in Bd pathogenesis. First, many Bd-specific genes were proteases and were found in expanded gene families (see below). Second, the Bd-specific gene set was enriched for genes containing the Lipase_3 Pfam domain found in triacylglyceride lipases (6 of 417 in the Bd-specific gene list, vs 20 of 8732 in the genome, p<0.03) (BATDEDRAFT 93190, BATDEDRAFT 26490, BATDEDRAFT_86691, BATDEDRAFT 93191, BATDEDRAFT_89307, BATDEDRAFT_26489). Third, we identified 62 genes from the Bd-specific gene set that encode Crinkler or CRN-like microbial effectors (CRN), a class of genes previously reported only in oomycetes and not found in any of the other fungi considered here (Figure A12-3 and Table S5).
TABLE A12-1 The Enrichment of Cellular Component, Biological Process and Molecular Function GO Terms of 417 Bd Specific Genes Associated with a Pfam Domain
| GOID | Term | Corrected p-value | # in |
# in |
| GO:0006508 | Proteolysis | 1.3E-57 | 99 | 292 |
| GO:0019538 | Protein metabolic process | 1.6E-31 | 126 | 845 |
| GO:0044238 | Primary metabolic process | 5.5E-29 | 179 | 1644 |
| GO:0043170 | Macromolecule metabolic process | 1.0E-26 | 147 | 1229 |
| GO:0008152 | Metabolic process | 4.5E-24 | 196 | 2075 |
| GO:0019219 | Regulation of nucleobase, nucleoside, Nucleotide and nucleic acid metabolic process | 6.6E-17 | 46 | 205 |
| GO:0051171 | Regulation of nitrogen compound metabolic process | 6.6E-17 | 46 | 205 |
| GO:0009889 | Regulation of biosynthetic process | 8.2E-17 | 43 | 180 |
| GO:0010556 | Regulation of macromolecule biosynthetic process | 8.2E-17 | 43 | 180 |
| GO:0031326 | Regulation of cellular biosynthetic process | 8.2E-17 | 43 | 180 |
| GO:2000112 | Regulation of cellular macromolecule biosynthetic process | 8.2E-17 | 43 | 180 |
| GO:0031323 | Regulation of cellular metabolic process | 1.8E-16 | 46 | 210 |
| GO:0080090 | Regulation of primary metabolic process | 1.8E-16 | 46 | 210 |
| GO:0045449 | Regulation of transcription | 2.3E-16 | 42 | 176 |
| GO:0060255 | Regulation of macromolecule metabolic process | 6.0E-16 | 43 | 189 |
| GO:0010468 | Regulation of gene expression | 2.1E-15 | 42 | 186 |
| GO:0019222 | Regulation of metabolic process | 4.9E-15 | 46 | 227 |
| GO:0065007 | Biological regulation | 6.8E-15 | 67 | 454 |
| GO:0050789 | Regulation of biological process | 1.5E-14 | 66 | 449 |
| GO:0050794 | Regulation of cellular process | 3.3E-14 | 62 | 409 |
| GO:0006355 | Regulation of transcription, DNA-dependent | 3.4E-14 | 35 | 139 |
| GO:0051252 | Regulation of RNA metabolic process | 3.4E-14 | 35 | 139 |
| GO:0051704 | Multi-organism process | 3.6E-2 | 5 | 12 |
| GO:0005975 | Carbohydrate metabolic process | 4.5E-2 | 26 | 253 |
| GO:0005623 | Cell | 1.6E-17 | 150 | 1571 |
| GO:0044464 | Cell part | 1.6E-17 | 150 | 1571 |
| GO:0005622 | Intracellular | 5.5E-10 | 105 | 1149 |
| GO:0043231 | Intracellular membrane-bounded organelle | 4.4E-08 | 51 | 425 |
| GO:0043227 | Membrane-bounded organelle | 5.2E-08 | 51 | 427 |
| GO:0005634 | Nucleus | 1.2E-07 | 38 | 272 |
| GO:0043229 | Intracellular organelle | 1.9E-05 | 61 | 659 |
| GO:0043226 | Organelle | 2.1E-05 | 61 | 661 |
| GO:0016021 | Integral to membrane | 3.9E-05 | 33 | 271 |
| GO:0016020 | Membrane | 1.0E-04 | 58 | 645 |
| GO:0044425 | Membrane part | 1.2E-04 | 40 | 381 |
| GO:0031224 | Intrinsic to membrane | 1.6E-04 | 33 | 288 |
Bd Gene Family Expansions
We conducted more detailed analyses for three protease gene families that were identified in the Bd-specific gene set and showed GO term enrichment: metallo-, serine-type, and aspartyl proteases (M36, S41, and Asp Pfam domains, respectively). The Bd genome contained 38 metalloproteases, 32 serine-type proteases, and 99 aspartyl proteases, in all cases at least 4 times as many family members as Hp (Figure A12-3). We found that expansions of metalloproteases,
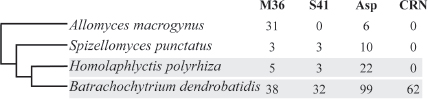
serine-type proteases and aspartyl proteases were largely Bd specific, having occurred after the split between the Bd and Hp lineages from their most recent common ancestor (Summary in Figure A12-4, gene-names available in tree, Figure S2). In all three families, Bd had a greater number of gene copies than any of the other focal taxa, and the Bd gene copies were generally clustered together to the exclusion of homologues from other taxa. This clustering is consistent with lineage-specific gene family expansions in Bd (Figure A12-4). We observed a large number of metalloprotease genes not only in Bd but also in Allomyces macrogynus (38 and 31 gene family members, respectively) (Figure A12-3). However, the gene tree indicates that the expansion of metalloprotease genes in Bd and A. macrogynus were independent with most duplication events occurring after the divergence of Bd and A. macrogynus from their common ancestor (Figure A12-4A).
In addition to identifying many lineage-specific duplicates of proteases in Bd, we demonstrate that these Bd duplication events likely occurred significantly more recently than the divergence time between the species analyzed (Figure A12-5). To assess the timing of expansion in each protease gene family, we calculated synonymous substitution rate, Ks, between homologs and based on the phylogeny, we calculated a node Ks value for each lineage-specific duplication node (Figure A12-5, left panel). The median Ks values for the metallo-, serine-type, and aspartyl—proteases derived from Bd-specific duplications were 0.37, 0.14 and 0.24, respectively (Figure A12-5, left panel). We note that in the metalloprotease family there were similar numbers of lineage-specific duplications in Bd (24) and A. macrogynus (28). However the Ks values of Bd-specific duplicates were significantly lower A. macrogynus duplicates (median Ks: 0.37 and 1.56, respectively; Kolmogorov-Smirnov tests, p<4.6e-5), indicating that Bd-specific M36 duplications took place much more recently than the A. macrogynus duplications.
We also examined Ks values of putative orthologs between Bd and Hp, Bd and S. punctatus, and Bd and A. macrogynus (Figure A12-5B, right panel). As
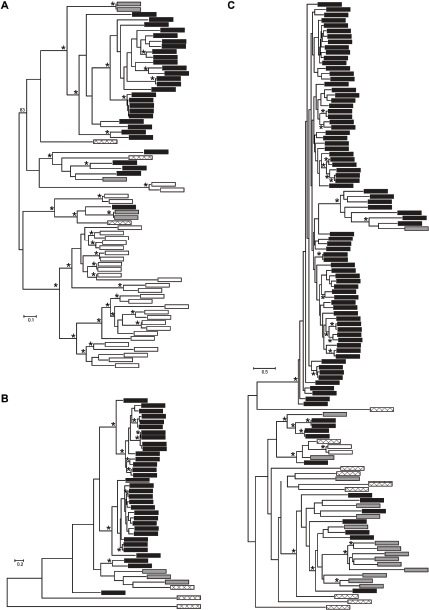
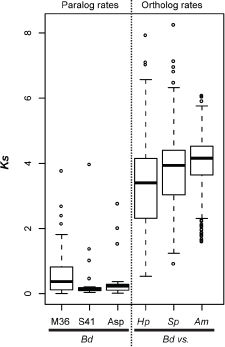
expected from the phylogenetic relationships of these four species (James et al., 2006), the median Ks for all species was high, but the median Ks for Bd-Hp (3.40) was significantly lower than that of Bd-S. punctatus (3.94) and Bd-A. macrogynus (4.03) (Kolmogorov-Smirnov tests, p<2.2e-16). Importantly, the median Bd-Hp orthologous Ks values were ~9–24 fold higher than the median Ks of Bd lineage-specific duplicates. Therefore, the Bd-specific duplications occurred substantially more recently than the divergence of Bd and Hp. Previous molecular evolution studies in fungi have used a synonymous nucleotide substitution rate of 8.1e-9 substitutions per site per year to estimate the timing of molecular events (Lynch and Conery, 2000). If this substitution rate is reasonable for chytrid fungi, the duplication events leading to the metallo-, serine-type, and aspartyl protease gene family expansions in Bd would be millions of years old (Table S6). Even if the true substitution rate differs by several orders of magnitude, it is important to
recognize that these protease duplication events occurred long before Bd emerged as a global pathogen of amphibians.
Discussion
To investigate the genomic changes that accompanied the evolution of pathogenicity, we compared Bd, the deadly chytrid pathogen of amphibians, with Hp, a closely related chytrid that is not a known pathogen of vertebrates. We confirm that Bd and Hp have different nutritional modes (Figure A12-2); unlike Hp, Bd is capable of growing on amphibian skin alone. Given the most chytrids are saprobes like Hp, Bd’s ability to infect vertebrate skin likely arose after the divergence of Bd and Hp from their common ancestor. Fungal growth on vertebrate skin requires the expression of enzymes that break-down host epidermal tissue (Burmester et al., 2011; da Silva et al., 2006; Monod, 2008; Monod et al., 2002). Because Bd causes chytridiomycosis by infecting frog skin (Longcore et al., 1999; Voyles et al., 2009) we were particularly interested in elements of the Bd genome whose evolution might have allowed Bd to colonize and degrade amphibian skin.
We compared the genomes of Bd and Hp in a broad taxonomic context of 18 diverse fungal genomes to identify genomic factors that make Bd unique. The Bd and Hp genomes are similar in size and number of predicted genes but show important differences in gene content. Therefore we could identify Bd-specific genes (i.e., genes that were found in Bd but not in Hp or other fungal outgroups). Bd-specific genes are enriched for GO terms related to extracellular and enzymatic activity. Many Bd-specific genes are members of recently expanded gene families (i.e., gene families with significantly more members than other fungal species). Below we discuss Bd-specific genes with particular emphasis on understanding how Bd may interact with its amphibian hosts.
Proteases are the most dramatically enriched class of Bd-specific genes. The Bd genome contains expanded gene families of metalloproteases, serine-type proteases, and aspartyl proteases. Each of these Bd gene families contains more than 30 family members and contains 4–10 times as many family members as found in Hp (Figure A12-3). Extracellular fungal proteases have been implicated in the adherence to, invasion of, and degradation of host cells by other fungal pathogens (Burmester et al., 2011; da Silva et al., 2006; Monod, 2008; Monod et al., 2002). In particular, protease gene family expansions have been suggested as a link to pathogenesis in other fungal pathogens. Several fungal pathogens of vertebrates (e.g., Arthroderma benhamiae, Coccidioides spp, and Trichophyton spp.) exhibit gene family expansions specifically for metalloproteases and serine-type proteases (Burmester et al., 2011; Jousson et al., 2004; Sharpton et al., 2009).
Here we strengthen the evidence implicating proteases in Bd pathogenesis in several ways. First and most importantly we demonstrate that protease gene families are not expanded in Hp and thus polarize the expansion events to a
much shorter phylogenetic branch leading to Bd. Second, we present an additional protease gene family expansion. We previously reported the Bd gene family expansions for metallo- and serine proteases (Rosenblum et al., 2008), and we now describe a dramatic expansion of aspartyl proteases in the Bd genome (Figure A12-3). Aspartyl proteases are of particular interest because they have been implicated in the adherence to and invasion of human host tissue by fungal pathogens (Candida spp.) (Kaur et al., 2007; Monod and Borg-von Zepelin, 2002). Many genes in the expanded metallo-, serine- and aspartyl-protease gene families are highly expressed, and in some cases differentially expressed between Bd life stages (Rosenblum et al., 2008). Finally, we more rigorously document the dynamics of protease gene family expansions. Calculations using a range of reasonable substitution rates show that the three protease gene family expansions occurred substantially more recently than the divergence of Bd and Hp from their common ancestor.
It is important to caution that our comparative genomics results do not conclusively demonstrate a role for proteases as pathogenicity factors. First, we lack a specific mechanism by which proteases mediate Bd host invasion. Understanding the functional consequences of protease gene family expansions will require molecular assays to determine how specific enzymes contribute to host substrate metabolism. Second, protease gene family expansions are not always obviously correlated with fungal pathogenicity. For example we observed a large number of metalloprotease genes in Allomyces macrogynus and a variable number of aspartyl proteases in several of our outgroup taxa (Figure A12-4). These are independent expansion events relative to the Bd gene duplications and are not associated with a specific shift in substrate metabolism. Third, the estimated timing of the Bd protease gene duplications does not unambiguously link particular genes to the recent emergence of Bd as a global frog pathogen. Although the gene duplication events are relatively recent, most still likely occurred millions of years ago. More ancient duplication of protease genes may have set the stage for Bd’s ability to infect frogs, but finer scale intraspecific data will be required to determine whether particular paralogs exhibit molecular signatures of recent selection.
While proteases may play the most obvious role in pathogen invasion and metabolism of host tissue, we also observed an enrichment of genes with triglyceride lipase activity in the Bd-specific gene set (Table A12-1). These enzymes are known to play a role in fungal-plant interactions (Gaillardin, 2000), and have been hypothesized to play a role in at least one fungal-vertebrate interaction—between Malassezia furfur and the skin of its human host (Brunke and Hube, 2006). M. furfur incorporates host lipids into its own cell wall; this is thought to assist M. furfur in adhering to the host and evading the host’s immune system. The extent to which Bd can utilize the products of triglyceride lipase activity for nutrition or adhesion remains to be tested. However, the enrichment of triglyceride lipase genes in the Bd-specific gene set suggests considering whether lipases could play a role in Bd’s invasion of host tissue.
In addition to the genes that may be involved in host tissue metabolism we observed a large number of Bd-specific genes with similarity to microbial proteins known as Crinklers and Crinkler-like effectors (CRN). Microbial effectors in general act within the host cytoplasm to suppress host defenses and alter normal host cell metabolism (Haas et al., 2009; Kamoun, 2006). It is unusual that a fungus contains CRN effectors as these proteins have so far only been reported from oomycetes, a group of important plant and fish pathogens within the kingdom Chromista (Cavalier-Smith and Chao, 2006). CRN effectors are modular proteins consisting of a signal-peptide, a downstream translocator domain that allows CRN proteins to gain entry into host cells, and a C-terminus domain that interacts with host proteins (Haas et al., 2009). While 62 unique Bd proteins show similarity to CRN effectors at the protein level, only one is predicted to be secreted (BATDEDRAFT_23205). Therefore while the function of putative CRN effectors in Bd remains to be determined, the possibility that they function as microbial effectors and interact with host elements merits further investigation.
We have sequenced the genome of Bd’s closest known relative to develop hypotheses for genomic determinants of Bd’s ability to infect and kill amphibians. However, the divergence between Bd and Hp is still substantial (James et al., 2006). Recent research indicates that chytrids may be more ubiquitous than previously appreciated in both aquatic and terrestrial environments (Freeman et al., 2009), and much chytrid diversity remains to be characterized. The discovery of additional taxa more closely related to Bd than Hp would help further localize genomic changes to the Bd lineage. Interspecific comparisons such as the one presented here can be complemented by intraspecific comparisons among Bd isolates to understand the evolutionary dynamics of genes hypothesized to play a role in Bd pathogenicity. However, robust hypothesis testing will require functional characterization of genes that may be important to Bd’s ability to infect frogs. Bd currently lacks a transformation system in which to study gene function, but heterologous expression systems could potentially be used to determine specific gene functions. Additionally, understanding expression patterns of candidate genes under different nutrient conditions and during different stages of host invasion are likely to yield important insights. Ultimately, identifying the molecular mechanisms of host-pathogen interactions will provide new avenues for mitigating the devastating effects of chytridiomycosis.
Acknowledgments
We thank Joyce Longcore (University of Maine) for providing Hp strain JEL142. We thank Matt Settles (University of Idaho) for bioinformatics support. We thank Joyce Longcore, Tim James (University of Michigan), and Jamie Voyles (University of Idaho) for comments on the manuscript and input throughout the project. We acknowledge Igor Grigoriev and the Joint Genome Institute for access to the B. dendrobatidis (JAM81) genome.
Conceived and designed the experiments: SJ JES EBR. Performed the experiments: SJ. Analyzed the data: SJ JES SHS. Contributed reagents/materials/analysis tools: JES SHS SJ EBR. Wrote the paper: SJ EBR.
References
Altschul SF, Gish W, Miller W, Myers EW, Lipman DJ (1990) Basic local alignment search tool. J Mol Biol 215: 403–410.
Barr DJS (1986) Allochytridium expandens rediscovered—morphology, physiology and zoospore ultrastructure. Mycologia 78: 439–448.
Berger L, Speare R, Daszak P, Green DE, Cunningham AA, et al. (1998) Chytridiomycosis causes amphibian mortality associated with population declines in the rain forests of Australia and Central America. Proc Natl Acad Sci U S A 95: 9031–9036.
Boyle EI, Weng SA, Gollub J, Jin H, Botstein D, et al. (2004) GO::TermFinder—open source software for accessing Gene Ontology information and finding significantly enriched Gene Ontology terms associated with a list of genes. Bioinformatics 20: 3710–3715.
Brunke S, Hube B (2006) MfLIP1, a gene encoding an extracellular lipase of the lipid-dependent fungus Malassezia furfur. Microbiology 152: 547–554.
Burmester A, Shelest E, Glöckner G, Heddergott C, Schindler S, et al. (2011) Comparative and functional genomics provide insights into the pathogenicity of dermatophytic fungi. Genome Biol 12: R7.
Cantarel BL, Korf I, Robb SMC, Parra G, Ross E, et al. (2008) MAKER: An easy-to-use annotation pipeline designed for emerging model organism genomes. Genome Res 18: 188–196.
Capella-Gutiérrez S, Silla-Martínez JM, Gabaldón T (2009) trimAl: a tool for automated alignment trimming in large-scale phylogenetic analyses. Bioinformatics 25: 1972–1973.
Cavalier-Smith T, Chao EEY (2006) Phylogeny and megasystematics of phagotrophic heterokonts (kingdom Chromista). J Mol Evol 62: 388–420.
da Silva BA, dos Santos ALS, Barreto-Bergter E, Pinto MR (2006) Extracellular peptidase in the fungal pathogen Pseudallescheria boydii. Curr Microbiol 53: 18–22.
Dewey C (2007) Aligning multiple whole genomes with Mercator and MAVID. Methods Mol Biol 395: 221–236.
Edgar RC (2004) MUSCLE: multiple sequence alignment with high accuracy and high throughput. Nucleic Acids Res 32: 1792–1797.
Finn RD, Mistry J, Tate J, Coggill P, Heger A, et al. (2010) The Pfam protein families database. Nucleic Acids Res 38: D211–D222.
Freeman KR, Martin AP, Karki D, Lynch RC, Mitter MS, et al. (2009) Evidence that chytrids dominate fungal communities in high-elevation soils. Proc Natl Acad Sci U S A 106: 18315–18320.
Gaillardin C (2010) Lipases as Pathogenicity Factors of Fungi. In: Timmis KN, editor. Handbook of Hydrocarbon and Lipid Microbiology. Springer. pp. 3259–3268.
Haas BJ, Kamoun S, Zody MC, Jiang RHY, Handsaker RE, et al. (2009) Genome sequence and analysis of the Irish potato famine pathogen Phytophthora infestans. Nature 461: 393–398.
Hanada K, Zou C, Lehti-Shiu MD, Shinozaki K, Shiu SH (2008) Importance of lineage-specific expansion of plant tandem duplicates in the adaptive response to environmental stimuli. Plant Physiol 148: 993–1003.
Hoskisson PA, Trevors JT (2010) Shifting trends in pathogen dynamics on a changing planet. Antonie Van Leeuwenhoek 98: 423–427.
James TY, Letcher PM, Longcore JE, Mozley-Standridge SE, Porter D, et al. (2006) A molecular phylogeny of the flagellated fungi (Chytridiomycota) and description of a new phylum (Blastocladiomycota). Mycologia 98: 860–871.
Jousson O, Léchenne B, Bontems O, Capoccia S, Mignon B, et al. (2004) Multiplication of an ancestral gene encoding secreted fungalysin preceded species differentiation in the dermatophytes Trichophyton and Microsporum. Microbiology 150: 301–310.
Kamoun S (2006) A catalogue of the effector secretome of plant pathogenic oomycetes. Annu Rev Phytopathol 44: 41–60.
Kaur R, Ma B, Cormack BP (2007) A family of glycosylphosphatidylinositol-linked aspartyl proteases is required for virulence of Candida glabrata. Proc Natl Acad Sci U S A 104: 7628–7633.
Letcher PM, Powell MJ, Churchill PF, Chambers JG (2006) Ultrastructural and molecular phylogenetic delineation of a new order, the Rhizophydiales (Chytridiomycota). Mycol Res 110: 898–915.
Li L, Stoeckert CJ, Roos DS (2003) OrthoMCL: Identification of ortholog groups for eukaryotic genomes. Genome Res 13: 2178–2189.
Lips KR, Brem F, Brenes R, Reeve JD, Alford RA, et al. (2006) Emerging infectious disease and the loss of biodiversity in a Neotropical amphibian community. Proc Natl Acad Sci U S A 103: 3165–3170.
Longcore JE, Pessier AP, Nichols DK (1999) Batrachochytrium dendrobatidis gen et sp nov, a chytrid pathogenic to amphibians. Mycologia 91: 219–227.
Lötters S, La Marca E, Stuart S, Gagliardo R, Veith M (2004) A new dimension of current biodiversity loss. Herpetotropicos 1: 29–31.
Lynch M, Conery JS (2000) The evolutionary fate and consequences of duplicate genes. Science 290: 1151–1155.
Monod M (2008) Secreted proteases from dermatophytes. Mycopathologia 166: 285–294.
Monod M, Borg-von Zepelin M (2002) Secreted aspartic proteases as virulence factors of Candida species. Biol Chem 383: 1087–1093.
Monod M, Capoccia S, Léchenne B, Zaugg C, Holdom M, et al. (2002) Secreted proteases from pathogenic fungi. Int J Med Microbiol 292: 405–419.
Notredame C, Higgins DG, Heringa J (2000) T-Coffee: A novel method for fast and accurate multiple sequence alignment. J Mol Biol 302: 205–217.
Parra G, Bradnam K, Korf I (2007) CEGMA: a pipeline to accurately annotate core genes in eukaryotic genornes. Bioinformatics 23: 1061–1067.
Rachowicz LJ, Knapp RA, Morgan JAT, Stice MJ, Vredenburg VT, et al. (2006) Emerging infectious disease as a proximate cause of amphibian mass mortality. Ecology 87: 1671–1683.
Rosenblum EB, Stajich JE, Maddox N, Eisen MB (2008) Global gene expression profiles for life stages of the deadly amphibian pathogen Batrachochytrium dendrobatidis. Proc Natl Acad Sci U S A 105: 17034–17039.
Sharpton TJ, Stajich JE, Rounsley SD, Gardner MJ, Wortman JR, et al. (2009) Comparative genomic analyses of the human fungal pathogens Coccidioides and their relatives. Genome Res 19: 1722–1731.
Skerratt LF, Berger L, Speare R, Cashins S, McDonald KR, et al. (2007) Spread of chytridiomycosis has caused the rapid global decline and extinction of frogs. EcoHealth 4: 125–134.
Smith KF, Guegan JF (2010) Changing Geographic Distributions of Human Pathogens. Annual Review of Ecology, Evolution, and Systematics, Vol 41. Palo Alto: Annual Reviews. pp. 231–250.
Stamatakis A, Ludwig T, Meier H (2005) RAxML-III: a fast program for maximum likelihood-based inference of large phylogenetic trees. Bioinformatics 21: 456–463.
Ter-Hovhannisyan V, Lomsadze A, Chernoff YO, Borodovsky M (2008) Gene prediction in novel fungal genomes using an ab initio algorithm with unsupervised training. Genome Res 18: 1979–1990.
Voyles J, Young S, Berger L, Campbell C, Voyles WF, et al. (2009) Pathogenesis of Chytridiomycosis, a Cause of Catastrophic Amphibian Declines. Science 326: 582–585.
Woolhouse M, Gaunt E (2007) Ecological origins of novel human pathogens. Crit Rev Microbiol 33: 231–242.
Yang ZH (2007) PAML 4: Phylogenetic analysis by maximum likelihood. Mol Biol Evol 24: 1586–1591.
Yang ZH, Bielawski JP (2000) Statistical methods for detecting molecular adaptation. Trends Ecol Evol 15: 496–503.
Zolan ME, Pukkila PJ (1986) Inheritance of DNA methylation in Coprinus cinereus. Mol Cell Biol 6: 195–200.
NATURAL AND EXPERIMENTAL INFECTION OF CAENORHABDITIS
NEMATODES BY NOVEL VIRUSES RELATED TO NODAVIRUSES50
Marie-Anne Félix,51,†,‡Alyson Ashe,52,‡Joséphine Piffaretti,51,‡
Guang Wu,53Isabelle Nuez,51Tony Békucard,51Yanfang Jiang,53
Guoyan Zhao,53Carl J. Franz,53Leonard D. Goldstein,52
Mabel Sanroman,51Eric A. Miska,52,†and David Wang53,†
Abstract
An ideal model system to study antiviral immunity and host-pathogen co-evolution would combine a genetically tractable small animal with a virus capable of naturally infecting the host organism. The use of C. elegans as a model to define host-viral interactions has been limited by the lack of viruses known to
_______________________
50 Reprinted from PLoS Biology. Originally published as Félix M-A, Ashe A, Piffaretti J, Wu G, Nuez I, et al. (2011) Natural and Experimental Infection of Caenorhabditis Nematodes by Novel Viruses Related to Nodaviruses. PLoS Biol 9(1): e1000586. doi:10.1371/journal.pbio.1000586
Copyright: © 2011 Félix et al. This is an open-access article distributed under the terms of the Creative Commons Attribution License, which permits unrestricted use, distribution, and reproduction in any medium, provided the original author and source are credited.
Funding: This work was supported in part by the CNRS (Félix lab), National Institutes of Health grant U54 AI057160 to the Midwest Regional Center of Excellence for Biodefense and Emerging Infectious Disease Research (Wang lab), and a Cancer Research UK Programme Grant (Miska lab). DW holds an Investigators in the Pathogenesis of Infectious Disease Award from the Burroughs Wellcome Fund. AA was supported by a fellowship from the Herchel-Smith Foundation. The funders had no role in study design, data collection and analysis, decision to publish, or preparation of the manuscript.
Competing Interests: Eric Miska’s spouse is a member of the PloS Biology editorial staff; in accordance with the PLoS policy on competing interests she has been excluded from all stages of the review process for this article.
†E-mail: felix@ijm.univ-paris-diderot (MAF); eam29@cam.ac.uk (EAM); davewang@wustl.edu (DW)
‡These authors contributed equally to this work.
51 Institut Jacques Monod, CNRS-University of Paris-Diderot, Paris, France.
52 Gurdon Institute, University of Cambridge, Cambridge, United Kingdom.
53 Departments of Molecular Microbiology and Pathology & Immunology, Washington University in St. Louis School of Medicine, St. Louis, Missouri, United States of America.
infect nematodes. From wild isolates of C. elegans and C. briggsae with unusual morphological phenotypes in intestinal cells, we identified two novel RNA viruses distantly related to known nodaviruses, one infecting specifically C. elegans (Orsay virus), the other C. briggsae (Santeuil virus). Bleaching of embryos cured infected cultures demonstrating that the viruses are neither stably integrated in the host genome nor transmitted vertically. 0.2 μm filtrates of the infected cultures could infect cured animals. Infected animals continuously maintained viral infection for 6 mo (~50 generations), demonstrating that natural cycles of horizontal virus transmission were faithfully recapitulated in laboratory culture. In addition to infecting the natural C. elegans isolate, Orsay virus readily infected laboratory C. elegans mutants defective in RNAi and yielded higher levels of viral RNA and infection symptoms as compared to infection of the corresponding wild-type N2 strain. These results demonstrated a clear role for RNAi in the defense against this virus. Furthermore, different wild C. elegans isolates displayed differential susceptibility to infection by Orsay virus, thereby affording genetic approaches to defining antiviral loci. This discovery establishes a bona fide viral infection system to explore the natural ecology of nematodes, host-pathogen co-evolution, the evolution of small RNA responses, and innate antiviral mechanisms.
Author Summary
The nematode C. elegans is a robust model organism that is broadly used in biology. It also has great potential for the study of host-microbe interactions, as it is possible to systematically knockout almost every gene in high-throughput fashion to examine the potential role of each gene in infection. While C. elegans has been successfully applied to the study of bacterial infections, only limited studies of antiviral responses have been possible since no virus capable of infecting any Caenorhabditis nematode in laboratory culture has previously been described. Here we report the discovery of natural viruses infecting wild isolates of C. elegans and its relative C. briggsae. These novel viruses are most closely related to the ssRNA nodaviruses, but have larger genomes than other described nodaviruses and clearly represent a new taxon of virus. We were able to use these viruses to infect a variety of laboratory nematode strains. We show that mutant worms defective in the RNA interference pathway, an antiviral system known to operate in a number of organisms, accumulate more viral RNA than wild type strains. The discovery of these viruses will enable further studies of host-virus interactions in C. elegans and the identification of other host mechanisms that counter viral infection.
Introduction
Model organisms such as D. melanogaster (Hao et al., 2008; Sabin et al., 2009) and C. elegans (Kim et al., 2002; Powell et al., 2009) have been increasingly
used in recent years to examine features of the host immune system and host-pathogen co-evolution mechanisms, due to the genetic tractability and ease of manipulation of these organisms. A prerequisite to fully exploit such models is the identification of an appropriate microbe capable of naturally infecting the host organism. Analysis in C. elegans of bacterial pathogens such as Pseudomonas, Salmonella, or Serratia has been highly fruitful, in some instances revealing the existence of innate immune pathways in C. elegans that are also conserved in vertebrates (Kim et al., 2002). The recent report of natural infections of C. elegans intestinal cells by microsporidia makes it a promising model for microsporidia biology (Troemel et al., 2008). Efforts to use C. elegans to understand anti-viral innate immunity, however, have been hampered by the lack of a natural virus competent to infect and replicate in C. elegans.
In the absence of a natural virus infection system, some efforts to define virus-host responses in C. elegans have been pursued using artificial methods of introducing viruses or partial virus genomes into animals (Liu et al., 2006; Lu et al., 2005). For example, the use of a transgenic Flock House virus RNA1 genome segment has clearly established a role for RNAi in counteracting replication of Flock House virus RNA (Lu et al., 2005) and has defined genes essential for the RNAi response (Lu et al., 2009). However, this experimental system can only examine replication of the viral RNA and is fundamentally unable to address the host response to other critical aspects of the virus life cycle such as virus entry, virion assembly, or egress. The ability of a host to target steps other than genome replication to control viral infections is highlighted by recent discoveries such as the identification of tetherin, which plays a critical role at the stage of viral egress by blocking the release of fully assembled HIV virions from infected human cells (Neil et al., 2008). Furthermore, the artificial systems used to date for analysis of virus-nematode interactions cannot be used to examine transmission dynamics of virus infection. These limitations underscore the need to establish an authentic viral infection and replication system in nematodes.
Natural populations of C. elegans have proven hard to find until recent years. The identification of C. elegans habitats and the development of simple isolation methods (MAF, unpublished) (Barrière and Félix, 2006) has now enabled extensive collection of natural isolates of C. elegans. Here we report the discovery of natural populations of C. elegans and of its close relative C. briggsae that display abnormal morphologies of intestinal cells. These abnormal phenotypes can be maintained in permanent culture for several months, without detectable microsporidial or bacterial infection. We show that these populations are infected by two distinct viruses, one specific for C. elegans (Orsay virus), one for C. briggsae (Santeuil virus). These viruses resemble viruses in the Nodaviridae family, with a small, bipartite, RNA (+sense) genome. Infection by each virus is transmitted horizontally. In both nematode species, we find intraspecific variation in sensitivity to the species-specific virus. We further show that infected worms mount a small RNA response and that RNAi mechanisms act as antiviral immunity in
nematodes. Finally, we demonstrate that the C. elegans isolate from which Orsay virus was isolated is incapable of mounting an effective RNAi response in somatic cells. We thus find natural variation in host antiviral defenses. Critically, these results establish the first experimental viral infection system in C. elegans suitable for probing all facets of the host antiviral response.
Results
Natural Viral Infections of C. briggsae and C. elegans
From surveys of wild nematodes from rotting fruit in different regions of France, multiple Caenorhabditis strains were isolated that displayed a similar unusual morphology of the intestinal cells and no visible pathogen by optical microscopy. Intestinal cell structures such as storage granules disappeared (Figures A13-1A–J, A13-2A–C) and the cytoplasm lost viscosity and became fluid (Figure A13-1B, I), moving extensively during movement of the animal. The intestinal apical border showed extensive convolutions and intermediate filament disorganization (Figures A13-1A, A13-2H, as described in some intermediate filament mutants [Hüsken et al., 2008]). Multi-membrane structures were sometimes apparent in the cytoplasm (Figure A13-1C). Elongation of nuclei and nucleoli, and nuclear degeneration, were observed using Nomarski optics, live Hoechst 33342 staining, and electron microscopy (Figures A13-1E–H, A13-2D– F). Finally, some intestinal cells fused together (Figure A13-1I). This suite of symptoms was first noticed during sampling of C. briggsae. Indeed, more individuals appeared affected in C. briggsae than in C. elegans cultures, and to a greater extent (Figure A13-1K).
One representative, stably infected, strain of each nematode species, C. elegans JU1580 (isolated from a rotting apple in Orsay, France) and C. briggsae JU1264 (isolated from a snail on a rotting grape in Santeuil, France), were selected for detailed analysis. Bleaching of adult animals resulted in phenotype-free progeny from both strains, demonstrating that the phenotype was not vertically transmitted (embryos are resistant to the bleaching treatment) (Figure A13-1K). Addition of dead infected animals, or homogenates from infected animals after filtration through 0.2 μm filters, to plates containing previously bleached animals recapitulated the morphological phenotype, raising the possibility that a virus might play a role in inducing the morphological phenotype (Figure A13-1K). We found that the infectious agent could be passed on horizontally through live animals by incubating GFP-labeled animals (strain JU1894, Table A13-1) with 10 non-GFP-infected worms (JU1580), checking that the latter did not die before removing them 24 h later. The GFP-labeled culture displayed the intestinal symptoms after a week. One possibility is that the intestinal infectious agent is shed from the intestine through the rectum and may enter the next animal during feeding.
In support of the hypothesis that these wild Caenorhabditis were infected by a virus, small virus-like particles of approximately 20 nm diameter were visible by electron microscopy of the intestinal cells (Figures A13-2H, S1). Such particles were not observed in bleached animals, nor in C. elegans animals infected by bacteria, which showed a strong reduction of intestinal cell volume (strain JU1409, unpublished data).
While a clear morphological phenotype was visible by microscopy, infection did not cause a dramatic decrease in adult longevity (unpublished data), nor a change in brood size (Figure S2A,B). However, progeny production was significantly slowed down during adulthood, most clearly in the infected C. briggsae JU1264 isolate compared to the uninfected control (Figure S2D).
Molecular Identification of Two Divergent Viruses
An unbiased high-throughput pyrosequencing approach was used to determine whether any known or novel viruses were present in the animals. From JU1264, 28 unique sequence reads were identified initially that shared 30%–48% amino acid sequence identity to known viruses in the family Nodaviridae. Nodaviruses are bipartite positive strand RNA viruses. The RNA1 segment of all previously described nodaviruses is ~3.1 kb and encodes ORF A, the viral RNA-dependent RNA polymerase. Some nodaviruses also encode ORFs B1/B2 at the 3′ end of the RNA1 segment. The B1 protein is of unknown function while the B2 protein is able to inhibit RNAi (Li et al., 2002). The RNA2 segment of all previously described nodaviruses is ~1.4 kb and possesses a single ORF encoding the viral capsid protein. Assembly of the initial JU1264 pyrosequencing reads followed by additional pyrosequencing, RT-PCR, 5′ RACE, and 3′ RACE yielded two final contigs, which were confirmed by sequencing of overlapping RT-PCR amplicons. The two contigs corresponded to the RNA1 and RNA2 segments of a novel virus. The first contig (3,628 nt) encoded a predicted open reading frame of 982 amino acids that shared 26%–27% amino acid identity to the RNA-dependent RNA polymerase of multiple known nodaviruses by BLAST alignment. All known nodavirus B2 proteins overlap with the C-terminus of the RNA-dependent RNA polymerase and are encoded in the +1 frame relative to the polymerase. No open reading frame with these properties was predicted in the 3′ end of the RNA1 segment. The second contig of 2,653 nt, which was presumed to be the near-complete RNA2 segment, encoded at its 5′ end a predicted protein with ~30% identity to known nodavirus capsid proteins (Figure A13-3A). This contig was ~1 kb larger than the RNA2 segment of all previously described nodaviruses and appeared to encode a second ORF of 332 amino acids at the 3′ end. This second predicted ORF, named ORF δ, had no significant BLAST similarity to any sequence in Genbank.
Pyrosequencing of JU1580 demonstrated the presence of a second distinct virus that shared the same general genomic organization as the virus detected in
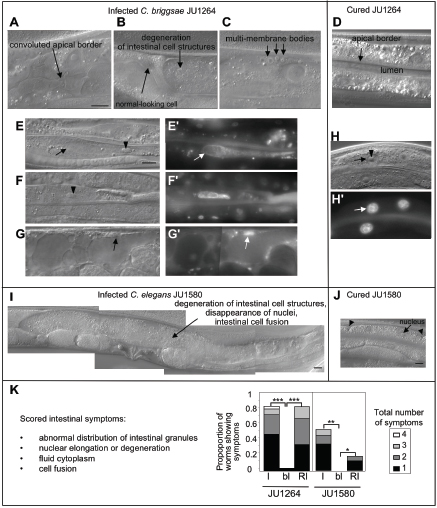
FIGURE A13-1 Intestinal cell infection phenotypes in wild Caenorhabditis isolates. (A– H) C. briggsae JU1264 and (I, J) C. elegans JU1580 observed by Nomarski microscopy. (A–C, E–G, I) Infected adult hermaphrodites from the original cultures, with the diverse infection symptoms: convoluted apical intestinal border (A), degeneration of intestinal cell structures and liquefaction of the cytoplasm (B, G, I), presence of multi-membrane bodies (C). The animals in (E–H) were also observed in the fluorescence microscope after live Hoechst 33342 staining of the nuclei, showing the elongation and degeneration of nuclei (E′.H′). In (E), the nucleus and nucleolus are abnormally elongated. In (F), the nuclear membrane is no longer visible by Nomarski optics. In (G), the cell cytoplasmic structures are highly abnormal (apparent vacuolisation) and the nucleus is very reduced in size. In (E–H′), arrows denote nuclei and arrowheads nucleoli. The infected animal in (I)
|
Strain |
Genotype |
|
JU1264 |
C. briggsae wild isolate, Santeuil, France |
|
JU1580 |
C. elegans wild isolate, Orsay, France |
|
AF16 |
C. briggsae wild reference isolate, India |
|
N2 |
C. elegans wild reference isolate, England |
|
CB4856 |
C. elegans wild isolate, Hawaii |
|
AB1 |
C. elegans wild isolate, Australia |
|
PB303 |
C. elegans wild isolate, USA |
|
PB306 |
C. elegans wild isolate, USA |
|
JU258 |
C. elegans wild isolate, Madeira |
|
PS2025 |
C. elegans wild isolate, California, USA |
|
JU1894 |
mfEx50[let858::GFP, myo-2::DsRed] in JU1580 background |
|
JU1895 |
mfEx51[let858::GFP, myo-2::DsRed] in N2 background |
|
WM27 |
rde-1(ne219) V |
|
WM29 |
rde-2(ne221) I |
|
WM49 |
rde-4(ne301) III |
|
NL936 |
unc-32(e189) mut-7(pk204) III |
JU1264. Partial genome sequences of 2,680 nucleotides of the RNA1 segment and 2,362 nucleotides of the RNA2 segment were obtained and confirmed by RT-PCR. The putative RNA-dependent RNA polymerases of the two viruses shared 44% amino acid identity by BLAST analysis. Like the virus in JU1264, the virus in JU1580 was predicted to encode a capsid protein at the 5′ end of the RNA2 segment as well as a second ORF in the 3′ half of the RNA2 segment. The ORF δ encoded proteins from the two viruses shared 37% amino acid identity when compared using BLAST. Thus, the genomic organization of these two viruses, while sharing substantial commonality with known nodaviruses, also displayed novel genomic features. Phylogenetic analysis of the predicted RNA polymerase and capsid proteins demonstrated that the virus sequences in JU1580 and JU1264
_______________________
displays an abnormally large intestinal cell that is probably the result of cell fusions, with degeneration of cellular structures including nuclei. (D, H, J) Uninfected (bleached) adults. Arrowheads in (J) indicate antero-posterior boundaries between intestinal cells, each of which generally contains two nuclei. Bars: 10 m. (K) Proportion of worms showing the indicated cumulative number of morphological infection symptoms in at least one intestinal cell, in the original wild isolate (I), after bleaching (bl) and after re-infection by a 0.2 M filtrate (RI). Note that not all symptoms shown in (A–I) were scored, because some are difficult to score or may also occur in healthy animals. The animals were scored 4 d after re-infection for C. briggsae JU1264, and 7 d after re-infection for C. elegans JU1580, at 23°C. The symptoms are similar in both species, and generally more frequent in JU1264. *** p value on number of worms showing infection symptoms <7.10–11, Fisher’s exact test; ** p value<3.10–6; * p value<3.10–2.
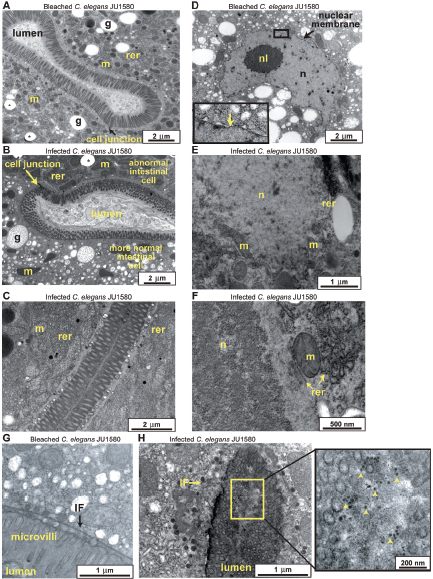
were highly divergent from all previously described nodaviruses and most closely related to each other (Figure A13-3B,C). We propose that these sequences represent two novel virus species and have tentatively named them Santeuil virus (from JU1264) and Orsay virus (from JU1580).
Viral Detection and Confirmation of Viral Infection
RT-PCR assays were used to analyze RNA extracted from JU1580, JU1264, their corresponding bleached control strains JU1580bl and JU1264bl, and the same strains following reinfection with viral filtrates. Orsay virus RNA could be detected by RT-PCR in the original JU1580 culture, disappeared in the bleached strains, and stably reappeared following re-infection with the corresponding viral filtrate (Figure A13-4A). The same pattern applied for the Santeuil virus and JU1264 animals (Figure A13-4B). JU1580 and JU1264 cultures continuously propagated for 6 mo by transferring a piece of agar (approx. 0.1 cm3) to the next plate twice a week continued to yield positive RT-PCR results (unpublished data).
Northern blotting confirmed the presence of Orsay and Santeuil virus RNA sequences in the infected animals. Hybridization with a DNA probe targeting the RNA1 segment of Santeuil virus yielded multiple bands in JU1264 animals but not in the corresponding bleached control strain. The strongest band detected migrated between 3.5 and 4 kb consistent with the 3,628 nt sequence we generated for the putative complete RNA1 segment (Figure A13-4C). Multiple higher molecular weight bands were also detected that may represent multimeric forms of the viral genomic RNAs, which have previously been described for some nodaviruses (Ball, 1994; Johnson et al., 2000). Northern blotting with a probe targeting the RNA2 segment (Figure A13-4C) yielded a major band that migrated at ~2.5 kb as well as fainter, higher molecular weight bands. Similar patterns were seen for both segments of Orsay virus (unpublished data).
* hole in the resin used for inclusion in electron microscopy. (D–F) A nucleus in a non-infected animal is surrounded by a nuclear membrane (see inset in D), whereas the nuclear membrane disappears upon infection (E–F). Absence or incomplete nuclear membrane was observed repeatedly in infected animals, while the nuclear membrane could be observed on bleached animals (using both fixation methods). The nuclear material (n) in (F) may represent nucleolar material and at lower magnification (not shown) matches the shape of elongated nucleoli as observed by Nomarski optics (Figure A13-1E–G). The rough endoplasmic reticulum (rer) on the left of the mitochondrion (m) in (F) may be a remnant of the nuclear envelope. (G–H) The infection may result in disorganization of the intermediate filament (IF) network normally located below the apical plasma membrane. On the right of (H) is shown a higher magnification of the intestinal lumen, showing putative viral particles (arrowheads). The animals were fixed using high-pressure freezing (A–C, E–F) or conventional fixation (D, G, H).
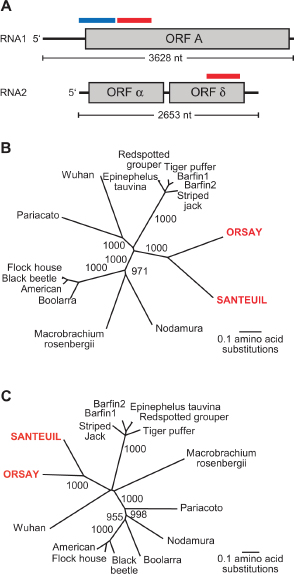
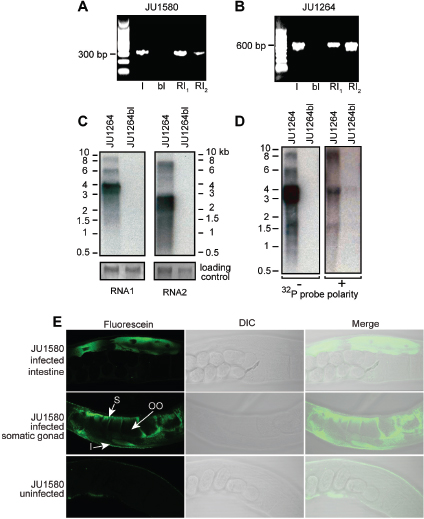
To demonstrate virus replication in the infected animals, we performed Northern blotting using strand-specific riboprobes. For positive sense RNA viruses like nodaviruses, the negative sense RNA is only synthesized during active viral replication. It is not packaged in virions and typically exists in much lower quantities than the positive strand. Robust levels of the positive strand of the Santeuil virus RNA1 segment were detected (Figure A13-4D). Northern blotting with a riboprobe designed to hybridize to the negative sense strand detected a band of ~3.5 kb as well as higher molecular weight bands and a lower band of ~1.5 kb (~30-fold longer exposure than the positive sense blot; Figure A13-4D). While the precise nature of the high and low molecular weight species remains to be defined, the presence of multiple RNA species of negative sense polarity in JU1264 animals demonstrates bona fide replication of Santeuil virus in JU1264.
In order to determine the localization of Orsay viral RNA in infected animals, we performed RNA fluorescent in situ hybridization (FISH) using a probe complementary to the positive sense RNA1 segment of Orsay virus. Viral RNA was robustly detected in intestinal cells of JU1580bl animals infected 4 d previously with Orsay viral filtrate (Figure A13-4E, top panels). Interestingly, some animals also showed localization of viral RNA in the somatic gonad (Figure A13-4E, middle panels). JU1580bl animals not treated with the viral filtrate displayed no fluorescent signal (Figure A13-4E, bottom panels).
High Specificity of Infection by Orsay and Santeuil Nodaviruses
We tested whether the Orsay and Santeuil viruses could cross-infect the cured wild isolate of the other Caenorhabditis species, as well as the reference laboratory strains of C. elegans and C. briggsae. The Orsay and Santeuil viruses could only infect strains of C. elegans and C. briggsae, respectively (Figure A13-5A,B and Figure S3). Furthermore, each virus showed intraspecific specificity of infection. Indeed, we could not detect any replication of the Santeuil virus in C. briggsae AF16. The N2 laboratory C. elegans strain, while infectable by Orsay virus, appeared to be more resistant to viral infection than JU1580bl. Quantitative RT-PCR demonstrated that viral RNA accumulated in the N2 strain at levels above background but 50–100-fold lower than in JU1580bl (Figure A13-5C).
Small RNA Response upon Infection
One key defense mechanism of plants and animals against RNA viruses is the small RNA response (Aliyari and Ding, 2009). We therefore determined by deep sequencing of small RNAs whether the infected animals produced small RNAs in response to viral infection. We generated small RNA libraries from mixed-stage JU1580 animals infected with the Orsay virus and from the bleached control strain and analyzed them using Illumina/Solexa high-throughput sequencing. These libraries represent small RNAs of 18–30 nucleotides in length
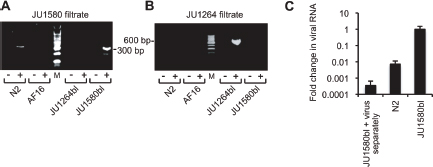
independent of their 5′ termini. Small RNAs from infected JU1580 animals that mapped to viral RNA1 or RNA2 and had no match to the C. elegans genome are shown in Figure A13-6A and A13-6B, respectively. Of a total of 1,149,633 unambiguously mapped unique sequences, almost 2% (21,392) mapped to the two RNA segments of Orsay virus. Such RNAs were virtually absent from a library generated from bleached JU1580 animals (<0.001%) (unpublished data). Small RNAs that corresponded to the sense strand of the viral RNAs had a broad length distribution and no 5′ nucleotide preference. These sense small RNAs might represent Dicer cleavage products or other viral RNA degradation intermediates. In contrast, most antisense small RNAs were 22 nt long and showed a bias for guanidine as the first base (Figure A13-6A, B). This signature is reminiscent of a class of secondary RNAs named 22G RNAs that are thought to be downstream effectors of exogenous and endogenous small RNA pathways (Gu et al., 2009; Pak and Fire, 2007; Sijen et al., 2007). Such RNAs are not associated with transgenes expressed in the soma of C. elegans from extrachromosomal arrays (Pak and Fire, 2007) nor generally a feature associated with active transcription of endogenous genes (Gu et al., 2009; Pak and Fire, 2007; Sijen et al., 2007). These
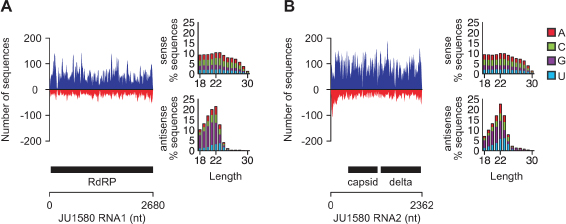
data suggest that JU1580 animals raise a small RNA response to viral infection. We also detected small RNAs of both sense and antisense polarity that mapped to the Santeuil virus genome in the JU1264 wild C. briggsae isolate but not in bleached animals (unpublished data).
RNAi Competency of the Host Is an Antiviral Defense
As viral infection appears to invoke a small RNA response in JU1580 animals, we next tested if mutations in small RNA pathways could affect replication of the Orsay virus. Orsay virus infection of the N2 reference strain was reduced compared to JU1580, as assayed by viral RNA qRT-PCR (Figure A13-5C) and infection symptoms (Figures S3A and A13-7B). Mutation of the rde-1 gene— which encodes an Argonaute protein required for the initiation of exogenous RNAi (Tabara et al., 1999)—in the N2 background increased viral RNA abundance and morphological symptoms to levels comparable to JU1580 using both assays (Figure A13-7A,B). The infected rde-1 strain produced infectious viral particles, as reinfection of the cured JU1580 strain by filtrates of infected rde-1 animals yielded positive RT-PCR results (unpublished data). In addition, mutation of other exogenous RNAi pathway genes including rde-2, rde-4, and mut-7 (Table A13-1) also led to increased viral RNA accumulation as determined by quantitative RT-PCR (Figure A13-7A). We thus conclude that RNAi mechanisms
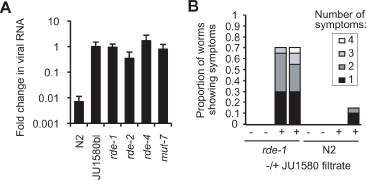
FIGURE A13-7 RNAi-deficient mutants of C. elegans can be infected by the Orsay virus. (A) JU1580bl, N2, rde-1(ne219) (n = 10 independent replicates each), rde-2(ne221), rde-4(ne301), and mut-7(pk204) (n = 5 independent replicates each) were tested by qRT-PCR for infection with Orsay virus extract. RNA levels were normalized to ama-1 and shown as average fold-change relative to JU1580bl. Error bars represent SEM. Same results as displayed in Figure A13-5C for N2 and JU1580. (B) Scoring of symptoms in two independent replicates of infection of rde-1 mutant and wild-type N2 animals by the Orsay virus filtrate, after 4 d.
provide antiviral immunity to C. elegans and that Orsay virus infection of mutant animals can be used to define genes important for antiviral defense.
Natural Variation in Somatic RNAi Efficiency in C. elegans
Since a functional RNAi pathway limits the accumulation of viral RNA in the N2 reference strain, we assessed the exogenous RNAi competency of the bleached culture of JU1580 (JU1580bl) relative to the reference N2 strain. Using external application of dsRNAs by feeding, JU1580bl was found to be highly resistant to RNAi of a somatically expressed gene (unc-22) but competent for RNA inactivation of a germline-expressed gene (pos-1) (Figure A13-8A, B). C. elegans wild isolates, such as CB4856, were previously known to be variably sensitive to germline RNAi (Tijsterman et al., 2002). Here we thus observed for the first time a large variation in sensitivity to somatic RNAi, which does not correlate with germline RNAi sensitivity and thus cannot be due to inability to intake dsRNA from the intestinal lumen. We confirmed insensitivity to somatic RNAi of the JU1580bl isolate using a ubiquitously expressed GFP transgene (let-858::GFP), which was inactivated by GFP RNAi in the C. elegans N2 reference background, but only modestly repressed in the JU1580bl isolate (Figure A13-8C, Figure S4). We confirmed that the insensitivity to somatic RNAi also applied when unc-22 dsRNAs were directly injected into the syncytial germline (Figure A13-8D). Therefore, the robust accumulation of Orsay virus RNA observed in infected JU1580 may be rendered possible in part by the partial defect in the somatic RNAi pathway of this wild isolate. The accumulation of small RNAs in response to the virus in infected JU1580 indicates, however, that its RNAi response is at least partially active in some tissues, perhaps including the germline.
The germline RNAi competence of JU1580 together with the presence of Orsay virus RNA1 in the somatic gonad raises the possibility that vertical transmission of viral infection could occur in a strain defective for germline RNAi. To examine this possibility, JU1580bl, N2, and rde-1 were exposed to Orsay virus filtrate. A subset of adult animals from each plate was bleached and their adult offspring collected 4 d later. No evidence for vertical transmission was observed by qRT-PCR for Orsay virus RNA in any strain (Figure S5).
We further tested the efficiency of the RNAi response in six other wild C. elegans isolates representative of its worldwide diversity (Figure A13-8A, B, D). Our results suggest that the somatic RNAi response varies quantitatively in C. elegans and is not correlated with germline RNAi sensitivity. Under experimental conditions that yield efficient infection of JU1580bl by Orsay virus, none of the other strains yielded significant levels of morphological symptoms (Figure A13-8E). Only JU1580bl and JU258 were positive by RT-PCR (unpublished data). Thus, factors other than RNAi competency also contribute to the sensitivity of C. elegans to the Orsay virus.
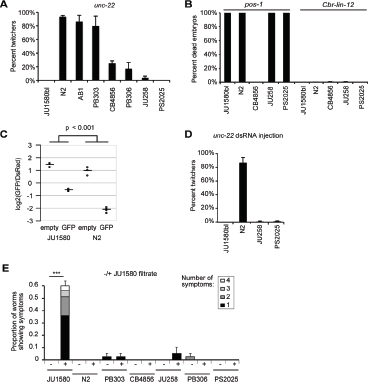
The First Viruses Infecting Caenorhabditis
Here we report the first molecular description, to our knowledge, of viruses that naturally infect nematodes in the wild. The two novel viruses we identified, while clearly related to known nodaviruses, possess unique genomic features absent from all other previously described nodaviruses. These viruses may thus define a novel genus within the family Nodaviridae or may even represent prototype species of a new virus family (pending formal classification by the International Committee for the Taxonomy of Viruses). The same range of intestinal symptoms was observed in animals that were infected by the Orsay and Santeuil viruses, further suggesting that these viral infections were causing the cellular symptoms. We observed putative viral particles of the size expected for nodaviruses, and a strong RNA FISH signal in intestinal cells and the somatic gonad of infected animals demonstrating that the virus is present intracellularly. It is likely that further sampling of natural populations of Caenorhabditis will yield other viruses of this and other groups. In fact, these symptoms were seen repeatedly in C. briggsae animals sampled from different locations in France, and in one instance, a Santeuil virus variant has been identified (unpublished data).
A characteristic feature of these two viruses is the presence of the novel ORF δ. Conservation of sequence length and identity of the ORF δ in these two viruses, and the absence of this ORF in all other described nodaviruses, suggests that this predicted protein is likely to be important for the ability of the virus to infect or replicate in nematodes. Its function is currently unknown, but it is tempting to speculate that this protein may play a role in antagonizing an innate antiviral pathway.
A Laboratory Viral Infection of a Small Model Animal
The infection of C. elegans by the Orsay nodavirus provides an exciting prospect for studies in virology, host cell biology, and antiviral innate immunity. Genetic screens to identify anti-viral factors in model organisms have been limited in large part by the lack of natural infection systems. Although Drosophila has been used with great success to examine host-virus interactions for various insect viruses (Huszar and Imler, 2008) and influenza (Hao et al., 2008), none of these studies has examined viral infection of the host organism by natural transmission routes. Here we present a novel association between C. elegans and a virus that persists in culture through horizontal transmission, causing high damage in intestinal cells yet remarkably little effect on the animal, which continues moving, eating, and producing progeny, although at a lower rate.
De novo infection of naïve animals can be affected by the simple addition of either dead infected animals or homogenized lysates made from infected animals to culture dishes. This is sufficient to seed sustained complete cycles of
viral replication, shedding, and infection. With this system, it is now possible to embark on whole genome genetic screens to identify host factors that block any facet of the viral life cycle. Using the current experimental conditions, infection of JU1580bl and rde-1 mutants in N2 background was highly reproducible. The fact that the reference wild type N2 strain may only sustain a very low yet detectable viral titer makes it a particularly favorable genetic background in which to screen for genes involved in interaction with the virus.
The intestine is a tissue that is particularly exposed to microbes through ingestion, and is a main entry point for pathogens in C. elegans as in other animals. In C. elegans, the intestinal cells are large and easily amenable to observations by optical microscopy. The viral parasites affect the organization of the polarized epithelial intestinal cells and will likely provide interesting mechanisms and tools to study their cell biology. Clear reorganization occurs in the intermediate filaments that line the apical brush border, as well as in the lipid storage granules, the nuclear membrane, and other intracellular compartments.
The abnormal state of the intestinal cells may slow down progeny production by decreasing the food intake. Alternatively, the presence of viral RNA in the somatic gonad may explain the delay in progeny production, although no gonadal cellular phenotypes have been observed. The presence of viral RNA in the somatic gonad is particularly interesting given the lack of vertical transmission.
Targeted Mutant Screens with Orsay Virus Confirm a Role for RNAi in Antiviral Defense
Although prior studies have clearly demonstrated a role for C. elegans RNAi in counteracting viral infection, these studies utilized either a transgenic system of viral RNA expression (Lu et al., 2005) or primary culture cells (Schoot et al., 2005; Wilkins et al., 2005). The observed susceptibility of Orsay virus RNA to RNAi processing in JU1580 animals provides the first evidence in a completely natural setting, without any artificial manipulations, that RNAi serves an antiviral role in nematodes. Coupled to the increase in accumulation of Orsay virus RNA in RNAi pathway mutant strains as compared to wild type N2, these studies demonstrate that the RNAi pathway is an important antiviral defense against Orsay virus. Moreover, these results demonstrate the feasibility of identifying antiviral genes or pathways in this experimental infection system. The mechanism by which the animals prevent transmission to their offspring is unclear, but our initial results with rde-1 mutants suggest that perturbing germline RNAi is not sufficient to enable vertical transmission.
Evolution of Viral Sensitivity and Specificity in Natural Populations
The quantitative difference in Orsay nodavirus sensitivity between the N2 and JU1580 wild C. elegans genetic backgrounds will allow the identification of
a set of host genes that modulate viral sensitivity during evolution of natural host populations. Based on the defect in exogenous RNAi of the JU1580 strain, we speculate that this set will include, but is unlikely to be limited to, genes involved in exogenous RNAi pathways. Support for the role of other genes outside the RNAi pathway comes from our data on natural isolates. Despite the fact that the magnitude of the somatic RNAi defect of the natural isolate PS2025 was comparable to that of JU1580, no evidence of viral RNA accumulation or morphological symptoms was observed following addition of Orsay virus filtrate. Whether PS2025 lacks one or more crucial receptors for viral infection or has alternative antiviral pathways that suppress viral replication is currently unknown.
In addition, the Orsay and Santeuil viruses appear to specifically infect C. elegans and C. briggsae, respectively. Moreover, the C. elegans rde-1 mutation in the N2 background confers susceptibility to the Orsay virus, but not to the Santeuil virus (Figure S3C). The two viruses thus provide a system to study host-parasite specificity and its evolution. With the isolation of additional variants of each virus (our unpublished data), viral evolution studies can also be undertaken. Host-parasite evolutionary and ecological interactions can thus be explored at two evolutionary scales, within and between species of both host and parasite. The rapid life cycle of C. elegans also allows experimental evolution in the laboratory (Azevedo et al., 2002; Schulte et al., 2010). This model system, which can include both natural and engineered variants of both virus and host, is thus favorable for combining studies of host-pathogen co-evolution in the laboratory and in natural populations.
Materials and Methods
Nematode Field Isolation
Caenorhabditis nematodes were isolated on C. elegans culture plates seeded with E. coli strain OP50 using the procedures described in (Barrière and Félix, 2006). JU1264 was isolated from a snail collected on rotting grapes in Santeuil (Val d’Oise, France) on 14 Oct 2007. JU1580 was isolated from a rotting apple sampled in Orsay (Essonne, France) on 6 Oct 2008. When required, cultures were cleared of natural bacterial contamination by frequent passaging of the animals and/or antibiotic treatment (LB plates with 50 μg/ml tetracycline, ampicilline, or kanamycine for 1 h). Infected cultures were kept frozen at –80°C and in liquid N2 as described in Wood (1988). Bleaching was performed as in Wood (1998).
Light Microscopy
When observed with a transillumination dissecting microscope, infected animals displayed a paler intestine than healthy worms. This lack of intestinal coloration occurred all along the entire intestinal tract in C. briggsae JU1264
and preferentially in the anterior intestinal tract in C. elegans JU1580. Intestinal cells were observed with Nomarski optics with a 63× or 100× objective. The four symptoms used for scoring were 1, the disappearance of gut granules in at least part of a cell; 2, degeneration of the nucleus including a very elongated nuclear or nucleolus (when the rest of the nucleus has degenerated) or the apparent disappearance of the nucleus; 3, the loss of cytoplasmic viscosity visible as a very fluid flow of cytosol within the cell; and 4, the fusion of intestinal cells. Some of these traits may sometimes appear in uninfected animals. We systematically tested for a significant increase after infection of the proportion of animals with symptoms (Fisher’s exact test). Note that some of these symptoms can also be caused by microsporidial and bacterial infections. Thus, the diagnostic of a viral infection based on the cellular symptoms requires an otherwise clean culture.
Live Hoechst 33342 Staining of Nuclei
Animals were washed off a culture plate in 10 ml of ddH20, pelleted and incubated in 10 ml of 10 μg/ml Hoechst 33342 in ddH20 for 45 min with soft agitation, protecting the tube from light with an aluminum foil. The animals were then pelleted and transferred to a new culture plate seeded with E. coli OP50. After 2 h, they were mounted and observed with a fluorescence microscope.
Electron Microscopy
A few adults were washed in 0.2 ml of M9 solution, suspended in 2% paraformaldehyde +0.1% glutaraldehyde, and cut in two on ice under a dissecting microscope for better reagent penetration (Hall, 1995). Worm pieces were then resuspended overnight in 2% OsO4 at 4°C, washed, embedded in 2% low melting point agar, dehydrated in solutions of increasing ethanol concentrations, and embedded in resin (Epon-Araldite). High-pressure freezing was performed using a Leica PACT2 high-pressure freezer (Weimer, 2006).
Progeny Counts
The time course was started by isolating single L4 larvae for C. elegans JU1580 and single L3 larvae for C. briggsae JU1264. The parent animal then transferred every day to a new plate until the end of progeny production. The plates were incubated at 20°C for 2 d and kept at 4°C until scoring. The few cases where the parent died before the end of its laying period were not included. Some progeny died as embryos in both infected and non-infected cultures (non-significant effect of treatment; unpublished data). The timing of progeny production was analyzed in R using a Generalized Linear Model using infection status, day, individual (nested in infection status), and Infection Status×Day as explanatory variables, assuming a Poisson response variable and a log link
function. Individual, day and Infection Status×Day were the significant explanatory variables for both JU1264 and JU1580 (p<0.001).
Infectious Filtrate Preparation and Animal Infections
Nematodes were grown on 10 plates (90 mm diameter) until just starved, resuspended in 15 ml of 20 mM Tris-Cl pH 7.8, and pelleted by low-speed centrifugation (5,000 g). The supernatant was centrifuged twice at 21,000 g for 5 min (4°C) and pellets discarded. The supernatant was passed on a 0.2 μm filter. 55 mm culture plates were prepared with 2–5 young adults of N2, rde-1(ne219), or JU1580bl. At the same time (Figures A13-1K, A13-4A,B, A13-5, A13-7B, and S3), or the following day (Figures A13-5C, A13-7A), 30 μl of infectious filtrate was pipetted onto the bacterial lawn. The cultures were incubated at 20°C except otherwise indicated. When both C. elegans and C. briggsae were grown in parallel, an incubation temperature of 23°C (indicated in the figure legends) was used so that both species developed at similar speeds. Maintenance over more than 4 d after re-infection was performed by transferring a piece of agar (approx. 0.1 cm3) every 2–3 d to a new plate with food.
High-Throughput Sequencing
Phenol-chloroform purified DNA and RNA from infected JU1580 and JU1264 animals were subject to random PCR amplification as described (Wang et al., 2003). The amplicons were then pyrosequenced following standard library construction on a Roche Titanium Genome Sequencer. Raw sequence reads were filtered for quality and repetitive sequences. BLASTn and BLASTx were used to identify sequences with limited similarity to known viruses in Genbank. Contigs were assembled using the Newbler assembler. To confirm the assembly, primers for RT-PCR were designed to amplify overlapping fragments of ~1.5 kb. Amplicons were cloned and sequenced.
5′ and 3′ RACE
5′ RACE was performed according to standard protocols (Invitrogen 5′ RACE kit). 3′ RACE was performed by first adding a polyA tail using PolyA polymerase (Ambion) and then using Qiagen 1-step RT-PCR kit with gene specific primers and an oligo-dT-adapter primer. Products were cloned into pCR4 and sequenced using standard Sanger chemistry.
Small RNA Sequencing
4–6 90 mm plates with 15–20 adults (JU1580 or bleached JU1580) were grown for 4 d at 20°C. Mixed stage animals from all plates were collected, pooled, and frozen at –80°C. Total RNA was extracted using the mirVana miRNA
isolation kit (Ambion). Small RNAs were size selected to 18–30 bases by denaturing polyacrylamide gel fractionation. A cDNA library that did not depend on 5′-monophosphates was constructed by tobacco acid pyrophosphatase treatment using adapters recommended for Solexa sequencing as described previously (Das et al., 2008). Each sample was labeled with a unique four base pair barcode. cDNA was purified using the NucleoSpin Extract II kit (Macherey & Nagel). Small RNA libraries were sequenced using the Illumina/Solexa GA2 platform (Illumina, Inc., San Diego, CA). Fastq data files were processed using custom Perl scripts. Reads with missing bases or whose first four bases did not match any of the expected barcodes were excluded. Reads were trimmed by removing the first four nucleotides and any 3′ As. The obtained inserts were collapsed to unique sequences, retaining the number of reads for each sequence. Sequences in the expected size range (18–30 nucleotides) were aligned to the C. elegans genome (WS190) downloaded from the UCSC Genome Browser website (http://genome.ucsc.edu/) (Kent et al., 2002) and the JU1580 partial virus genome using the ELAND module within the Illumina Genome Analyzer Pipeline Software, v0.3.0. Figure A13-6 is based on unique sequences (multiple reads of the same sequence were collapsed) with perfect and unambiguous alignment to the Orsay virus genome. Small RNA sequence data were submitted to the Gene Expression Omnibus under accession number GSE21736.
Neighbor-Joining Phylogenetic Analysis
The predicted amino acid sequences from Orsay and Santeuil nodaviruses were aligned using ClustalW to the protein sequences of the following nodaviruses. Capsid Protein: Barfin1 flounder nervous necrosis virus NC_013459, Barfin2 flounder virus BF93Hok RNA2 NC_011064, Black beetle virus NC_002037, Boolarra virus NC_004145, Epinephelus tauvina nervous necrosis virus NC_004136, Flock house virus NC_004144, Macrobrachium rosenbergii nodavirus RNA-2 NC_005095, Nodamura virus RNA2 NC_002691, Pariacoto virus RNA2 NC_003692, Redspotted grouper nervous necrosis virus NC_008041, Striped Jack nervous necrosis virus RNA2 NC_003449, Tiger puffer nervous necrosis virus NC_013461, Wuhan nodavirus ABB71128.1, and American nodavirus ACU32796.1. 1,000 bootstrap replicates were performed.
RNA Polymerase: Barfin flounder nervous necrosis virus YP_003288756.1, Barfin flounder virus BF93Hok YP_002019751.1, Black beetle virus YP_053043, Boolarra virus NP_689439, Epinephelus tauvina nervous necrosis virus NP_689433.1, Flock house virus NP_689444.1, Nodamura virus NP_077730, Pariacoto virus NP_620109.1, Redspotted grouper nervous necrosis virus YP_611155.1, Striped Jack nervous necrosis virus NP_599247.1, Tiger puffer nervous necrosis virus YP_003288759.1, Macrobrachium rosenbergii nodavirus NP_919036.1, Wuhan_Nodavirus AAY27743, and American nodavirus SW-2009a ACU32794.1. 1,000 bootstrap replicates were performed.
Nematodes from two culture plates were resuspended in M9 and then washed three times in 10 ml M9. RNA was extracted using Trizol (Invitrogen) (5–10 vol:vol of pelleted worms) and resuspended in 20 μl in RNAse-free ddH2O. 5 μg of RNA were reverse transcribed using SuperscriptIII (Invitrogen) in a 20 μl volume. 5 μl were used for PCR in a 20 μl volume (annealing temperature 60°C, 35 cycles). For the Orsay nodavirus, the reverse transcription used the GW195 primer (5′ GACGCTTCCAAGATTGGTATTGGT) and the PCR oTB3 (5′ CGGATTCTCGACATAGTCG) and oTB4 (5′GTAGGCGAGGAAGGAGATG). For the Santeuil nodavirus, reverse transcription used oTB6RT (5′ GGTTCTGGTGGTGATGGTG) and PCR oTB5 (5′ GCGGATGTTCTTCACGGAC) and oTB6 (5′ GTCAGTAGCGGACCAGATG).
One-Step RT-PCR
Animals from one 55 mm culture plate plus viral filtrate (see infection procedure) were washed twice in M9. RNA was extracted using 1 ml Trizol (Invitrogen) and resuspended in 10 μl DEPC-treated H2O. 0.1 μl was used for RT-PCR using the OneStep RT-PCR Kit (Qiagen). Primers annealed to viral RNA1 (GW194 and GW195).
qRT-PCR
cDNA was generated from 1 μg total RNA with random primers using Superscript III (Invitrogen). cDNA was diluted to 1:100 for qRT-PCR analysis. qRT-PCR was performed using either QuantiTect SYBR Green PCR (Qiagen) or ABsolute Blue SYBR Green ROX (Thermo Scientific). The amplification was performed on a 7300 Real Time PCR System (Applied Biosystems). Each sample was normalized to ama-1, and then viral RNA1 (primers GW194: 5′ ACC TCA CAA CTG CCA TCT ACA and GW195: 5′ GAC GCT TCC AAG ATT GGT ATT GGT) levels were compared to those present in re-infected bleached JU1580 animals.
Northern Blotting
For Northern blots, 0.5 μg of total RNA extracted from JU1264 and JU1264bl animals were electrophoresed through 1.0% denaturing formaldehyde-MOPS agarose gels. RNA was transferred to Hybond nylon membranes and then subject to UV cross-linking followed by baking at 75°C for 20 min. Double stranded DNA probes targeting the RNA1 segment of Santeuil nodavirus (nt 1141–1634) and the RNA2 segment of Santeuil nodavirus (nt 1833–2308) were generated by random priming in the presence of α-32P dATP using the Decaprime kit (Ambion). Blots were hybridized for 4 h at 65°C in Rapid hyb buffer (GE
Healthcare) and washed in 2XSSC/0.1%SDS 5 min×2 at 25°C, 1XSSC/0.1%SDS 10 min×2 at 25°C, 0.1XSSC/0.1%SDS 5 min×4 at 25°C, and 0.1XSSC/0.1%SDS 15 min×2 at 42°C and 0.1XSSC/0.1%SDS 15 min×1 at 68°C. For strand specific riboprobes, 32P labeled RNA was generated by in vitro transcription with either T7 or T3 RNA polymerase (Ambion) in the presence of α-32P UTP. The target plasmid contained a cloned region of the Santeuil nodavirus RNA1 segment (nt 523–1022) and was linearized with either PmeI or NotI, respectively. For the riboprobes, blots were hybridized at 70°C and then sequentially washed as follows: 2XSSC/0.1%SDS 5 min×2 at 68°C, 1XSSC/0.1%SDS 10 min×2 at 68°C, 0.1XSSC/0.1%SDS 10 min×2 at 68°C, and 0.1XSSC/0.1%SDS 20 min×1 at 73°C. The Santeuil RNA1 segment migrates at approximately the same position as the 28S ribosomal RNA. Under the extended exposure time (72 h) needed to visualize the negative sense genome, low levels of non-specific binding to the 28S RNA become apparent (Figure A13-4D).
RNA Interference
For pos-1 and unc-22 RNAi using bacteria as the dsRNA source, bacterial clones from the Ahringer library expressing dsRNAs (Kamath et al., 2003) (available through MRC Geneservice) were used to feed C. elegans on agar plates. For the pos-1 experiment, bacteria were concentrated 10-fold by centrifugation prior to seeding the plates. A C. briggsae Cbr-lin-12 fragment (Félix, 2007) was used as a negative control as it does not match any sequence in C. elegans. Three or four L4s were deposited on an RNAi plate, singly transferred the next day to a second RNAi plate, and their progeny scored after 2 d (pos-1) or 3 d (unc-22) at 23°C.
For unc-22 dsRNA synthesis and injection, the unc-22 fragment in the Ahringer library clone was amplified by PCR using the T7 primer and in vitro transcribed with the T7 polymerase using the Ambion MEGAscript kit, according to the manufacturer’s protocol (Ahringer, 2006). Cel-unc-22 dsRNAs were injected at 50 ng/μl into both gonadal arms of young hermaphrodite adults of the relevant strain. The animals were incubated at 20°C. The adults were transferred to a new plate individually on the next day, and the proportion of twitching progeny scored 3 d later, touching each animal with a platinum-wire pick to induce movement.
For GFP RNAi, transgenic N2 and JU1580 strains were generated expressing the ubiquitously expressed let-858::GFP and the pharyngeal marker myo-2::DsRed as an extrachromosomal array. Bacteria expressing dsRNA against GFP cDNA were used to feed animals on agar plates. An empty vector was used as a negative control. Two or three L4s were deposited on a 55 mm RNAi plate, grown at 20°C for 3 d, and the GFP/DsRed expression levels in their offspring measured using flow cytometry (Union Biometrica) as described previously (Lehrbach et al., 2009). Offspring from two RNAi plates were combined for sorting. Each
combination of RNAi vector and strain was repeated in at least triplicate. GFP and DsRed intensities were obtained from 14 wormsorter runs including 3–4 replicate runs for N2 and JU1580 after treatment with GFP RNAi or empty vector. A larger proportion of N2 animals showed reporter expression compared to JU1580 animals (Figure S4, top). To control for this difference between strains, animals with no reporter expression were excluded by requiring DsRed intensities to exceed a cutoff set to the median 99th percentile from three control runs of animals with no array present (Figure S4). A linear regression model was fitted to the median log2(GFP/DsRed) intensity ratios including strain, treatment, and an interaction term as explanatory variables. The interaction term was significantly different from zero at p<0.001.
RNA Fluorescent In Situ Hybridization (FISH)
A segment of Orsay virus RNA1 was generated with primers GW194 and GW195 and cloned into pGEM-T Easy (Promega). Fluorescein labeled probe was generated from linearized plasmid using the Fluorescein RNA Labeling Mix (Roche) and MEGAscript SP6 transcription (Ambion). JU1580bl animals were infected with Orsay virus filtrate and grown for 4 d at 20°C on 90 mm plates. Control animals were grown under the same conditions in the absence of virus. In situ hybridization was performed essentially as previously described (Motohashi et al., 2006). The fluorescent RNA probe was visualized directly on an Olympus FV1000 Upright microscope.
Genbank Sequences: Accession numbers for Orsay and Santeuil virus contigs: HM030970–HM030973. Small RNA sequencing data at GEO: GSE21736.
Acknowledgments
M.A.F. thanks the caretakers of the Orsay orchard for access to it and J.L. Bessereau, F. Duveau, R. Legouis, N. Naffakh, and B. Samuel for helpful discussions.
Author Contributions
The author(s) have made the following declarations about their contributions: Conceived and designed the experiments: MAF EAM DW. Performed the experiments: MAF AA JP GW IN TB YJ CJF MS. Analyzed the data: MAF AA JP GW IN TB GZ CJF LDG MS EAM DW. Wrote the paper: MAF AA EAM DW.
References
Ahringer J, editor. (2006) Reverse genetics. Wormbook, ed The C elegans research community. Available http://www.wormbook.org. Accessed 29 December 2010.
Aliyari R, Ding S. W (2009) RNA-based viral immunity initiated by the Dicer family of host immune receptors. Immunol Rev 227: 176–188.
Azevedo R. B, Keightley P. D, Lauren-Maatta C, Vassilieva L. L, Lynch M, et al. (2002) Spontaneous mutational variation for body size in Caenorhabditis elegans. Genetics 162: 755–765.
Ball L. A (1994) Replication of the genomic RNA of a positive-strand RNA animal virus from negative-sense transcripts. Proc Natl Acad Sci U S A 91: 12443–12447.
Barrière A, Félix M-A, Community The C. elegans Research Community, editor (2006) Isolation of C. elegans and related nematodes. Wormbook.
Das P. P, Bagijn M. P, Goldstein L. D, Woolford J. R, Lehrbach N. J, et al. (2008) Piwi and piRNAs act upstream of an endogenous siRNA pathway to suppress Tc3 transposon mobility in the Caenorhabditis elegans germline. Mol Cell 31: 79–90.
Félix M-A (2007) Cryptic quantitative evolution of the vulva intercellular signaling network in Caenorhabditis. Curr Biol 17: 103–114.
Fire A, Xu S, Montgomery M. K, Kostas S. A, Driver S. E, et al. (1998) Potent and specific genetic interference by double-stranded RNA in Caenorhabditis elegans. Nature 391: 806–811.
Gu W, Shirayama M, Conte D Jr, Vasale J, Batista P. J, et al. (2009) Distinct argonaute-mediated 22G-RNA pathways direct genome surveillance in the C. elegans germline. Mol Cell 36: 231–244.
Hall D. H (1995) Electron microscopy and three-dimensional image reconstruction. In: Epstein H. F, Shakes D. C, editors. Methods in cell biol, Caenorhabditis elegans modern biological analysis of an organism. San Diego: Academic Press. pp. 395–436.
Hao L, Sakurai A, Watanabe T, Sorensen E, Nidom C. A, et al. (2008) Drosophila RNAi screen identifies host genes important for influenza virus replication. Nature 454: 890–893.
Hüsken K, Wiesenfahrt T, Abraham C, Windoffer R, Bossinger O, Leube R. E (2008) Maintenance of the intestinal tube in Caenorhabditis elegans: the role of the intermediate filament protein IFC-2. Differentiation 76: 881–896.
Huszar T, Imler J. L (2008) Drosophila viruses and the study of antiviral host-defense. Adv Virus Res 72: 227–265.
Johnson K. N, Zeddam J. L, Ball L. A (2000) Characterization and construction of functional cDNA clones of Pariacoto virus, the first Alphanodavirus isolated outside Australasia. J Virol 74: 5123–5132.
Kamath R. S, Fraser A. G, Dong Y, Poulin G, Durbin R, et al. (2003) Systematic functional analysis of the Caenorhabditis elegans genome using RNAi. Nature 421: 231–237.
Kent W. J, Sugnet C. W, Furey T. S, Roskin K. M, Pringle T. H, et al. (2002) The human genome browser at UCSC. Genome Res 12: 996–1006.
Kim D. H, Feinbaum R, Alloing G, Emerson F. E, Garsin D. A, et al. (2002) A conserved p38 MAP kinase pathway in Caenorhabditis elegans innate immunity. Science 297: 623–626.
Lehrbach N. J, Armisen J, Lightfoot H. L, Murfitt K. J, Bugaut A, et al. (2009) LIN-28 and the poly(U) polymerase PUP-2 regulate let-7 microRNA processing in Caenorhabditis elegans. Nat Struct Mol Biol 16: 1016–1020.
Li H, Li W. X, Ding S. W (2002) Induction and suppression of RNA silencing by an animal virus. Science 296: 1319–1321.
Liu W. H, Lin Y. L, Wang J. P, Liou W, Hou R. F, et al. (2006) Restriction of vaccinia virus replication by a ced-3 and ced-4-dependent pathway in Caenorhabditis elegans. Proc Natl Acad Sci U S A 103: 4174–4179.
Lu R, Maduro M, Li F, Li H. W, Broitman-Maduro G, et al. (2005) Animal virus replication and RNAi-mediated antiviral silencing in Caenorhabditis elegans. Nature 436: 1040–1043.
Lu R, Yigit E, Li W. X, Ding S. W (2009) An RIG-I-Like RNA helicase mediates antiviral RNAi downstream of viral siRNA biogenesis in Caenorhabditis elegans. PLoS Pathog 5: e1000286. doi:10.1371/journal.ppat.1000286.
Milloz J, Duveau F, Nuez I, Félix M-A (2008) Intraspecific evolution of the intercellular signaling network underlying a robust developmental system. Genes Dev 22: 3064–3075.
Motohashi T, Tabara H, Kohara Y (2006) Protocols for large scale in situ hybridization on C. elegans larvae. WormBook. pp. 1–8. Available: http://wormbook.org. Accessed 29 December 2010.
Neil S. J, Zang T, Bieniasz P. D (2008) Tetherin inhibits retrovirus release and is antagonized by HIV-1 Vpu. Nature 451: 425–430.
Pak J, Fire A (2007) Distinct populations of primary and secondary effectors during RNAi in C. elegans. Science 315: 241–244.
Powell J. R, Kim D. H, Ausubel F. M (2009) The G protein-coupled receptor FSHR-1 is required for the Caenorhabditis elegans innate immune response. Proc Natl Acad Sci U S A 106: 2782–2787.
Sabin L. R, Zhou R, Gruber J. J, Lukinova N, Bambina S, et al. (2009) Ars2 regulates both miRNA-and siRNA-dependent silencing and suppresses RNA virus infection in Drosophila. Cell 138: 340–351.
Schott D. H, Cureton D. K, Whelan S. P, Hunter C. P (2005) An antiviral role for the RNA interference machinery in Caenorhabditis elegans. Proc Natl Acad Sci U S A 102: 18420–18424.
Schulte R. D, Makus C, Hasert B, Michiels N. K, Schulenburg H (2010) Multiple reciprocal adaptations and rapid genetic change upon experimental coevolution of an animal host and its microbial parasite. Proc Natl Acad Sci U S A 107: 7359–7364.
Sijen T, Steiner F. A, Thijssen K. L, Plasterk R. H (2007) Secondary siRNAs result from unprimed RNA synthesis and form a distinct class. Science 315: 244–247.
Tabara H, Sarkissian M, Kelly W. G, Fleenor J, Grishok A, et al. (1999) The rde-1 gene, RNA interference, and transposon silencing in C. elegans. Cell 99: 123–132.
Tijsterman M, Okihara K. L, Thijssen K, Plasterl R. H. A (2002) PPW-1, a PAZ/PIWI protein required for efficient germline RNAi, is defective in a natural isolate of C. elegans. Curr Biol 12: 1535–1540.
Troemel E. R, Felix M. A, Whiteman N. K, Barriere A, Ausubel F. M (2008) Microsporidia are natural intracellular parasites of the nematode Caenorhabditis elegans. PLoS Biol 6: 2736–2752. doi:10.1371/journal.pbio.0060309.
Wang D, Urisman A, Liu Y. T, Springer M, Ksiazek T. G, et al. (2003) Viral discovery and sequence recovery using DNA microarrays. PLoS Biol 1: E2. doi:10.1371/journal.pbio.0000002.
Weimer R. M (2006) Preservation of C. elegans tissue via high-pressure freezing and freeze-substitution for ultrastructural analysis and immunocytochemistry. Methods Mol Biol 351: 203–221.
Wilkins C, Dishongh R, Moore S. C, Whitt M. A, Chow M, et al. (2005) RNA interference is an antiviral defence mechanism in Caenorhabditis elegans. Nature 436: 1044–1047.
Wood W. B (1988) The nematode Caenorhabditis elegans. Cold Spring Harbor, NY: Cold Spring Harbor Laboratory. 667 p.
GENOMIC APPROACHES TO STUDYING
THE HUMAN MICROBIOTA54
Abstract
The human body is colonized by a vast array of microbes, which form communities of bacteria, viruses and microbial eukaryotes that are specific to each anatomical environment. Every community must be studied as a whole because many organisms have never been cultured independently, and this poses formidable challenges. The advent of next-generation DNA sequencing has allowed more sophisticated analysis and sampling of these complex systems by culture-independent methods. These methods are revealing differences in community structure between anatomical sites, between individuals, and between healthy and diseased states, and are transforming our view of human biology.
The microbes that exist in the human body are collectively known as the human microbiota. This amazingly complex and poorly understood group of communities has an enormous impact on humans. An increasing number of conditions are being examined for correlative and causative associations with the microbiome—which, in this Review, is used to refer to the microbiota and the habitat it colonizes (Box A14-1). Each one of the many microbial communities has its own structure and ecosystem, depending on the body environment it exists in. The fundamental goal of human microbiome research is to measure the structure and dynamics of microbial communities, the relationships between their members, what substances are produced and consumed, the interaction with the host, and differences between healthy hosts and those with disease. Despite an explosion in human-microbiome research, these communities are still the dark matter of the body. The microbiome has been called another organ (Backhed et al., 2005; Foxman et al., 2008; Possemiers et al., 2011; Shanahan, 2002) because of its products, its responsiveness to the environment and its integration with other systems. Sometimes referred to as our second genome (Bruls and Weissenbach, 2011), the genes of microbes that make up the microbiome outnumber human
_______________________
54 Reprinted with kind permission from Nature Publishing Group.
55 The Genome Institute, Washington University, 4444 Forest Park Avenue, Campus Box 8501, St. Louis, Missouri 63108, USA.
Competing financial interests: The author declares no competing financial interests.
• Biodiversity is a measure of the complexity of a community. It is affected by the number of taxa (richness) and their range of abundance (evenness). High biodiversity occurs when many taxa (high richness) are present at similar abundances (an even distribution).
• Commensals are organisms that benefit from another organism but that have no harm or benefit themselves. Microbes of the microbiome were thought to be commensals that benefited from the human host but did no harm. Many of these organisms provide benefits to the human host and so have a mutualistic relationship.
• Contig is a stretch of contiguous sequence in a genome assembly.
• Coverage is the number of times a genome or gene is sequenced. In a genome sequenced to coverage, each nucleotide in the sequence appears, on average, in 100 reads.
• Genome assembly is the process of constructing a genome sequence from short subsequences by sequencing many random fragments from a sheared genome. The random short sequences are compared, and overlapping common sequences are used to determine their orientation and order with respect to each other. A consensus sequence is constructed from this layout. Usually there are gaps, but when contigs can be arranged in the correct order and orientation, these longer stretches are called scaffolds.
• Metagenomics was defined (Hooper et al., 2012) as a process for identifying genes specifically by their function by cloning them directly from the environment and expressing genes in a surrogate host (Riesenfeld et al., 2004). Therefore, gene function was known even if the sequence was not sufficient for functional inference, such as when it encoded a protein of previously unknown function. This definition, also known as functional metagenomics, is widely
genes by more than 100-fold, with over 3 million bacterial genes in the gut alone (Human Microbiome Project Consortium, 2012a; Qin et al., 2010). These extensive microbial ecosystems are not limited to the human body. Microbes and their communities dominate the environment and occupy a vast range of niches. Environmental metagenomics was developed extensively before being applied to the human body (Stein et al., 196; Vergin et al., 1998), and methods from other disciplines have had a significant effect on human-microbiome research. Defining complicated microbial ecosystems and developing tools to probe their workings is an important research enterprise of twenty-first century microbiology.
The complexity of microbial communities makes studying them challenging. There may be hundreds of different species, and enumerating what organisms are present with standard microbiological techniques is not possible because many organisms have never been grown in culture and may require special, as yet
• used. More recently, metagenomics refers to general analyses of microbial communities by culture-independent methods, which do not necessarily focus on function. The combined genomes of the microbes in a community are thought of as the community metagenome. Another type of metagenomic analysis focuses on the structure of these aggregate genomes in a community.
• Microbiome in this Review refers to the microbiota and the habitat it colonizes and is analogous to the term biome in ecology. Microbiome is also used to refer to the collective genomes of the microbes—what is now the metagenome, and may have originally been coined by Joshua Lederberg (cited by Hooper and Gordon, 2001). However, it is also used for the more ecologically consistent meaning. A microbiome can be a specific body site, such as the gut microbiome, but the human microbiome is often used to refer to the collection of microbiomes of the human body.
• Mutualism is a type of symbiosis in which both organisms benefit. This is one type of relationship seen in the human microbiome.
• Operational taxonomic unit in microbiome research is a group of organisms with 16S ribosomal RNA gene sequences that show a certain level of identity. This group is often used as a surrogate for a species when the 16S rRNA sequences are at least 97% identical.
• Pathogenic microbe is one with the potential to cause disease.
• Read is the primary output of DNA sequencing, consisting of a short stretch of DNA sequence that is produced from sequencing a region of a single DNA fragment.
• Shotgun sequencing is the process of randomly breaking (often by shearing) a long DNA molecule (for example, a complete chromosome) and then sequencing the resultant DNA fragments, which each come from a different location in the original long DNA molecule.
• Virome is the collection of viruses in the microbiota.
unknown, growth conditions. In addition, the abundance of some microbes can range over orders of magnitude, so deep sampling is required to detect the less-abundant members. Culture-independent methods of taking a microbial census began about 25 years ago and were based on targeted sequencing of 5S and 16S ribosomal RNA genes (Olsen et al., 1986), which differ for each species and are a convenient identifier. As this became a tractable research area, next-generation sequencing (NGS) technologies (Table A14-1) were developed and allowed more extensive analyses, both targeted 16S rRNA gene sequencing and whole-genome shotgun sequencing of microbes in communities en masse. The number of culture-independent metagenomic investigations of the human microbiome has mushroomed, and it is one of the most studied areas of microbiology with significant potential to benefit clinical practice. This culture-independent methodology is broadly applied outside human-microbiome research and is expanding our
TABLE A14-1 DNA Sequencing Platforms Used for Microbiome Analysis
| Platform | Method | Characteristics | 16S rRna | Shotgun | Comments |
| Sanger-based or capillary-based instrument | Fluorescent, dideoxy terminator | 750-base reads High accuracy |
Full length sequenced with 2–3 reads | Long reads help with database comparisons | Most costly method Relatively low throughput, so low coverage of 16S or shotgun |
| Roche–454 | Pyrosequencing light emission | 400-base reads | Up to 3 variable regions per read | Long reads help with database comparisons | Cost limits shotgun coverage but 16S coverage is good |
| Illumina | Fluorescent, stepwise sequencing | 100–150-base reads | Only 1 variable region per read | Short reads do not seem to limit analysis | Very high coverage owing to high instrument output and very low cost |
| Ion Torrent | Proton detection | More than 200-base reads | Like other NGS | Like Illumina | Expect high coverage, but longer reads than Illumina |
| PacBio | Fluorescent, single-molecule sequencing | Up to 10-kilobase reads Low accuracy |
Accuracy an issue for correct taxon identification | Long reads could help assembly | Attractive for long reads, but lower accuracy limits applications |
| Oxford Nanopore* | Electronic signal as DNA passes through pore Single-molecule sequencing |
Long reads | Unknown | Long reads could help assembly | Not yet available |
*At the time of publication, the Oxford Nanopore system was not available, and information provided is based on company presentations. Ion Torrent and PacBio are both available but have not been widely used for microbiome analysis. The Illumina MiSeq instrument is expected to provide 250-base reads in the near future.
knowledge of the environment. This Review describes how NGS approaches are transforming human-microbiome studies, and posing questions and challenges for the future.
Single Organisms and Microbial Communities
In the past, research on microbial interactions with humans has focused on single pathogenic organisms. Studies of communities of non-pathogenic microbes in the body were limited because the organisms were thought to be benign, with minor effects on human health compared with pathogens. Microbiome research has led to new interest in the communities of non-pathogenic microbes that inhabit the human body, and the need to describe the genomes of these organisms to understand the human microbiome has been recognized.
Every community of the microbiome has its own characteristics (Table A14-2). For the gut community, for example, high biodiversity is associated with a healthy state and reduced biodiversity occurs in patients with conditions such as Crohn’s disease (Manichanh et al., 2006), whereas for tissues of the vagina, a lower biodiversity exists in healthy individuals and a bloom of organisms occurs in patients with vaginosis (Fredricks et al., 2005). To understand why different sites have different properties, the mechanisms that lead to the disruption of
TABLE A14-2 Characteristics of Bacteria, Microbial Eukaryotes, and Viruses in the Human Microbiome
| Characteristic | Bacteria | Viruses | Eukaryotic Microbes |
| Genome size | 0.5–10 megabases | 1–1,000 kilobases | 10–50 megabases |
| Number of taxa in the human microbiome | At least thousands | Unknown, but could be as many as bacteria | Unknown, but may be fewer than bacteria |
| Relative abundances | Highly variable | Highly variable | Unknown |
| Targeted detection methods | Sequencing of genes such as 5S and 16S rRNA | No universal method for genes, but virus-specific polymerase chain reaction assays for some | Sequencing of 18S rRNA gene Spacer region in rRNA |
| Shotgun approach to analyses | Alignment to reference genomes or database comparison | Database comparison | Alignment to reference genomes or database comparison |
| Subspecies or strain diversity | Modest sequence variation Horizontal gene transfer also contributes |
High sequence variation | Unknown |
ecosystems and to disease, and exceptions to generalities about a tissue, researchers require knowledge of the structure and behaviour of microbial communities.
Microbial communities benefit the host by providing functions such as digestion of nutrients (Flint et al., 2008) or protection against infection (Srikanth and McCormick, 2008). Antibiotic treatment perturbs the microbiome (Dethlefsen et al., 2008; Jakobsson et al., 2010) by reducing its size and altering its composition. This disturbance can lead to infection (Croswell et al., 2009; Miller et al., 1956; Sekirov et al., 2008), and antibiotic-resistant organisms such as Clostridium difficile—normally controlled by the microbiome—can overgrow and create problems (Mulligan, 1984). More complex community contributions also exist, such as interactions with host immune and inflammatory systems (Jarchum and Pamer, 2011; Marsland, 2012) or production of metabolites involving hybrid pathways from multiple organisms, including host–microbe pathways (Wang et al., 2011). Understanding these phenomena will ultimately allow the microbiome to be manipulated so that, for example, transplants of microbial communities could treat C. difficile infections (Brandt and Reddy, 2011; Gough et al., 2011).
Whether the microbial ecology of the human body can be simplified to the properties of single organisms is unknown. Many organisms have never been cultured and may be adapted to life in a community environment rather than a pure culture. For organisms for which growth requirements are understood, there is a dependence on secreted products from other community members. For example, secreted siderophores (D’Onofrio et al., 2010) are small molecules that help microbes to scavenge iron, which is a limiting factor for growth in the body. So even the study of individual organisms can be dependent on studying the community.
Dissecting a Microbiome
Analysis of community structure (Figure A14-1) focuses on either targeted regions (such as the 16S rRNA gene) or shotgun sequencing to catalogue the genes that are present. Additional analysis involves sequencing genomes of individual organisms to produce a catalogue of reference genomes (Human Microbiome Jumpstart Reference Strains Consortium, 2010), and analysing RNA to describe the transcriptome and identify RNA viruses. Non-genomic analyses include proteomic and metabolomic studies, but these are not discussed here. Every sample should be well-annotated with clinical metadata, so that, ultimately, the microbiome’s genetic and community structures can be correlated with the individual’s phenotype.
Census of Organisms
Modern metagenomic analyses of microbial communities were developed from culture-independent methods for taking a census of organisms present in a community and their abundances. Although DNA reassociation kinetics provides
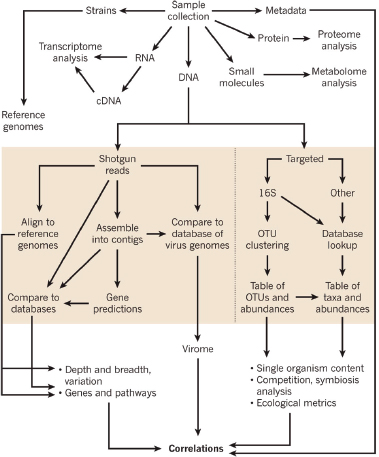
information on community diversity and structure (Gans et al., 2005), there is no accounting for organisms that may be tracked between samples. Methods more useful for providing information on the entire structure often focus on signature sequences that distinguish taxa (detected by hybridization to arrays of diagnostic oligonucleotides [Nelson et al., 2011]), various methods for fingerprinting polymerase chain reaction (PCR) products (such as single-strand conformation polymorphisms or terminal restriction fragment length polymorphisms) or DNA sequencing of targeted PCR products. Sequencing of 16S rRNA genes is the main method of taking a community census because fingerprinting methods do not adequately measure low-abundance organisms (Bent et al., 2007).
16S rRNA differs for each bacterial species. A bacterial species is hard to define, but is often taken as organisms with 16S rRNA gene sequences having at least 97% identity—an operational taxonomic unit (OTU). A 16S rRNA gene sequence of about 1.5 kilobases has nine short hypervariable regions that distinguish bacterial taxa; the sequences of one or more of these regions are targeted in a community census.
Before the introduction of NGS methods, the prevailing approach was to clone full-length 16S rRNA genes after PCR with primers that would amplify genes from a wide range of organisms. Cloned 16S rRNA genes were sequenced by the Sanger method, which required two or three reads to cover the entire gene. Accuracy was crucial because sequencing errors led to misclassification. The cost and effort required for the Sanger method limited the depth of sampling, and studies often produced about 100 sequences per specimen. This method identified the dominant organisms in a community, but analysis of less abundant organisms was limited.
Introducing NGS to 16S rRNA gene analysis led to marked improvements in cost and depth of sampling. The Roche–454 platform has dominated microbial community analysis (Sogin et al., 2006). As the read length for 454 pyrosequencing is about 400 bases, only a portion of the 16S rRNA gene can be sampled, and many different studies have targeted between one and three of the hypervariable regions, with different hypervariable regions targeted in different studies. Using a portion of the 16S rRNA gene led to a loss of sensitivity (some taxa cannot be reliably defined at the species level, although high confidence identification of higher taxonomic ranks is possible), nevertheless gains in depth of sampling and cost savings outweigh this caveat. The US Human Microbiome Project (HMP) (The NIH HMP Working Group et al., 2009) has sequenced more than 10,000 specimens from healthy adults on the 454 platform by targeting V3 to V5 regions in the 16S rRNA gene and producing, on average, 7,000 sequences per specimen (Human Microbiome Project Consortium, 2012b), which is a vast expansion on the Sanger method of sequencing analysis. The results of the HMP, which sampled 18 body sites, provide an in-depth definition of the human microbiome. Another study16 that focused on the effects of the antibiotic ciprofloxacin reported the “rare biosphere” in the gut. This study documented perturbation of
taxa and recovery from antibiotic treatment, as well as minor constituents that did not recover after antibiotic treatment. Such analyses will be important in identifying individuals who are at risk of side effects from antibiotic treatment, for example overgrowth of pathogens such as C. difficile or life-threatening antibiotic-associated diarrhoea.
When using 16S rRNA gene sequencing to compare individuals it is not necessary to know which organisms are present, only whether the spectra of 16S rRNA gene sequences are similar and the degree of difference between samples. Projects that compare healthy cohorts and those with disease to determine whether there is a difference in the microbiome, or examine the effects of diet, antibiotic treatment or environmental factors on the microbiome, all focus on detecting differences in communities, rather than identifying actual taxa. A loss of sensitivity for organism identification can be tolerated, and NGS allows cost-effective deep sampling of large cohorts, which is needed to reach statistically significant conclusions. The Illumina sequencing platform has been applied to metagenomics projects (Claesson et al., 2010; Gloor et al., 2010; Lazarevic et al., 2009), but because this sequencing platform currently produces reads of 100 bases (HiSeq system) to 150 bases (MiSeq system), only a single hypervariable region can be sequenced. However, this further loss of sensitivity does not preclude the use of the Illumina platform for the comparative projects already described in this Review. An early application of this platform was its use in a study of vaginal microbiomes in patients with HIV, for which comparisons of patients with conditions such as vaginosis before and after antibiotic therapy were examined (Hummelen, 2010). As a result of the exceptional increases in numbers of reads and the lower cost associated with the Illumina platform, it is becoming more widely used for 16S rRNA gene-sequence profiling and continues the microbiome-analysis trend of deeper sampling at lower costs.
Shotgun Sequencing for Cataloguing Organisms
Targeted sequencing is a powerful tool for assessing the organisms that are present in microbial communities, but it is limited in terms of the functional and genetic information produced. Organisms for which the genome sequences are known (currently there are several thousand sequenced bacterial genomes) can be used to infer the genes and functional capabilities of the community (Figure A14-1). However, many organisms have no reference sequence. Furthermore, a reference sequence does not completely describe the genes that are contributed by an organism. There is considerable variation in the genomes between strains of the same species. Two strains of Escherichia coli, O157:H7 and K-12, both have 16S rRNA gene sequences of E. coli, but differ in hundreds of genes. There are limits to what can be learned about the genetic content of communities from 16S rRNA gene sequences alone.
Moving beyond this level of functional inference requires a gene-based census. This catalogue of genes can be provided by shotgun sequencing of DNA that has been extracted from the community as a whole and samples the mixture of genomes that make up the metagenome (Figure A14-1). In a community in excess of hundreds of species with varying abundance, deep sequencing is needed to sample minor constituents that are not necessarily unimportant. The bacterial concentration in the gut can be 1011 cells ml–1 (refs. Luckey, 1972; Zubrzycki and Spaulding, 1962), so for an organism that is present at a concentration of 1 per 106 there are 105 cells ml–1, which is sufficient for the organism’s products, such as metabolites and toxins, to have an effect on the community and the host.
Illumina sequencing of faecal samples produced 4 gigabases per sample and 10 Gb per sample in the Metagenomics of the Human Intestinal Tract (MetaHIT) (Qin et al., 2010) and HMP (Human Microbiome Project Consortium, 2012) projects, respectively, which corresponded to tens of millions of reads per sample. At this depth of sequencing, the genomes of minor constituents such as E. coli (with an abundance of about 1% or lower) are sampled almost completely, and organisms with an even lower abundance have some of their genome represented. This extraordinary sampling of complex microbial communities is made possible by producing large amounts of data and by the low cost of NGS methods.
Shotgun sequence data, in addition to 16S rRNA gene analysis, provide information on the organisms that make up communities. Extracting 16S rRNA gene sequences from shotgun reads to determine the organisms present is possible; however, targeted 16S rRNA gene sequencing tends to introduce biases (owing to the broad-range PCR used to amplify 16S rRNA gene sequences or the choice of region within the 16S rRNA gene), which shotgun sequencing does not. Shotgun sequencing is less sensitive than targeted rRNA sequencing because a small fraction of the sequences are from 16S rRNA genes. Another approach is to align shotgun sequences to bacterial reference genomes (Arumugam et al., 2011; Human Microbiome Project Consortium, 2012; Martin et al., 2012), allowing the relative abundance of species to be determined on the basis of the number of reads that align to each reference genome (also useful for the comparative studies already described). The MetaHIT project has used this approach to classify individuals into different groups, called enterotypes, on the basis of the community structure in their faecal samples (Arumugam et al., 2011). The same enterotypes have been found in 16S rRNA gene-based analysis (Wu et al., 2011). The vaginal microbiome has also been classified into five groups (Ravel et al., 2011). These observations suggest the human microbiome may exist in distinct states in different people, although correlation with environmental, genetic or health status is not yet clear. Stratifying future studies depending on which community class an individual belongs to may be important for identifying correlations with phenotypic data.
The need for reference genome sequences is clear both to infer genetic content of organisms identified by 16S rRNA genes and to identify sources of
shotgun reads by aligning to reference genomes, and so determining organismal content of communities from shotgun data. NGS techniques have reduced the cost of bacterial sequences to less than US$1,000 per genome and led to an increase in the production of ‘complete’ genome sequences. Current methodology relies mainly on Illumina shotgun sequencing and a variety of methods to assemble the reads into a genome. The product is not a true complete genome, but a high-quality draft that covers almost all of the genome and results in a high-quality base sequence (Human Microbiome Jumpstart Reference Strains Consortium, 2010). Programmes such as the HMP (The NIH HMP Working Group et al., 2009; Proctor, 2011) and the Genomic Encyclopedia of Bacteria and Archaea (GEBA) (DOE Joint Genome Institute, 2012) are producing reference genomes by the thousands.
Although bacteria are the main components of the human microbiome, eukaryotic microbes and viruses (both human viruses and bacteriophages) are also present (Table A14-2). The study of eukaryotic microbes is not as advanced as that of bacteria (Parfrey et al., 2011), but the organisms are identified by signature sequences (such as fingerprinting and 18S rRNA) and shotgun sequencing analogous to bacteria. The number of reference genomes for eukaryotic microbes is smaller than that for bacteria, and progress will depend on addressing this shortfall.
By contrast, considerable effort is being given to characterizing the genomes of human viruses (Wylie et al., 2012a) and bacteriophages (Breitbart et al., 2003), known as the virome (Box A14-1). This work is based on shotgun sequencing (Figure A14-1), although oligonucleotides microarrays for virus detection are also used (Palacios et al., 2007; Wang et al., 2003). Viral sequences can be detected in shotgun data from different body sites, and viruses can also be enriched by processing samples before DNA extraction (Casas and Rohwer, 2007). Virome analysis by shotgun sequencing of microbial communities (discussed later) has led to the identification of human viruses (Allander et al., 2005; Breitbart and Rohwer, 2005; Finkbeiner et al., 2008), as well as the detection of known viruses in healthy subjects and diseases of unknown aetiology (Wiley et al., 2012b). Likewise, bacteriophages are found to be highly diverse at different body sites (Breitbart et al., 2008; Minot et al., 2012; Pride et al., 2011), with differences between individuals as a result of diet (Minot et al., 2011) or disease states (Lepage et al., 2008; Willner and Furlan, 2010).
Sequencing for Gene Catalogues and Functional Inference
Metagenomic shotgun data also sample community gene content, which is useful to define community capabilities and identify particular members. Deep sequencing, such as that used in the MetaHIT and the HMP, broadly samples the genomes of even minor constituents, facilitating the identification of genes present within a given community (Figure A14-1). By using the sequence reads
themselves, or by first assembling them into contigs (Box A14-1), sequence data can be compared with databases such as the National Institutes of Health’s GenBank to identify which genes are present. De novo prediction of genes from metagenomic data is also possible (Human Microbiome Project Consortium, 2012), which provides motifs for functional inference even if the sequence does not find a match in a database. Finally, alignment of reads or contigs to reference genomes identifies which organisms are present, along with their known gene content. These methods convert metagenomic sequence data into catalogues of genes that can be further analysed.
Gene catalogues can be compared with databases such as the Kyoto Encyclopedia of Genes and Genomes (KEGG) (Kanehisa et al., 2010), which sorts gene products into pathways and processes. Such analyses provides lists of pathways, identify which pathway genes are in the community and quantify the abundances of genes and pathways (Abubucker et al., 2012). Comparing gene catalogues to specialized metabolic databases, such as the Carbohydrate-Active Enzymes database (Cantarel et al., 2009), is also useful. Carbohydrate-degrading capabilities of communities differ between body sites, suggesting the carbohydrate spectrum of each body site has determined which organisms and pathways are present (Cantarel et al., 2012).
In addition to pathway analysis, determining the presence and abundance of genes, such as antibiotic-resistance genes or virulence factors, in a community is possible using similar methods to those already described, and can shed light on pathogen burden in an individual and consequences of antibiotic treatment. The importance of functional analyses cannot be overemphasized, and functional properties of communities are thought to be more important than their taxonomic composition (Turnbaugh and Gordon, 2009).
Computational Tools and Strategies
Metagenomic data are a rich source of information for the sequencing and analysis methods already discussed (Raes et al., 2007; Wooley et al., 2010). The data analysis workflow has three phases. In the first phase, primary data are processed and filtered depending on the application. For 16S rRNA gene sequencing, the quality of analysis is important so that organisms are not misclassified. Initial processing addresses read quality, chimaerism (a read formed from different 16S rRNA genes), read length after removing low-quality bases and related issues (Edgar et al., 2011; Haas et al., 2011; Jumpstart Consortium Human Microbiome Project Data Generation Working Group, 2012; Schloss et al., 2011; Wright et al., 2012). For shotgun sequence data (Human Microbiome Project Consortium, 2012; Qin et al., 2010)—in addition to sequence quality— artefacts such as duplicate reads must also be addressed, as well as computationally removing contamination from human sequences. Removal of human and
bacterial sequences is important in read processing for virome analysis (Wylie et al., 2012a,b) (Figure A14-1).
Following production of processed reads, the second phase involves generating various derivative data sets. For 16S rRNA gene analysis, tables of taxa and abundance are produced by comparisons with 16S rRNA sequence databases or by using software packages to cluster the reads into OTUs (Lozupone et al., 2011; Schloss et al., 2009). Comparing shotgun reads to gene databases, such as GenBank or KEGG, by using the Basic Local Alignment Search Tool (BLAST), for example, produces lists of genes and the number of matched reads (Abubucker et al., 2012; Human Microbiome Project Consortium 2012a,b). Alignment of reads to reference genomes produces tables of breadth and depth of coverage, by reads of each genome (Martin et al., 2012). In each of these data sets, there is more biological information to be gleaned and added through further analysis. Not all reads match sequences in databases because not all organisms have a reference genome sequenced. In addition, reads may match genes whose function has not been elucidated. These sequences of unknown origin or function can be a sizeable fraction and the effect of this uninformative portion of data on analyses and conclusions is not clear.
The third phase of analysis uses these derivative data to produce trees or other representations of the similarity of communities, abundance curves, biodiversity plots, and other ecological and statistical descriptors of community structure (Lozupone et al., 2011; Schloss et al., 2009) (Figure A14-1). A list of hits from BLAST is used to build metabolic pathways for reconstruction of community capabilities (Abubucker et al., 2012). Alignments to reference genomes are further analysed for variants and population genetics of communities. Computational analysis can also be used to determine which organisms co-occur or rarely co-occur as evidence for symbiosis or competition, respectively, or to follow the dynamics of community structure in longitudinal time series (Caporaso et al., 2011).
Some analyses pose significant computational challenges. Comparisons to gene databases at the protein level are particularly demanding because shotgun sequences must be translated into polypeptides in all six reading frames, and each must be compared with a gene database represented at the protein level. Using conventional BLASTx programs for this comparison in large data sets, such as the HMP, could take decades, so supercomputers, accelerated BLAST programs or both must be used (Human Microbiome Project Consortium, 2012). A lack of efficient software and large enough computer clusters are often bottlenecks for metagenomic analysis, because sequencing and data production are not limiting factors. Management of large data sets and computing resources are receiving more attention, with cloud-computing services seeming to be a viable alternative (Angiuoli et al., 2011).
Future Directions and Challenges
The rapid rise in metagenomic studies has solved many problems but, as the field has grown, other questions have been raised. Existing methodology is becoming more sophisticated, and sequencing technology is making exponential advances (Table A14-1). The Illumina platform introduced instruments that were more appropriate for sequencing smaller genomes, with faster run times and longer read lengths, offering more flexibility for metagenomic applications. The long read length of the PacBio platform has the potential to help distinguish the reads from different organisms, which is a challenge for metagenomic shotgun sequencing. The technology produced by Oxford Nanopore promises long reads and short run times in a scalable system, and is therefore a good match for microbial applications. Reducing the amount of DNA needed for shotgun sequencing will allow communities in smaller anatomical regions, such as within the gastrointestinal tract, to be studied separately rather than together with other regions as is the case with the current methodology. Short run-time instruments and reductions in sample size will also hasten the introduction of microbiome analysis to the clinic, where analyses of patient samples must be quick and able to deal with limited amounts of material. Ultimately, the aim of human-microbiome research is its application as a diagnostic, therapeutic and preventive tool in the clinic.
The main limitation of using shotgun data is the large number of organisms that have not been cultured, let alone sequenced. These organisms are therefore under-represented in databases, and their shotgun reads are anonymous. When community shotgun data are assembled into genomes to obtain genome sequences for new organisms, contig sizes are typically small as a result of lower organism abundance and the challenges associated with assembly of a complex mixture. The long read lengths of PacBio and Oxford Nanopore instruments should help with these challenges, as will the development of assembly algorithms for metagenomic data. Expanding the catalogue of reference genomes by producing reference sequences for individual uncultured organisms is an active area. Methods that use cell sorting to isolate organisms, coupled with sequencing and assembly techniques for single-cell DNA preparations, are producing new genome sequences (Chitsaz et al., 2011; Dichosa et al., 2012) and, in high-throughput mode, could complement shotgun metagenomics for analysing communities.
One problem associated with genomic data is that it does not address whether an organism is alive or has succumbed to host defences or antibiotic treatment. However, the data can be complemented with transcriptome analysis, or proteomic and metabolomic data sets, which analyse gene expression and metabolic data that are more likely to be derived specifically from living cells.
The simultaneous advances in human genetics and genomics offer opportunities for combining studies of host genotype with microbiome phenotype. Methods for viewing the microbiome as a quantitative trait and relating this to host genotype are being developed (Benson et al., 2012). Advances in host–microbiome studies are also coming from combining immunology and human-microbiome
research (Elinav et al., 2011; Hooper et al., 2012). Moreover, continued development of statistical methods in microbiome research, such as advances in power analysis, will aid experimental design and future analysis.
Acknowledgments
The author gratefully acknowledges generous support from the National Institutes of Health.
References
Abubucker, S. et al. Metabolic reconstruction for metagenomic data and its application to the human microbiome. PLoS Comput. Biol. 8, e1002358 (2012).
Allander, T. et al. Cloning of a human parvovirus by molecular screening of respiratory tract samples. Proc. Natl Acad. Sci. USA 102, 12891–12896 (2005).
Angiuoli, S. V., White, J. R., Matalka, M., White, O. & Fricke, W. F. Resources and costs for microbial sequence analysis evaluated using virtual machines and cloud computing. PLoS ONE 6, e26624 (2011).
Arumugam, M. et al. Enterotypes of the human gut microbiome. Nature 473, 174–180 (2011).
Backhed, F., Ley, R. E., Sonnenburg, J. L., Peterson, D. A. & Gordon, J. I. Host–bacterial mutualism in the human intestine. Science 307, 1915–1920 (2005).
Benson, A. K. et al. Individuality in gut microbiota composition is a complex polygenic trait shaped by multiple environmental and host genetic factors. Proc. Natl Acad. Sci. USA 107,18933– 18938 (2010).
Bent, S. J. et al. Measuring species richness based on microbial community fingerprints: the emperor has no clothes. Appl. Environ. Microbiol. 73, 2399–2401 (2007).
Brandt, L. J. & Reddy, S. S. Fecal microbiota transplantation for recurrent clostridium difficile infection. J. Clin. Gastroenterol. 45, S159–S167 (2011).
Breitbart, M. & Rohwer, F. Method for discovering novel DNA viruses in blood using viral particle selection and shotgun sequencing. Biotechniques 39, 729–736 (2005).
Breitbart, M. et al. Metagenomic analyses of an uncultured viral community from human feces. J. Bacteriol. 185, 6220–6223 (2003).
Breitbart, M. et al. Viral diversity and dynamics in an infant gut. Res. Microbiol. 159, 367–373 (2008).
Bruls, T. & Weissenbach, J. The human metagenome: our other genome? Hum. Mol. Genet. 20, R142–R148 (2011).
Cantarel, B. L. et al. The Carbohydrate-Active EnZymes database (CAZy): an expert resource for glycogenomics. Nucleic Acids Res. 37, D233–D238 (2009).
Cantarel, B. L., Lombard, V. & Henrissat, B. Complex carbohydrate utilization by the healthy human microbiome. PLoS ONE 7, e28742 (2012).
Caporaso, J. G. et al. Moving pictures of the human microbiome. Genome Biol. 12, R50 (2011).
Casas, V. & Rohwer, F. Phage metagenomics. Methods Enzymol. 421, 259–268 (2007).
Chitsaz, H. et al. Efficient de novo assembly of single-cell bacterial genomes from short-read data sets. Nature Biotechnol. 29, 915–921 (2011).
Claesson, M. J. et al. Comparison of two next-generation sequencing technologies for resolving highly complex microbiota composition using tandem variable 16S rRNA gene regions. Nucleic Acids Res. 38, e200 (2010).
Croswell, A., Amir, E., Teggatz, P., Barman, M. & Salzman, N. H. Prolonged impact of antibiotics on intestinal microbial ecology and susceptibility to enteric Salmonella infection. Infect. Immun. 77, 2741–2753 (2009).
Dethlefsen, L., Huse, S., Sogin, M. L. & Relman, D. A. The pervasive effects of an antibiotic on the human gut microbiota, as revealed by deep 16S rRNA sequencing. PLoS Biol. 6,e280 (2008).
Dichosa, A. E. et al. Artificial polyploidy improves bacterial single cell genome recovery. PLoS ONE 7, e37387 (2012).
DOE Joint Genome Institute. A Genomic Encyclopedia of Bacteria and Archaea. http://www.jgi.doe.gov/programs/GEBA/ (US Department of Energy, 2012).
D’Onofrio, A. et al. Siderophores from neighboring organisms promote the growth of uncultured bacteria. Chem. Biol. 17, 254–264 (2010).
Edgar, R. C., Haas, B. J., Clemente, J. C., Quince, C. & Knight, R. UCHIME improves sensitivity and speed of chimera detection. Bioinformatics 27, 2194–2200 (2011).
Elinav, E. et al. NLRP6 inflammasome regulates colonic microbial ecology and risk for colitis. Cell 145, 745–757 (2011).
Finkbeiner, S. R. et al. Metagenomic analysis of human diarrhea: viral detection and discovery. PLoS Pathogens. 4, e1000011 (2008).
Flint, H. J., Bayer, E. A., Rincon, M. T., Lamed, R. & White, B. A. Polysaccharide utilization by gut bacteria: potential for new insights from genomic analysis. Nature Rev. Microbiol. 6,121–131 (2008).
Foxman, B., Goldberg, D., Murdock, C., Xi, C. & Gilsdorf, J. R. Conceptualizing human microbiota: from multicelled organ to ecological community. Interdiscip. Perspect. Infect. Dis. 2008, 613979 (2008).
Fredricks, D. N., Fiedler, T. L. & Marrazzo, J. M. Molecular identification of bacteria associated with bacterial vaginosis. N. Engl. J. Med. 353, 1899–1911 (2005).
Gans, J., Wolinsky, M. & Dunbar, J. Computational improvements reveal great bacterial diversity and high metal toxicity in soil. Science 309, 1387–1390 (2005).
Gloor, G. B. et al. Microbiome profiling by Illumina sequencing of combinatorial sequence-tagged PCR products. PLoS ONE 5, e15406 (2010).
Gough, E., Shaikh, H. & Manges, A. R. Systematic review of intestinal microbiota transplantation (fecal bacteriotherapy) for recurrent Clostridium difficile infection. Clin. Infect. Dis. 53, 994–1002 (2011).
Haas, B. J. et al. Chimeric 16S rRNA sequence formation and detection in Sanger and 454-pyrosequenced PCR amplicons. Genome Res. 21, 494–504 (2011).
Handelsman, J., Rondon, M. R., Brady, S. F., Clardy, J. & Goodman, R. M. Molecular biological access to the chemistry of unknown soil microbes: a new frontier for natural products. Chem. Biol. 5, R245–R249 (1998).
Hooper, L. V. & Gordon, J. I. Commensal host–bacterial relationships in the gut. Science 292, 1115–1118 (2001).
Hooper, L. V., Littman, D. R. & Macpherson, A. J. Interactions between the microbiota and the immune system. Science 336, 1268–1273 (2012).
Human Microbiome Jumpstart Reference Strains Consortium. A catalog of reference genomes from the human microbiome. Science 328, 994–999 (2010). This paper presents methods and analysis for large-scale production of reference genome sequences from human-microbiome organisms.
Human Microbiome Project Consortium. A framework for human microbiome research. Nature 486, 215–221 (2012b). This paper describes the data sets and resources of the HMP.
Human Microbiome Project Consortium. Structure, function and diversity of the healthy human microbiome. Nature 486, 207–214 (2012a). This paper presents analysis of data from the HMP.
Hummelen, R. et al. Deep sequencing of the vaginal microbiota of women with HIV. PLoS ONE 5, e12078 (2010).
Jakobsson, H. E. et al. Short-term antibiotic treatment has differing long-term impacts on the human throat and gut microbiome. PLoS ONE 5, e9836 (2010).
Jarchum, I. & Pamer, E. G. Regulation of innate and adaptive immunity by the commensal microbiota. Curr. Opin. Immunol. 23, 353–360 (2011).
Jumpstart Consortium Human Microbiome Project Data Generation Working Group. Evaluation of 16S rDNA-based community profiling for human microbiome research. PLoS ONE 7, e39315 (2012).
Kanehisa, M., Goto, S., Furumichi, M., Tanabe, M. & Hirakawa, M. KEGG for representation and analysis of molecular networks involving diseases and drugs. Nucleic Acids Res. 38, D355– D360 (2010).
Lazarevic, V. et al. Metagenomic study of the oral microbiota by Illumina high-throughput sequencing. J. Microbiol. Methods 79, 266–271 (2009).
Lepage, P. et al. Dysbiosis in inflammatory bowel disease: a role for bacteriophages? Gut 57, 424–425 (2008).
Lozupone, C., Lladser, M. E., Knights, D., Stombaugh, J. & Knight, R. UniFrac: an effective distance metric for microbial community comparison. ISME J. 5, 169–172 (2011).
Luckey, T. D. Introduction to intestinal microecology. Am. J. Clin. Nutr. 25, 1292–1294 (1972).
Manichanh, C. et al. Reduced diversity of faecal microbiota in Crohn’s disease revealed by a metagenomic approach. Gut 55, 205–211 (2006).
Marsland, B. J. Regulation of inflammatory responses by the commensal microbiota. Thorax 67, 93–94 (2012).
Martin, J. et al. Optimizing read mapping to reference genomes to determine composition and species prevalence in microbial communities. PloS ONE 7, e36427 (2012).
Miller, C. P., Bohnhoff, M. & Rifkind, D. The effect of an antibiotic on the susceptibility of the mouse’s intestinal tract to Salmonella infection. Trans. Am. Clin. Climatol. Assoc. 68, 51–55 (1956).
Minot, S. et al. The human gut virome: inter-individual variation and dynamic response to diet. Genome Res. 21, 1616–1625 (2011).
Minot, S., Grunberg, S., Wu, G. D., Lewis, J. D. & Bushman, F. D. Hypervariable loci in the human gut virome. Proc. Natl Acad. Sci. USA 109, 3962–3966 (2012).
Mulligan, M. E. Epidemiology of Clostridium difficile-induced intestinal disease. Clin. Infect. Dis. 6, S222–S228 (1984).
Nelson, T. A. et al. PhyloChip microarray analysis reveals altered gastrointestinal microbial communities in a rat model of colonic hypersensitivity. Neurogastroenterol. Motil. 23,169–177 (2011).
The NIH HMP Working Group et al. The NIH Human Microbiome Project. Genome Res. 19, 2317–2323 (2009).
Olsen, G. J., Lane, D. J., Giovannoni, S. J., Pace, N. R. & Stahl, D. A. Microbial ecology and evolution: a ribosomal RNA approach. Annu. Rev. Microbiol. 40, 337–365 (1986).
Palacios, G. et al. Panmicrobial oligonucleotide array for diagnosis of infectious diseases. Emerg. Infect. Dis. 13, 73–81 (2007).
Parfrey, L. W., Walters, W. A. & Knight, R. Microbial eukaryotes in the human microbiome: ecology, evolution, and future directions. Front. Microbiol. 2, 153 (2011).
Possemiers, S., Bolca, S., Verstraete, W. & Heyerick, A. The intestinal microbiome: a separate organ inside the body with the metabolic potential to influence the bioactivity of botanicals. Fitoterapia 82, 53–66 (2011).
Pride, D. T. et al. Evidence of a robust resident bacteriophage population revealed through analysis of the human salivary virome. ISME J. 6, 915–926 (2011).
Proctor, L. M. The Human Microbiome Project in 2011 and beyond. Cell Host Microbe 10, 287–291 (2011).
Qin, J. et al. A human gut microbial gene catalogue established by metagenomic sequencing. Nature 464, 59–65 (2010). This paper presents initial findings on the gut microbiome from the MetaHIT project.
Raes, J., Foerstner, K. U. & Bork, P. Get the most out of your metagenome: computational analysis of environmental sequence data. Curr. Opin. Microbiol. 10, 490–498 (2007).
Ravel, J. et al. Vaginal microbiome of reproductive-age women. Proc. Natl Acad. Sci. USA 108, S4680–S4687 (2011).
Riesenfeld, C. S., Schloss, P. D. & Handelsman, J. Metagenomics: genomic analysis of microbial communities. Annu. Rev. Genet. 38, 525–552 (2004).
Schloss, P. D. et al. Introducing mothur: open-source, platform-independent, community-supported software for describing and comparing microbial communities. Appl. Environ. Microbiol. 75, 7537–7541 (2009).
Schloss, P. D., Gevers, D. & Westcott, S. L. Reducing the effects of PCR amplification and sequencing artifacts on 16S rRNA-based studies. PLoS ONE 6, e27310 (2011).
Sekirov, I. et al. Antibiotic-induced perturbations of the intestinal microbiota alter host susceptibility to enteric infection. Infect. Immun. 76, 4726–4736 (2008).
Shanahan, F. The host–microbe interface within the gut. Best Pract. Res. Clin. Gastroenterol. 16, 915–931 (2002).
Sogin, M. L. et al. Microbial diversity in the deep sea and the underexplored “rare biosphere”. Proc. Natl Acad. Sci. USA 103, 12115–12120 (2006).
Srikanth, C. V. & McCormick, B. A. Interactions of the intestinal epithelium with the pathogen and the indigenous microbiota: a three-way crosstalk. Interdiscip. Perspect. Infect. Dis. 2008, 626827 (2008).
Stein, J. L., Marsh, T. L., Wu, K. Y., Shizuya, H. & DeLong, E. F. Characterization of uncultivated prokaryotes: isolation and analysis of a 40-kilobase-pair genome fragment from a planktonic marine archaeon. J. Bacteriol. 178, 591–599 (1996).
Turnbaugh, P. J. & Gordon, J. I. The core gut microbiome, energy balance and obesity. J. Physiol. (Lond.) 587, 4153–4158 (2009).
Vergin, K. L. et al. Screening of a fosmid library of marine environmental genomic DNA fragments reveals four clones related to members of the order Planctomycetales. Appl. Environ. Microbiol. 64, 3075–3078 (1998).
Wang, D. et al. Viral discovery and sequence recovery using DNA microarrays. PLoS Biol. 1, E2 (2003).
Wang, Z. et al. Gut flora metabolism of phosphatidylcholine promotes cardiovascular disease. Nature 472, 57–63 (2011).
Willner, D. & Furlan, M. Deciphering the role of phage in the cystic fibrosis airway. Virulence 1, 309–313 (2010).
Wooley, J. C., Godzik, A. & Friedberg, I. A primer on metagenomics. PLoS Comput. Biol. 6, e1000667 (2010).
Wright, E. S., Yilmaz, L. S. & Noguera, D. R. DECIPHER, a search-based approach to chimera identification for 16S rRNA sequences. Appl. Environ. Microbiol. 78, 717–725 (2012).
Wu, G. D. et al. Linking long-term dietary patterns with gut microbial enterotypes. Science 334, 105–108 (2011).
Wylie, K. M., Mihindukulasuriya, K. A., Sodergren, E., Weinstock, G. M. & Storch, G. A. Sequence analysis of the human virome in febrile and afebrile children. PLoS ONE 7, e27735 (2012b).
Wylie, K. M., Weinstock, G. M. & Storch, G. A. Emerging view of the human virome. Transl. Res. http://dx.doi.org/10.1016/j.trsl.2012.03.006 (24 April 2012a).
Zubrzycki, L. & Spaulding, E. H. Studies on the stability of the normal human fecal flora. J. Bacteriol. 83, 968–974 (1962).
SEQUENCE ANALYSIS OF THE HUMAN VIROME
IN FEBRILE AND AFEBRILE CHILDREN56
Kristine M. Wylie,57,* Kathie A. Mihindukulasuriya,57Erica Sodergren,57
George M. Weinstock,57and Gregory A. Storch58
Abstract
Unexplained fever (UF) is a common problem in children under 3 years old. Although virus infection is suspected to be the cause of most of these fevers, a comprehensive analysis of viruses in samples from children with fever and healthy controls is important for establishing a relationship between viruses and UF. We used unbiased, deep sequencing to analyze 176 nasopharyngeal swabs (NP) and plasma samples from children with UF and afebrile controls, generating an average of 4.6 million sequences per sample. An analysis pipeline was developed to detect viral sequences, which resulted in the identification of sequences from 25 viral genera. These genera included expected pathogens, such as adenoviruses, enteroviruses, and roseoloviruses, plus viruses with unknown pathogenicity. Viruses that were unexpected in NP and plasma samples, such as the astrovirus MLB-2, were also detected. Sequencing allowed identification of virus subtype for some viruses, including roseoloviruses. Highly sensitive PCR assays detected low levels of viruses that were not detected in approximately 5 million sequences, but greater sequencing depth improved sensitivity. On average NP and plasma samples
_______________________
56 Reprinted from PLoS ONE. Originally published as Wylie KM, Mihindukulasuriya KA, Sodergren E, Weinstock GM, Storch GA (2012) Sequence Analysis of the Human Virome in Febrile and Afebrile Children. PLoS ONE 7(6): e27735. doi:10.1371/journal.pone.0027735
Editor: Chiyu Zhang, Institut Pasteur of Shanghai, Chinese Academy of Sciences, China
Received: August 12, 2011; Accepted: October 23, 2011; Published: June 13, 2012
Copyright: © 2012 Wylie et al.
Funding: This study was supported by grant number 1UAH2AI083266-01 from the National Institute of Allergy and Infectious Diseases, a Demonstration Project of the Human Microbiome Project to GS, grant number UL1RR024992 from the National Institutes of Health (NIH)-National Center for Research Resources to GS, grant number U54HG003079 from the National Institutes of Health–National Human Genome Research Institute (NIH-NHGRI) to The Genome Institute, and grant number U54HG004968 from the NIH-NHGRI to The Genome Institute. The funders had no role in study design, data collection and analysis, decision to publish, or preparation of the manuscript.
Competing interests: The authors have declared that no competing interests exist.
* E-mail: kwylie@genome.wustl.edu
57 The Genome Institute, Washington University School of Medicine, Saint Louis, Missouri, USA.
58 The Department of Pediatrics, Washington University School of Medicine, Saint Louis, Missouri, USA.
from febrile children contained 1.5- to 5-fold more viral sequences, respectively, than samples from afebrile children. Samples from febrile children contained a broader range of viral genera and contained multiple viral genera more frequently than samples from children without fever. Differences between febrile and afebrile groups were most striking in the plasma samples, where detection of viral sequence may be associated with a disseminated infection. These data indicate that virus infection is associated with UF. Further studies are important in order to establish the range of viral pathogens associated with fever and to understand of the role of viral infection in fever. Ultimately these studies may improve the medical treatment of children with UF by helping avoid antibiotic therapy for children with viral infections.
Introduction
Viruses are thought to be the primary cause of unexplained fever in children under 3 years old, a common problem that results in medical visits and in some cases hospitalization (Baraff, 2000; Krauss et al., 1991). With the implementation of several vaccines against bacterial infections, the frequency of bacterial infections is low (Rudinsky et al., 2009; Waddle and Jhaveri, 2009; Watt et al., 2010; Wilkinson et al., 2009). While viruses are suspected to be the cause of fevers in children with no documented bacterial infection, in clinical practice, tests for viruses are often not performed, and consequently no cause for the fever is determined. In the absence of a clear diagnosis, antibiotics are often prescribed (Colvin et al., manuscript submitted). A comprehensive analysis of viruses in children with fever could improve our understanding of the causes of unexplained fevers (UF) and ultimately lead to modifications of the treatment of children with UF, including restricted use of antibiotics.
Next generation sequencing technologies have been used successfully for viral metagenomic analyses (Angly et al., 2006; Nakamura et al., 2009; Reyes et al., 2010; Willner et al., 2009, 2011) and discovery of novel viruses (Beritmart and Rohwer, 2005; Felix et al., 2011; Loh et al., 2009). The Roche 454 platform has been favored over the Illumina GAIIX platform because its longer read lengths are argued to be advantageous for detecting more remote sequence homologies with known viruses. However, the sequence depth per unit cost is much greater using the Illumina platform, and greater sequencing depth would presumably favor the detection of rare virus sequences in metagenomic samples. In this study we sought to develop a sensitive, cost-effective method for characterizing the human virome, the viral component of the human microbiome, to be applied to the analysis of the virome in samples from febrile and afebrile children.
We analyzed 176 plasma and nasophyaryngeal swab (NP) samples from children with UF (febrile) and afebrile children by high-throughput sequencing using the Illumina platform. Using sequencing for the analysis of viruses
associated with UF has several advantages. First, unlike targeted PCR assays, sequencing can detect unexpected and novel viruses. Second, sequencing can provide additional information such as virus subtype or sequence variation from reference genomes, adding detail to the understanding of the viruses present. Using the protocol we developed, we detected viruses in 86% of plasma samples and 63% of NP samples from febrile and afebrile children. Furthermore, distinctions between the viromes of febrile and afebrile groups were observed. The assessment of known viruses and initial identification of potentially novel viruses using short-read Illumina sequencing moves us toward a more complete understanding of the human virome and its role in health and disease.
Results
Detection of Known Viruses
The goal of our study was to use high-throughput, deep sequencing analysis methods to characterize the human virome in large sample sets. Previous studies demonstrated improved virus detection using deeper sequencing on the 454 pyrosequencing platform compared to Sanger sequencing (Victoria et al., 2009) and we sought to determine whether the greater sampling depth possible with the Illumina GAIIX platform would provide a further improvement. This required development of methods for processing the small clinical sample amounts for Illumina sequencing, computational pipelines for management of the large number of Illumina reads from multiple samples, and accurate detection of viruses from the short Illumina reads.
In preliminary experiments, clinical samples with known viruses were used to develop these methods. Plasma samples were identified that were PCR positive for either an enterovirus (a group of relatively small, single-stranded RNA viruses) or human herpesvirus 6 (HHV-6, a large, double-stranded DNA virus). The total nucleic acid (see Methods) from each sample was amplified in two independent experiments, and the replicates were sequenced on the 454 and Illumina platforms. In the initial Illumina experiment, 75-base, paired-end reads were generated (Table A15-1). The enterovirus sample, in which virus was detected by real-time PCR with an average Ct value of 30.6 from multiple experiments, showed viral reads with both 454 and Illumina platforms (Table A15-1). A single HHV-6 read was found in one of the 454 replicates, but reads were found in both Illumina replicates (see Methods for sequencing analysis pipeline). In both the enterovirus and HHV-6 samples, the number of virus reads was higher on the Illumina platform compared with the 454 platform, indicating that increased depth of sequencing strengthened the virus signal. These results encourgaged us to improve the Illumina library construction and sequencing protocol. Specifically, we increased the length of fragments from 300–400 base pairs (gel purified) to 300–800 base pairs by minimizing shearing. Second, the Illumina read-length
TABLE A15-1 Detection of Viruses with Next Generation Sequencing
| Sample | PCR | Replicate | 454 reads | Illumina (75 base) reads | Illumina (100 base) reads | |||||
| Total | Viral | Total | Viral | % genome length Covered | Total | Viral | % genome length covered | |||
| 9008 | Enterovirus | A | 58,924 | 11 | 34,612,722 | 1473 | 7.50% | 4,792,380 | 342 | 42.3% |
| 9008 | Enterovirus | B | 45,625 | 2 | 35,760,754 | 419 | - | - | - | - |
| 9022 | HHV-6 | A | 62,361 | 1 | 36,629,654 | 4 | - | 3,931,804 | 8 | - |
| 9022 | HHV-6 | B | 50,866 | 0 | 34,933,530 | 7 | - | - | - | - |
was increased to 100 bases to facilitate identification of viral sequences, especially those that were divergent from reference genomes. 3- to 13-fold more HHV-6 and enterovirus sequences were detected with this modified protocol (Table A15-1). Based on this result, we reduced the read depth for subsequent analyses to 3–5 million per sample, which facilitated processing large numbers of clinical samples. The improved protocol sampled more broadly across the enterovirus genome with 65% of the reads assembling into small contigs covering 1907 bases of the enterovirus genome. In contrast, more than 97 percent of the 1473 reads from the first experiment were concentrated in two contigs that covered only 550 bases. We next sought to apply the 100-base read-length protocol to large-scale analysis of samples from afebrile children and those with UF.
Sequencing and Analysis of Samples from Febrile and Afebrile Children
Nasopharyngeal (NP) swabs and plasma samples from children 2–36 months of age with fever without an apparent source and afebrile controls from the same age group (Table A15-2) were sequenced on the Illumina GAIIX. The samples that were sequenced were a subset of those included in a PCR-based analysis that tested for 15 genera of known viral pathogens, 12 in NP samples and 7 in plasma samples (Table A15-3) (Colvin et al., manuscript submitted). The median number of sequences produced per sample was approximately 4.4 million (Figure S1). The median and mean numbers of reads for the NP febrile, NP afebrile, and plasma febrile groups were each greater than 4 million. However, the number of reads from the plasma afebrile group was lower, with a median of 2.4 million and mean of 3.2 million reads, which may indicate less nucleic available for amplification and sequencing in plasma from healthy children
Sequences from 11 of the 15 viral genera in the PCR panel were detected in samples that had been tested by both sequencing and PCR, allowing for the comparison of methods (Figure A15-1). Only Betacoronavirus, Influenza B virus, and Rubulovirus were not found by either method. Parechovirus was found in NP samples by sequencing, but NP samples were not screened by PCR for this virus. Likewise, blood samples were not tested by PCR for respiratory viruses. These 11 viral genera were detected in 90 samples. In 39 instances the same virus was detected by both methods, 25 were found only by sequencing, and 42 were found only by PCR (Figure A15-1). Beyond the 11 genera targeted by PCR, sequences from a variety of both DNA and RNA viruses were detected by sequencing
|
Afebrile |
Unexplained fever (UF) |
|
|
Nasalpharyngeal swab |
81 |
50 |
|
Plasma |
22 |
23 |
TABLE A15-3 Virus Genera Screened by PCR
|
Genus |
PCR assay targets |
Samples assayed by PCR |
|
Alphacoronavirus |
229E, NL63 |
NP |
|
Betacoronavirus |
OC43, HKU1 |
NP |
|
Bocavirus |
Human Bocaviruses |
NP and Plasma |
|
Enterovirus |
Enteroviruses, Rhinovirues |
NP—Enteroviruses and Rhinoviruses |
|
Erythrovirus |
Parvovirus B19 |
|
|
Influenza A Virus |
Influenza A, H1, H3 |
Plasma |
|
Influenza B Virus |
Influenza B |
NP |
|
Mastadenovirus |
Human adenoviruses |
NP |
|
Metapneumovirus |
Human metapneumovirus |
NP and Plasma |
|
Parechovirus |
Human parechoviruses |
NP |
|
Pneumovirus |
RSV A, RSV B |
Plasma |
|
Polyomavirus |
JC, BK, WU, KI |
NP—WU and KI |
|
Respirovirus |
Human parainfluenza virus |
NP |
|
Roseolovirus |
Human Herpesvirus (HHV)-6, HHV-7 |
Plasma |
|
Rubulovirus |
HPIV-2, HPIV-4 |
NP |
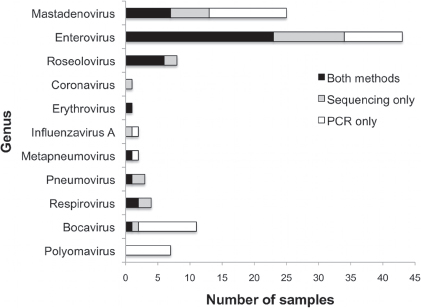
(Figure A15-2A and B, respectively). Nearly 50,000 sequences with similarity to 25 known viral genera were identified.
Comparison of Sequencing and PCR Results for the Most Commonly Detected Viruses
Mastadenoviruses, enteroviruses, and roseoloviruses were frequently detected by both sequencing and PCR, which allows a thorough comparison of the methods. Mastadenoviruses (referred to as adenoviruses) were detected in 19 samples by PCR, and 5 of those were confirmed by sequencing (Figure A15-1). For those samples in which an adenovirus was detected by sequencing, the Ct values in the real-time PCR assay tended to be lower (average Ct = 29.1) compared with those samples in which an adenovirus was not detected (average Ct = 37.8) (P = 0.0023), suggesting that deeper sequencing would be required to detect the low levels of virus present in these samples (Figure A15-3A). When we sequenced one NP sample (sample 9021-581), which had a Ct of 42.6 and was originally negative for adenovirus by sequencing, to a read depth of greater than 21 million reads, we were able to detect 2 adenovirus reads, consistent with the PCR result. However, for the plasma sample from the same subject (sample 9021-895), which had a Ct of 37.5, adenovirus was still not detected after generating more than 50 million reads. Interestingly, 192 and 9,003 adeno-associated virus sequences were detected in these NP and plasma samples respectively, indirectly supporting the presence of adenovirus detected by PCR. The detection of the adeno-associated virus demonstrates that the unbiased nature of shotgun sequencing can reveal the presence of additional viruses not evaluated by PCR.
Enteroviruses (enterovirus and rhinovirus species) were detected in 32 samples by PCR, of which 21 were also detected by sequencing (Figure A15-1). Different commercial PCR assays were used for plasma and NP samples. For the plasma samples, a real-time PCR assay from Cepheid run on the SmartCycler thermal cycler (Cepheid, Sunnyvale, CA) was used (Colvin et al., manuscript submitted). Enterovirus sequences were detected in each of the 5 plasma samples that were positive for enterovirus by PCR. The NP samples were assessed using the xTAG Respiratory Virus Panel, produced by Luminex or the Multicode PLx Respiratory Virus Panel produced by Eragen Inc (Madison, WI) (Colvin et al., manuscript submitted). Of the 27 PCR-positive NP samples, rhinovirus or enterovirus sequences were detected in 16. Although the MFI read out of the Luminex assay is not strictly quantitative, the average MFI for samples with rhinovirus or enterovirus detected by sequencing was significantly higher than the average MFI of those samples missed by sequencing (P = 0.0193), suggesting that enteroviruses are present at low levels in some samples and would require deeper sequencing for detection. In support of this, sequencing one sample to a read depth of greater than 20 million reads produced 2 previously undetected rhinovirus reads (sample 9031-591, MFI 1500).
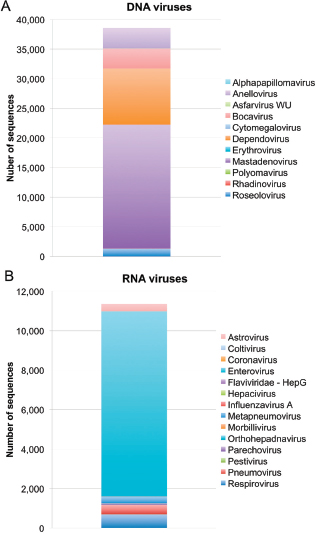
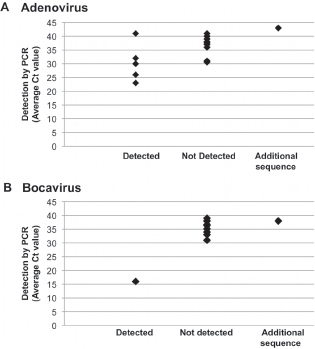
For the roseoloviruses, HHV-6 and HHV-7, sequences were detected in every sample that was positive by PCR and also in 2 additional samples that were negative by PCR (Figure A15-1). The sensitivity of sequencing appeared to be high, possibly because the large genome size of the roseoloviruses allows the virus to be sampled efficiently during sequencing. The roseolovirus assay is a conventional (not real-time) PCR assay that is not quantitative, so the level of virus present in these samples is unknown. Futhermore, roseoloviruses were found in 5 NP samples by sequencing, while NP samples were not screened by PCR for these viruses.
As mentioned above, there were 25 examples of adenovirus, enterovirus, roseolovirus and a number of less frequently detected viruses that were found by sequencing but not by PCR (Figure A15-1). In some cases, significant sequence similarity to the reference genome was found at the amino acid but not nucleotide
level, suggesting that these might be novel or divergent virus sequences not detected by the PCR assay. Future analyses will be aimed at characterizing viruses with remote sequence similarities to reference genomes and validating viruses detected by sequencing but not by PCR.
Polyomaviruses (WU and KI) and bocaviruses were detected by PCR, but rarely or not at all by sequencing (Figure A15-1). We did not detect any polyomavirus sequences in any of the samples that were positive by PCR. This includes one sample in which KI was detected with a Ct of 39.2 that was sequenced to a depth of greater than 21 million reads. WU and KI polyomavirus Ct values were relatively high, with all but one above 30. The sensitivity of the WU PCR assay is 7 plasmid copies per reaction and that of the KI assay is 50 plasmid copies (Hormozdi et al., 2010). Thus, the level of the viruses present in the samples may be relatively low, and this fact, coupled with the small, 8 kb genome size suggests that little nucleic acid is available for detection. Bocavirus was detected 10 samples by a sensitive PCR assay that can detect as few as 5 plasmid copies of the target (Sumino et al., 2010) (Figure A15-1). During initial sequencing of a sample from a febrile child with respiratory symptoms, not included in the UF group, the 5 kb bocavirus genome was detected by sequencing. This sample had higher levels of bocavirus by PCR than other samples (sample 9105-663, Ct 16.17). A second sample containing less bocavirus (sample 9013-573, Ct 37.59) was sequenced to a read depth of greater than 50 million reads, yielding 4 bocavirus reads (Figure A15-3B). These results show sequencing enables detection of viral genomes present at low levels, but requires additional optimization to target rare smaller genomes.
Many samples contained sequence reads that aligned to reference genomes from viruses that were not included in the PCR panels (Figure A15-4). NP samples positive for parechoviruses and roseoloviruses are included in this figure because those viruses were only assessed by PCR in plasma samples. The polyomavirus-positive samples contained SV40-like sequences, which were not included in the polyomavirus PCR assays. Each of the viral sequences represented in Figure A15-4 were detected in samples from febrile children, with the exception of the alphapapillomavirus and some of the roseolovirus sequences. Some of the viruses detected are known to be pathogenic (parechovirus), while the pathogenic significance of others remains undetermined (hepatitis G virus). Further validation and characterization of some of these unexpected viruses may reveal the presence of novel viruses with remote homologies to the known references or a previously unknown role for a virus in febrile illness.
In plasma and NP samples from one febrile subject with UF, we detected astrovirus sequences. The sequences from the plasma sample assembled into contigs that spanned 55% of the recently discovered astrovirus MLB2 genome. Astroviruses have previously been detected in stool samples and are associated with diarrhea. However, this is the first time an astrovirus has been detected in either NP or plasma samples. No other pathogen was detected in these samples, suggesting the astrovirus may have been the cause of the subject’s fever. We
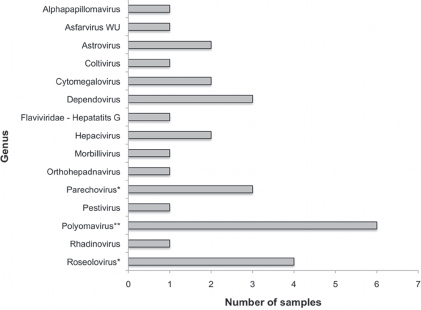
have subsequently extended the sequence of the capsid gene of this MLB2 virus, confirming its presence by both sequencing and PCR of RNA from the plasma sample and allowing us to compare this virus to another MLB2 isolate (Holtz et al., 2011).
One concern about using 100-base reads for virome analysis is that shorter read lengths may not permit the discovery of novel viruses. Therefore, we asked whether we would have detected the astrovirus sequences had MLB2 or closely related MLB1 not been previously discovered. In fact, 162 reads from this sample have amino acid sequence similarity to other human, avian, and mammalian astroviruses (Table A15-4) and, therefore, this method would have been successful at detecting a novel virus.
In contrast to the samples in which viruses were present at low levels with only a few sequence reads detected, many samples yielded sufficient virus sequences to provide more detailed information about the virus in the sample. In some cases the genome coverage was sufficiently deep and broad for contigs to be assembled that covered significant portions of the genome (Table A15-5). The genome coverage allowed us to show that the human bocavirus was type 1, with 99% identity to known reference genomes. Likewise, we were able to determine
TABLE A15-4 Illumina Sequences with Remote Homologies to Astroviruses
|
Virus |
Number of sequences |
|
Astrovirus from dog feces |
14 |
|
Bat astrovirus |
47 |
|
Bottlenose dolphin astrovirus |
1 |
|
California sea lion astrovirus |
4 |
|
Human-mink astrovirus |
3 |
|
Human astrovirus |
59 |
|
Rat astrovirus |
17 |
|
Sheep astrovirus |
2 |
|
Swine astrovirus |
14 |
|
Turkey astrovirus |
1 |
The top alignment from tblastx, excluding MLB1 and MLB2, is reported if the alignment was to an astrovirus.
that one of the rhinoviruses we detected was most similar to the recently discovered group C rhinovirus QPM (McErlean et al., 2007).
Do Viral Sequences Correlate with Fever Without a Source?
To compare afebrile children and children with UF, the number of sequence reads was normalized to 3 million per sample. After the adjustment, samples from children with UF had 1.5- to 5-fold more viral sequences than samples from afebrile children in NP and plasma samples, respectively (Figure A15-5A). Although sequencing is not strictly quantitative, the number of sequences generated was inversely correlated with Ct values from the real-time PCR assays
| Genome | Contigs | Input sequences | Sequences incorporated into contigs | Smallest contig | Largest contig | Genome size | Coverage |
| Human bocavirus | 5 | 2733 | 100 nt | 1886 nt | 5299 nt | 92.6% | |
| Respiratory syncitial virus | 24 | 2588 | 102 nt | 1882 nt | 15,191 nt | 58.4% | |
| Human rhinovirus QPM | 2 | 7159 | 798 nt | 5962 nt | 6948 nt* | 94.5% | |
| Human parainfluenza virus | 10 | 189 | 105 nt | 803 nt | 15, 462 nt | 14.2% | |
*Full genome sequence not available. Largest Genbank sequence used.
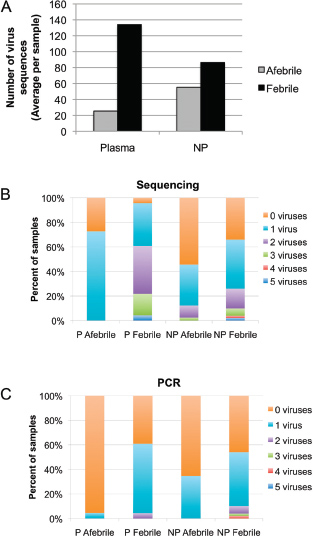
(Figure S2), which suggests the number of virus reads correlates with the amount of viral genomic material is present. More than one viral genus was found in some samples, and samples from children with fever had a greater number of viruses compared to those from afebrile children (Figure A15-5B). No plasma sample from an afebrile child had more than 1 viral genus detected, compared to 2 to 5 genera detected in 61% of the plasma samples from febrile children (Figure A15-5B). The difference in the percentages of samples with multiple viruses was not as striking in NP samples from febrile and afebrile children, although only 12% of samples from afebrile children had 2 or more viruses compared with 26% of samples from febrile children (Figure A15-5B). In all groups, sequencing detected multiple viral genera in a larger proportion of the samples than did directed PCR assays (Figure A15-5C).
More plasma samples from febrile children were positive for viral sequences than were samples from afebrile children. Anellovirus sequences were the only group found in the plasma from afebrile children. They were found in 80% of all plasma samples, and there was no significant difference between the presence of anellovirus sequences in febrile and afebrile children (P = 0.2837, Fisher’s Exact Test). The presence of anelloviruses is not surprising, as they infect the majority of children by 1 year of age and establish chronic infections that are detectable in the blood of healthy individuals (Breitbart and Rohwer, 2005; Ninomiya et al., 2008; Vasilyev et al., 2009). By removing the ubiquitous anellovirus sequences from the analysis the difference between the febrile and afebrile groups became even more striking (Figure A15-6A). Most viruses were detected in only a few samples, so differences between the febrile and afebrile groups were not statistically significant for individual viruses in this limited sample set. However, the enterovirus and roseolovirus sequences were more likely to be found in the febrile subjects than the afebrile subjects (Figure A15-6A), consistent with their roles as pathogens that can cause fever.
Viral sequences were also detected more commonly in NP samples from febrile children compared with those from afebrile children (Figure A15-6B). Again, anellovirus sequences were ubiquitous. Enterovirus sequences were found in similar proportions in samples from febrile and afebrile children. Excluding the ubiquitous anelloviruses and enteroviruses, the less common viral sequences were detected more frequently in the febrile subjects compared to the afebrile subjects (Figure A15-6B). Specifically, adenovirus and parechovirus were more commonly associated with NP samples from febrile children (Figure A15-6B). These data indicate that viruses are more commonly associated with samples from febrile children and suggest that viruses are the cause of many fevers in young children for which a source is not determined.
Sequences from febrile children revealed a greater range of viral genera compared to sequences from afebrile children. The difference was most striking in plasma, with sequences from 9 genera found as a result of screening the 23 samples from febrile children and 1 genus found as a result of screening the 22
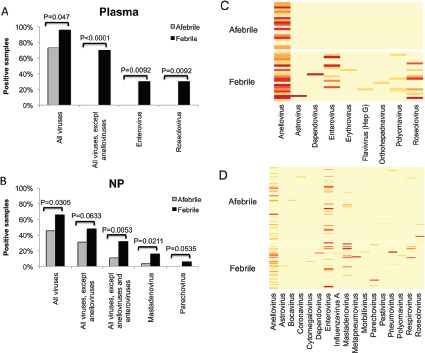
samples from afebrile children (Figure A15-6C). In NP samples, sequences from 14 genera were detected by screening the 50 samples from subjects with UF compared with 10 genera detected by screening the 81 samples from afebrile subjects (Figure A15-6D). These data indicate that fever is likely associated with a broad range of viruses, and further studies with larger sample sizes may be important for elucidating the roles of particular viruses in febrile illness.
Discussion
Although it has long been suspected that virus infection is the cause of many unexplained fevers in children under 3 years old, this is the first comprehensive analysis of viruses in samples from children with UF and controls using deep sequencing. We show that more viral sequences from a greater diversity of viruses are found in plasma and NP samples from children with UF than in corresponding samples from afebrile children, which supports the idea that viruses are the cause of many of these unexplained fevers. Children with UF are frequently hospitalized or treated with antibiotics without a positive test for a bacterial infection. The evidence we provide indicates that viruses are commonly associated with UF, and further studies should be done to confirm and elaborate on their role in this clinical syndrome. Ultimately, it would be helpful to identify specific clinical features or tests that could aid diagnosis of virus infection to improve the treatment of children with UF and minimize the unnecessary use of antibiotics.
As expected, the virome of the nasopharynx, which is directly exposed to the environment, is much more complex than the virome detected in plasma. Some viruses found in NP swabs were detected in both febrile and afebrile children. Of particular interest are the Enterovirus sequences, which include rhinoviruses that are known to cause colds. The presence of an enterovirus or rhinovirus in an NP sample from a child with fever would likely lead a physician to conclude that the enterovirus or rhinovirus was the cause of the fever, but we show that Enteroviruses are equally prevalent in the NP samples of afebrile children. These data suggest that in a microbial habitat that is exposed to the environment, the presence of a known pathogen should be interpreted with caution. These data also suggest that we are exposed to a number of known pathogens without showing symptoms of infection, either because the presence of the virus is transient or the particular virus species or strain does not cause symptoms. These observations indicate the importance of future experiments to evaluate the microbiome of the airways over time to look for indicators that a viral infection will become symptomatic, such as correlation of symptoms with specific viral subtypes, correlation with specific biomarkers, or shifts in the larger microbial community structure.
The detection of viruses in the plasma has different implications than in NP samples. Plasma is not generally exposed to the environment, so the presence of a known viral pathogen in the plasma is most likely the result of a disseminated infection. While this study was not designed to determine causation of fever, the
complete absence of known viral pathogens in the plasma of afebrile subjects suggests the viral pathogens detected in the plasma of febrile subjects were the sources of their fevers. While it is more invasive to collect blood than other samples, these data suggest blood samples may provide clearer assessment of viruses that are directly associated with disease in contrast to NP samples where viral pathogens are detected in asymptomatic individuals. Additional studies will need to be done to confirm these ideas. Other viruses, such as anelloviruses, are present chronically in the plasma of healthy people. It remains to be determined what kind of effects long-term exposure to these viruses has on the immune response and human health.
This study could be expanded in several ways in order to better characterize the role of viruses in UF, including detecting viruses in children in whom no viruses have been detected thus far. The first would be to include additional sample types, such as stool. The second would be deeper sequencing of samples, particularly plasma, in which the presence of virus sequences are most likely to be clinically significant. We confirmed that additional sequencing improved virus detection of low abundance virus sequences, and as sequencing costs decrease and analysis tools improve it may be practical to generate and analyze 10 times the number of sequences for each sample to enhance virus detection. It is notable that the use of the Illumina platform in this study enabled the detection of many rare virus sequences, which would likely have been missed using sequencing platforms that generate fewer sequencing reads per unit cost. The third way to improve the study would be further examination of existing sequence data for novel viruses, focusing especially on samples from febrile children with no pathogen detected.
Virus discovery using high-throughput sequencing methods has been very productive in recent years (Briese et al., 2009; Felix et al., 2011; Finkbeiner et al., 2008, 2009; Holtz et al., 2008; Loh et al., 2009). While short-read Illumina sequencing has not been widely adapted for virus discovery in metagenomic samples to date, our findings suggest that this 100-base platform can be applied to virus discovery. For example, the sequences we obtained from the recently discovered astrovirus MLB2 and rhinovirus QPM would have allowed discovery of those viruses based on alignment to other more remotely related reference genomes. In addition, the depth of sequencing gained using the Illumina platform gives the advantage of detecting more virus sequences compared to the 454 platform, which could be advantageous by allowing alignment over different parts of a reference genome, some of which may be more conserved, and by generating enough sequences to enable longer, contiguous sequences to be assembled for further analysis.
An important outcome of this study is to show that deep, Illumina-based sequencing has at least two advantages over targeted, PCR-based assays for the assessment of viruses in clinical samples. First, sequencing does not require prior knowledge of which viruses might be in the sample, thus allowing the detection
of unexpected and novel viruses. Second, sequencing can often provide information such as virus subtype or sequence variation from reference genomes, which adds detail to our understanding of the viruses present. Our study illustrates both of these advantages. First, we identified viruses that would not have been routinely queried by PCR assays for known pathogens. For example, we detected the astrovirus MLB2 in plasma and NP samples from a febrile child, which were subsequently confirmed by PCR in both samples ([Holtz et al., 2011] and data not shown). Because no other cause of the fever has been detected, these data suggest MLB2 is the cause of this subject’s fever and further examination of the role of this virus in pediatric fever is warranted.
The second advantage of sequencing, the ability to determine virus subtype or sequence variation from reference genomes, is also evident in our study. For example, we were able to identify specific types or subtypes or strains of rhinovirus and bocavirus. Notably, this can often be accomplished without sequencing most of the viral genome. In the case of HHV-6, all of the positive plasma samples were determined to be serotype 6B, even though 4 of the 8 samples had fewer than 15 HHV-6 sequences. We were also able to make distinctions between anellovirus species TTV, TTMDV, and TTMV with as little as one read. In future studies we will examine how different virus species and subtypes correlate with clinical symptoms.
One challenge in analyzing the virome in metagenomic samples is the speed of alignment tools available. Aligners designed for large data sets with short sequences generally gain processing speed by sacrificing the ability to identify sequences that differ more than slightly from the reference genome. Thus, many of these very fast aligners cannot be used effectively for analysis of virus sequences, which frequently differ considerably from their most closely related reference sequences. We are implementing new tools to be used for virome analysis that improve the speed of nucleotide and amino acid sequence alignments while retaining most of the sensitivity, which will allow the efficient analysis of a greater number of sequences. A second challenge for virome analysis is the use of a more inclusive reference database (such as NCBI’s NT) because this would allow identification of more virus sequences based on sequence similarity; however, alignment results from a large database can be problematic for several reasons: (a) taxonomy can be irregular causing computational problems and (b) some of the viral entries contain sequences from the human genome or bacterial cloning vectors, which cause false positive alignments. We have addressed these problems in the present study by manually reviewing the data, but our goal is to develop an easily updated, semi-curated database that would minimize these problems. Future versions of this analysis protocol will be improved with faster alignment tools and improved databases.
This study of deep sequencing of samples from febrile and afebrile children indicates that viruses are frequently detected in both groups, but with greater frequency and diversity in the samples from children with fever of unknown
cause. A causal role for these viruses would have important implications for the medical treatment of these children, since the children would not require antibiotic therapy. In evaluating viral causes of fever, sequencing appears to be advantageous in that it frequently reveals the presence of multiple viruses in a given sample, including unexpected viruses. Highly sensitive and specific PCR assays for a subset of viruses complement the sequencing analysis. As sequencing continues to become less expensive and the speed of computational tools improves, it is possible that its sensitivity could match that of PCR. This could lead to a powerful diagnostic approach: rapid, unbiased sequence analysis of the microbiome in patient samples, which could identify potentially pathogenic viruses and other microbes, followed by confirmation of the results using highly targeted and extremely specific PCR assays.
Methods
Ethics Statement
Samples were collected from human subjects using a protocol that was approved by the Washington University Human Research Protection Office. Written informed consent was obtained from the parents or legal guardians of all subjects.
Sample Collection
The subjects included were febrile and afebrile children 2 to 36 months of age seen at St. Louis Children’s Hospital. The group of febrile children was comprised of patients seen in the emergency room who had fever without an obvious source. In order to be included in the study, the physicians must have elected to obtain blood for testing. The afebrile group was comprised of children undergoing surgery. NP swabs and plasma samples were collected as described (Colvin et al., manuscript submitted). NP swabs were collected by inserting flocked swabs into the nasopharyngeal area, rotating the swab, and holding the swab in place for 10–15 seconds to increase specimen collection. Swabs were submerged in Universal Transport Medium (Copan), and the shafts of the swabs were cut or broken off and discarded. The medium containing the swab was briefly vortexed, and then the swabs were removed without wringing out any absorbed medium. Tubes were centrifuged, and the supernatant was aliquotted and frozen at –70°C. Total nucleic acid was extracted using the Qiagen BioRobot M48 the Roche MagNA Pure automated extractor for NP and plasma samples, respectively.
Sample Preparation and Sequencing
For samples from afebrile and febrile children, sequencing libraries were prepared to look for DNA and RNA viruses. DNA and RNA were prepared as
previously described (Wang et al., 2002, 2003). In brief, using total nucleic acid templates, RNA was primed with Primer A for reverse transcription. Sequenase DNA polymerase was used for second strand synthesis. DNA and RNA fragments were amplified with Primer B for 40 cycles. Samples were sequenced on the Roche 454 GS FLX Titanium or Illumina GAIIX. For samples in which additional sequencing reads were generated, the Illumina GAIIX or Illumina HiSeq 2000 was used (Figure S3). The SRR accession numbers for the sequence data are provided in Figure S4.
Sequence Analysis
A pipeline was developed for the analysis of large numbers of short sequence reads. This was adapted from that used for the analysis of 454 sequences, which used BLASTn and tBLASTx (Altschul et al., 1997) to align sequences to references in the NT database,59 followed by a manual review of the viral alignments. The details of the protocol for analysis of short reads follow. After removal of primer sequences, completely identical sequences were collapsed into a single representative sequence to minimize the number of sequences to be analyzed. Low complexity sequences were then masked using Dust (Morgulis et al., 2006). Sequences with greater than 20 N nucleotides (either from sequencing error or as a result of Dust) were removed. Human sequences were identified for removal by aligning sequences to the Genome Reference Consortium’s human build 3660 including unplaced, human mitochondrial, and 5.8 s, 18 s, and 28 s rDNA sequences using cross_match (Green, 1994) with the following alignment parameters: minscore 70, bandwidth 3, penalty –1, gap_init –1, gap_ext –1, masklevel 0. Non-human sequences were aligned to a metagenomic database consisting of all virus and phage sequences in NCBI NT plus full genomes from other microbes including bacteria, archaea, and small eukaryotes (Mitreva, et al., unpublished). Cross_match was used with the same parameters used for the human alignments. Any sequences that were unaligned using nucleotide alignment were then aligned to NR (http://ftp.ncbi.nlm.nih.gov/blast/db/) using WU-BLAST (BlastX) (Altschul et al., 1990) with the following parameters: filter seg, W 6, WINK 6, nogap. Sequences that aligned to microbial references using either cross_match or WU-BLAST were confirmed by WU-BLAST alignment to the larger NT database. Virus alignments were then manually evaluated, and ambiguous alignments were removed. The same protocol was used for the analysis of the 75-mer data, except a minscore of 50 was used in the cross_match alignments. Detailed sequence statistics are presented in Figure S5. Figure S6 shows the number of virus sequences found with cross_match and BlastX, without scaling.
_______________________
59http://ftp.ncbi.nlm.nih.gov/blast/db
60http://www.ncbi.nlm.nih.gov/projects/genome/assembly/grc/data.shtml
Viral sequences were assembled into contigs using Tigra (Chen L and Weinstock G, unpublished).
Acknowledgments
We thank David Wang for helpful discussion, Makedonka Mitreva, John Martin, Sahar Abubucker, and Karthik Kota for providing human reference and non-viral microbial reference databases, and Todd Wylie, John Martin, Eric Becker, and Matt Callaway for assistance with programming and parallelization of alignments.
Author Contributions
Conceived and designed the experiments: KMW KAM ES GMW GAS. Performed the experiments: KMW KAM. Analyzed the data: KMW KAM GAS. Wrote the paper: KMW GMW GAS. Contributed patient samples: GAS.
References
Altschul SF, Gish W, Miller W, Myers EW, Lipman DJ (1990) Basic local alignment search tool. J Mol Biol 215: 403–410.
Altschul SF, Madden TL, Schaffer AA, Zhang J, Zhang Z, et al. (1997) Gapped BLAST and PSI-BLAST: a new generation of protein database search programs. Nucleic Acids Res 25: 3389– 3402. doi: 10.1093/nar/25.17.3389.
Angly FE, Felts B, Breitbart M, Salamon P, Edwards RA, et al. (2006) The marine viromes of four oceanic regions. PLoS Biol 4: e368. doi: 10.1371/journal.pbio.0040368.
Baraff LJ (2000) Management of fever without source in infants and children. Ann Emerg Med 36: 602–614.
Breitbart M, Rohwer F (2005) Method for discovering novel DNA viruses in blood using viral particle selection and shotgun sequencing. Biotechniques 39: 729–736. doi: 10.2144/000112019.
Briese T, Paweska JT, McMullan LK, Hutchison SK, Street C, et al. (2009) Genetic detection and characterization of Lujo virus, a new hemorrhagic fever-associated arenavirus from southern Africa. PLoS Pathog 5: e1000455. doi: 10.1371/journal.ppat.1000455.
Felix MA, Ashe A, Piffaretti J, Wu G, Nuez I, et al. (2011) Natural and experimental infection of Caenorhabditis nematodes by novel viruses related to nodaviruses. PLoS Biol 9: e1000586. doi: 10.1371/journal.pbio.1000586.
Finkbeiner SR, Allred AF, Tarr PI, Klein EJ, Kirkwood CD, et al. (2008) Metagenomic analysis of human diarrhea: viral detection and discovery. PLoS Pathog 4: e1000011. doi: 10.1371/journal. ppat.1000011.
Finkbeiner SR, Holtz LR, Jiang Y, Rajendran P, Franz CJ, et al. (2009) Human stool contains a previously unrecognized diversity of novel astroviruses. Virol J 6: 161. doi: 10.1186/1743-422X-6-161.
Green P (1994) Cross_match. Unpublished manuscript. http://wwwphraporg.
Holtz LR, Finkbeiner SR, Kirkwood CD, Wang D (2008) Identification of a novel picornavirus related to cosaviruses in a child with acute diarrhea. Virol J 5: 159. doi: 10.1186/1743-422X-5-159.
Holtz LR, Wylie KM, Weinstock GM, Sodergren E, Jiang Y, et al. (2011) Astrovirus MLB2 Viremia in a Febrile Child. Emerg Inf Dis. (in press).
Hormozdi DJ, Arens MQ, Le BM, Buller RS, Agapov E, et al. (2010) KI polyomavirus detected in respiratory tract specimens from patients in St. Louis, Missouri. Pediatr Infect Dis J 29: 329–333. doi: 10.1097/INF.0b013e3181c1795c.
Krauss BS, Harakal T, Fleisher GR (1991) The spectrum and frequency of illness presenting to a pediatric emergency department. Pediatr Emerg Care 7: 67–71. doi: 10.1097/00006565-199104000-00001.
Loh J, Zhao G, Presti RM, Holtz LR, Finkbeiner SR, et al. (2009) Detection of novel sequences related to african Swine Fever virus in human serum and sewage. J Virol 83: 13019–13025. doi: 10.1128/JVI.00638-09.
McErlean P, Shackelton LA, Lambert SB, Nissen MD, Sloots TP, et al. (2007) Characterisation of a newly identified human rhinovirus, HRV-QPM, discovered in infants with bronchiolitis. J Clin Virol 39: 67–75. doi: 10.1016/j.jcv.2007.03.012.
Morgulis A, Gertz EM, Schaffer AA, Agarwala R (2006) A fast and symmetric DUST implementation to mask low-complexity DNA sequences. J Comput Biol 13: 1028–1040. doi: 10.1089/cmb.2006.13.1028.
Nakamura S, Yang CS, Sakon N, Ueda M, Tougan T, et al. (2009) Direct metagenomic detection of viral pathogens in nasal and fecal specimens using an unbiased high-throughput sequencing approach. PLoS One 4: e4219. doi: 10.1371/journal.pone.0004219.
Ninomiya M, Takahashi M, Nishizawa T, Shimosegawa T, Okamoto H (2008) Development of PCR assays with nested primers specific for differential detection of three human anelloviruses and early acquisition of dual or triple infection during infancy. J Clin Microbiol 46: 507–514. doi: 10.1128/JCM.01703-07.
Reyes A, Haynes M, Hanson N, Angly FE, Heath AC, et al. (2010) Viruses in the faecal microbiota of monozygotic twins and their mothers. Nature 466: 334–338. doi: 10.1038/nature09199.
Rudinsky SL, Carstairs KL, Reardon JM, Simon LV, Riffenburgh RH, et al. (2009) Serious bacterial infections in febrile infants in the post-pneumococcal conjugate vaccine era. Acad Emerg Med 16: 585–590. doi: 10.1111/j.1553-2712.2009.00444.x.
Sumino KC, Walter MJ, Mikols CL, Thompson SA, Gaudreault-Keener M, et al. (2010) Detection of respiratory viruses and the associated chemokine responses in serious acute respiratory illness. Thorax 65: 639–644. doi: 10.1136/thx.2009.132480.
Vasilyev EV, Trofimov DY, Tonevitsky AG, Ilinsky VV, Korostin DO, et al. (2009) Torque Teno Virus (TTV) distribution in healthy Russian population. Virol J 6: 134. doi: 10.1186/1743-422X-6-134.
Victoria JG, Kapoor A, Li L, Blinkova O, Slikas B, et al. (2009) Metagenomic analyses of viruses in stool samples from children with acute flaccid paralysis. J Virol 83: 4642–4651. doi: 10.1128/JVI.02301-08.
Waddle E, Jhaveri R (2009) Outcomes of febrile children without localising signs after pneumococcal conjugate vaccine. Arch Dis Child 94: 144–147. doi: 10.1136/adc.2007.130583.
Wang D, Coscoy L, Zylberberg M, Avila PC, Boushey HA, et al. (2002) Microarray-based detection and genotyping of viral pathogens. Proc Natl Acad Sci U S A 99: 15687–15692. doi: 10.1073/pnas.242579699.
Wang D, Urisman A, Liu YT, Springer M, Ksiazek TG, et al. (2003) Viral discovery and sequence recovery using DNA microarrays. PLoS Biol 1: E2. doi: 10.1371/journal.pbio.0000002.
Watt K, Waddle E, Jhaveri R (2010) Changing epidemiology of serious bacterial infections in febrile infants without localizing signs. PLoS One 5: e12448. doi: 10.1371/journal.pone.0012448.
Wilkinson M, Bulloch B, Smith M (2009) Prevalence of occult bacteremia in children aged 3 to 36 months presenting to the emergency department with fever in the postpneumococcal conjugate vaccine era. Acad Emerg Med 16: 220–225. doi: 10.1111/j.1553-2712.2008.00328.x.
Willner D, Furlan M, Haynes M, Schmieder R, Angly FE, et al. (2009) Metagenomic analysis of respiratory tract DNA viral communities in cystic fibrosis and non-cystic fibrosis individuals. PLoS One 4: e7370. doi: 10.1371/journal.pone.0007370.
Willner D, Furlan M, Schmieder R, Grasis JA, Pride DT, et al. (2011) Metagenomic detection of phage-encoded platelet-binding factors in the human oral cavity. Proc Natl Acad Sci U S A 108: 4547–4553. doi: 10.1073/pnas.1000089107.


