
Applicants for National Geospatial-Intelligence Agency (NGA) positions must be U.S. citizens and have a relevant bachelor’s degree, experience, or both (Box 4.1). Many geospatial intelligence disciplines needed for these positions are small and some are shrinking. Thus, a key question for agency managers is how many individuals have education and/or experience in the core and emerging areas now and over the next 20 years (Task 1). This chapter assesses the supply of two sources of expertise in the core and emerging areas: (1) new graduates entering the workforce with a relevant degree, and (2) individuals already working in occupations outside NGA that require relevant knowledge or skills. It also examines factors that reduce the availability of this expertise to NGA.
CURRENT AVAILABILITY OF EXPERTS
To assess the current availability of experts in the core and emerging areas, the committee analyzed government statistics on the number of individuals graduating with a relevant degree from a U.S. college or university and the number of experienced individuals employed in occupations that require relevant knowledge or skills. For example, one source of NGA employees is former military officers, who have received a substantial amount of on-the-job training in the field of service. Data on new graduates are available from the Department of Education, which tracks the number of degrees conferred by level and field of study. Data on experienced individuals working in related fields are available from the Bureau of Labor Statistics, which collects and tracks employment statistics for more than 800 occupations.
Supply of New Graduates
The Department of Education’s National Center for Education Statistics gathers information from U.S. colleges and universities on the number of degrees conferred by degree level and field of study through its Integrated Postsecondary Education Data System. Educational institutions use a set of instructional programs defined in the Classification of Instructional Programs to report degree data. The Classification of Instructional Programs includes more than a thousand programs.1 Cartography is the only core or emerging area tracked in this classification directly, but some of the other areas are mentioned in the code descriptions. For example, photogrammetry appears in the descriptions of three codes; remote sensing appears in six codes; and geodesy appears in four codes. Because the core and emerging areas do not exactly correspond to the instructional program codes, the committee chose relevant fields of study to track by matching the descriptions of the instructional programs to the skills, degrees, or coursework identified for the core and emerging areas (Chapters 2 and 3). The committee used expert judgment to rank each instructional program as highly relevant, possibly relevant, or not relevant to each area.
__________________
1 See <http://nces.ed.gov/pubs2002/cip2000/ciplist.asp> for a list of all programs. The committee used the 2000 version of the Classification of Instructional Programs because data were not available for the 2010 version when the analysis was carried out.
BOX 4.1
NGA Education Requirements
Most geospatial analysis positions at NGA require a bachelor’s degree, 6 years of experience, or a comparable combination of education and experience (Table B.1, Appendix B). A master’s or doctorate degree is preferred for principal scientists. In NGA’s current workforce, more than 80 percent of scientists and analysts have a bachelor’s degree and 30 percent have a master’s degree. Relatively few have a doctorate degree or less than a bachelor’s degree (e.g., an associate’s degree).
The fields of study specified in the education requirements for NGA scientist and analyst positions are diverse (Table B.1, Appendix B). A few occupations have relatively specific requirements. For example, analysts specializing in geospatial analysis must have a related degree or a certificate in Geographic Information Systems from an accredited university. However, many positions allow a wide range of degree topics. For example, applicants for imagery intelligence positions may hold a bachelor’s degree in engineering, foreign area studies, geography, history, imagery science, international affairs, military science, physical science, political science, remote sensing, or a related discipline. The 25 most common degree topics specified in science and analysis position at NGA are shown graphically in the figure below. The most highly sought degree science, engineering, mathematics, and geography—are broad areas that encompass several fields of study, suggesting that NGA is flexible on the field of study for its science and analysis positions.

FIGURE The 25 moat common degree topics in NGA job descriptions for scientists and analysts(Table B.1, Appendix B), which focus on five core areas: geodesy and geophysics, photogrammetry, remote sensing, cartography, and GIS and geospatial analysis. In word clouds such as this, the most common topics are portrayed by the largest lettering. An arbitrary color scheme is used to make it easier to distinguish the various phrases.
SOURCE: Generated using <http://www.wordle.net>.
A total of 164 instructional programs were judged to be highly relevant or possibly relevant to the core and emerging areas. The definitions of these programs are given in Table C.1 of Appendix C, and the assignment of relevance to each core and emerging area is given in Table C.2.
Figure 4.1 shows the number of instructional programs that potentially provide knowledge and skills that are relevant to each of the core and emerging areas. Areas that are highly interdisciplinary (e.g., human geography, forecasting) or that are taught in several different university departments (e.g., remote sensing) have the largest number of highly relevant instructional programs (21–57). The area with the lowest number of relevant instructional programs is photogrammetry, which has only 1 highly relevant instructional program (surveying engineering) and 12 possibly relevant programs. The highly relevant instructional programs that were identified most often across the core and emerging areas were surveying engineering, mathematical statistics and probability, and cartography.
The large number of highly relevant or possibly relevant instructional programs (164) yields a correspondingly large number of graduates. For human geography, for example, the committee deemed 54 instructional programs as highly relevant and 28 instructional programs as possibly relevant. In 2009, more than 150,000 degrees were conferred at all levels for the highly relevant instructional programs and nearly 100,000 degrees were conferred for the possibly relevant instructional programs (Table C.3 in Appendix C). These numbers are clearly overestimates of the recruitment pool, given
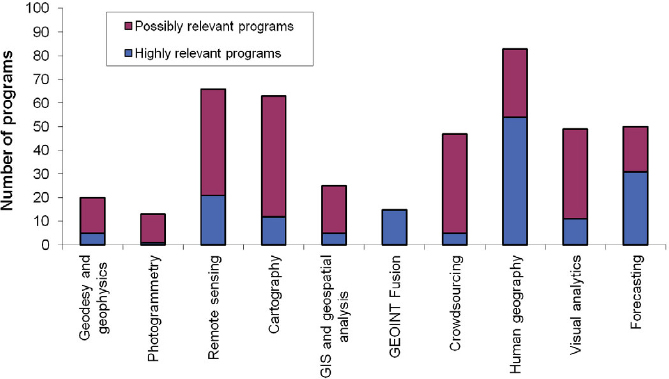
FIGURE 4.1 Number of instructional programs that potentially provide knowledge and skills that are relevant to the core and emerging areas. SOURCE: Data from the National Center for Education Statistics’ Classification of Instructional Programs, <http://nces. ed.gov/pubs2002/cip2000/ciplist.asp>.
that human geography, as defined in this report, is an emerging area.
A more realistic “upper bound” on the number of graduates was determined by focusing on the 109 instructional programs considered by the committee to be highly relevant to the core and emerging areas.
Figure 4.2 shows the number of bachelor’s, master’s, and doctorate degrees conferred in 2009 in highly relevant fields of study (see also Table C.4 in Appendix C). For each of the core and emerging areas, a few instructional programs produce more than 50 percent of graduates (Table C.6):
• geodesy and geophysics: aerospace, aeronautical and astronautical engineering;
• photogrammetry: surveying engineering;
• remote sensing: mathematics, general;
• cartography: geography; graphic design;
• GIS and geospatial analysis: geography;
• GEOINT fusion: information science/studies; information technology; environmental studies; environmental science;
• crowdsourcing: information technology; statistics, general;
• human geogmphy: political science and government, general; history, general; sociology;
• visual analytics: information science/studies; graphic design; and
• forecasting: political science and government, general; sociology.
The instructional programs that produce the bulk of graduates do not always match the programs that provide the bulk of skills needed for a position in a core or emerging area (e.g., see Tables A.1–A.10, Appendix A). The mismatch is greatest in remote sensing, geodesy and geophysics, human geography, and forecasting.
Figure 4.2 shows that more than three-quarters of the degrees were at the bachelor’s level and about 18 percent were at the master’s level. The mix of degrees conferred varied among the core and emerging areas, with a larger fraction of bachelor’s degrees in fields highly relevant to cartography, human geography, and forecasting; a larger fraction of master’s degrees in
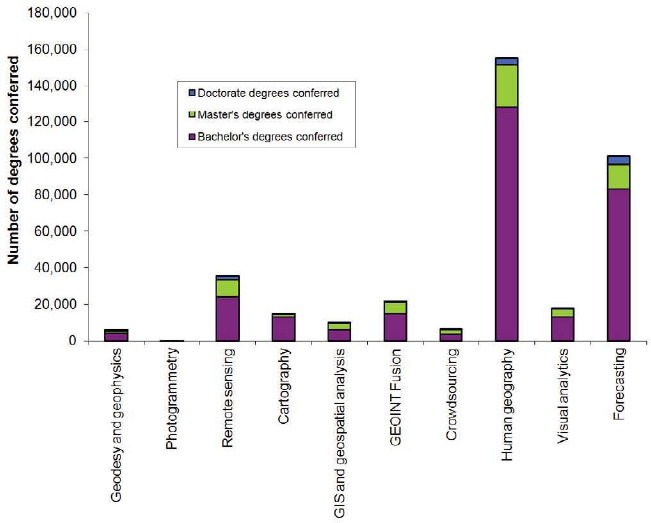
FIGURE 4.2 Number of degrees conferred in 2009 in instructional programs that are highly relevant to the core and emerging areas. SOURCE: Data from the U.S. Department of Education, National Center for Education Statistics’ Integrated Postsecondary Education Data System Completions Survey. Accessed via WebCASPAR.
fields highly relevant to crowdsourcing and GIS and geospatial analysis; and a larger fraction of doctorate degrees in fields highly relevant to geodesy and geophysics and remote sensing.
Figure 4.3 shows trends in the number of graduates for all levels in fields of study that are highly relevant to the core and emerging areas for the 2000–2009 period (see also Table C.4, Appendix C). The figures show that the total number of degrees conferred grew over the 2000–2009 period. Annual growth rates for that period were 3.5 percent for bachelor’s degrees, 4.5 percent for master’s degrees, and 2.1 percent for doctorate degrees.2
Growth rates in the number of degrees conferred in highly relevant fields of study vary considerably by area (Figure 4.4; Table C.5, Appendix C). The areas with the highest growth in the number of relevant degrees (annual growth rates greater than 4 percent) from 2000 to 2009 were geodesy and geophysics, cartographic science, crowdsourcing, and visual analytics. Some of the fields of study driving the increase include aerospace, aeronautical, and astronautical engineering (geodesy and geophysics); information technology
__________________
2 Annual growth rates were calculated using the standard compound annual growth rate formula: (ending value ÷ beginning value)1/N–1. In this case, the ending value is the number of degrees conferred in 2009, the beginning value is the number of degrees conferred in 2000, and N is the number of years that have elapsed between the beginning and ending values (9 years).
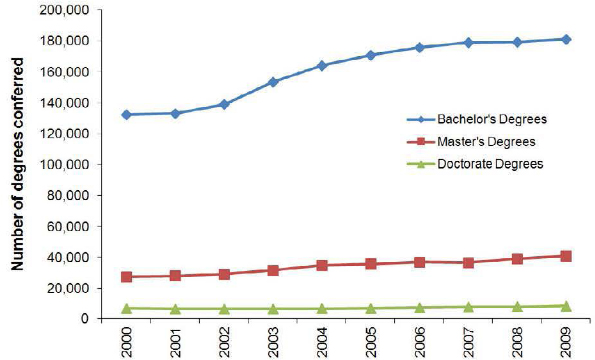
FIGURE 4.3 Number of degrees conferred by year for the fields of study that are highly relevant to the core and emerging areas. SOURCE: Data from the U.S. Department of Education, National Center for Education Statistics’ Integrated Postsecondary Education Data System Completions Survey. Accessed via WebCASPAR.
(crowdsourcing); and graphic design, and animation, interactive technology, video graphics, and special effects (cartographic science and visual analytics). The sharp increase in 2003 or 2004 for crowdsourcing, cartography, and visual analytics (Figure 4.4 top) reflects the introduction of new instructional program codes (Table C.6, Appendix C). The 2008 decline in crowdsourcing reflects a decreasing number of degrees conferred in information technology. The decline for visual analytics between 2003 and 2007 reflects a decrease in degrees conferred in information science/ studies, although recent increases in degrees conferred in animation, interactive technology, video graphics, and special effects have led to a recent uptick. No clear trend is apparent in photogrammetry, possibly because only one field of study was considered highly relevant and numbers of graduates in that field are small and were not reported until 2004.
The degree data compiled by the Department of Education are not ideal for estimating the supply of new graduates in the core and emerging areas discussed in this report. One shortcoming is that the programs included in the Classification of Instructional Programs may not perfectly match university programs. Each university uses discretion in matching the degrees it confers to the programs included in the classification, which could result in inconsistencies across universities. Moreover, instructional program codes evolve over time. For example, nearly half of the instructional programs that are highly relevant to the core and emerging areas were introduced in the classification used in this study, one was discontinued, and several were renamed. In some of the new fields, no degrees were reported, suggesting that it takes time for universities to adopt new classifications.
The most important shortcoming in the Department of Education data is that only one instructional program (cartography) directly matches an area analyzed in this report. For the other core and emerging areas, several instructional programs potentially offer some relevant knowledge and skills. Adding up the number of graduates from all relevant instructional programs yields an “upper bound” on the number of experts in the core and emerging areas. To estimate
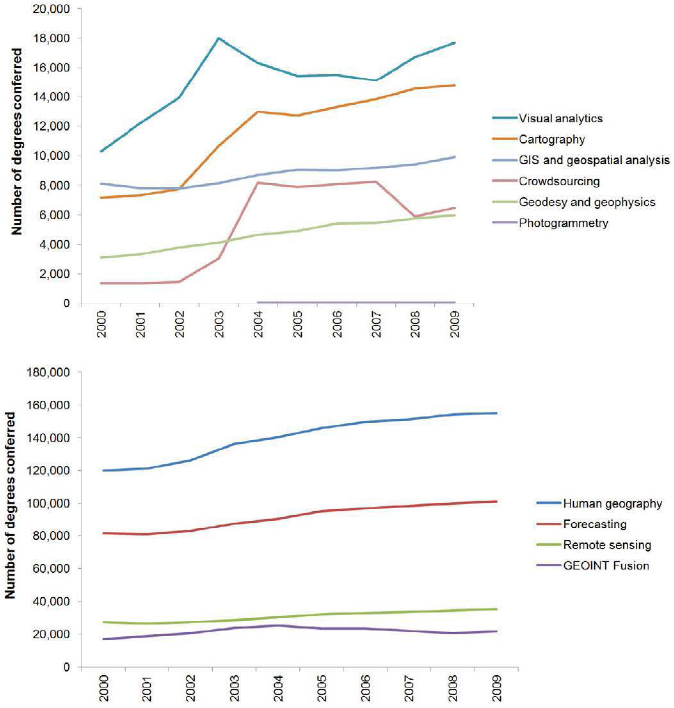
FIGURE 4.4 Total number of degrees conferred for 2000–2009 by year for fields of study that are highly relevant to the core and emerging areas. Note the change in scale between the two figures. (Top) Ten-year trends for photogrammetry, geodesy and geophysics, crowdsourcing, GIS and geospatial analysis, cartography, and visual analytics. (Bottom) Ten-year trends for GEOINT fusion, remote sensing, forecasting, and human geography. SOURCE: Data from the U.S. Department of Education, National Center for Education Statistics’ Integrated Postsecondary Education Data System Completions Survey. Accessed via WebCASPAR.
the number of graduates with the desired mix of skills and knowledge, the committee took into account the number of graduates from the prevailing instructional program (if any) and the number of universities offering programs in a core or emerging area (see Tables A.1–A.10, Appendix A). For remote sensing, which has no prevailing instructional program, the committee made its estimate based on the number of universities and the membership of the primary professional society for remote sensing and related geospatial analysis—the American Society for Photogrammetry and Remote Sensing (ASPRS). The committee’s estimates, which are based on expert judgment, are given in Table 4.1.
Accounting for the number of university programs in the core and emerging areas and the instructional programs most commonly associated with these programs lowers the estimated number of graduates in the core and emerging areas (Table 4.1). The difference between the total number of graduates from highly relevant instructional programs and the number of graduates with knowledge in a core or emerging area is smallest for photogrammetry and for GIS and geospatial analysis, each of which is dominated by one instructional program that provides the bulk of training necessary for the core area (i.e., geography for GIS and geospatial analysis [Table A.4]). For core or emerging areas with a small number of graduates in a closely related instructional program (e.g., geodesy and geophysics, cartography) and/or a small number
TABLE 4.1 Estimated Annual Number of Graduates at All Levels with Knowledge in a Core or Emerging Area
| Number of Graduates in Relevant Fields of Studya | Number ofUniversities with Training in a Core or Emerging Areabb | Number of Graduates with Knowledge in a Core or Emerging Area |
| Geodesy and geophysics | ||
| • 5,979 total graduates | 60 universities for geophysics | hundreds |
| • 213 geophysics and seismology graduates | 20 universities for geodesy | |
| • 28 surveying engineering graduates | ||
| Photogrammetry | ||
| •28 total graduates, all in surveying engineering | 15 universities | few tens |
| Remote sensing | ||
| • 35,427 total graduates | 63 universities | hundreds to thousandsc |
| Cartographic science | ||
| • 14,779 total graduates | 35 universities | hundreds |
| • 615 geography graduates | ||
| GIS and geospatial analysis | ||
| • 9,917 total graduates | 189 universities | thousands |
| • 5,615 geography graduates | ||
| GEOINT fusion | ||
| 21,656 total graduates | 12 universities | tens to hundreds |
| Crowdsourcing | ||
| 6,469 total graduates | 10 universities | tens to hundreds |
| Human geography | ||
| 155,016 total graduates | 10 universities | tens to hundreds |
| Visual analytics | ||
| 17,678 total graduates | 15 universities | tens to hundreds |
| Forecasting | ||
| 101,121 total graduates | 100 universities | hundreds to thousands |
a See Table C.6, Appendix C.
b See Tables A.1–A.10, Appendix A.
c Based on the number of universities and the membership of ASPRS (7,000).
of university programs (e.g., all emerging areas), the difference in estimates can be several orders of magnitude (Table 4.1). The refined estimate suggests that the number of graduates with expertise in the core and emerging areas ranges from tens (e.g., photogrammetry, crowdsourcing) to thousands (e.g., GIS and geospatial analysis).
Supply of Experienced Individuals
The Bureau of Labor Statistics’ Occupational Employment Statistics program estimates the number of jobs and wages for more than 800 occupations. The number of jobs in a specific occupation is similar to, but not the same as, the number of people employed in that occupation. For example, a person may have more than one job. Thus, these job estimates are not direct estimates of the number of people available in a given occupation. The job and wage estimates are based on a survey of more than a million business establishments in the United States, the District of Columbia, Guam, Puerto Rico, and the U.S. Virgin Islands over a 3-year period. The data do not reflect the self-employed, owners and partners in unincorporated firms, household workers, and unpaid family workers.
The Occupational Employment Statistics program classifies occupations using the Standard Occupational Classification system. The codes and descriptions for the 36 occupations chosen by the committee as most relevant to NGA are given in Table D.1 in Appendix D. Some of the occupations are closely related to the core and emerging areas, such as cartographers and photogrammetrists; surveying and mapping technicians; geographers; and geoscientists, except hydrologists and geographers. The individuals working in these occupations likely have knowledge and skills that would be useful to NGA. However, most occupations are more broadly defined than the core and emerging areas (e.g., computer programmers, computer systems analysts, electrical engineers) and likely include workers with skills and knowledge that are less relevant to NGA.
Table D.2 in Appendix D lists the number of jobs and wages by sector as of May 2010 for NGA-relevant occupations. The data suggest that there are more than 2.7 million jobs in occupations that are potentially relevant to NGA. A relatively modest percentage of these jobs are in the federal sector (8 percent), with the vast majority (77 percent) in the private sector. The federal sector employs more than 50 percent of the nation’s forest and conservation technicians, geographers, and political scientists. The bulk of jobs in the private sector are in computer occupations, with more than half in three occupations: software developers, applications; computer systems analysts; and computer programmers. Occupations that are likely to be particularly relevant to NGA—cartographers and photogrammetrists; surveying and mapping technicians; geographers; and geoscientists, except hydrologists and geographers— represent less than 4 percent of the jobs in NGA-relevant occupations.
For a majority of occupations, the mean annual salary is higher in the federal sector than in the private sector (Table D.2, Appendix D). These data are consistent with a Congressional Budget Office report (CBO, 2012), which found that average wages and benefits are higher for federal workers with bachelor’s and master’s degrees than for private-sector workers. As noted by the Bureau of Labor Statistics, however, these salary differences may be due to factors such as the level of work performed, age and experience, cost of living, establishment size, work schedules, and unionization.3 Given these caveats, the occupations with the most notable differences in salary are astronomers and historians, which have mean annual salaries that are more than 50 percent higher in the federal sector than in the private sector. Pay for mathematical technician occupations is notably lower in the federal sector than in the private sector.
As noted above, former members of the military are a source of employees for NGA. Statistics from the American Community Survey of the U.S. Bureau of Census can be used to estimate the fraction of people in NGA-relevant occupations who are currently serving or have served in the military. The data for 2010 show that current and former military make up approximately 11 percent of employees in NGA-relevant occupations, including 11 percent of surveyors, cartographers, and photogrammetrists; 16 percent of surveying and mapping technicians; 16 percent of miscellaneous social scientists, including survey researchers
__________________
3 Bureau of Labor Statistics, U.S. Department of Labor, Occupational Employment Statistics, Frequently Asked Questions, <http://www.bls.gov/oes/oes_ques.htm>.
and sociologists; and 40 percent of atmospheric and space scientists (Table D.3).
Individuals who are unemployed in NGA-relevant occupations discussed above may also be a viable source of expertise. Information on unemployment by occupation is available from the Bureau of Labor Statistics’ Current Population Survey. Coverage of the survey is limited to the civilian noninstitutional population aged 16 years and older and involves a monthly survey of 60,000 households. The occupation data collected are consistent with the 2000 Standard Occupation Code system but are presented at a higher level of aggregation in some cases.
Table D.4 in Appendix D shows average annual unemployment rates4 for salary and wage workers in NGA-relevant occupations over the 2006–2010 period. The average annual unemployment rate for management, professional, and related occupations as a whole (5 percent for 2010) was included as a benchmark. Two occupations with notably high total unemployment rates for 2010 were surveying and mapping technicians (15 percent) and artists and related workers (14 percent). These two occupations have experienced relatively high unemployment rates since 2006, suggesting that the high rates in 2010 were not due solely to the recent recession.
Occupations with relatively low 2010 unemployment rates include statisticians (<1 percent); urban and regional planners (1 percent); operations research analysts (2 percent); environmental scientists and geoscientists (2 percent); librarians (3 percent); and physical scientists, all other (3 percent). The 2010 unemployment rate for surveyors, cartographers, and photogrammetrists (2 percent) was lower than the management, professional, and related occupations benchmark in 2010, but higher in most other years.
The labor data are subject to some of the same shortcomings as the degree data. In particular, only a few occupations match the core areas and none match the emerging areas. Thus, the 2.7 million jobs in NGA-relevant occupations provide an “upper bound” on the number of experienced workers with some knowledge or skills needed for the core and emerging areas. The actual number is likely considerably lower. A possible “lower bound” is the number of jobs in the four most closely related occupations: cartographers and photogrammetrists (11,670); surveying and mapping technicians (53,870); geographers (1,300); and geoscientists, except hydrologists and geographers (30,830).
The talent pool available to NGA is smaller than the estimates presented above because only U.S. citizens able to obtain a security clearance are eligible for hire. In addition, competition from other organizations, which may offer higher salaries or a better work environment, may reduce the number of highly qualified applicants. For example, new graduates are accustomed to staying connected with their peers, downloading applications, and using any software they wish to carry out tasks on computer platforms and mobile devices. Organizations that do not offer such a flexible, hightech, connected environment, such as government agencies, may not attract the most technically savvy and analytically capable individuals. Moreover, some individuals will not work for the government or for an intelligence agency. It is difficult to quantify reductions in the labor pool associated with the NGA work environment, but data are available to assess reductions associated with the U.S. citizenship requirement, as discussed below.
U.S. Citizenship
The citizenship of new graduates can be inferred from data gathered by the National Center for Education Statistics. Although these data do not distinguish between U.S. citizens and permanent residents, other data sources suggest that the vast majority of degrees conferred to U.S. citizens and permanent residents are conferred to U.S. citizens. In particular, an analysis of the most recent cohort in the Baccalaureate and Beyond Longitudinal Study,5 representing bachelor’s degree recipients during the 2007–2008 academic year, shows that more than 96 percent of degree recipients were U.S. citizens and 3 percent were permanent residents.
__________________
4 The unemployment rate is the number of people who are unemployed (i.e., people without jobs who are looking for work) divided by the number of people in the labor force (i.e., employed people plus unemployed people). See Table D.4 for details on how the unemployment rate is calculated.
5 See <http://nces.ed.gov/surveys/b&b/>.
An analysis of the most recent National Survey of Recent College Graduates,6 representing individuals who earned a bachelor’s or master’s degree in a science, engineering, or health field between July 1, 2005, and June 30, 2007, shows that U.S. citizens received more than 95 percent of bachelor’s degrees and more than 81 percent of master’s degrees. An analysis of the 2009 Survey of Earned Doctorates,7 which captures information on individuals receiving research doctorate degrees from an accredited U.S. institution during the 2009 academic year, shows that 94 percent of degrees conferred to U.S. citizens and permanent residents were conferred to U.S. citizens. In addition, some permanent residents will become eligible for naturalization, and thus for NGA positions, if they have been a permanent resident for at least 5 years.8
The education data show that more than 176,000 bachelor’s degrees and more that 32,000 master’s degrees in fields of study that are highly relevant to the core and emerging areas were conferred to U.S. citizens and permanent residents in 2009 (Table C.7, Appendix C), with annual growth rates of 3.5 percent for bachelor’s degrees and 4.2 percent for master’s degrees over the 2000–2009 period. As illustrated in Figure 4.5, the percentage of these degrees conferred to U.S. citizens and permanent residents was stable over the 2000–2009 period. Approximately 98 percent of bachelor’s degrees and 82 percent of master’s degrees were conferred to U.S. citizens and permanent residents during this period (Table C.8, Appendix C). In contrast, the annual growth rate of doctorate degrees conferred to U.S. citizens and permanent residents over the 2000–2009 period was a modest 0.8 percent, and the fraction of doctorate degrees conferred to U.S. citizens and permanent residents was lower in the second half of the decade. About 72 percent of doctorate degrees went to U.S. citizens and permanent residents in 2000 and 65 percent in 2009. Compared to the average for all core and emerging areas (Figure 4.5), there are notably fewer U.S. citizens and permanent residents in master’s and doctorate programs that are highly relevant to crowdsourcing and in doctorate programs that are highly relevant to geodesy and geophysics (Table C.9, Appendix C). Given that NGA hires individuals mainly at the bachelor’s and master’s levels, the number of U.S. citizens with doctorates may not be important to NGA.
To estimate the citizenship status of individuals already employed in relevant occupations, the committee used data collected in the American Community Survey, an ongoing survey conducted by the U.S. Census Bureau. Specifically, the 2005–2009 Public Use Microdata Sample Files were used to estimate the fraction of the workforce in NGA-relevant occupations that were U.S. citizens. The data show that at least 75 percent of employees in NGA-relevant occupations were U.S. citizens; in most of these occupations, more than 90 percent of employees were U.S. citizens (see Table D.5, Appendix D). In 2009, the occupations with the highest fraction of U.S. citizens were librarians (98 percent); surveying and mapping technicians (97 percent); statistical assistants (97 percent); aerospace engineers (97 percent); urban and regional planners (97 percent); and surveyors, cartographers, and photogrammetrists (96 percent). Occupations with the lowest fraction of U.S. citizens were physical scientists, all other (76 percent); computer software engineers (80 percent); and astronomers and physicists (86 percent).
Overall, the education and census data suggest that NGA’s U.S. citizenship requirement does not dramatically reduce the “upper-bound” pool of qualified new graduates or experienced employees. When citizenship is factored in, the number of new graduates at all levels decreases by 7 percent to 214,870, and the number of experienced workers decreases by 12 percent to 2,417,964.
ANTICIPATED AVAILABILITY OF EXPERTS
Estimating the future availability of expertise in any field is inherently difficult and the estimates are subject to large uncertainties that grow with the projection horizon. The Bureau of Labor Statistics makes 10-year employment projections, but the projections reflect the anticipated demand for workers, not the supply of workers, in a given occupation.9 Accurate forecasts of the number of graduates can be made for
__________________
6 See <http://www.nsf.gov/statistics/srvyrecentgrads>.
7 See <http://www.nsf.gov/statistics/srvydoctorates/>.
8 U.S. Citizenship and Immigration Services, A Guide to Naturalization, Chapter 4: Who is eligible for naturalization?, p.18, <http://www.uscis.gov/portal/site/uscis>.
9 See Bureau of Labor Statistics Employment Projections Program, <http://www.bls.gov/emp/>.
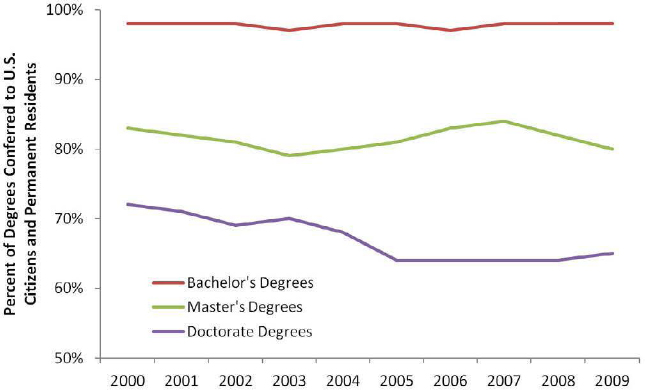
FIGURE 4.5 Percent of degrees conferred by year to U.S. citizens and permanent residents across fields of study that are highly relevant to the core and emerging areas. SOURCE: Data from the U.S. Department of Education, National Center for Education Statistics’ Integrated Postsecondary Education Data System Completions Survey. Accessed via WebCASPAR.
a few years into the future because the future graduates are already attending classes and attrition rates are reasonably well known (NRC, 2000). As the projection horizon lengthens, however, the projections become less reliable as a result of (a) misspecification of models, (b) data that are flawed or aggregated at an inappropriate level, and/or (c) unanticipated events. For example, the profound effect of the September 11, 2001, terrorist attacks on scientific labor markets would have been difficult to incorporate into any forecasting model. Future labor markets depend on the paths of multiple variables, including some that are well understood (e.g., the age structure of the population) and others that are unpredictable (e.g., the career preferences of future college students, future technology changes that will affect the demand for talent, immigration policies). Given the uncertainties in labor forecast models as well as the resource constraints of an NRC study, the committee chose to estimate the future availability of geospatial intelligence expertise by simply extrapolating recent trends in the number of graduates in relevant fields of study, as described below.
Supply Oudook
The future supply of geospatial intelligence expertise depends primarily on the number of people graduating with degrees in relevant fields of study. The committee projected the future supply of new graduates by extrapolating trends in the number of degrees conferred to U.S. citizens and permanent residents over the past decade to 2030. In its projections, the committee assumed that the annual growth rates in degrees conferred observed over the 2000–2009 period (i.e., 3.5 percent per year for bachelor’s degrees, 4.2 percent per year for master’s degrees, and 0.8 percent per year for doctorate degrees) will continue. Based on this assumption, the number of bachelor’s degrees conferred in geospatial intelligence-related programs would be expected to climb to 367,000 by 2030, the number of
master’s degrees conferred would be expected to exceed 75,000, and the number of doctorate degrees conferred would be expected to rise to 6,000 (left column of Table 4.2).
TABLE 4.2 Projected Number of Degrees in Geospatial Intelligence-Related Fields of Study Conferred to U.S. Citizens and Permanent Residents in 2030
| Scenario | |||
| Degree Level | Reference | High Growth | Low Growth |
| Bachelor’s degrees | 367,000 | 525,000 | 256,000 |
| Master’s degrees | 77,000 | 117,000 | 50,000 |
| Doctorate degrees | 6,000 | 7,000 | 6,000 |
| TOTAL | 451,000 | 648,000 | 312,000 |
NOTE: Results are rounded to the nearest thousand. The projections were made using the standard future value formula (Brealey and Myers, 1996): beginning value × (1+g)N, where beginning value is the number of degrees conferred in 2009, g is the observed annual growth rate of degrees conferred over the 2000–2009 period, and N is the number of years that will elapse between the beginning value year and the projection year (21 years).
SOURCE: Projections were made based on data from the U.S. Department of Education, National Center for Education Statistics’ Integrated Postsecondary Education Data System Completions Survey. Accessed via WebCASPAR.
To illustrate the uncertainty associated with these forecasts, the committee extrapolated the number of new graduates under a high-growth scenario (50 percent higher than the growth rate observed for 2000–2009) and a low-growth scenario (50 percent lower than the observed growth rate). The results of these three scenarios are presented in Table 4.2 and illustrated in Figure 4.6. The number of degrees projected to be conferred in 2030 to U.S. citizens and permanent residents in geospatial intelligence-related fields of study ranges from 312,000 to 648,000. However, the actual values could be higher or lower, especially if any large shocks in the labor market occur over the next 20 years (e.g., NRC, 2000).
The projections presented above are based on trends in the total number of graduates with degrees that are highly relevant to the core and emerging areas. Only a small fraction of these graduates will have the combination of knowledge and skills suited for a science or analysis position at NGA. Thus, the projections are an “upper bound” on the future availability of expertise in geospatial intelligence.
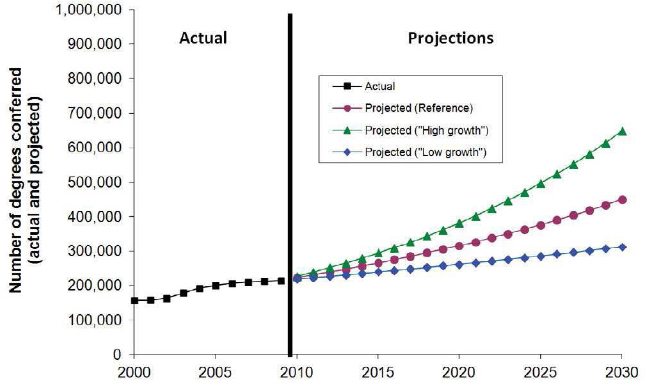
FIGURE 4.6 Observations (2000–2009) and extrapolations (2010–2030) of the number of degrees conferred to U.S. citizens and permanent residents by year across highly relevant geospatial intelligence-related fields of study. SOURCE: Data for 2000–2009 are from the U.S. Department of Education, National Center for Education Statistics’ Integrated Postsecondary Education Data System Completions Survey. Accessed via WebCASPAR.
The committee’s best estimate of the current number of experts (Table 4.1), which is considerably lower than the total number of graduates, does not lend itself to extrapolation because the numbers are difficult to aggregate and previous growth rates cannot be estimated with any certainty. However, based on the evolution of the core and emerging areas (Chapters 2 and 3), it is likely that the number of graduates in cartography and photogrammetry will decline and that the number of graduates in other areas, especially the emerging areas, will grow over the next 20 years. Thus, although the exact number cannot be projected with high confidence, it is likely that the supply of graduates in all geospatial intelligence-related fields of study except photogrammetry and cartography will be robust for the next 20 years.
The first task of the committee was to estimate the number of experts in the core and emerging areas now and over the next 20 years. The primary sources of expertise are new graduates in relevant fields of study, which are tracked by the Department of Education, and employees working in occupations that require relevant knowledge and skills, which are tracked by the Bureau of Labor Statistics. Unfortunately these data are not ideal for addressing the task because the core and emerging areas are embedded within or span multiple fields of study or occupations; 109 fields of study and 36 occupations potentially provide some knowledge and skills relevant to a core or emerging area.
An “upper bound” on the number of experts was determined by summing the number of new graduates from all relevant fields of study and the number of workers from all relevant occupations. This calculation showed that there were more than 229,000 degrees conferred in the 109 instructional programs in 2009 and more than 2.7 million jobs in the 36 occupations in 2010, the latest years for which data were available when the report was being written. NGA’s requirement for U.S. citizenship decreases the size of the labor pool by 7 percent for new graduates, with the largest reductions at the doctorate level, and by 12 percent for experienced workers, with the largest reductions in physical science and computer occupations. Accounting for U.S. citizenship reduces the estimate to more than 200,000 new graduates in relevant instructional program in 2009 and more than 2.4 million jobs in relevant occupations. These graduates and experienced workers likely have some knowledge and skills in a core or emerging area and could potentially be trained for an NGA position.
The actual number of graduates with expertise in a core or emerging area is likely considerably lower than the “upper-bound” estimates, especially for the emerging areas, which are taught as comprehensive programs in only a handful of universities. Factoring in other information—including the number of universities offering programs in a core or emerging area, the size of the professional community, and the number of graduates from instructional programs that produce the bulk of necessary skills—allows a qualitative estimate to be made based on expert judgment. The committee’s best estimate is that the current number of new graduates in geospatial intelligence areas is likely on the order of tens for photogrammetry; tens to hundreds for GEOINT fusion, crowdsourcing, human geography, and visual analytics; hundreds for geodesy, geophysics, and cartographic science; hundreds to thousands for remote sensing and forecasting; and thousands for GIS and geospatial analysis.
Insufficient information was available to refine the number of experienced workers. A “lower bound” was estimated by summing the number of jobs in the four most closely related occupations: cartographers and photogrammetrists; surveying and mapping technicians; geographers; and geoscientists, except hydrologists and geographers. For these four occupations, there were nearly 100,000 jobs in 2010.
Estimates of the future availability of experts are subject to large uncertainties, so the committee simply extrapolated past trends of the number of new graduates with relevant degrees. Extrapolation of 10-year trends under high-growth and low-growth scenarios suggests that 312,000–648,000 degrees in relevant fields of study will be conferred to U.S. citizens and permanent residents in 2030. These figures place an “upper bound” on the future number of graduates in geospatial intelligence-related fields of study. The committee’s best estimate of the current number of graduates with skills and knowledge in core and emerging areas is qualitative and could not be projected with confidence. However, it is substantially lower than the
total number of graduates in relevant fields of study and thus would yield substantially lower projections. Based on how the core and emerging areas have evolved over the past few decades, it is likely that the number of graduates will rise in all areas except photogrammetry and cartography over the next 20 years.
Based on the education and labor analysis, the answer to Task 1 is that the current number of U.S. citizens and permanent residents with education is likely on the order of tens for photogrammetry; tens to hundreds for GEOINT fusion, crowdsourcing, human geography, and visual analytics; hundreds for geodesy, geophysics, and cartographic science; hundreds to thousands for remote sensing and forecasting; and thousands for GIS and geospatial analysis. In addition, U.S. citizens currently hold more than 100,000 jobs in occupations closely related to the core areas. If substantial on-the-job training is an option for NGA, the current labor pool increases to 200,000 new graduates and 2.4 million experienced workers. If 10-year growth trends in the “upper-bound” estimate continue, the number of new graduates could reach 312,000–649,000 by 2030.


