
The Committee’s Evaluation of the DOD Consultant’s Report
The Committee on Energy-Efficiency and Sustainability Standards Used by the Department of Defense for Military Construction and Repair was tasked to evaluate a report produced by a Department of Defense (DOD) consultant under a separate contract. The consultant’s report, Cost-Effectiveness Study of Various Sustainable Building Standards in Response to NDAA 2012 Section 2830 Requirements (Slaughter, 2012; reprinted in Appendix C), analyzed the benefit-cost, return on investment, and long-term payback of American Society of Heating, Refrigerating and Air-Conditioning Engineers (ASHRAE) standards 90.1-2010 and 189.1-2011 and of the Leadership in Energy and Environmental Design (LEED) and Green Globes green building certification systems. The report also identified issues that might arise if the same analytical approach were applied in the DOD operating environment and provided recommendations to DOD regarding considerations for development of its comprehensive strategy.
As noted in Chapter 1, the committee reviewed a paper outlining the DOD consultant’s proposed analytical approach prior to the committee’s first meeting. The committee provided its comments to the consultant in open session at the first meeting regarding changes that the consultant should consider incorporating into the approach before embarking on data collection.
At its second meeting, the committee was briefed on the consultant’s final methodology, analysis, and findings. The committee later received the consultant’s final report for an in-depth evaluation. The consultant’s final report as it was presented to the committee is contained in Appendix C.
To provide context for the consultant’s analytical approach and the committee’s evaluation of that approach, Chapter 3 first describes closely related methods and measures for assessing the economic performance of buildings. Although the terms are sometimes used interchangeably in informal discussions, there are salient differences among the methods and measures that bear on their correct application and interpretation for evaluating DOD construction and renovation decisions. A discussion on issues related to the actual measurement of building performance in terms of energy, water, indoor environmental quality, and other factors follows. The remaining sections of this chapter describe the DOD consultant’s analytical approach for determining the cost-effectiveness of the relevant building standards and green building certification systems. This chapter concludes with the committee’s evaluation of the consultant’s
methodology, analysis, and issues related to the potential application of the analytical approach in the DOD operating environment.
DEFINITION AND USE OF SELECTED ECONOMIC PERFORMANCE METHODS AND MEASURES
Life-Cycle Cost Analysis (LCCA), Cost-Effectiveness Analysis (CEA), and Benefit-Cost Analysis (BCA) are three methods for measuring the economic performance of buildings.1 The definitions and appropriate use of those analytical methods are described below.
Life-Cycle Cost Analysis
LCCA takes into account all costs associated with a structure, system, or component over its defined life cycle or over the specific time horizon of the decision maker. Life-cycle costs (LCC) typically include those incurred during the acquisition phase, utilization phase, and disposal phase. The acquisition phase may include such costs as those for research and development, conceptual design, detailed design and development, construction and/or production, and installation. The utilization phase may include costs of energy and other resources and labor costs for operation, maintenance, repair, and replacements. The disposal phase may include demolition costs incurred at the end of the life cycle or end of the user’s time horizon and may also entail positive resale, recycle, or scrap value, which is treated as a negative cost in the LCCA formulation.
LCCA is an appropriate method for selecting among possible alternatives that all meet performance requirements and differ primarily in their life-cycle costs. Other factors being the same, the alternative with the lowest LCC is the preferred choice. The purpose of LCCA is to base the choice among mutually exclusive alternatives on a broader, longer-term view of costs, rather than on first costs alone (such as acquisition, design, and construction costs). The analysis brings costs of each of the alternatives to a net present value (NPV) to allow the alternatives to be compared on a common basis. (If benefits also differ somewhat among alternatives, these can be incorporated as negative costs in the LCCA formulation, or a subjective trade-off can be made among alternatives, taking into account both their comparative life-cycle costs and their performance differences.) ASTM International (formerly known as the American Society for Testing and Materials) has developed a Standard Practice for Measuring Life-Cycle Costs of Buildings and Building Systems (ASTM E917-05, 2010).
The U.S. Office of Management and Budget (OMB) prescribes discount rates for use in performing both cost-effectiveness analysis and benefit-cost analysis of federal investments: real discount rates for federal CEA—and, therefore, LCCA—vary by time period, and the rate for a 30-year time horizon is currently 2.0 percent. 2
Cost-Effectiveness Analysis
CEA encompasses LCCA, but is somewhat broader in scope. It is an approach for comparing alternatives that meet or exceed the desired level of performance or benefits and differ primarily in their comparative costs. CEA can be used to compare alternatives that differ in both their cost and performance
_________________
1 Life-Cycle Assessment is an analytical method for measuring the environmental impacts of buildings. Although important, it is not part of this study or the DOD consultant’s report because Section 2830 of the National Defense Authorization Act of 2012 and the statement of task specifically focused on economic/financial measures.
2 Federal discount rates are available at http://www.whitehouse.gov/omb/circulars_a094/a94_appx-c.
to ensure that additions to costs are economically worthwhile. For example, the choice among alternative designs that vary in cost and also are associated with differing morbidity incidence rates might be assisted by computing not only the LCCs of the alternatives, but also the incremental cost of achieving improved health outcomes.
Benefit-Cost Analysis
BCA is an approach most often used to determine if a government program or investment can be justified on economic grounds. It entails assigning monetary values to societal benefits and costs from the program/investment and assessing direct program/investment costs, all over a specified time horizon, and finding the difference between benefits and costs as NPV benefits. A positive NPV (greater than 1) means that total benefits exceed total costs, and the program or other investment is cost-effective.
BCA can also be used to make mutually exclusive choices among building and facilities design, systems, and components. In this application, the choice with the highest NPV is preferred on economic grounds. Related, additional economic performance measures can be computed from the time-denominated cash flows of benefits and costs of BCA. These include benefit-cost ratios, internal rates of return on investment, and the closely related concept of adjusted internal rates of return on investment. ASTM International has developed the standard practices Measuring Benefit to Cost and Savings to Investment Ratios for Buildings and Building Systems (E964-06, 2010) and Measuring Internal Rate of Return and Adjusted Internal Rate of Return for Investments in Buildings and Building Systems (E1057-06, 2010).
Caution is advised, however, in using the measures of benefit-cost ratios and rates of return measures computed on total benefits and costs for choosing among mutually exclusive alternatives. The problem is that ratios and the rates of return based on total benefits and costs begin to fall before the optimal choice is found. To avoid this problem, ratio and rate of return measures should be applied incrementally when used to guide selection among mutually exclusive choices. If the incremental ratio is greater than 1 or the incremental rate of return is greater than the minimum required rate of return (as indicated in federal analysis by the OMB-specified discount rate), moving to that increment is deemed cost-effective.
Choosing among LCCA, CEA, and BCA
Making mutually exclusive choices among alternatives with similar benefits—such as the design or choice of systems or components for a given building or facility—is usually conducted with LCCA and CEA, using the associated federally prescribed discount rates. In contrast, assessing whether a given government program or investment has been worthwhile or is projected to be worthwhile is usually conducted with BCA, using its associated federally prescribed discount rate. In cases where the analysis of building systems and facilities has been expanded to include multiple categories of benefits, in addition to costs, the BCA approach may be required, but it should be used in the mode of comparing alternatives, with use of the CEA-appropriate federal discount rate. In addition, care must be taken to apply ratio and rate of return metrics incrementally when used for choosing among alternative building/facilities designs, systems, and components.
Payback
Section 2830 of the National Defense Authorization Act of 2012 (NDAA 2012) and the committee’s statement of task require the calculation of payback.3 Simple payback is the time period at which initial
_________________
3 Although payback and internal rate of return are sometimes used interchangeably, the terms and their purposes are very different.
investment (the incremental cost) is recovered, ignoring the time value of money. Discounted payback is the time period at which initial investment is recovered, taking into account the time value of money. Neither simple nor discounted payback includes future savings that may occur after the initial investment is recovered. Payback measures are not appropriate for comparing the long-term economic effectiveness of buildings or projects, because the alternative with the shortest payback period may not be the alternative with the greatest NPV benefits or return on investment. ASTM International has also developed the standard practice Measuring Payback in Investments in Buildings and Building Systems (E1074-09).
ISSUES RELATED TO THE MEASUREMENT OF BUILDING PERFORMANCE
The actual measurement of the multiple factors that affect building performance and cost is not straightforward. Measurement issues include those related to quantitative and qualitative factors, the establishment of baselines, and the use of measured or modeled data, as described below.
Quantitative and Qualitative Measurement
There are multiple benefits and costs associated with high-performance or green buildings that can be measured in various ways. Typically, it is easiest, and most objective, to measure quantitatively direct resources such as energy and water. Meters can measure the amounts of energy and water used, and utility bills can provide cost information. In the case of energy, however, the results will depend on whether site or source energy is being measured: site energy is energy measured at the meter, whereas source energy includes both onsite energy and offsite energy losses associated with the generation and distribution of energy. The distinction between site energy and source energy is significant, and the choice to measure one or the other can lead to very different findings.
Quantifying benefits can also be complicated by the fact that facility investments generate both direct and indirect benefits and costs. The direct costs of high-performance or green buildings are borne by building developers and owners, who also may receive the direct benefits of their investments. Indirect benefits accrue to building occupants, to the surrounding community, and to society at large, although those groups may not directly contribute to the costs. Providers of displaced building technologies and systems may experience indirect cost in terms of loss of sales. A federal benefit-cost analysis typically takes a broad perspective, including both direct and indirect effects.
Baselines
Baselines for measuring “whole building performance” are not available and would be difficult to develop because of the uniqueness inherent in every building. As a consequence, measuring differences between high-performance or green buildings and conventional buildings is problematic. The most objective way to conduct comparison studies is to use a reference (prototype) building and then measure the incremental costs and benefits associated with the green alternatives. This type of baseline development is used in the DOD consultant’s study evaluated later in this chapter.
Many building energy-related studies rely on the database and characteristics of the national building stock produced through the Commercial Buildings Energy Consumption Survey (CBECS). CBECS is the only national data source of detailed characteristics and energy use of U.S. commercial buildings. It is cited in the definition for federal high-performance buildings as a baseline for comparative studies.
However, there are deficiencies in the CBECS data that should be taken into account when generalizing the findings of studies using CBECS data. The 2012 National Research Council study Effective
Tracking of Building Energy Use: Improving the Commercial Buildings and Residential Energy Consumption Surveys found that the two priority concerns for researchers using this database are timeliness and frequency of the data and gaps in the data. The authors of the CBECS-related study concluded that the frequency of the survey does not meet data users’ needs well, and the amount of time it takes to collect, process, and release the data collected by the surveys is too long. More importantly, “the sample sizes are too small to produce data that meet quality and confidentiality thresholds” (NRC, 2012, p. 2). In addition,
The current CBECS sample design is best suited for producing descriptive statistics for larger geographical divisions, such as the entire country or census division levels. The relatively small sample sizes, in combination with strict quality control and confidentiality protections, severely limit the amount of data that can be released from the survey. This in turn limits, in terms of both geography and complexity, the analyses that can be conducted based on the data” (NRC, 2012, p. 3).
There are no national databases for water use in buildings or for operations and maintenance costs. Studies that look at those factors typically develop baselines from a variety of industry publications, including publications by the Building Owners and Managers Association and the International Facility Management Association.
Measured Data Versus Modeled Data for Energy and Water Use
All building standards and green building certification systems require that a building design meet or surpass an energy efficiency standard. In the case of LEED, Green Globes, and ASHRAE 189.1, this standard is ASHRAE/IESNA 90.1.
An energy model created to be compared with the ASHRAE/IESNA 90.1 standard necessarily underestimates the energy use and the energy cost of the building once it is constructed and in operation. There are two primary reasons for this. First, the energy model that embodies the ASHRAE standard assumes perfection in manufacturing, installation, and operation. The assumption of perfection is necessary. For instance, the standard can require a certain insulation level, but it cannot control for installation problems, such as rips and compression due to piping. The standard can require a certain chiller efficiency, but the standard cannot control for suboptimal installation or for suboptimal operation. Since the energy model for the ASHRAE standard assumes perfection, the energy model for the proposed design also must assume perfection for the comparison to be useful.
Second, certain heat losses are not included in the ASHRAE 90.1 calculations, because at this time they are too difficult to calculate by most practitioners. Therefore these effects are not included in the design calculations. For instance, the three-dimensional heat loss effect that occurs at the intersection between slab edge and wall creates a significant heat loss that is not captured by either the ASHRAE standard or by the design model.
The same types of issues that are relevant for modeled and measured energy use also apply to modeled and measured water use.
DESCRIPTION OF THE DOD CONSULTANT’S ANALYTICAL APPROACH
For the Cost-Effectiveness Study report (Slaughter, 2012), the DOD consultant developed an analytical approach composed of the following elements:
- A traditional benefit-cost analysis to calculate long-term benefits and costs (expressed as net present value savings), adjusted rate of return on investment, and payback of ASHRAE stan-
-
dards 90.1-2010 and 189.1-2011 and of the LEED and Green Globes green building certification systems. The analyses were conducted for two different building prototypes and five different geographic locations and climate zones.
- Sensitivity analyses to assess the long-term benefits and costs of the same ASHRAE standards and green building certification systems for a range of scenarios that represented uncertainty in future conditions. The scenarios differed in terms of discount rates, time periods, and escalation rates for energy and water costs.
The DOD consultant also conducted a test of the analytical approach, working with staff from DOD headquarters and military installations and using data from DOD buildings. The purpose was to identify issues that might arise if the approach were to be applied in the DOD operating environment.
More detailed information about the analytical approach used to determine the cost-effectiveness of the building standards and green building certification systems, as well as issues related to the application of that approach in the DOD operating environment follows. The page numbers in parentheses refer to the DOD consultant’s report (Slaughter, 2012), which is reprinted in Appendix C.
Traditional Benefit-Cost Analysis of ASHRAE Standards and Green Building Certification Systems
To analyze the benefits and costs (in terms of NPV benefits) that would result from the use of ASHRAE Standards 90.1-2010 and 189.1-2011 and the LEED and Green Globes certification systems, the DOD consultant first created baseline models. The models provided a baseline against which to compare the relative incremental benefits and costs of the standards and green building certification systems. The consultant then collected data for the incremental benefits and costs associated with the ASHRAE standards, LEED, and Green Globes and compared those to the prototype baselines. Three categories of costs were analyzed: investment costs (incremental cost for constructing the building in addition to major repair/replacement costs), energy costs, and water costs.4
Creating the Baselines
To establish a common basis for calculating NPV benefits for the ASHRAE standards and the green building certification systems, the consultant used two building prototype models from a protocol developed by the Department of Energy (DOE) (Deru et al., 2011). The base models chosen were the “medium office” and “small hotel” models, which are commonly built by commercial firms. The prototypes also roughly correspond to DOD administrative buildings and its barracks and military dormitories, respectively, which was an important factor in testing the application of the analytical approach in the DOD operating environment.
The characteristics of the medium office prototype are shown in Figure 3.1 and Table 3.1. The characteristics of the small hotel prototype are shown in Figure 3.2 and Table 3.2.
To help determine the cost-effectiveness of the ASHRAE standards, LEED, and Green Globes under different geographic and climatic conditions, the DOD consultant analyzed the two prototype buildings in five geographic regions and climate zones across the continental United States: Miami, Florida; Phoenix, Arizona; Memphis, Tennessee; Baltimore, Maryland; and Helena, Montana (shown in Figure 3.3 and described in Table 3.3). The locations were chosen to represent the heating and cooling loads and local
_________________
4 The consultant attempted to collect data for several additional categories—operations and maintenance costs, solid waste disposal costs, hazardous waste disposal costs, and landscaping/maintenance—but was unable to do so within the given time frame.
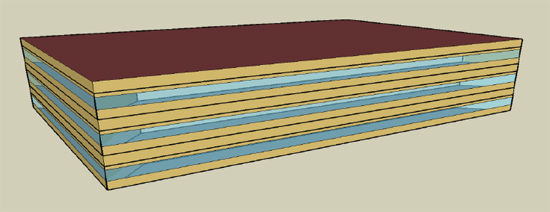
FIGURE 3.1 Axonometric view of medium office prototype. SOURCE: Thornton et al. (2011).
TABLE 3.1 Building Details for Medium Office Prototype
| Building | Medium Office |
| Form | |
| Total floor area (sq. feet) | 53,600 ft2 (163.8’ × 109.2’) |
| Aspect ratio | 1.5 |
| Number of floors | 3 |
| Window fraction | (Window dimensions: 163.8 ft × 4.29 ft on the long side of façade, |
| (wall-to-wall ratio) | 109.2 ft × 4.29 ft on the short side of the façade), Average Total: 33% |
| Window locations | Window ribbons: 4.29 ft high, around building perimeter each floor |
| Floor to floor height (feet) | 13’ |
| Details | |
| Occupancy | 268 people |
| Orientation | Long axis orientation East/West |
| Requirements: | |
| Parking area | 86,832.00 ft2 |
| Exterior doors | 5.36 ft2 |
| Façade | 4,154.00 ft2 |
| Architecture-Fixed across all prototypes | |
| Superstructure | (Not specified) Structural steel frame |
| Substructure | (Not specified) Column footings, strip footings for slab |
| Floor deck | (Not specified) Sheet metal decking, topping slab |
| Orientation | Long axis orientation East/West |
| Fuel mix | Gas, electricity |
| Foundation slab | 8” concrete slab |
| Interior partitions | 2×4 stud (nonloadbearing, uninsulated) |
| Plug load | 0.75 W/ft2 (guestrooms) |
| Elevator | 2 hydraulic (16,055 W) |
| Building | Medium Office |
| Change by location, certification level | |
| Windows | Window ribbons—4.29 ft high, around building perimeter each floor |
| Skylight | None |
| Ceiling | 4” plenum |
| HVAC | Gas furnace with packaged AC, VAV with electric heat coil |
| Hot water | Natural gas, 260 gal tank |
| Lighting | 1 W/ft2 (guestrooms) |
| Exterior lighting | 14,385 W |
| Flooring | Carpet |
| Interior finishes | (Not specified) |
| Exterior walls | Steel frame (2×4 16” o.c), 4” stucco, 5/8” gypsum board, insulation, 5/8” gypsum |
| Roof | Membrane, insulation, metal decking |
| Floor slab | (Not specified) Insulation |
| SOURCE: Thornton et al. (2011); see Slaughter (2012, p. 161). | |
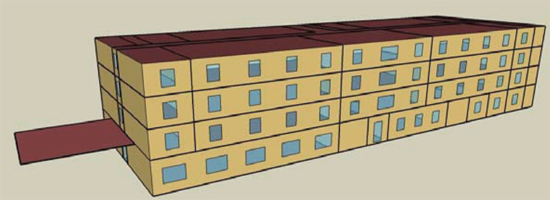
FIGURE 3.2 Axonometric view of small hotel prototype. SOURCE: Thornton et al. (2011).
TABLE 3.2 Building Details for Small Hotel Prototype
| Building | Small Hotel |
| Form | |
| Total floor area (sq. feet) | 43,200 ft2 (180’ x 60’) |
| Aspect ratio | 3 |
| Number of floors | 4 |
| Window fraction (wall-to-wall ratio) | South: 3.1%, East: 11.4%, North: 4.0%, West: 15.2%, Average Total: 10.9% |
| Window locations | One per guest room (4’ x 5’) |
| Floor to floor height (feet) | Ground floor: 13 ft; Upper floors: 9 ft |
| Building | Small Hotel |
| Details | |
| Occupancy | 259 people |
| Orientation | Long axis orientation North/South |
| Requirements: | |
| Parking area | 33,680 ft2 |
| Exterior doors | 31.22 ft2 |
| Façade | 3,819 ft2 |
| Architecture—Fixed across all prototypes | |
| Superstructure | (Not specified) Structural steel frame |
| Substructure | (Not specified) Column footings, strip footings for slab |
| Floor deck | (Not specified) Sheet metal decking, topping slab |
| Orientation | Long axis orientation North/South |
| Fuel mix | Gas, electricity |
| Foundation slab | 6” concrete slab |
| Interior partitions | 2×4 stud (nonloadbearing, uninsulated) |
| Plug load | 1.11 W/ft2 (guestrooms) |
| Elevator | 2 hydraulic (16.055 W) |
| Change by location, certification level | |
| Windows | 4’ x 5’ (1 per guestroom) |
| Skylight | None |
| Ceiling | No plenum |
| HVAC | PTAC (packaged terminal air conditioner) with electric resistance heating in each guestroom; gas furnace with packaged AC (split system with DX cooling) for public spaces; electric cabinet heaters for storage areas and stairs |
| Hot water | 2 natural gas (200 gal tank for guestrooms, 100 gal tank for laundry) |
| Lighting | 1.11 W/ft2 (guestrooms) |
| Exterior lighting | 13.030 W |
| Flooring | Carpet |
| Interior finishes | (Not specified) |
| Exterior walls | Steel frame (2×4 16” o.c.) 1” stucco, 5/8” gypsum board, insulation, 5/8” gypsum |
| Roof | Membrane, insulation, metal decking |
| Floor slab | (Not specified) Insulation |
| SOURCE: Thornton et al. (2011); see Slaughter (2012, p. 160). | |
factor prices that influence economic efficiency calculations (p. 95). DOD has large installations in each of the five geographic areas and climate zones chosen for analysis.
To establish a baseline for each of the building prototypes in each location, costs were calculated as follows:
- Construction costs for the baseline buildings were calculated using industry averages as published in RS Means Square Foot Calculator for April 2012 (p. 111).
- Energy use (quantities of building and site energy used) for each building prototype was generated using EnergyPlus software following ASHRAE 90.1-2004 (p. 111). Unit costs for electricity and natural gas were based on monthly statistics published by the DOE’s Energy Information Administration (EIA). Total energy costs were calculated by multiplying the quantities by the unit costs (p. 112).
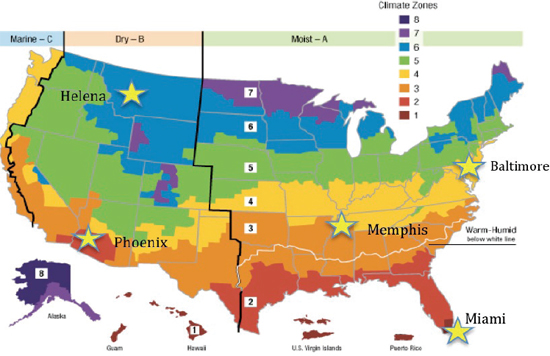
FIGURE 3.3 U.S. climate zone map developed by the Department of Energy.
TABLE 3.3 Selected Locations as Characterized by the Department of Defense Consultant
| Location | Climate Zone | Region | Climate Temperature | Climate Humidity | Market Type |
| Miami | 1 | Southeast | Hot | Wet | Large urban |
| Phoenix | 2 | Southwest | Hot | Dry | Medium urban |
| Memphis | 3 | Central | Medium | Medium | Medium urban |
| Baltimore | 4 | Northeast/Mid-Atlantic | Medium | Wet | Large urban |
| Helena | 6 | Northwest | Cool | Dry | Small urban/rural |
SOURCE: Slaughter (2012), p. 109.
- Water use (quantities) was based on current usage rates as repnorted by industry sources (p. 111). Local unit costs for water supply were based on public data sources, including municipal agencies and publications (p. 111). Total water costs were calculated by multiplying the quantities by the local unit costs (p. 112).
For the benefit-cost analysis of the ASHRAE standards and the green building certification systems the following factors were used:
• Discount rate: 2 percent (consistent with OMB guidance for fiscal year 2013).
• Time period: 40 years (consistent with the Energy Independence and Security Act of 2007).
• Price escalation rates:
— Energy price escalation rate (eE): 0.5 percent per year.
— Water price escalation rate (eW): 2.0 percent per year (p. 104).
The consultant based the energy price escalation rates on the rates reported annually by DOE’s EIA. Energy escalation rates were calculated using an annual equivalent escalation rate. The consultant based the water price escalation rate on an analysis of the Consumer Price Index, which uses 1982-1984 as the base time period. The consultant calculated that the national average increase for water and sewer prices had been approximately 5 percent per year. The DOD consultant’s study used an annual escalation rate of 2 percent, which was characterized as conservative, as an estimate of expected water price increases.
Data Sources for the Calculation of NPV Benefits
The data required to calculate the incremental benefits and costs that would be realized by use of the ASHRAE standards, LEED, and Green Globes, in comparison to the baseline prototypes, came from several sources. Data on energy use and water use were provided by representatives of ASHRAE, the USGBC, and the GBI. Investment/construction costs were calculated by the consultant using (1) R.S. Means data for the total construction cost of the prototypical, baseline buildings and (2) total construction costs for actual buildings, provided by the USGBC and the GBI for a sample of their projects. The USGBC and GBI data, like the R.S. Means data, referred to the total construction costs of buildings. Because those cost data did not refer solely to incremental costs specific to energy-saving or water-saving building features, the consultant’s calculation of cost differences between the baseline prototypes and the LEED-certified and Green Globes-certified projects probably include costs that are not related to energy, water, or other green systems.
For the analysis of the ASHRAE standards, the ASHRAE staff provided energy use information for both building prototypes in all five locations. Water use data were also provided for ASHRAE 189.1-2011. The data submitted by ASHRAE in all cases were generated from building models, because buildings have yet to be constructed and operated to standards 90.1-2010 or 189.1-2011. Thus, the same data were used in the DOD consultant’s analysis of NPV benefits as were used in the development of the standards.
To calculate incremental construction costs for ASHRAE Standard 189.1-2011, which requires onsite energy generation, the consultant included incremental costs for energy generation units in the construction cost, and the onsite energy was used to offset the energy used by the building (p. 114).
For the analysis of both green building certification systems, the data for energy and water use were obtained from actual buildings certified under those systems. Energy use and water use data for 25 LEED-certified buildings were provided by the USGBC staff. The GBI staff provided energy use and water use data for 11 Green Globes-certified buildings. The LEED sample included buildings certified at the Certified, Silver, Gold, and Platinum levels (p. 116). The Green Globes sample included buildings certified at one, two, three, and four green globes (p. 117).
The data for incremental construction costs for both samples were estimated by the consultant using a variety of sources, because applications for certification by LEED and Green Globes do not require the owner or developer to include incremental construction costs.
For the benefit-cost analysis of the LEED certification system, the consultant worked with staff from the USGBC to obtain incremental construction cost data for 20 projects. Incremental construction cost data for five additional LEED-certified buildings were estimated by the consultant based on public data sources (including press releases, articles, and other public data sources) (p. 114).
The incremental construction costs for the buildings in the LEED and Green Globes samples were in many cases assumed to include all project costs, specifically construction costs plus related architect, engineering, and construction management fees. The consultant stated that those fees often average 35 percent of the total project costs according to R.S. Means and other industry sources. Therefore, for the analysis, the consultant reduced total project costs for the LEED and Green Globes buildings by 35 percent to exclude those fees (p. 115). The consultant also noted that insufficient data were provided to identify any particular technical cost drivers (such as unusual site conditions, structural requirements, or special equipment) or other factors that influence construction costs (such as local market conditions) independent of expected performance levels.
In summary, for the analyses of energy use and water use related to the ASHRAE standards, the consultant used data from building models that were similar to the prototype buildings (medium office and small hotel), not data from actual buildings. For the LEED and Green Globes analyses of energy use and water use, data from actual buildings were available, and those actual buildings were similar in function to the prototype buildings (medium office and small hotel).
Data for incremental construction costs were not available for the 25 LEED buildings or for the 11 Green Globes buildings that were analyzed. Instead, the consultant compared the total actual construction cost of those buildings against the total construction cost for the prototypes, which was calculated from R.S. Means square foot data (after adjusting for design/management fees).
Sensitivity Analysis for Uncertain Future Conditions
The second element of the consultant’s analytical approach were sensitivity analyses to calculate NPV benefits of the ASHRAE standards, LEED, and Green Globes for a range of scenarios that represent uncertain future conditions. For the different scenarios, the discount rate, time period, and price escalation rates for energy and water costs were varied to create a range of NPV benefits.
As noted by the consultant, traditional calculations of NPV benefits provide a single point estimate given specific input variables (i.e., time period, discount rate, and escalation rates). The sensitivity analyses provided upper and lower bounds for the point estimate by calculating a range of NPV benefits given the uncertainties for external factors such as capital markets, energy prices, and water prices (p. 104). Table 3.4 summarizes the key factors that were used for the NPV calculations for the scenarios developed and defined by the consultant.
In distinguishing the Economic High Growth Scenario from the Economic Low Growth Scenario, the consultant explained that
When the economy is growing slowly, there are fewer opportunities for capital investment and the discount rate declines. When the economy is growing more quickly, more opportunities for higher yields for capital investment increase the discount rate. Therefore, the “Economic High Growth” scenario in this study includes a discount rate of 3 percent, which is equal to the OMB real discount rate in 2007 and which could be expected to occur within the study period of 40 years. The “Economic Slow Growth” scenario includes a discount rate of 1.5 percent, which could occur in the future if economic activity (and opportunities for investment) limits the alternatives for higher yield investments (p. 106).
For the analyses of ASHRAE standards 90.1-2010 and 189.1-2011 and the LEED and Green Globes certification systems, the consultant calculated NPV benefits, adjusted rate of return on investment, and payback for those standards and systems in relation to the two baseline prototype buildings in five locations.
TABLE 3.4 Factors Used in Benefit-Cost and Sensitivity Analyses
| Scenario | Real Discount Rate (percent) | Time Period (years) | Energy Annual Escalation Rate (eE) (percent) | Water Annual Escalation Rate (eW)(percent) |
| Long-term Benefit-Cost | 2.0a | 40 | 0.5b | 2.0 |
| Short-term Benefit-Cost | 1.7a | 20 | 0.5b | 2.0 |
| Economic High Growth | 3.0 | 20, 40 | 0.5b | 0 |
| Economic Slow Growth | 1.5 | 20, 40 | 2.0 | 4.0 |
NOTE: eE = Energy (annual) escalation rates, excluding inflation; eW = Water (annual) escalation rates, excluding inflation (p. 16). Any systematic effort to include inflation would not change the results as long as inflation is consistently excluded from all factors.
a OMB Real Discount Rates, fiscal year 2013.
b Annual equivalent of Energy Information Administration/Federal Energy Management Program energy price escalations.
SOURCE: Slaughter (2012, p. 105).
The Building Life-Cycle Cost (BLCC) program5 developed by the National Institute of Standards and Technology was used to calculate net present value savings, adjusted rate of return on investment, and payback for all of the analyses. The BLCC program is updated annually to incorporate the current OMB discount rates and the annual energy price escalations provided by the EIA (pp. 104 and 121).
Application of the Analytical Approach to the DOD Operating Environment
The DOD consultant also tested the analytical approach to identify issues that might arise if the approach were to be applied in the DOD operating environment. The consultant worked with staff from DOD headquarters and staff from the military services at both headquarters and installations to gather data on several categories of costs, including energy, water, operations and maintenance, solid waste disposal, and hazardous waste disposal. Traditional benefit-cost and sensitivity analyses were conducted in the same manner as for the ASHRAE standards and green building certification systems, but this time data were used from DOD buildings. Based on the test case analysis, the consultant identified four general categories of issues associated with the application of the proposed approach for analyzing the cost-effectiveness of building design alternatives within the DOD operating environment, as follows:
- The timing of economic efficiency analyses for decision support on project planning, design and implementation, particularly in the context of current authorization and appropriation processes and legislative mandates;
- Data collection and baseline development;
- Use of the analytical approach to track actual performance of buildings relative to expected benefits; and
- Industry and market factors influencing the long-term economic efficiency of DOD military construction and renovation (p. 156).
Timing of Economic Efficiency Analyses for Decision Support
DOD currently requires an economic efficiency analysis as part of Form 1391 for the initiation of the military construction authorization process for individual building construction projects (p. 154).
_________________
5 See http://www1.eere.energy.gov/femp/information/download_blcc.html.
The consultant stated that the analytical approach would be best applied across a portfolio of projects at the earliest stages, for budgeting and planning, rather than on individual projects at the authorization stage. The consultant proposed that the approach could also be effectively applied during design development and implementation in the choice of specific building characteristics (p. 154), although existing DOD processes may need to be refined. Such refinements would include the following elements in the earliest stages of project planning and scope development through detailed design and implementation:
- Recognition of uncertainty with respect to future conditions, costs, and opportunities;
- Clear specification of inputs and outcomes to provide a basis to measure actual performance and to revise assumptions;
- Clear delineation of exogenous factors (e.g., market trends, potential disruptions) and analysis of potential impacts to provide a basis for robust risk mitigation; and
- Flexibility to evaluate new conditions, opportunities, inputs, and outcomes to provide a means to rapidly and effectively improve performance and cost-efficiency (p. 154).
Data Collection and Baseline Development
The DOD consultant stated that the proposed analytical approach requires credible and verifiable data related to incremental construction costs; major repair/replacement costs; and operations, maintenance, and repair costs over the life of a facility. It may also require additional data collection and an explicit process to assess the performance of building systems, components, equipment, and materials relative to the actual capture of expected benefits to inform design, procurement, and implementation processes. The consultant stated that those data would need to be grounded in the local market, incorporating local construction costs (and available skill levels) and local factor unit prices (e.g., energy, water, municipal and hazardous waste, and costs for operations and maintenance, cleaning, and landscaping), as well as potential future price escalation. Those types of data could provide critical information related to uncertainty in future conditions needed for strategic decision-making and risk mitigation at the installation level and for specific facilities (p. 154).
The consultant also stated that the analytical approach would require the definition of appropriate baselines if useful and empirically verifiable results are to be obtained from the economic efficiency analysis. This is because the calculation of NPV benefits requires a specific base case against which to compare the relative incremental costs and benefits among alternatives (p. 155).
Use of the Analytical Approach to Track Actual Performance of Buildings Relative to the Expected Benefits
The DOD consultant stated that the economic efficiency analysis and the related data collection could be used to track actual performance of buildings relative to their expected benefits. As DOD meters its facilities, data on energy and water use and related costs could be used to evaluate specific buildings, systems, or building types for additional real-time operational refinement and commissioning to meet the expected high-performance levels. Those data could also be used for annual reporting requirements, monitoring the cost savings for given investments, and measuring progress in achieving legislative mandates (p. 155).
Industry and Market Factors
The DOD consultant stated that further research is needed to determine the extent to which industry development as a whole may reduce initial investment costs and improve the capture of expected
benefits from high-performance facilities (pp. 157-158). The consultant noted that anecdotal evidence indicated that the capabilities (learning curve) and capacities (market development) needed to design and construct high-performance buildings have developed rapidly across the architecture, engineering, and construction industry (p. 157), and these capabilities may lead to greater economic efficiency. Specifically, a study by Urban Catalyst Associates (2010) asserted that “costs for green buildings continue to decrease as materials become standard and practitioners become more proficient in new technologies” (p. 157).
The “learning curve” (in economic terms) refers to the rate of progress to achieve a stable production rate given the introduction of new processes, systems, and/or materials and may encompass both “labor learning” for specific skills and “organizational learning” to reflect the development and implementation of effective management practices of the new processes, systems, and/or materials (p. 157).
Market development was associated with achieving economies of scale, where the marginal cost to produce each unit decreases as the number of units increase (p. 157).
The consultant identified five factors that may specifically influence the incremental construction costs for high-performance buildings, as follows:
- Learning curve and market development for manufacturers of high-performance equipment, materials, and systems, which may reduce their unit price costs;
- Learning curve and capacity development for designers of high-performance buildings, which improves decision making and reduces the time required to plan, design, and manage such facilities; and
- Learning curve, skill development, and organizational capacity development by general and specialty contractors, which improve the quality and reduce the time required to construct or renovate high-performance facilities. (p. 157)
Incremental construction costs as well as long-term operations and maintenance costs may be reduced through learning curve and capacity development, as follows:
- Within owner organizations, which can improve the decision making during planning and design and improve operations management over time; and
- For facilities managers, which can improve decision making during planning and design through integrated project teams, and improve the capture of benefits during operations and maintenance (p. 158).
COMMITTEE’S EVALUATION OF THE DOD CONSULTANT’S ANALYTICAL APPROACH
The committee’s evaluation of the DOD consultant’s analytical approach is comprised of three topics: the consultant’s methodology, data sources and the application of those data, and the applicability of the methodology to the DOD operating environment.
Consultant’s Methodology
The long-term benefit-cost analysis used by the DOD consultant to calculate NPV benefits and adjusted rate of return demonstrated the appropriate use of a traditional benefit-cost analysis. Payback was a required element to respond to Section 2830 of NDAA 2012, and the consultant also appropriately conducted a payback analysis.
The consultant’s methodology incorporated an analysis of NPV benefits that would result from investments in similar building types in different locations and climatic conditions. Sensitivity analyses were incorporated to test a range of scenarios that represented uncertain future conditions related to discount rates and water and energy prices. To the committee’s knowledge, analyses for different locations and climate zones and sensitivity analysis for uncertain future conditions are not currently required by DOD or other federal regulations when decisions are being made about building investments. The committee believes that the consultant’s analytical approach has merit as one of an array of decision support tools to be used by DOD for evaluating investments in new construction or major renovations of buildings.
The cost categories of data that the consultant sought to measure—incremental construction, energy, water, operations and maintenance, solid waste, and hazardous waste—are appropriate to the DOD operating environment. The categories are reflective of the multiple objectives associated with high-performance buildings, as defined by Energy Independence and Security Act of 2007. To the committee’s knowledge, DOD and other federal agencies do not typically measure all of these categories, perhaps because industry baselines have not been established.
The committee is aware that DOD has already instituted policies and practices to reduce its overall energy use, to improve its energy security, and reduce its reliance on outside sources for energy supply during routine and crisis situations. The issues of water supply, water use, and water cost are almost certain to become increasingly important considerations for DOD, with several areas of the country already experiencing water shortages and escalating prices. Operations and maintenance costs account for the majority of life-cycle costs associated with buildings and are critical to cost-effectiveness calculations.
The baseline prototype buildings and the BLCC program used by the consultant are both public data sources that are available to DOD, the military services, and other federal agencies and could potentially serve as a basis for more widespread, collaborative benchmarking of facility performance within and across federal agencies.
Data Sources and Application of Data
The committee has significant concerns about the sources of data available for the DOD consultant’s analyses and the application of those data. The committee recognizes that the consultant had to complete the analysis in less than 4 months and had to rely on data-gathering methods that might not have been used if more time were available; the consultant did, in fact, identify some shortcomings of the data used in the analyses and stated that verifiable, reliable data are required for an effective analysis. Nonetheless, the committee is obligated to point out the shortcomings of the data that were analyzed and their likely effects on the results of the consultant’s analyses.
First, actual incremental construction cost data for both LEED-certified and Green Globes-certified buildings were not available; those certification systems do not require that type of information. To generate the incremental construction cost data, which are essential to calculations of NPV benefits, the consultant used two methods. The total cost of a building that is not LEED-certified or Green Globes-certified (a baseline building) was calculated using square foot data gathered from R.S. Means. For the LEED-certified and Green Globes-certified buildings, the consultant used the actual costs of construction for entire buildings, which were then adjusted based on an assumption that 35 percent of the project costs were attributable to architect and engineering fees and other costs. The committee notes that for the purpose of calculating the cost of energy, water, and green systems, the R.S. Means square foot data cannot be directly compared to the cost of actual buildings, because the R.S. Means data make assumptions about building configurations, while actual buildings have specifics. There can be many
differences between an actual building and a prototypical building used by R.S. Means in the square foot tabulations that are not attributable to water, energy, or green systems. If the specifics of the actual building are unknown, the comparison can be significantly skewed.
Second, to conduct the analyses of cost effectiveness for ASHRAE standards 189.1-2011 and 90.1-2010, the data provided by ASHRAE were the same data used in the models run for the development of those standards. The source of the data, therefore, did not allow for an independent verification of the cost-effectiveness of those standards. Given the recent release of those standards, there are few if any buildings that have actually been built to those standards, and no actual measured data were available to test the accuracy of the predictions of the models. The committee was particularly concerned about the estimated NPV benefits attributable to water savings associated with ASHRAE 189.1-2011, which the committee believes would be very difficult to achieve absent extraordinary measures that may not be cost effective for DOD. As buildings are constructed and operated in accord with the ASHRAE standards, validation of actual building performance will become possible.
Third, the consultant used estimated data assembled by ASHRAE staff for the ASHRAE standards analysis. The consultant used a combination of data from actual buildings and estimated data (R.S. Means square foot data) for the analysis of the green building certification systems. The use of data from such different sources makes it difficult to compare the cost-effectiveness of the ASHRAE standards to the cost-effectiveness of the LEED and Green Globes green building certification systems.
The lack of actual incremental cost data calls into question the consultant’s findings related to incremental costs, and, therefore, it calls into question the consultant’s findings related to NPV benefits. Several of the studies analyzed in the committee’s review of the literature (Chapter 4) indicate that the incremental construction costs for LEED-certified buildings are significantly lower than the incremental construction costs estimated by the DOD consultant. The NPV benefits calculated by the consultant would likely have been higher if the consultant had used the average incremental construction costs from those studies.
Therefore, the committee cannot support the absolute net present values calculated by the DOD consultant for ASHRAE standards 90.1-2010 or 189.1-2011 or for the LEED and Green Globes green building certification systems.
Applicability of the Consultant’s Analytical Approach to the DOD Operating Environment
The DOD consultant proposed an analytical approach for use by DOD in making investment decisions for the construction and renovation of buildings today, understanding that future conditions for the value of money, the cost of energy and water, and the cost of solid and hazardous waste disposal is uncertain. The approach recognizes the importance of economic efficiency as one factor in decision making and recognizes that DOD owns and operates most of its facilities for 30 years or longer. It also recognizes that total net savings resulting from an investment will vary by the type of building, by time period, by location and climatic condition, and by the price of resources and services. The proposed approach could potentially be useful as part of an array of decision support tools to be used by DOD. However, as clearly presented by the consultant and reiterated by the committee, effective use of the approach first requires clearly established baselines and accurate, reliable data for the various analyses and may require other refinements to DOD processes and practices.
Gathering and analyzing data related to the costs of energy and water use, operations and maintenance, and hazardous and solid waste disposal for DOD’s portfolio of existing and new facilities could provide a valuable base of information when making decisions about building-related investments. However, to use such data effectively for benefit-cost analyses across the military services and other
DOD components, DOD would first need to develop standard baselines for prototype buildings, standard definitions related to what should or should not be included in each category, standards for calculating quantities and costs of resources, and a standard protocol for gathering data. Personnel deployments may also affect energy use, water use, and other building-related factors. Effective tracking of those types of effects would also require standards and protocols that could be used consistently across the military services.
To implement this type of approach, it will be particularly important to have in place clearly established baselines for prototype buildings commonly constructed or renovated by DOD that can be used by all DOD components. Effective use of the baselines will require credible and verifiable data related to construction costs, energy use, water use, operations and maintenance costs, and other factors, such as solid and hazardous waste disposal, that could have effects on DOD’s mission, operating environment, and budget.


