
Appendix C
Detailed Accident Time Line
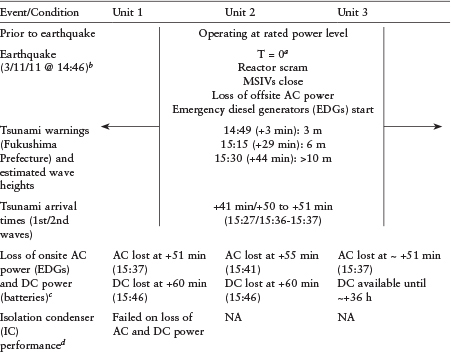
TABLE C.1 Time Line of Key Events in Units 1-3 at the Fukushima Daiichi Nuclear Plant
NOTES: ADS = automatic depressurization system; EDGs = emergency diesel generators; HPCI = high-pressure coolant injection system; IC = isolation condenser; MSIV = main steam isolation valve; RCIC = reactor core isolation cooling system; RPV = reactor pressure vessel; SRV = safety relief valve.
aTimes are from the time of the earthquake in minutes (min) or hours (h).
bAll control rods were inserted and several actions took place in all three units, including a loss of feedwater and condensate and closure of the main steam isolation valves, all prompted by the loss of offsite AC power. The emergency diesel generators started following the loss of offsite power and supplied power to the safety systems.
cThe tsunami generally flooded emergency diesel generators, power panels, and backup batteries, resulting in the loss of AC and DC power except for some isolated systems and standalone battery-operated instrumentation. The immediate result was the loss of normal control room lighting, indicators, and controls. All units except Unit 6 lost AC power within 5 minutes after the tsunami flooded the plant (Investigation Committee, 2011, p. 108). Units 1, 2, and 4 also lost DC power shortly after the tsunami because of flooding of the switchgear and batteries. While the air-cooled Unit 2 emergency diesel generator was running at the time, the electrical switchgear located belowgrade was flooded and subsequently failed. Although there were intermittent signs of power on some indicators in Units 1 and 2, reliable DC power was only available by connecting arrays of scavenged vehicle batteries to selected systems and instrumentation in the control rooms. Unit 3 DC power remained available for emergency lighting and indicators for some time. The Unit 3 DC bus escaped flooding, and sufficient battery capacity was available to operate the RCIC, SRVs, and HPCI for up to 36 h. Ultimately, vehicle batteries had to also be employed in Unit 3 to operate critical systems after the installed backup battery was depleted.
dThe IC system lost its ability to effectively cool the reactor in Unit 1 at approximately the time that AC and DC power was lost, due to system fail-safe control logic. When DC power to the logic circuit is lost, an interlocking operation is activated and all four isolation valves are designed to close automatically (TEPCO, 2012b, p. 195), effectively shutting off the IC. Without AC power, the valves inside containment cannot be reopened; thus, it was not possible to recover the IC system without an AC power source. A schematic of the IC system is provided in Chapter 2 (Figure 2.7) and more complete description of the automated fail-safe control logic is provided in Chapter 4 (Section 4.3.1.1).
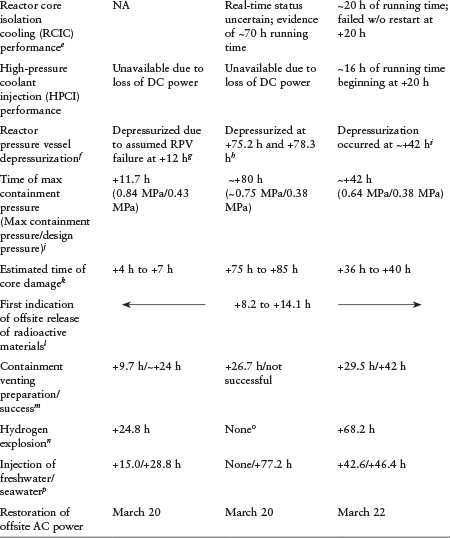
eUnit 2 RCIC was manually started for the last time just prior to the loss of all electric power at ~+54 min. The loss of power at ~+54 min compromised the ability to monitor or control RCIC injection to the RPV in Unit 2. In Unit 3, where DC power was not lost, RCIC operated as intended until it failed at +20 h into the event and could not be restarted. The HPCI started automatically (on a low-reactor-water-level signal) an hour later and began to restore water level in the RPV. HPCI was manually tripped at +35.9 h into the event and attempts to restart it failed.
fAs described in Sections 4.3.1-4.3.3, operators had limited options for depressurization given the blackout and the ensuing chaotic conditions caused by the destruction from the earthquake and flooding waters.
gAnalysis results suggest that reactor water level reached the TAF at about 18:10 on March 11 and core damage started at about 18:50. (TEPCO, 2012b, pp. 190-191).
hThe MAAP5 simulations performed by EPRI (2013) indicate that the RCIC system in Unit 2 operated in a degraded mode that maintained the core cooling for nearly 70 h. During the 70-h period the RPV pressure varied between ~7.5 MPa and ~5.3 MPa (design pressure is 8.24 MPa). The rise continued to the SRV setpoint and at ~+75 h into the event the RPV was depressurized to allow seawater injection. However, pressure increases between approximately +76 h and +84 h into the event compromised the continuity of seawater injection.
iThe operators were able to control the amount of water added to the RPV in Unit 3 until +20 h into the event. The RCIC system operated under conditions for which it was designed (DC power available). However, at about +20 h, the RCIC failed and could not be restarted. On failure of RCIC, the HPCI system automatically started on low reactor water level, rapidly restoring the level. The significant steam extracted via the operation of the HPCI system led to a rapid decrease in RPV pressure. For a little under 10 h, the HPCI system operated at low
RPV pressure with the turbine rotating at a very low speed. However, it is expected that RPV pressure would decrease with HPCI operation if HPCI is running at or near rated shaft speed, not at low speed. According to the EPRI evaluation, HPCI is not designed to operate at the low pressures at which it was operating (~1 MPa). Under low-pressure conditions it does not provide adequate coolant to remove all of the decay heat. When HPCI was manually tripped at approximately +36 h into the event and could not be restarted, the RPV pressure rose sufficiently to prevent any significant injection using the diesel-driven fire protection system. From +36 h to approximately +42 h into the accident, no injection was provided to the RPV. Following depressurization of the RPV by operators at ~+42 h, injection of freshwater was established using a fire truck pump staged away from the unit. At around +46 h, there was a brief interruption in injection when the water source was switched from freshwater—which had been exhausted—to seawater.
jUnit 1 containment reached its peak pressure of 0.84 MPa at +11.7 h into the event. The pressure was almost twice the design pressure (0.43 MPa). The overpressure and high temperature may have damaged the pressure boundary, allowing leakage of radionuclides and flammable gases into the reactor building. Unit 2 containment pressure gradually increased during the 3-day period of RCIC operation, approaching design pressure at about the time RCIC injections stopped (at ~+71 h). The sudden rise in containment pressure at +80 h in Unit 2 may have been due to the rapid production of hydrogen from zirconium oxidation and core concrete interaction, although the data and simulations are both inconsistent (ANS, 2012; Gauntt et al., 2012b) with a loss of RPV integrity at that time. Unit 2 containment pressure reached about twice design pressure at ~+80 h into the event. Uncontrolled leakage through the pressure boundary is believed to have occurred to relieve pressure as this was about the same time that observed dose rates begin to rise at the site boundary. The uncontrolled leakage of volatile fission products from Unit 1 and 2 containments would bypass the suppression pool, limiting the scrubbing of volatile fission product aerosols. The value shown in the table is from the ANS (2012) and INPO (2011) time lines.
kEarly core degradation and fuel melting in the Unit 1 reactor (TEPCO, 2012b, p. 191) was caused by the loss of the IC heat removal path. As discussed in this report, the loss of all power caused by the tsunami led to automatic closing of valves which could not be reopened without AC and DC power. The entire core of Unit 1 may have penetrated the reactor pressure vessel. Analyses were performed by TEPCO (2012c), JNES, Sandia (Gauntt et al., 2012b), ORNL (Robb et al., 2013), and EPRI (2013) on the progression of the accident. EPRI analyses using the MAAP computer model indicates that it is possible that core debris melted through the bottom of the reactor pressure vessel as early as +10 h into the event. Their analyses also indicate that it is possible that the RPV depressurized to containment pressure before core debris melted through the bottom of the vessel. EPRI indicated that this depressurization could have occurred through the seizure of an SRV operating under severe accident conditions. The MELCOR analyses by Sandia and ORNL also indicated large uncertainties with respect to the exact level of damage of Units 2 and 3. It is believed that the Unit 2 core might have been contained, but the possibility of some core debris inside the containment cannot be precluded. Sensitivity studies by EPRI indicate the possibility of a significant fraction of the Unit 3 core debris being relocated into the containment.
lThe source of this release has not been confirmed; however, its timing coincides with the slow (and unexplained) reduction in containment pressure in Unit 1 (see Note j). At about +8.2 h into the event, dose rates up to 120 mrem/h (1.2 mSv/h) were detected outside the personnel airlock door of Unit 1 reactor building. Dose rates inside the control room also increased at +8.2 h into the event.
mAt about +11.7 h into the event, the drywell pressure in Unit 1 reached about twice the design pressure, causing a leak through the pressure boundary that never completely resealed. Data on the primary containment vessel for Unit 2 indicate that venting through the suppression chamber or drywell never occurred. Despite efforts to vent containment and depressurize the RPV into the suppression pool, the containment pressure never reached the burst pressure of the rupture disk in the hardened vent piping for the suppression chamber (the set point was 0.43 MPa gauge) prior to leakage through the pressure boundary. Unit 3 maximum containment pressures were considerably less than those of Units 1 and 2, although still greater than the design pressure.
nThere were a total of three hydrogen explosions at Units 1, 3, and 4. At +87.2 h into the event, operators heard a loud noise around the torus and pressure suppression chamber of Unit 2. It was first thought to be a hydrogen explosion in Unit 2, but comparisons of seismic data from building accelerometer signals (TEPCO, 2012b) indicate that the noise heard was most likely the explosion of the Unit 4 reactor building. The noise was accompanied by the lowering of the torus pressure to 0 kPa (abs) but this is now believed to be an instrument failure as the measured pressures in the drywell and suppression chamber were drastically different after this time. The hydrogen explosion in Unit 4 (not included in the above table) which occurred at ~+87.2 h is believed to be a result of shared systems between Unit 3 and Unit 4 with the source of hydrogen in Unit 4 being backflow through common piping with Unit 3 at the stack whose containment was being vented.
oThe open blowout panel in the reactor building of Unit 2 caused by the hydrogen explosion in Unit 1 may have prevented buildup of hydrogen to explosive levels. Unfortunately, the open blowout panel provided direct access to the environment of radionuclides escaping from the primary containment system as a result of leakage paths.
pSeawater injection was aligned earlier in each case and even started earlier especially in Unit 2, but flooding, the unavailability of fire trucks, lack of fuel for the fire trucks, RPV depressurization delays and the consequences of hydrogen explosions all contributed to much later injection times than planned and even then the injections were often interrupted. For example, in Unit 3, seawater injection started at +46.4 h, was suspended at +58.4 h, was restored at +60.5 h, was suspended again at +68.2 h, and was restored again at +73.7 h.


