
NATIONAL PATTERNS OF R&D RESOURCES: KEY ASPECTS OF DATA, METHODS, AND REPORTS
Mark Boroush from the National Science Foundation (NSF) laid the groundwork for the workshop by describing the series of publications National Patterns, including the sources of data that are used as inputs, the statistical methods used to address data limitations, the tabulations and other statistical products that appear in the publication, and related reports.
Boroush began by noting NSF’s commitment toward producing quality statistics on R&D expenditure patterns. He noted that the National Center for Science and Engineering Statistics (NCSES), the NSF unit with primary responsibility for National Patterns, is determined to maintain the quality of the tabulations and other statistical products and to maintain their policy relevance as well. Boroush said that this is an important workshop for NCSES: he and his colleagues hope that a number of ideas will surface that will help them keep these commitments for quality and relevance in the face of both current and future challenges.
National Patterns of R&D Resources reports annual U.S. total R&D expenditures in a performer-funder matrix that is broken out by type of research—basic, applied, or development: see Tables 2-1 and 2-2. Many elements of the performer-funder matrix have been relatively stable since 1953, which supports analysis of trends over time.
National Patterns is a derived product: it is a compendium that draws from five annual NSF surveys on R&D expenditures and awards. Currently, the primary publications associated with National Patterns are Info Briefs
and Data Updates. Info Brief is a short publication (generally 10-15 pages) that contains recent data, graphical analysis, and primary conclusions. The primary purpose of Info Brief is to give a glimpse of the United States’ R&D performance in the absence of a full National Patterns report. The annual National Patterns report is given the subtitle of Data Update, as the report provides an annual update of R&D expenditure and funding series.1 The latest Data Update that is available from NCSES is for 2009. Boroush added that the 2010 and 2011 Data Updates will be available in the winter of 2012.2
As noted above, R&D statistics in National Patterns are disaggregated by category of R&D performer, category of source of funding, character of work (basic research, applied research, and development), and sometimes state of provider or state of recipient. The funds are also reported both in current and in constant dollars. Along with producing U.S. domestic R&D expenditure and funding statistics, NCSES since 1981 has also published the ratio of R&D funding to the gross domestic product (GDP). For comparative purposes, NCSES also publishes the total R&D expenditures of other large countries.
Boroush displayed recent examples of these various statistical products depicting trends in federal and nonfederal R&D expenditure, the ratio of R&D expenditure to GDP for selected nations, and the share of performing sector and funding source in total R&D expenditures for 2009: see Figures 2-1 and 2-2, also see Table 2-3. The most important outputs of National Patterns show the trend of U.S. R&D expenditure for the last 60 years, indicating how the shares of various performing sectors and funding sources have changed and comparing U.S. R&D funding with that of other countries. Another very important statistical product, Boroush said, is the amount of R&D expenditure in individual states.
Boroush said that efforts had been made to acquire an understanding of the National Patterns user community, which includes federal policy makers, various federal agencies, and congressional staff. There is also substantial international interest in U.S. R&D expenditure and funding statistics from statistical agencies in other countries and from the OECD, the European Union (EU), and representative organizations, such as the United Nations Educational, Scientifc and Cultural Organization (UNESCO). In addition, Boroush said that both domestic and international media, including the business press, and the broader science and technology community
_________________
1Info Briefs and full National Patterns reports are available at http://www.nsf.gov/statistics/ natlpatterns [February 2013].
2 The 2010 and 2011 Data Updates were published several months after the workshop: see National Science Foundation (2013).
TABLE 2-1 All U.S. R&D Expenditures, by Performing Sector and Source of Funds: 1996-2009
| All Performers | Federal | Industry | Industry FFRDCs | U&C | ||||
| Year | All Sources | Federal | Total | Federal | Industry | Total | Total | Federal |
| 1996 | 197,346 | 16,585 | 142,371 | 21,356 | 121,015 | 2,297 | 23,718 | 14,084 |
| 1997 | 212,152 | 16,819 | 155,409 | 21,798 | 133,611 | 2,130 | 24,884 | 14,530 |
| 1998 | 226,457 | 17,362 | 167,102 | 22,086 | 145,016 | 2,078 | 26,181 | 15,174 |
| 1999 | 245,007 | 17,851 | 182,090 | 20,496 | 161,594 | 2,039 | 28,176 | 16,264 |
| 2000 | 267,983 | 18,374 | 199,961 | 17,117 | 182,844 | 2,001 | 30,705 | 17,727 |
| 2001 | 279,755 | 22,374 | 202,017 | 16,899 | 185,118 | 2,020 | 33,743 | 19,784 |
| 2002 | 278,744 | 23,798 | 193,868 | 16,401 | 177,467 | 2,263 | 37,215 | 22,395 |
| 2003 | 291,239 | 24,982 | 200,724 | 17,798 | 182,926 | 2,458 | 40,484 | 25,129 |
| 2004 | 302,503 | 24,898 | 208,301 | 20,266 | 188,035 | 2,485 | 43,122 | 27,168 |
| 2005 | 324,993 | 26,322 | 226,159 | 21,909 | 204,250 | 2,601 | 45,190 | 28,254 |
| 2006 | 350,162 | 28,240 | 247,669 | 24,304 | 223,365 | 3,122 | 46,955 | 28,810 |
| 2007 | 376,960 | 29,859 | 269,267 | 26,585 | 242,682 | 5,165 | 49,010 | 29,351 |
| 2008 | 403,040 | 29,839 | 290,681 | 36,360 | 254,321 | 6,346 | 51,650 | 30,341 |
| 2009 | 400,458 | 30,901 | 282,393 | 39,573 | 242,820 | 6,446 | 54,382 | 31,575 |
NOTE: FFRDCs = federally funded research and development centers, U&C = universities and colleges.
SOURCE: National Science Foundation (2012c, Table 2).
TABLE 2-2 U.S. Basic Research Expenditures, by Performing Sector and Source of Funds: 1996-2009
| All Performers | Federal | Industry | Industry FFRDCs | U&C | ||||
| Year | All Sources | Federal | Total | Federal | Industry | Total | Total | Federal |
| 1996 | 32,799 | 2,680 | 7,498 | 650 | 6,848 | 708 | 16,042 | 10,092 |
| 1997 | 36,921 | 2,746 | 9,795 | 1,029 | 8,766 | 625 | 17,654 | 10,924 |
| 1998 | 35,372 | 3,003 | 5,853 | 1,002 | 4,851 | 568 | 19,365 | 11,941 |
| 1999 | 38,935 | 3,347 | 6,645 | 1,108 | 5,537 | 557 | 21,022 | 12,892 |
| 2000 | 42,759 | 3,765 | 7,040 | 925 | 6,115 | 547 | 22,917 | 13,966 |
| 2001 | 47,751 | 4,260 | 8,053 | 754 | 7,299 | 552 | 25,240 | 15,553 |
| 2002 | 51,383 | 4,511 | 7,547 | 888 | 6,659 | 534 | 27,970 | 17,724 |
| 2003 | 54,611 | 4,664 | 8,330 | 1,386 | 6,944 | 299 | 30,023 | 19,658 |
| 2004 | 56,092 | 4,697 | 7,835 | 1,072 | 6,763 | 175 | 31,989 | 21,150 |
| 2005 | 59,686 | 4,770 | 8,667 | 1,108 | 7,559 | 136 | 34,028 | 22,186 |
| 2006 | 61,199 | 4,716 | 8,384 | 1,444 | 6,940 | 652 | 35,635 | 22,690 |
| 2007 | 66,206 | 4,621 | 11,268 | 2,780 | 8,488 | 2,258 | 37,271 | 23,043 |
| 2008 | 70,220 | 4,957 | 12,368 | 1,475 | 10,893 | 2,423 | 38,840 | 23,500 |
| 2009 | 75,969 | 5,507 | 14,784 | 1,340 | 13,444 | 2,550 | 40,543 | 24,242 |
NOTE: FFRDCs = federally funded research and development centers, U&C = universities and colleges.
SOURCE: National Science Foundation (2012c, Table 3).
| U&C FFRDCs | Other Nonprofit | Nonprofit FFRDCs | |||||||
| Other Gov’t. | Industry | U&C | Other Non-profit | Total | Total | Federal | Industry | Other Nonprofit | Total |
| 1,861 | 1,672 | 4,436 | 1,666 | 5,395 | 6,209 | 2,906 | 730 | 2,574 | 772 |
| 1,922 | 1,808 | 4,838 | 1,786 | 5,463 | 6,626 | 3,014 | 809 | 2,804 | 821 |
| 1,972 | 1,950 | 5,163 | 1,922 | 5,559 | 7,332 | 3,281 | 859 | 3,192 | 843 |
| 2,098 | 2,082 | 5,619 | 2,112 | 5,652 | 8,207 | 3,761 | 931 | 3,516 | 993 |
| 2,247 | 2,174 | 6,232 | 2,326 | 5,742 | 9,734 | 4,510 | 1,020 | 4,204 | 1,465 |
| 2,397 | 2,190 | 6,827 | 2,546 | 6,225 | 11,182 | 5,488 | 1,029 | 4,666 | 2,192 |
| 2,557 | 2,160 | 7,344 | 2,758 | 7,102 | 12,179 | 5,778 | 998 | 5,404 | 2,319 |
| 2,742 | 2,129 | 7,650 | 2,833 | 7,301 | 12,796 | 5,945 | 1,020 | 5,831 | 2,494 |
| 2,883 | 2,190 | 7,936 | 2,945 | 7,659 | 13,394 | 6,537 | 1,041 | 5,816 | 2,644 |
| 2,922 | 2,323 | 8,578 | 3,113 | 7,817 | 14,077 | 6,545 | 1,107 | 6,425 | 2,828 |
| 3,021 | 2,509 | 9,285 | 3,329 | 7,306 | 13,928 | 6,044 | 1,182 | 6,702 | 2,943 |
| 3,265 | 2,741 | 9,959 | 3,694 | 5,567 | 14,777 | 5,980 | 1,257 | 7,541 | 3,316 |
| 3,518 | 3,004 | 10,707 | 4,080 | 4,766 | 16,035 | 6,236 | 1,301 | 8,498 | 3,724 |
| 3,675 | 3,279 | 11,436 | 4,418 | 4,968 | 17,531 | 7,133 | 1,258 | 9,141 | 3,835 |
| U&C FFRDCs | Other Nonprofit | Nonprofit FFRDCs | |||||||
| Other Gov’t. | Industry | U&C | Other Non-profit | Total | Total | Federal | Industry | Other Nonprofit | Total |
| 1,149 | 1,032 | 2,740 | 1,028 | 2,606 | 3,187 | 1,248 | 428 | 1,510 | 79 |
| 1,248 | 1,175 | 3,144 | 1,162 | 2,671 | 3,322 | 1,317 | 449 | 1,557 | 108 |
| 1,330 | 1,315 | 3,483 | 1,296 | 2,660 | 3,710 | 1,461 | 477 | 1,773 | 213 |
| 1,432 | 1,421 | 3,835 | 1,442 | 2,765 | 4,203 | 1,734 | 517 | 1,952 | 397 |
| 1,550 | 1,499 | 4,298 | 1,604 | 2,874 | 5,000 | 2,099 | 566 | 2,334 | 616 |
| 1,663 | 1,519 | 4,737 | 1,767 | 3,104 | 5,626 | 2,464 | 571 | 2,590 | 915 |
| 1,768 | 1,494 | 5,077 | 1,907 | 3,714 | 6,129 | 2,575 | 554 | 3,000 | 979 |
| 1,850 | 1,438 | 5,165 | 1,913 | 3,747 | 6,519 | 2,714 | 567 | 3,238 | 1,029 |
| 1,958 | 1,488 | 5,392 | 2,001 | 3,730 | 6,596 | 2,788 | 578 | 3,229 | 1,070 |
| 2,042 | 1,624 | 5,999 | 2,177 | 3,820 | 7,084 | 2,903 | 614 | 3,568 | 1,181 |
| 2,155 | 1,791 | 6,624 | 2,376 | 3,344 | 7,227 | 2,849 | 656 | 3,721 | 1,242 |
| 2,363 | 1,983 | 7,207 | 2,674 | 1,724 | 7,714 | 2,829 | 698 | 4,187 | 1,350 |
| 2,533 | 2,162 | 7,708 | 2,937 | 1,672 | 8,514 | 3,073 | 722 | 4,719 | 1,447 |
| 2,627 | 2,344 | 8,173 | 3,158 | 1,808 | 9,270 | 3,496 | 698 | 5,075 | 1,508 |
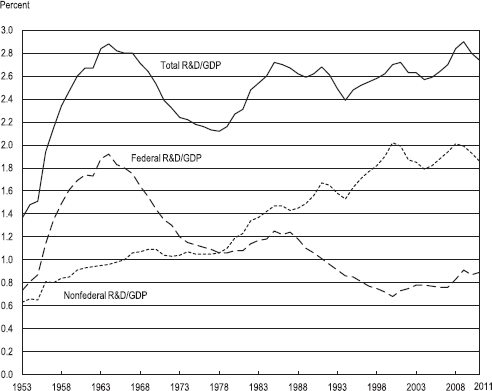
FIGURE 2-1 Ratio of U.S. R&D to gross domestic product (GDP), roles of federal and nonfederal funding for R&D, 1953-2011.
SOURCE: National Science Foundation (2013, Figure 4).
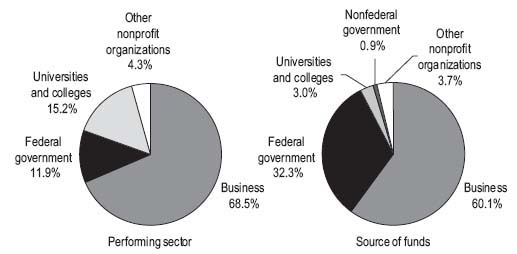
FIGURE 2-2 Share of U.S. R&D expenditures by performing sector and by funding sector, 2011.
SOURCE: National Science Foundation (2013, Figure 2).
TABLE 2-3 International Comparisons of Gross Domestic Expenditures on R&D and R&D Share of Gross Domestic Product, by Selected Country/Economy: 2009 (or most recent year)
| Region/Country-Economy | GERD (PPP $ millions | GERD/GDP (%) |
| North America | ||
|
United States |
401,576.5 |
2.88 |
|
Canada |
24,551.3 |
1.92 |
|
Mexico (2007) |
5,719.6 |
0.37 |
|
South America |
|
|
|
Brazil (2008) |
21,649.4 |
1.08 |
|
Argentina (2007) |
2,678.8 |
0.51 |
|
Chile (2004) |
1,227.7 |
0.68 |
|
Europe |
|
|
|
Germany |
82,730.7 |
2.78 |
|
France |
47,953.5 |
2.21 |
|
United Kingdom |
40,279.5 |
1.85 |
|
Italy |
24,752.6 |
1.27 |
|
Spain |
20,496.4 |
1.38 |
|
Sweden |
12,494.9 |
3.62 |
|
Netherlands |
12,273.8 |
1.82 |
|
Switzerland (2008) |
10,512.7 |
3.00 |
|
Austria |
8,931.3 |
2.75 |
|
Belgium |
7,684.9 |
1.96 |
|
Finland |
7,457.8 |
3.96 |
|
Denmark |
6,283.8 |
3.02 |
|
Poland |
4,874.9 |
0.68 |
|
Norway |
4,734.1 |
1.76 |
|
Portugal |
4,411.0 |
1.66 |
|
Czech Republic |
4,094.8 |
1.53 |
|
Ireland |
3,164.6 |
1.79 |
|
Ukraine |
2,485.7 |
0.86 |
|
Hungary |
2,333.8 |
1.15 |
|
Greece (2007) |
1,867.9 |
0.59 |
|
Romania |
1,471.5 |
0.47 |
|
Slovenia |
1,043.6 |
1.86 |
|
Belarus |
813.3 |
0.65 |
|
Croatia |
743.1 |
0.84 |
|
Luxembourg |
708.5 |
1.68 |
|
Slovak Republic |
595.5 |
0.48 |
|
Middle East |
|
|
|
Israel |
8,810.1 |
4.28 |
|
Turkey |
8,681.2 |
0.85 |
|
Iran (2008) |
6,465.2 |
0.79 |
| Region/Country-Economy | GERD (PPP $ millions | GERD/GDP (%) |
|
Africa |
|
|
|
South Africa (2008) |
4,689.3 |
0.93 |
|
Tunisia |
1,048.5 |
1.21 |
|
Egypt |
997.3 |
0.21 |
|
Morocco (2006) |
765.1 |
0.64 |
|
Central Asia |
|
|
|
Russian Federation |
33,368.1 |
1.24 |
|
South Asia |
|
|
|
India (2007) |
24,439.4 |
0.76 |
|
Pakistan |
2,055.2 |
0.46 |
|
East, Southeast Asia |
|
|
|
China |
154,147.4 |
1.70 |
|
Japan |
137,908.6 |
3.33 |
|
South Korea (2008) |
43,906.4 |
3.36 |
|
Taiwan |
21,571.8 |
2.93 |
|
Singapore |
5,626.5 |
2.35 |
|
Malaysia (2006) |
2,090.9 |
0.64 |
|
Thailand (2007) |
1,120.8 |
0.21 |
|
Australia, Oceania |
|
|
|
Australia (2008) |
18,755.0 |
2.21 |
|
New Zealand (2007) |
1,422.5 |
1.17 |
|
Selected country groups |
|
|
|
G-20 countries |
1,181,263.7 |
2.01 |
|
OECD (2008) |
965,629.1 |
2.33 |
|
EU-27 |
297,889.6 |
1.90 |
NOTE: NOTE: EU-27 = European Union 27 member states, G-20 = group of finance ministers and central bank governors from 20 major economies, GDP = gross domestic product, GERD = gross domestic expenditures on R&D, OECD = Organisation for Economic Co-operation and Development, PPP = purchasing power parity.
are interested in obtaining a better understanding of how well the support for science is faring from year to year, Boroush said.3
_________________
3 The January 2013 Info Brief had 182 views, and the 2009 Data Update had 255 views as of February 26, 2013 (personal communication, Mark Boroush, NCSES).
There are five active censuses and surveys used as inputs for National Patterns:
• Business R&D and Innovation Survey (BRDIS): BRDIS is the current business sector survey, which replaced the Survey of Industrial R&D (SIRD) starting from 2008. In moving to BRDIS, the questionnaire was substantially revised and lengthened to include a larger set of questions, such as R&D performed abroad by companies that are based in the United States.
• Survey of Federal Funds for Research and Development (known as the Federal Funds Survey): Federal Funds Survey is a census that collects data on federal support of national scientific activities in terms of budget obligations and outlays. The survey is completed by 15 federal departments and their 72 subagencies and by 12 independent agencies.
• Federally Funded Research and Development Centers (FFRDCs) R&D Survey: This annual census collects information on R&D expenditures of FFRDCs by source of funds. It was conducted for all university-administered FFRDCs until 2000. Subsequently, the survey population was expanded to include all FFRDCs. In 2010, the questionnaire was expanded to gather information on the total operating budgets of FFRDCs, on R&D expenditures from the American Recovery Reinvestment Act of 2009, and by type of costs.
• Higher Education Research and Development Survey (HERD): The recently revised version of the previous Survey of Research and Development Expenditures at Universities and Colleges is a census of all R&D spending at colleges and universities. HERD serves as the primary source of information on R&D expenditures in academia in the United States. One of the modifications in the transfer to HERD was the decision to include information on nonscience and nonengineering R&D.
• Survey of State Agency Research and Development Expenditures: Formerly known as the Survey of State Government Research and Development Expenditures, the purpose of the survey is to capture R&D activity performed and funded by the nation’s 50 states, the District of Columbia, and Puerto Rico (“state profiles”).
In addition, there is information from a survey that was conducted three times:
• Survey of Research and Development Funding and Performance by Nonprofit Organizations: This survey was conducted in 1973, 1996, and 1997. The nonprofit data in National Patterns reports are either taken from
the Federal Funds Survey or are estimates derived from the data collected in 1996 and 1997.4
Since National Patterns draws from these five active surveys, and given that they have different timelines for data collection, processing and dissemination, the timely publication of National Patterns depends on the smooth running of the associated survey cycles. To produce National Patterns for year t, NCSES has to wait different amounts of time, depending on the census or survey, before it can do the editing, imputation, and other data processing activities necessary in order to produce the official estimates: see Figure 2-3. Since the data collection cycles of the five input censuses and surveys are not the same, the time gaps between the data collection and the official estimates will be different for different data. Boroush noted, however, that NCSES also releases data products for each of the individual surveys, which are often more timely. For example, as of the date of the workshop, September 6, 2012, information on R&D performed by federally funded R&D centers was available for 2011, while the latest data update for National Patterns was for 2009.
Boroush then explored the reason behind the delays in release of National Patterns. The current 3-year delay primarily stems from the timing of BRDIS. As can be seen in Figure 2-3, business R&D data for 2010 were not available until 2012 due both to the cycle of data collection and data processing. This hampers NCSES’s ability to produce more timely results. Given this 2-year lag in producing business R&D data, NCSES has considered using the information available from the “projected R&D for next year” item on the BRDIS questionnaire: see Figure 2-4. The original intent of this survey item was to gain an understanding of the plans of companies for R&D outlays the following year. In a comparison of the projected R&D numbers from 2008 and 2009 surveys and the actual R&D performed by the companies the following year, NCSES staff found that the numbers that companies reported in the “look ahead” questions are reasonable proxies for the actual R&D performed. NCSES believes that if necessary it could use these numbers to provide estimated BRDIS numbers that could support
_________________
4 NCSES releases tables and InfoBriefs drawing on data collected from the component surveys that feed into National Patterns:
• BRDIS, see http://www.nsf.gov/statistics/industry [February 2013].
• Federal Funds, see http://www.nsf.gov/statistics/fedfunds [February 2013].
• R&D Expenditure at FFRDCs, see http://www.nsf.gov/statistics/ffrdc [February 2013].
• HERD, see http://www.nsf.gov/statistics/herd [February 2013].
• Science and Engineering State Profles, see http://www.nsf.gov/statistics/pubseri.cfm?seri_id=18 [February 2013].
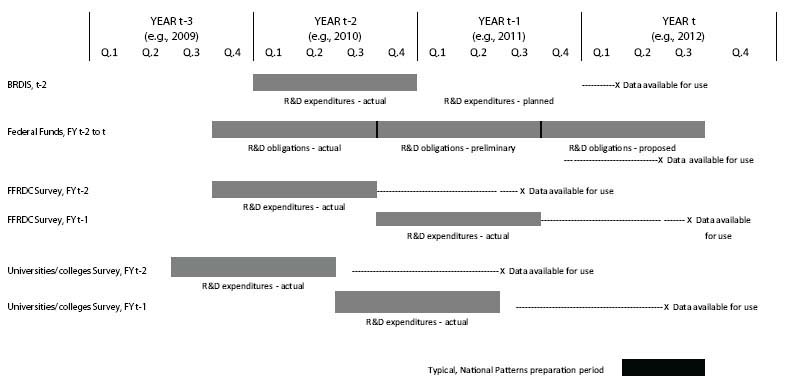
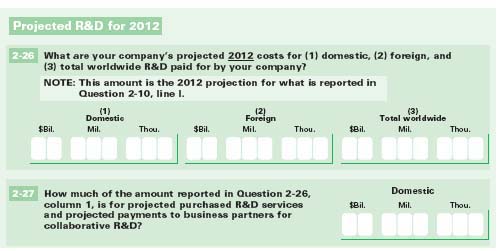
FIGURE 2-4 Survey item from BRDIS 2011 questionnaire.
SOURCE: National Science Foundation (2012a).
publication of National Patterns a year earlier.5 However, Boroush noted that NCSES has not yet made the decision to do so given that this relationship has not been established stably over time and that other approaches to the timeliness problem may be proposed. Very recently, the data processing for BRDIS has been expedited, and the time lag for National Patterns is now less than 1 year. As the only federal statistical agency producing estimates of national- and state-level R&D funding levels, NCSES has always strived to produce a consistent R&D time series to meet the plethora of demands of a varied set of users, and that consistency has been highly valued by users.
Boroush said that although NCSES has strived to use statistical methods reflective of best practices in producing National Patterns, methodological improvements may be possible. He cited the issues in the statement of task for the workshop and expanded on some of them. First is the content and format of the National Patterns reports. He said he wanted the workshop participants to examine how the agency could pursue different routes of presenting the information published in National Patterns. Second, he noted the data gap due to the absence of a survey on nonprofit organizations. A
_________________
5 Respondent companies are likely to have a reasonable sense of “next year’s R&D” as BRDIS is fielded in the second quarter of “next year.” For example, companies will report their 2012 R&D expenditure in 2013 and therefore have a good estimate of their 2013 R&D expenditure.
portion of R&D expenditures to nonprofit organizations and funding by nonprofit organizations comes from the Federal Funds Survey. The main omission is the estimate of the amount of R&D funding from nonprofit organizations to other nonprofit organizations. Boroush said that NCSES generally agrees that there is a need for an updated R&D survey on non-profit organizations, but that it has been unable to undertake such a survey due to staff and budget constraints. Boroush said he hoped that workshop participants would provide ideas for a new nonprofit survey to contribute to the National Patterns aggregate R&D estimates or suggest approaches to estimating R&D undertaken by nonprofits through other means.6
Boroush also discussed the possibility of collecting new variables on the current censuses and surveys, including state intramural R&D expenditures, and the categorization of R&D by socioeconomic objectives and science and engineering fields. Standards for collecting data on socioeconomic objectives were introduced in the third edition of the Frascati Manual7 (see Godin, 2008), in which greater stress was placed on “functional” classifications, notably the distribution of R&D by “objectives.” Boroush pointed out that BRDIS does intermittently survey companies to report their R&D performance for defense purposes and for environmental protection applications, even though the latter category is not fully Frascati-compliant: see Box 2-1. NCSES also publishes academic expenditures by science and engineering subfields through NSF’s online communal tool WebCASPAR.8 The original targets for categorization of R&D expenditure by socioeconomic objectives and fields of science were government budget appropriations (GBAORD) and academic R&D (HERD) respectively. Revisions in the Frascati Manual have expanded the scope of categorization to include all kinds of R&D expenditures. Boroush asked participants what priorities should be given to solving the various methodological issues that arise in trying to address this data gap.
In conclusion, Boroush reiterated the utility of National Patterns and the past, current, and future efforts undertaken by NCSES to make the publication better in terms of introducing new concepts, improving estimation methods, and revamping the underlying surveys.
_________________
6 The nonprofit survey issue is addressed in greater detail in Chapter 4.
7 The Frascati Manual details an internationally recognized methodology for collecting and compiling R&D statistics and has become an essential tool for statisticians working on R&D surveys. The manual was originally written by and for the experts in OECD member countries. It is now a standard for conducting R&D surveys in nonmember countries, as a result of its adoption in technology surveys of the UNESCO Institute for Statistics. For further information, see http://www.oecd.org/innovation/inno/frascatimanualproposedstandardpracticeforsurveysonresearchandexperimentaldevelopment6thedition.htm [February 2013].
8 WebCASPAR is the Integrated Science and Engineering Resources Data System; see webcaspar.nsf.gov [January 2013].
BOX 2-1
Collecting R&D Data for Priorities
The Frascati Manual recommends collecting performer-reported data in all sectors for two priorities: (1) defense and (2) control and care of the environment. The manual also recommends that the major fields of science and technology should be adopted as the functional fields of a science classification system. This classification should be used for the R&D expenditure of the government, higher education and private nonprofit sectors, and if possible, the business enterprise sector, and personnel data in all sectors.
ADJUSTMENTS AND CATEGORIES: DISCUSSION
Karen Kafader commended Mark Boroush on his presentation and opened the floor to discussion. Christopher Hill wanted to know whether adjustments made in the estimates produced by the individual R&D surveys are carried forward in the National Patterns publication. Boroush answered that whenever any revisions are made in the survey estimates or in the external sources of information, they are also included in the data updates for National Patterns. For example, he said, any revisions in the GDP numbers from the Bureau of Economic Analysis change the ratios of R&D to GDP in National Patterns.
Also, Boroush said, NCSES takes care of backward adjustments or corrections when new information comes in. Starting from 2010, the HERD survey has collected academic R&D in both science and engineering and nonscience and nonengineering fields. However, figures are available on nonscience and nonengineering R&D funds since 2003, but they are not yet included in the total academic R&D expenditures. The next total academic R&D expenditure time series to be published will include these nonscience and nonengineering R&D components, and revisions will be made back to 2003. Similarly, NCSES also plans to revise the business R&D figures that are based on answers to questions on “projected R&D” once the actual R&D figures are reported the following year. Therefore, National Patterns users need to be careful when making comparisons across time and should consider using only the latest published data. Generally, there is a note in all the detailed statistical tables and Data Updates that warn the users about comparing figures from a recent report with those in previous reports.
Kafadar wanted to know if the uncertainty introduced through the use
of survey estimates can be acknowledged by publishing uncertainty estimates in National Patterns. Boroush pointed out that the survey of FFRDCs and HERD are actually censuses, not surveys, and the Federal Funds Survey is nearly so, so the question is mainly about estimates from BRDIS. Even for BRDIS, the estimated sampling variances of the resulting estimates are small.9 Boroush reported that NCSES staff have looked at uncertainty estimates when the issue was raised in the agency; they found that the revisions they made were often on the same order of magnitude, so the uncertainty intervals would need to reflect both sampling and nonsampling error.
Stephanie Shipp raised the issue of tabulations reporting science and engineering fields and socioeconomic objectives. She said that classifying R&D performed by such new taxonomies is going to be a challenge. Currently industrial R&D is broken down by the classification codes in the North American Industry Classification System (NAICS), and academic R&D is reported by science and engineering field. Federally performed R&D is the third largest sector, and the current breakdown for it is by agency and program. As mentioned above, the original targets for categorization of R&D expenditure by socioeconomic objectives and fields of science were government budget appropriations and academic R&D. Therefore, she suggested it will be challenging for NCSES to assign R&D expenditures to new taxonomies or nomenclature across all funders and recipients. John Jankowski responded that business R&D is mostly development and from a practical viewpoint it is difficult to assign development work to traditional science and engineering fields; thus, this breakdown is not very meaningful. He also added that asking companies to report their R&D by science and engineering fields was considered during the redesign process of BRDIS, but for conceptual reasons such an item was not included in the BRDIS survey.
INTERNATIONAL AND OTHER COUNTRIES’ PUBLICATIONS ON R&D STATISTICS
Figures from National Patterns feed into various international publications and databases, such as OECD’s main science and technology indicators; the science and technology data of the Institute of Statistics of the United Nations Educational, Scientific and Cultural Organization (UNESCO); and Eurostat’s statistics database. As one primary purpose of the workshop was to investigate ways to improve the content and dissemination of National Patterns, it is important to understand how science,
_________________
9 The statement that the coefficients of variation in BRDIS are small is generally justified by statistics that were provided to the steering committee by NCSES that have not yet been released. The major categories of expenditure typically had a coefficient of variation (CV) of less than 1 percent; however, for smaller disaggregated categories, the CVs were often much larger.
technology, and innovation (STI) data are collected and published by various international and national agencies or organizations. The material in this section combines background materials prepared for the workshop by staff of the Committee on National Statistics and workshop presentations given by Fernando Galindo-Rueda and John Jankowski.
Galindo-Rueda began by acknowledging and welcoming the challenge of representing the views of the international community and apologizing in advance for any potential omissions and reminding participants that his comments are his own personal remarks. He explained that he had sought feedback on National Patterns from colleagues and national experts in science and technology statistics who are responsible for producing R&D statistics. Although he received several suggestions for improvement and increased international comparability, the people he spoke with acknowledged that National Patterns is a model for many nations that produce R&D statistics. That is, the series not only produces national R&D statistics but also acts as a benchmark for other national and international STI agencies: National Patterns has been influential in shaping OECD’s statistical guidelines since 1962. He urged workshop participants to consider its relevance to international producers and users of R&D statistics, considering how R&D statistics are reported worldwide and learning potential lessons.
Galindo-Rueda continued by providing some additional context and background on the R&D statistics collected and reported by OECD, Eurostat, and selected national agencies.
OECD
R&D statistics generated by OECD are based on three databases: analytical business enterprise research and development (ANBERD), research and development statistics (RDS), and main science and technological indicators (MSTI). The ANBERD database presents industrial R&D expenditure data broken down in 60 manufacturing and services sectors for OECD countries and selected nonmember economies.10 The reported data are expressed in national currencies as well as by purchasing power parity in U.S. dollars, both at current and constant prices. ANBERD serves to provide analysts with comprehensive and internationally comparable data on industrial R&D expenditure. The member nations and observer economies provide data to OECD through the joint OECD/Eurostat International Survey on the Resources that is devoted to R&D. The database includes estimations that are drawn from the RDS database and other national
_________________
10 See http://www.oecd.org/sti/anberd [February 2013].
sources. ANBERD is part of the family of industrial indicators produced by the Science, Technology and Industry Directorate at the OECD.11
The RDS database (see http://www.oecd.org/sti/rds [May 2013]) is the main source of R&D statistics collected according to the guidelines set out in the OECD’s Frascati Manual developed by the Working Party of National Experts on Science and Technology Indicators.12 It covers expenditures by source of funds, type of costs, and R&D personnel by occupation, shown in both headcounts and full-time equivalents (FTEs). It also includes data on Government Budget Appropriations or Outlays on R&D.13 These data, too, come from the joint OECD/Eurostat survey. Series are available from 1987 to 2010 for 34 OECD countries and a number of nonmember economies. Information on sources and methods used by countries for collecting and reporting R&D statistics are provided in the sources and methods database.14
MSTI comprises a number of indicators based mainly on R&D expenditures, but also on R&D personnel and government R&D budgets. The set of indicators reflect the level and structure of the efforts undertaken by OECD member countries and seven nonmember economies (Argentina, China, Romania, Russian Federation, Singapore, South Africa, Chinese Taipei) in the field of science and technology since 1981. These data include final or provisional results as well as forecasts established by government authorities. The indicators cover financial and human resources devoted to R&D, estimates of governments’ R&D budgets (GBAORD), selected patent indicators from the OECD patent database, indicators from the technology balance of payments database, and estimates of international trade in R&D-intensive industries. It is published biannually, and the database is publicly available online.15 MSTI includes estimates of R&D expenditures and human resources for the OECD area, thus highlighting the importance of securing timely data from all OECD countries. MSTI outputs—for example, indicators such as gross domestic expenditures on R&D (GERD) as a proportion of GDP—are typically featured in sections within national publications devoted to the benchmarking of national results with other selected countries.
Another publication of OECD is the Science, Technology, and Industry
_________________
11 See http://www.oecd.org/trade/stanindicatorsdatabase.htm [February 2013].
12 The UNESCO Institute for Statistics also publishes R&D statistics for a broader range of countries, based on OECD, other regional and national sources for non-OECD members. Even though the Frascati Manual is the key international reference for R&D statistics collection and reporting, compliance with OECD guidelines varies across countries, particularly those outside the OECD area.
13 See http://webnet.oecd.org/rd_gbaord_metadata/default.aspx [February 2013].
14 See http://webnet.oecd.org/rd_gbaord_metadata/default.aspx [February 2013].
15 See www.oecd.org/sti/msti [February 2013].
Scoreboard,16 which has some features in common with Science and Engineering Indicators published by the National Science Board. It, too, is a biannual publication with detailed analysis of data. The Scoreboard not only draws on data collected by the OECD according to OECD standards, but also from other sources.
Eurostat
Eurostat is the Directorate-General of European Commission and its main function is to provide statistical information on European Union (EU) and associate states. Science, technology and innovation is one of the main themes of Eurostat’s statistical portfolio.17 R&D statistics are collected from national agencies according to EU legislation that compels countries to report specific statistics according to a set timetable, using definitions and methodologies laid out in the OECD Frascati Manual. To minimize the burden on countries, OECD and Eurostat coordinate their collection of national data through a common questionnaire, reporting, and monitoring protocol. Eurostat publishes data for non-EU countries, including the United States, based on OECD sources. Eurostat pays particular attention to quality reporting and the comparability of R&D data across EU member states, given the policy use of R&D data at the EU level.18 The main themes of Eurostat’s statistical portfolio are policy indicators; general and regional statistics; economy and finance; population and social conditions; industry, trade and services; agriculture and fisheries; external trade; transport; environment and energy; and science, technology, and innovation.
Statistics Canada
Statistics Canada is the Canadian federal statistical agency in charge of reporting R&D and other science and technology statistics. Its main counterpart to the U.S. National Patterns is Gross Domestic Expenditures on Research and Development in Canada (GERD) and the Provinces.19
R&D expenditures in Canada are estimated annually by type of sector, by sources of funds, and by science type, using a series of surveys supplemented by modeling and, in some cases, administrative sources:
_________________
16 See www.oecd.org/sti/scoreboard [February 2013].
17 See http://epp.eurostat.ec.europa.eu/portal/page/portal/science_technology_innovation/introduction [January 2013].
18 See, for example, http://epp.eurostat.ec.europa.eu/portal/page/portal/sdi/fles/t2020-20_tsdec320_Gross_Domestic_Expenditure_on_RD-DM.PDF [January 2013] and http://epp.eurostat.ec.europa.eu/cache/ITY_SDDS/Annexes/rd_esms_an12.pdf [January 2013].
19 For the most recent issue, see http://www.statcan.gc.ca/pub/88-221-x/88-221-x2012001-eng.pdf [January 2013].
• Six sectors are covered: Business enterprises, federal government organizations, higher education organizations (including universities and affiliated teaching hospitals), private nonprofit organizations, provincial government organizations, and provincial research organizations.
• Sources of funds: Intramural R&D expenditures are spent within organizations performing the R&D. The organizations can fund their own R&D or undertake R&D on behalf of other organizations. The R&D performing organizations indicate the source of funds by sector for intramural expenditures. In the GERD matrix, the sources of funds data are shown by funding sector.
• Science type: R&D expenditures are spent by organizations performing in either the natural sciences and engineering and the social sciences and humanities. Only intramural R&D expenditures in the natural sciences and engineering by provincial research organizations and business enterprises are included in the GERD.
United Kingdom
The United Kingdom’s national R&D statistics are produced by the Office of National Statistics (ONS) in its annual statistical bulletin. There is generally a lag of 2 years between the reference year and publication year. ONS draws together information on R&D spending in the public and private sectors, which includes business enterprises, government departments, higher education, private nonprofit organizations, and research councils.20
The statistical bulletin contains estimates by economic sectors:
• Business enterprise: Business enterprise R&D is derived from the results of the ONS’s annual business R&D survey. Approximately 5,000 businesses are sampled from a reference list of known enterprises that do R&D.
• Higher education: Higher education R&D is estimated by the Higher Education Funding Councils for England, Scotland, Wales, and the Department for Education in Northern Ireland.
• Government: Government R&D is based on the returns of an annual survey of in-house R&D from all government departments and the addition of ONS estimates for R&D performed by local authorities.
• Research councils:21 Research councils are included in the annual
_________________
20 For the latest bulletin covering 2010 data, see http://www.ons.gov.uk/ons/dcp171778_258505.pdf [January 2013].
21 For a description of research councils, see http://www.rcuk.ac.uk/Pages/Home.aspx [January 2013].
government survey. In order to provide additional information, however, their expenditures are shown separately in the data tables.
• Private nonprofit: Due to a planned review of the methodology used for the compilation of the R&D spent by the private nonprofit sector, estimates are currently based on a number of sources, including the total reported as the GOVERD “other UK” spent by government, including research councils.
France
The agency responsible for collecting and publishing R&D statistics in France is the Education and Research Ministry. A six-page information note22 produced by the statistical unit within the ministry summarizes the key R&D indicators and describes the evolution and structure of financial and human resources devoted to R&D in the French economy. A number of complementary tables are also available, providing additional detail.23 The summary report places particular emphasis on international benchmarking of the French results and mapping the flow of resources from funding to performing sectors in the economy.
COMPARABILITY OF U.S. STATISTICS
Boroush had noted various areas in which NCSES has tried or is trying to make the data in National Patterns more internationally comparable. John Jankowski provided more detail in his presentation in the session on “International Comparability,” primarily responding to Galindo-Rueda’s comments on the differences between NCSES’s R&D statistics and analogous statistics from international organizations and other countries. He summarized the various efforts undertaken by NCSES, including redesigning the industrial and the academic surveys so that the estimates derived from these two surveys could meet the demands of the international science and technology community.
For BRDIS, Jankowski reported on the following changes that were made:
1. Social science R&D: The BRDIS questionnaire contains items asking companies to report the amount of social science R&D performed. It does not include R&D performed in the field of humanities, and NCSES
_________________
22 A description in French is available at http://www.enseignementsup-recherche.gouv.fr/reperes [January 2013].
23 They are available in French at http://www.enseignementsup-recherche.gouv.fr/reperes/public/chiffres/default.htm [January 2013].
explained to respondents that market research does not fall under the purview of social science R&D. Inclusion of social science R&D in the total R&D performed by the industrial sector increased the total industrial R&D by $500 million, 0.2 percent of the industry R&D total, and made the numbers internationally comparable. Two-thirds of the $500 million is reported by software publishers and computer design companies.
2. Capital R&D: Capital R&D is not part of total federal R&D reported in National Patterns. However, when NCSES reports the United States’ R&D performance to OECD, capital R&D expenditure is included in federal R&D. To support this reporting, BRDIS explicitly asks companies to report their capital R&D expenditure. NCSES intends to make the information available by industry classification.
3. More detailed R&D funding data: The predecessor to BRDIS combined internal and external sources of nongovernment funding into a single category and no further details were requested from the respondents. BRDIS now asks companies to report not only their domestic expenses, but also their operations outside of the United States. Separate data are collected on company’s internal sources of funding, as well as funding from other companies inside the United States; from companies located outside of the United States; and from several other nongovernment sources. In the 2010 BRDIS, a foreign parent was included as an explicit source of R&D funding to differentiate such support from other funding from companies located outside of the United States.
4. Expanded R&D personnel data: The Frascati Manual recommends that companies separately report headcounts and FTEs for researchers, technicians, and support staff. Total R&D personnel is the sum of researchers, technicians, and support staff (see Chapter 3). The predecessor to BRDIS contained items only on FTE R&D scientists and engineers. NCSES resolved the data gap by adding questions on the 2011 BRDIS on FTE researchers and total R&D personnel (headcount) by gender; occupation (scientists and engineers, technicians, support staff); and location, including foreign locations.
Janowski said the following changes were made to the Higher Education Research and Development Survey (HERD) when it was revised and renamed:
1. Humanities and other nonscience and nonengineering R&D: The predecessor to the HERD survey collected data for 1972-2009 on educational institutions that performed science and engineering R&D. In doing so, NCSES was collecting information on nonscience and nonengineering R&D performed by institutions that also performed science and engineering R&D but missing institutions that performed R&D but not science and engineering R&D. Beginning in 2010 (NCSES redesigned its higher
education R&D survey in 2010), the academic survey included institutions that exclusively performed nonscience and nonengineering R&D, thereby widening the scope of the survey. That category includes R&D performed in education, business, law, social work, and the humanities. The inclusion of social science R&D in BRDIS and the expansion of R&D fields in HERD increased the total domestic R&D figure by 1 percent.
2. Cost components of R&D: The 2010 HERD started to collect details on the cost of R&D, which includes statistics on personnel cost, materials, and equipment. This element was added primarily to help address data needs of the Bureau of Economic Analysis (BEA), which produces estimates of GDP if R&D is treated as an investment.24
3. More detailed R&D funding data: HERD survey, like BRDIS now has a question on foreign sources of R&D. It requests the total amount of R&D expenditure that came from a foreign source. There are no follow-up questions on disaggregating that number, i.e., the questionnaire does not ask the institutions to provide a breakout as to who those foreign sources were, e.g., foreign companies, foreign universities, foreign governments etc.
4. Expanded R&D personnel data: The predecessor to HERD contained a serious data gap in terms of collecting information on R&D personnel in the academic sector. To address this, the 2010 HERD began collecting data on researchers and R&D personnel headcounts. During the HERD redesign, the investigation process indicated that collecting FTE data would be extremely problematic. Given that, the approach taken was to collect data on principal investigators. As a result, providing information on FTE researchers or R&D personnel in the academic sector is still not possible, but one can get headcounts of principal investigators and other R&D personnel.
_________________
24 The National Income and Product Accounts (NIPAs) do not treat R&D and other intangibles as investment. BEA’s R&D satellite account provides the means to separately identify the contribution of R&D to GDP growth. The account shows how GDP and other measures would be affected if R&D spending were “capitalized,” that is, if R&D spending were treated as investment rather than as an expense. It was developed with support from NSF’s Division of Science Resource Statistics. In December 2010, BEA released its revised national statistics, such as real GDP, real gross domestic income, national savings, aggregate returns to R&D assets, R&D investment, R&D output by performer, and input price indexes from 1959 to 2007. BEA plans to incorporate R&D spending as investment into its core accounts in 2013 as part of the comprehensive revision of the NIPAs.


