
With the notable exception of the estimation of nonprofit R&D funding amounts, the National Center for Science and Engineering Statistics (NCSES) primarily uses standard survey estimates—that is, direct survey-weighted totals and ratios—in its tabulations for National Patterns. Design-based survey regression estimators, although they can be more accurate in many survey applications, are often not used for lack of exploratory studies to develop good survey predictors (whose totals are known or measured accurately by other instruments). In relation to consideration of more sophisticated estimation techniques, the charge to the steering committee included the issue of the responsiveness of the information content to user’s needs.
The workshop covered a set of techniques that could provide, for instance, estimates for state-level R&D funds for specific types of industries. This is a type of tabulation that NCSES believes its users would be very interested in obtaining. In addition, the subject of the distinction between measurement error and definitional vagueness, which is related to data quality, was raised during the discussion period; a summary of that discussion is included as a short section at the end of this chapter.
Julie Gershunskaya of the Bureau of Labor Statistics presented a survey of current methods for small-area estimation that have been found useful in various federal statistical applications. Such techniques have the potential to produce R&D statistics on more detailed domains for inclusion in future
National Patterns reports. Currently, the National Patterns reports tabulate statistics on R&D funding primarily at the national level, but there are also state-level tabulations for some major categories of funders and performers for the current year. In addition, tabulations of industrial R&D funding are also available for about 80 separate North American Industrial Classification System (NAICS) codes, down to three digits of detail.1 These efforts to provide information for subnational domains are commended. Kei Koizumi noted earlier in the workshop that many users would benefit from the publication of statistics on R&D funding for more detailed domains: possibilities include providing R&D funding for substate geographic levels or for domains defined by states crossed by type of industry. There may also be interest in providing future tabulations for particular categories of colleges and universities.
A small area is defined as a domain of interest for which the sample size is insufficient to make direct sample-based estimates of adequate precision. These “small areas” in the context of R&D can be geographic entities, industrial types, socio demographic groups, or intersections of geography, industry, or demography. Small-area estimation methods are techniques that can be used, when the sample size is inadequate, to produce reliable estimates by using various additional sources of information from other domains or time periods. However, such methods do rely on various assumptions about how that information links to the information from the domain of interest.
Gershunskaya said at the outset that the best strategy to avoid reliance on small-area estimation is to provide for sufficiently reliable direct estimates for the domains of interest at the sample design stage. However, it is typical for surveys carried out by federal statistical agencies to have insufficient sample sizes to support estimates for small domains requested by the user communities. Hence, the need for small-area estimates is widespread.
Gershunskaya differentiated between direct and indirect estimates. Direct estimates use the values on the variable of interest from only the sample units for the domain and time period of interest. They are usually unbiased or nearly so, but due to limited sample size, they can be unreliable. Indirect estimates “borrow strength” outside the domain or time period (or both) of interest and so are based on assumptions, either implicitly or explicitly. As a result of their use of external information, indirect estimates can have smaller variances than direct estimates, but they can be biased if the assumptions on which they are based are not valid. The objective therefore is to try to find an estimator with substantially reduced variance but with only slightly increased bias.
_________________
1 For 2007 data, see http://www.nsf.gov/statistics/nsf11301/pdf/tab58.pdf [January 2013].
Gershunskaya first reviewed the basic Horvitz-Thompson estimator and then discussed several modifications to it.
Horvitz-Thompson
Introducing some notation, let the quantity of interest be denoted by Yd for domain d of the population. In considering the application of these methods to R&D statistics, domains could be defined by states or by industries with a certain set of NAICS codes. Each sampled unit j has an associated sample weight, denoted wj, which is equal to the inverse of a unit’s probability of being selected.2 (The rough interpretation is that the weight corresponds to the number of population units represented by each sampled unit.)
The Horvitz-Thompson estimator of Yd is
![]()
where yj is the measurement of interest for sample unit j, and sd denotes the set of sampled units in domain d. The Horvitz-Thompson estimator may be unreliable, especially for small domains. To address this, there are various alternative direct estimators that may out-perform the Horvitz-Thompson estimator, especially when auxiliary data are available.
Ratio Estimators
To discuss these estimators, additional notation is needed. Let yj denote the measurement of interest for sample unit j, let xj denote auxiliary data for sample unit j (assumed univariate to start), and let Xd be the known population total for domain d, from administrative or census data. (Note that the dependence of both yj and xj on domain d is not explicitly indicated in the notation to keep things more readable.) In the case of R&D statistics, yj could be the R&D expenditure for company j, xj could be the total payroll for company j, and Xd could be the true population total payroll in a particular state. Then the ratio estimator, using sample data, is given by
_________________
2 In practice, survey weights are almost never design weights in the sense of being inverse selection probabilities; nonresponse adjustment or imputation (or both) change their properties (see, e.g., Särndal and Lundström, 2005).
where ![]() and
and ![]() are the Horvitz-Thompson estimators of the respective population totals. If there is a substantial correlation between R&D expenditure and payroll size, the ratio estimator may provide a marked improvement over the Horvitz-Thompson estimator.
are the Horvitz-Thompson estimators of the respective population totals. If there is a substantial correlation between R&D expenditure and payroll size, the ratio estimator may provide a marked improvement over the Horvitz-Thompson estimator.
A particular case of the ratio estimator is given for the situation where xj equals 1 if j is in the dth domain and equals zero otherwise, which is referred to as the post-stratified estimator. In this case, letting Nd be the number of population units in the domain (assumed to be known), and letting
![]()
be the sample-based estimate of Nd, the post-stratified estimator can be written as
The post-stratified estimator has improved performance in comparison with the Horvitz-Thompson estimator. However, when the domain sample size is small, the post-stratified estimator can still perform poorly.
Generalized Regression Estimator
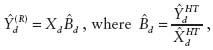
The ratio estimator can be expressed as a special case of the Generalized Regression (GREG) estimator:
![]()
where:
Xd is a vector of known population totals for domain d,
![]() is a vector of Horvitz-Thompson estimates of Xd,
is a vector of Horvitz-Thompson estimates of Xd,
![]() is a Horvitz-Thompson estimate of Yd, and
is a Horvitz-Thompson estimate of Yd, and
![]() is a vector of coefficients (derived from the sample using a particular formula).
is a vector of coefficients (derived from the sample using a particular formula).
This estimator also belongs to a variety called calibration estimators, as the second term here “corrects” (or “calibrates”) the Horvitz-Thompson estimator for Y using known population totals for X.
Note that the estimator for Bd is based on sample data. When the sample size is small, this estimate may be unstable. To address this, one can pool the data over domains to produce a single ![]() The resulting modified direct estimator, known as the survey regression estimator, is expressed as follows:
The resulting modified direct estimator, known as the survey regression estimator, is expressed as follows:
![]()
Gershunskaya illustrated how this estimator might be applied to NCSES R&D data. Let Xim be the known population payroll in industry-type i and state ![]() be the Horvitz-Thompson estimate of payroll in industry-type i and state m,
be the Horvitz-Thompson estimate of payroll in industry-type i and state m, ![]() be the Horvitz-Thompson estimate of payroll, national total for industry-type i, and
be the Horvitz-Thompson estimate of payroll, national total for industry-type i, and ![]() be the Horvitz-Thompson estimate of R&D funds, national total for industry-type i. Then, one can compute
be the Horvitz-Thompson estimate of R&D funds, national total for industry-type i. Then, one can compute
![]()
using national data for industry i in the survey regression estimator to estimate
![]()
Gershunskaya pointed out that, although ![]() in the survey regression estimator is based on a larger sample, the effective sample size still equals the domain sample size. To see why that is so, one can rewrite the survey regression estimator as
in the survey regression estimator is based on a larger sample, the effective sample size still equals the domain sample size. To see why that is so, one can rewrite the survey regression estimator as
![]()
which shows that the survey regression estimator is a sum of the fitted values from a regression model based on predictors from the domain of interest, and it has a bias correction from weighting the residuals again from a regression using data only from that domain. Therefore, the eff-
ciency of the survey regression estimator depends on the variability of the residuals and on the domain sample size.
Gershunskaya then moved to a description of indirect estimators. As she noted earlier, direct sample-based estimators are unbiased (or nearly so) but they may have unacceptably large variances. To overcome this problem, certain assumptions about similarity or relationships between areas or time periods (or both) are made, and these assumptions allow one to use more sample data, thus “borrowing strength.” Her first example of an indirect estimator was the synthetic estimator, which is a sample-based estimator for which the parameters estimated from larger (or combined) domains or from other time periods are applied to a small area. She then discussed the structure-preserving estimator, known as SPREE, and composite estimators.
Synthetic Estimator
To describe synthetic estimation, Gerhsusnkaya began with the usual direct estimate of the sample domain mean from a simple random sample, namely:
![]()
Unfortunately, this estimator can be unreliable if the sample size in the domain is small, so one would want to use the data from the other domains to improve its reliability. One obvious candidate, assuming that means are constant over domains, would be the global average over all domains. The resulting estimator,
![]()
is an example of the synthetic estimator. It is much more stable, but it is very likely to be substantially biased because the assumption of a common mean across domains will rarely hold. If there are auxiliary variables, a more realistic assumption than the assumption of a common mean would be to assume, for example, a common regression slope across domains. Consider again the survey regression estimator:
![]()
This estimator can be depicted as survey regression equals model plus bias correction. The “model” part of the survey regression estimator turns out to be a synthetic estimator,
![]()
To better understand synthetic estimation, consider an R&D example. A synthetic estimator of R&D expenditure in industry type i and state m is
![]()
where ![]() and it is assumed that the common ratio
and it is assumed that the common ratio ![]() of R&D to total payroll holds across all states in industry type i.
of R&D to total payroll holds across all states in industry type i.
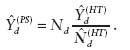
NCSES has already used a similar approach to produce a Survey of Industrial R&D state estimator, which is described in Slanta and Mulrow (2004). For her example, Gershunskaya said, R&D for state m is estimated as
![]()
where
![]()
is the observed sample total for R&D in state m, and ![]() is a prediction of the nonsampled part of the population for R&D in state m, which is computed as
is a prediction of the nonsampled part of the population for R&D in state m, which is computed as
![]()
where Rim is the ratio of payroll in state m to national payroll total for industry i, and
![]()
is a prediction for the nonsampled part of R&D in industry type i. This approach relies on the assumption that in each industry type i, R&D is distributed among states proportionately to each state’s total payroll.
Gershunskaya compared the state estimator from Slanta and Mulrow (2004) with the synthetic estimator based on a common industry slope. For simplicity, Gershunskaya considered the estimator for the whole population, rather than for only the nonsampled part. The Slanta-Mulrow (SM) estimator can then be expressed as
![]()
and the common industry slope estimator can be expressed as
![]()
Both estimators are synthetic estimators and are based on similar assumptions. Notice that in the denominators, the Slanta-Mulrow estimator uses the population total X, and the common industry slope estimator uses the Horvitz-Thompson estimator ![]() of the population total Xi. It might be worth evaluating these two competing estimators using BRDIS data. If indeed R&D is correlated with payroll, the common industry slope estimator may prove to be preferable.
of the population total Xi. It might be worth evaluating these two competing estimators using BRDIS data. If indeed R&D is correlated with payroll, the common industry slope estimator may prove to be preferable.
SPREE
Another synthetic estimator is SPREE, the structure preserving estimator. It is based on a two-dimensional table of estimates, with elements Cim, with one dimension indexed by i and running from 1 to I (e.g., type of industry) and the other dimension indexed by m and running from 1 to M (e.g., state). The Cim here represents the total of R&D funds for all industries of a certain type in a given state. SPREE assumes that initial estimates of individual cell totals, Cim, are available from a previous census or from administrative data, though as such they are possibly substantially biased. This approach also assumes that the sample from a current survey is large enough so that one can obtain direct sample-based estimates for the marginal totals, denoted Yi and Ym. The goal is to estimate the amount of R&D funding for each of the individual cells by updating them to be consistent with the marginal totals. Iterative proportional fitting (also known as raking) is a procedure that adjusts the cell totals Cim so that the modified
table conforms to the new marginal estimates. The revised cell totals are the new small-area estimates.
The implicit assumption is that the relative structure of the table is constant since the last census, that is,

for any combination of indices i, j, k, and l.
In summary, Gershunskaya said, direct estimators are unbiased and should be used when the sample size is sufficient to produce reliable estimates. However, with small samples they have large variances. Synthetic estimators, in contrast, have smaller variances but they are usually based on strong assumptions, and therefore may be badly biased if their assumptions do not hold.
Composite Estimators
Gershunskaya then turned to another type of indirect estimator, composite estimators. They are convex combinations of direct and synthetic estimators, which provide a compromise between bias and variance. They can be expressed as follows:
![]()
The central question in using them is how one should choose the weights nd. One possible approach is to define weights on the basis of sample coverage in the given area, e.g., selecting nd proportional to Nd / Nd. However, this method fails to account for variation of the variable of interest in the area. A second possibility is to use weights that minimize the mean squared error of the resulting estimator. This second method depends on potentially unreliable estimates of the mean squared error of composite parts.
Methods Based on Explicit Models
In contrast to these approaches that are based on implicit models, the final general category of estimators described by Gershunskaya covers methods based on explicit models. Explicitly stated modeling assumptions allow for the application of standard statistical methods for model selection, model evaluation, the estimation of model parameters, and the
production of measures of uncertainty (e.g., confidence intervals, mean squared error) under the assumed model. Methods based on explicit models constitute the core of modern small-area methods.
The most popular small-area methods are based on either the linear mixed model (for continuous variables) or the generalized linear mixed model (for binary or count data). Two types of models are commonly used, area-level and unit-level models. An area-level model (with assumptions pertaining to the aggregate area level) is applied when only area-level auxiliary data are available (rather than auxiliary data for individual units). In this case, direct sample-based estimates play the role of individual data points in the model, with their sampling variances assumed to be known. Generally, area-level models are easier to apply than the unit-level models. One benefit from the application of these models is that they usually take into account the sample design.3
Unit-level models (with the assumptions based on relationships between individual respondents) require different and more detailed information (which is why they are seldom used by statistical agencies) and generally rely on assumptions of independence of units, assumptions that are often violated in clustered survey designs. But if the assumptions for unit-level models are tenable and the unit-level data are available, one would want to use them in place of area-level aggregated models for reasons of efficiency. However, some complications can arise when trying to account for the sample design.
Fay-Herriot Small-Area Model
Fay and Herriot (1979) introduced an area-level model in the context of the estimation of per capita income for small places. The authors used the following set of auxiliary variables: county level per capita income, the value of owner-occupied housing, and the average adjusted gross income per exemption. Fay-Herriot models are often represented using two-level model assumptions, the sampling model and the linking model. The sampling model states that the direct sample estimator estimates the true population parameter without bias and with a certain (sampling) error. The linking model makes certain assumptions (e.g., linear regression relationship) about the true underlying values.
In the Fay-Herriot model, the sample-based estimate is
![]()
_________________
3 However, some areas may not have any sample. If areas are selected into the sample with unequal probabilities related to the true area means, bias may occur as a result.
that is, the sum of an expected value plus an error term with zero mean and with its variance equal to the sampling variance of the direct sample estimate. The linking model for the mean can be written as
![]()
This equation indicates that the mean of the sample estimate is expressed as a linear combination of the auxiliary variables ![]() plus a model-error, Vd, having mean zero and a constant variance, with the model error independent of the sampling error. The entire model can then be expressed as
plus a model-error, Vd, having mean zero and a constant variance, with the model error independent of the sampling error. The entire model can then be expressed as
![]()
which is a linear mixed model since it has both fixed and random effects. Under this model, the best unbiased linear estimator (in a certain well-defined sense) for ![]() has a composite form, as follows:
has a composite form, as follows:
![]()
where
![]()
A is the variance of the random term in the linking model, and Vddirect is the sampling variance, which is assumed known. The above composite form shows that the direct estimates are shrunk toward the synthetic part, where the smaller A is (i.e., the better the linking model explains the underlying relationship), the more weight goes to the synthetic (i.e., model-based) part. Similarly, areas with estimates with larger sampling variances also have more weight allotted to the synthetic part.
R&D Example
Gershunskaya then provided an example to show how one might produce small-area estimates of R&D funds for small domains defined by states and industry types. Let ![]() be a direct sample-based estimator for R&D in industry i and state m from BRDIS. The direct sample estimator provides unbiased measurement of the unobserved truth
be a direct sample-based estimator for R&D in industry i and state m from BRDIS. The direct sample estimator provides unbiased measurement of the unobserved truth ![]() with some random error:
with some random error:
![]()
The assumption is that ignoring an error term, the state-level R&D funds in industry type i are proportional to the state’s total payroll, which can be expressed as
![]()
The resulting small-area estimator can be written as
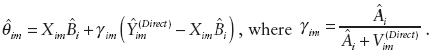
Estimation of Bi and Ai are straightforward from the data. (A cautionary note: this application differs from the formal Fay-Herriot model since the variances of ![]() must be estimated and can be inaccurate if they are based on small sample sizes.)
must be estimated and can be inaccurate if they are based on small sample sizes.)
Unit-Level Small-Area Modeling
An example of a unit-level model is a small-area model of areas planted with corn and soybeans for 12 Iowa counties (Battese, Harter, and Fuller, 1988). The survey data consisted of Ydj, the number of hectares of corn (or soybeans) per segment j in county d. The auxiliary variables, collected by satellite, were x1,dj, the number of pixels planted with corn per segment j in county d, and x2,dj, the number of pixels planted with soybean per segment j in county d. The model considered in the paper is called the nested-error regression:
![]()
where the error terms are independent. The resulting small-area estimator is
![]()
where
Note that the larger the sample size of an area, the more relative weight is placed on the sample part of the weighted average. The regression coefficients and the error variances are easily estimated from the data. Both the Fay-Herriot and the Battese, Fuller, and Harter models are examples of linear mixed models, Gershunkaya noted.
Smoothing Over Time
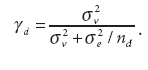
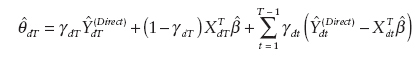
None of the models presented so far examined the potential from use of the dependent variable collected from previous time periods. This is extremely relevant for R&D statistics, Gershunskaya said, since many of the surveys and censuses used as inputs for National Patterns have a relatively long, stable, historical series, often going back to the 1950s. As an example of a small-area spatial-temporal model, Gershunskaya described the results in Rao and Yu (1994). For areas d = 1, …, D and time periods t = 1, …, T, assume that
![]()
where the udt are random error terms that follow a first-order autoregressive process. In this case, a good small-area estimator (for the current period) is a weighted sum of the synthetic estimator for the current period and model residuals from the previous time periods, namely,
Modifcations for Discrete Dependent Variables
Gershunskaya then briefly discussed models for discrete dependent variables. The most common case is when yd is a binary variable. Assume that the quantity of interest is the small-area proportion
![]()
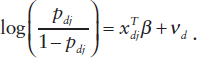
Then one can formulate an area-level Fay-Herriot-type model using direct sample-based estimates of proportions. However, the area-level approach has shortcomings, one of which is that some areas may have no sample units reporting R&D and thus will be dropped from the model. A unit-level generalized linear mixed model may be more efficient in this case. Assume
that ydj is 1 with probability pdj and 0 with probability 1 – pdj; then the standard model in this situation has the following form:
Implementing Small-Area Modeling for National Patterns
Gershunskaya then indicated how NCSES could develop explicit small-area models using the National Patterns datasets. She first considered a unit-level model scenario. Assume that wages, employment, and possibly other covariates are obtained from administrative data for all businesses in the target population. Using sample data, one could establish a relationship between R&D funding and auxiliary variables by fitting the parameters of some explicit model. One could then apply the results of this model fitting to the prediction of R&D in the nonsampled part of the above models. However, because there is no explicit question on state-by-industry R&D in the BRDIS questionnaire, a proxy for it would have to be derived. (Although possible, it would currently be a laborious effort.) In such modeling, it would be important to account for the sample design in the variance estimation, which is a serious complication.
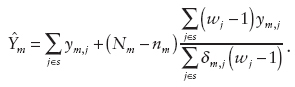
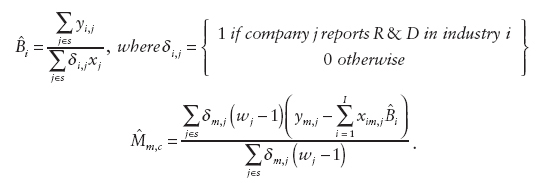
The second scenario proposed by Gershunskaya was for an area-level model. Here a current design-based ratio or regression estimator (or other area-level predictor(s), e.g., “true” population values available from an administrative file) could be used in the synthetic part of the composite estimator. It would also be useful to consider alternative direct estimators of R&D that could be used in the area-level model, Gershunskaya said, and she outlined a few possibilities of improved direct estimators (based on the theory developed by Sverchkov and Pfeffermann, 2004). Let ![]() be 1 if company j reports R&D in state m, and 0 otherwise. If one does not have auxiliary information, an alternative direct sample estimator is
be 1 if company j reports R&D in state m, and 0 otherwise. If one does not have auxiliary information, an alternative direct sample estimator is
As an analogue of the ratio estimator, using company’s payroll xj or some other auxiliary variable (possibly payroll per employee), a modified form of the previous alternative direct sample estimator can be defined as
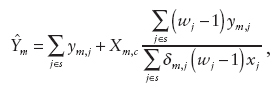
where Xm,c is the total payroll in the nonsampled portion of state m. Finally, as an analogue of the modified direct estimator,
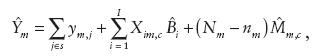
where
Final Considerations and Discussion
Gershunskaya concluded her review of small-area estimation methods with a set of important considerations:
• It is important to plan for estimation for domains of interest at the design stage to ensure that one has direct estimates of some reliability to start off.
• Finding a set of good auxiliary variables is crucial for success in small-area modeling.
• Small-area estimation methods are based on assumptions, and therefore evaluation of the resulting estimates is vital.
• Using a statistical model supports a systematic approach for a given problem: (a) the need for explicitly stated assumptions, (b) the need for model selection and checking, and (c) the production of measures of uncertainty.
• It is important to account for the sample design (unequal probabilities of selection and clustering effects) in the model formulation and fitting.
Joel Horowitz pointed out that these models have a long history, and there are methodologies that have been developed that avoid the assumption of linearity or proportionality and that can accommodate estimation errors in the predictors. Gershunskaya agreed that there were non parametric models that had such properties. She said that her presentation was already detailed and therefore some complicated issues could not be included. Eric Slud added that the sample survey context made some of this particular application more difficult than in the literature that Horowitz was referring to. Slud added that the key issue in applying these techniques is finding predictive covariates. Often, one is restricted to synthetic variables, often measured in more aggregated domains.
Another topic that emerged during the floor discussion was whether there were likely to be productive predictors available in this context. Slud said that clearly there were opportunities to use synthetic variables by using information at higher levels of aggregation. However, the availability of useful predictors at the respondent level was less clear and would be known only by subject-matter researchers conducting some exploratory data analysis.
John Jankowski said that one of NCSES’s highest areas of concern in terms of data presentation is the state and subnational distribution of R&D activity. He added that the business sector is the one for which this is most relevant. He said that a small firm in Massaschusetts sampled in BRDIS could have a weight of 250 so the resulting direct small-area estimates would likely be unreliable, but he noted that the Slanta and Mulrow (2004) paper was successful in reducing the magnitude of that problem. However, it could not address the small-area distribution by industrial category because in the Survey of Industrial R&D for the distribution of R&D by industry sector the funds were just assigned to the major industry category. Now, however, BRDIS has the entire distribution of R&D by industry sector and so there is a great deal more potential for the use of small-area estimation. Jankowski added that BRDIS also provides the geographic distribution of such funds. Even though geography and industrial sector are not simultaneously available, he said that it might now be possible to produce such estimates through some hard work, though it is not certain. Jankowski added as things stand now, if there is a large R&D-performing company that is 51 percent in one category and 49 percent in another, 100 percent would be assigned to the first category, and users would notice that. New technology gives us a chance to better distribute those funds to industrial categories.
Christopher Hill was concerned that if the National Science Foundation provided small-area estimates, there would be situations in which experts in R&D funding would know that the estimates are incorrect because they have local information. Slud responded that this is the case for every set of
small-area estimates. When such situations occur, they should be seen as opportunities to improve either the quality of the input data, the form of the model, or the variables included in the model. Many participants noted that model validation is an important part of the application of these techniques. Jankowski added that it would be unclear the form in which such estimates would be made publicly available.
Slud pointed out that prior to application of this methodology, it is important to explore how sensitive the results are to the model assumptions, which depends on the relative size of the sampling errors to the others that one might be able to quantify. Karen Kafadar pointed out that one advantage with this methodology is that since you get standard errors for your estimates, you can compare your estimates with ground truth and know whether they are or are not consistent.
MEASUREMENT ERROR OR DEFINITIONAL VAGUENESS
As noted above, an issue that arose during the workshop concerned the need to better understand sources of error underlying NCSES survey and census responses. Survey data are subject to sampling error and non-sampling error, with nonsampling error often decomposed into nonresponse error and measurement error. As is almost always the case for survey estimates, NCSES does not have a complete understanding of the magnitude of nonsampling error. Several participants suggested that it would be beneficial for NCSES to investigate this topic, possibly through greater use of reinterviews or comparison of survey and census responses with administrative records (see section on STAR METRICS in Chapter 4).
In particular, several participants pointed out that it would be important to distinguish between true measurement error, that is, when the total R&D funding level is misreported, and differences in interpretation, for example, in distinguishing between what is applied research and what is development. It was suggested this issue could be addressed through the use of focus groups and other forms of cognitive research. Or a subsampling study could be carried out in which answers subject to possible definitional vagueness could be followed up and resolved. However, several participants acknowledged that such a study would be expensive and labor intensive.


