
Evaluating Progress in Promoting Health Equity: A Review of Methods and Tools for Measurement1
Why: Why promote equity in access to health-promoting resources and environments and reduce disparities in health outcomes when evaluating obesity prevention efforts? Avoidable disparities exist in various populations (defined by economic, racial/ethnic, regional, or other strata) across the United States. Achieving health equity is critical to addressing obesity disparities insofar as it assures that everyone has a fair opportunity to attain their full health potential with equal access to available care and community resources for equal need, equal utilization for equal need, and equal quality of care for all.
What: What can be done through evaluation to promote health equity? To address these challenges, measurement tools and research methods for assessing individual, diet, physical activity, and the environments should be culturally appropriate and include variables characterizing social advantage and disadvantage. Additionally surveillance systems need to take into account the varied environments for obesity prevention and control. One opportunity to do so is available via the National Collaborative on Childhood Obesity Research (NCCOR), which has developed a registry (NCCOR-R) to encourage the consistent use of common tools and research methods across childhood obesity research and prevention programs at the individual, community, and population levels. This chapter provides a detailed review of NCCOR-R tools and available methods and identifies gaps in the current surveillance systems, with particular attention to obesity disparities.
_____________
1 This summary does not include references. Citations to support statements made herein are given in the body of the report.
How: How should effective evaluation and surveillance be accomplished to track progress in promoting health equity? Obesity disparities can be addressed across the five environments recommended in the Accelerating Progress of Obesity Prevention report (IOM, 2012). Although the indicators to measure are the same (see Chapter 4), there are gaps that need to be addressed including a paucity of tools and evaluation methods tailored to specific racial ethnic groups, a lack of consistency in defining and operationalizing core variables that are associated with social advantage and disadvantage, and a variety of surveillance challenges (small numbers, lack of attention to language and culture, and lack of surveillance infrastructure).
Although the general population has seen increases in obesity, increases have been most pronounced across various racial/ethnic groups and socially disadvantaged populations, beginning in early childhood and continuing into adulthood (Dixon et al., 2012). These disparities, as defined by Whitehead (1992), are unnecessary and avoidable and are also considered unfair and unjust. Disparities are further defined by Braveman (2006) as “potentially avoidable differences in health (or in health risks that policy can influence) between groups of people who are more and less advantaged socially; these differences systematically place socially disadvantaged groups at further disadvantage on health” (Braveman, 2006, p. 180). Achieving health equity is critical to addressing obesity disparities insofar as it assures that everyone has a fair opportunity to attain their full health potential with equal access to available care and community resources for equal need, equal utilization for equal need, and equal quality of care for all (Braveman et al., 2011a,c; Whitehead and Popay, 2010).
Achieving health equity is a goal of Healthy People 2020 (HHS, 2010), which tracks the elimination of health disparities in the U.S. population in relation to several demographic factors: race and ethnicity, age, sex, sexual identity and orientation, disability status or special health care needs, and geographic location (rural and urban) (Koh, 2010; Koh et al., 2011; Riegelman and Garr, 2011). Tracking obesity rates among populations at risk also requires an understanding of how dimensions of disparities (e.g., sociocultural, socioeconomic, living conditions, life course) might impact obesity progression. Tools and methodologies that accurately capture these influences need to be relevant to the specific environments targeted for obesity prevention and control (e.g., physical activity, food and beverage, message, health care/worksite, school/early childhood environments2) (IOM, 2012).
The National Collaborative on Childhood Obesity Research (NCCOR) developed a registry to encourage “the consistent use of common (tools) and research methods across childhood obesity prevention and research at the individual, community, and population levels” (NCCOR, 2013). The NCCOR Registry (NCCOR-R), which was launched in 2011, includes a searchable database of obesity-related measurement tools and methodologies used in published papers that enable researchers to select instruments based on population, environment, and other descriptive properties. The description of the measurement tools and methodologies is derived from information abstracted from the published papers.
_____________
2 Child care was not an environment explicitly identified by the Accelerating Progress in Obesity Prevention report (IOM, 2012), but strategies related to child care were included within the five environments. This Committee added aspects related to the child care environment to the school environment.
These tools and research methods from the NCCOR-R assess individual diet and physical activity, as well as the environments in which these behaviors occur. It is the only existing registry related to measuring obesity and related environments, programs, and systems (developed with a focus on children).3
This chapter builds on the indicators identified in Chapter 4 and underscores the importance of the methods and tools for assessing individual behaviors and changes to diet, physical activity, and the environments should be culturally tailored and include variables that characterize social advantage and disadvantage (called in this chapter “dimensions of disparities”). Although the indicators of progress identified in Chapter 4 do not differ for various populations, the methods and tools for assessing populations with disparities should. The rest of this chapter (1) assesses the NCCOR-R for tools and methods appropriate to track and evaluate disparities in rates of obesity between population subgroups; (2) reviews the extent to which these tools and methods address social and other environmental influences of health disparities, in addition to behavioral determinants; and (3) identifies existing gaps in capacity to track progress in preventing obesity among disadvantaged groups. This chapter offers a compilation of tools and methods available for use, with particular attention paid to obesity disparities, and calls attention to the opportunities that exist with the NCCOR-R to encourage the use of common tools research methods and the gaps that remain.
DEFINING WHO, WHAT, AND WHERE: ESSENTIAL DEFINITIONS
The pathways for addressing modifiable factors across environments targeted for obesity prevention require an understanding of two important concepts: robust measurement tools and research methods appropriate for disadvantaged populations, and knowledge of the multiple social influences on obesity-related disparities (Braveman et al., 2011c; Lovasi et al., 2009). The following sections define three of these components, designed to answer who to assess (the disadvantaged populations at risk for obesity disparities); what to assess (dimensions and constructs of health disparities, equity); and where to assess (environments targeting obesity prevention). Figure 5-1 depicts a model for organizing, identifying, and assessing tools and methods of disparity and health equity identified in the NCCOR-R and depicts the relationships and interactions among and across these components. It offers a way to understand and organize the “who” (populations at risk for disparities), the “what” (the dimensions that can be improved and evaluated), and the “where” (environments that target obesity prevention efforts, as recommended in the Institute of Medicine (IOM) Accelerating Progress of Obesity Prevention (APOP) report (IOM, 2012). These components are detailed in this section.
Who to Assess: Disadvantaged Populations at Risk for Obesity Disparities
This section reviews targeted populations at risk for obesity, as defined by Healthy People 2020 criteria (HHS, 2010). Each of these populations and their relevance to obesity disparities and health equity is described below.
_____________
3 See limitations of this review in Appendix E.
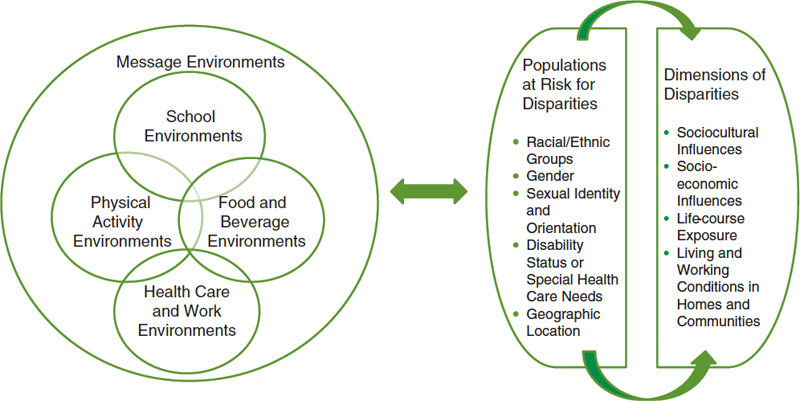
Figure 5-1 Model for understanding the relationship and interaction among and across those who are at risk for disparities and environmental, policy, and social determinants (environments, dimensions) of disparity, health equity, and risk of obesity.
Racial Ethnic Disparities
Racial and ethnic disparities in obesity are well documented (IOM, 2012). Racial and ethnic disparities begin in early childhood, as evidenced by the fact that in 2009-2010 Hispanic (21 percent) and non-Hispanic black (24 percent) children and adolescents had higher rates of obesity than non-Hispanic white children and adolescents (14 percent) (Ogden et al., 2012). In 2010, the highest prevalence in children aged 2-4 years was among American Indian or Alaska Natives (21.1 percent) and Hispanic (17.6 percent) children (Dalenius et al., 2012). Other studies among Hawaiian-Pacific Islanders report Samoan children also have a high prevalence of obesity (17.5 percent in 1-year-olds and 27 percent among 2- to 4-year-olds vs. 2.3 percent in 1-year-old Asians and 7.3 percent among black 2- to 4-year-olds) (Wang, 2011). These obesity disparities track into adulthood: non-Hispanic black adults exhibit the highest age-adjusted rates of obesity (49.5 percent) compared with Mexican Americans (40.4 percent), all Hispanics (39.1 percent), and whites (34.3 percent) (Flegal et al., 2012).
Sex Disparities
Between 1988-1994 and 2007-2008, obesity increased more among boys than girls (Wang, 2011). Among boys aged 2-19 in 2003-2009, Mexican Americans had the highest combined prevalence (40.5 percent vs. 34.5 percent in whites and 32.1 percent in African Americans) (Wang, 2011). In girls, African Americans had the highest prevalence (44.5 percent vs. 31.7 percent in whites and 37.1 percent in Mexican Americans) (Wang, 2011). Among children grades 3-5 in seven American Indian communities, 26.8 percent of American Indian boys and 30.5 percent of American Indian girls were found to be obese (Caballero et
al., 2003). Although in 2009-2010 there were no differences in age-adjusted mean body mass index (BMI) between U.S. men and women, the rate of increase over the 12-year period since 1999 was significant only for men (Flegal et al., 2012).
Sexual Identity and Orientation
Some studies have documented disparities in overweight adversely affecting lesbian women (Boehmer et al., 2007). Boehmer and colleagues (2007) reported higher rates of overweight and obesity when comparing lesbian to heterosexual women (69.5 percent to 50.3 percent, respectively), but not among bisexual women (51.5 percent). However, in the Nurses’ Health Study, Jun and colleagues reported both lesbian and bisexual women were more likely than heterosexual women to experience adverse-weight-gain trajectories (Jun et al., 2012). Other studies among gay men reported more than 50 percent being either overweight or obese and cite a need to address these health concerns among this high percentage risk group (Guadamuz et al., 2012).
Disability Status or Special Health Care Needs
Obesity rates for children with disabilities are 38 percent higher than for children without disabilities (NCBDDD, 2012). Among youth, there is a higher prevalence of being overweight among children and adolescents with spina bifida, cerebral palsy, Down syndrome, and autism (Hurvitz et al., 2008; Matson et al., 2011; Rimmer et al., 2011; Simeonsson et al., 2002). For example, adolescents with autism and Down syndrome were two to three times more likely to be obese than adolescents in the general population; obesity among adolescents with physical and cognitive disabilities (17.5 percent) is significantly higher than among adolescents without disabilities (13.0 percent) (Rimmer et al., 2010, 2011). Obesity among adults with disabilities is higher among women than among men (46.9 percent vs. 35.2 percent) (Armour et al., 2012).
Geographic Location (Rural/Urban)
Overweight and obesity varies by urban versus rural geographic location: 9 of the 10 states with the highest rates of obese children are in the South (Bethell et al., 2009; Levi et al., 2012). There is also evidence that rural children are more likely than urban children to be obese; more than one-third of children in both large (34.6 percent) and small rural areas (35.2 percent) had a BMI at or above the 85th percentile for their age and sex, compared to 30.9 percent of urban children (National Survey of Children’s Health, 2011). Among children in large rural areas, 46.3 percent of those in poverty were overweight or obese, compared to 23.7 percent of those with household incomes above poverty level (National Survey of Children’s Health, 2011). National studies of adults show similar urban-rural differences in obesity prevalence (Befort et al., 2012; Jackson et al., 2005; Patterson et al., 2004).
What to Assess: Dimensions of Health Disparities, Equity, and Obesity
Measurement tools and methods to describe the dimensions of disparity are important to understanding obesity prevalence among disadvantaged populations. Braveman and colleagues pointed to upstream dimensions that characterize social advantage and disadvantage, and have particular relevance in assessing and understanding obesity disparities among high-risk populations (Braveman et al.,
2011a,b). Sociocultural and socioeconomic influences, living and working conditions, and timing or life course exposure to disadvantage, described below and represented in Figure 5-1, are important to operationalize and to measure if they are to explain accurately the behavioral pathways to obesity disparities such as differential food consumption and physical activity patterns.
Sociocultural Influences
For this section, relevant markers of the sociocultural domain include racism and discrimination, stress and social support, culture and acculturation (Braveman, 2006, 2009; Chakraborty and Chakraborty, 2010). Racism is defined by intentionally discriminatory actions and attitudes as well as those embedded in societal structures that systematically constrain opportunities and resources based on race or ethnic group (Flaskerud and DeLilly, 2012; Williams and Sternthal, 2010). Racial discrimination can influence health through pathways causing lower levels of socioeconomic status, residential segregation, and chronic stress related to racial/ethnic bias (Flaskerud and DeLilly, 2012; Williams and Sternthal, 2010). In contrast, social support and cohesion are assets that may ameliorate stress, promote resilience, buffer negative sequelae, and improve health outcomes (Davies et al., 2011; Gee and Payne-Sturges, 2004). Issues of culture and acculturation are also important given the rise in U.S. immigration and obesity prevalence. Oza-Frank and Cunningham (2010) found a significant, positive relationship between BMI and duration of residence of immigrants in the United States. Perspectives of body image and weight also vary by culture (Bennett and Wolin, 2006). Acculturation, the process by which immigrant populations adopt the attitudes, values, customs, beliefs, and behaviors of a new culture, may also explain obesity disparities among certain racial ethnic groups (Chakraborty and Chakraborty, 2010; Das, 2013; Perez-Escamilla, 2011; Perez-Escamilla and Putnik, 2007).
Socioeconomic Influences
Several studies show that education or occupation, as markers of economic resources and of prestige or social standing, define numerous risks for obesity (Kawachi et al., 2005; Williams and Sternthal, 2010). Income (monetary earnings during a specified time period) and wealth (accumulated material assets such as ownership or the value of one’s home) also have important influences to consider. Racial/ethnic differences in income may markedly underestimate differences in wealth as important to understanding disparities (Wolff et al., 2010; Woolf and Braveman, 2011). Tools and methodologies that address these constructs with detail and sensitivity are needed to adequately understand the depth of economic influences on disparities.
Food insecurity may mediate socioeconomic influences on obesity. A household is “food secure” if it has access at all times to enough food and “food insecure” if it has difficulty getting enough food because of a lack of resources. As the rate of poverty in the United States has increased in recent years (DeNavas-Walt et al., 2012), so too has the proportion of households experiencing severe food insecurity (Coleman-Jensen et al., 2012). Low-income, ethnic-minority, and female heads of households experience the greatest risk of food insecurity (Nord et al., 2009). Food insecurity may provoke changes in dietary habits: reduced food intake, reduced diet quality, and increased meal skipping (USDA, 2013). Paradoxically, food insecurity also may increase obesity risk, particularly among women; research has less consistently shown a relationship between food insecurity and weight status among children, adolescents, and men (Franklin et al., 2012; Larson and Story, 2011).
Living and Working Conditions
The availability and quality of services such as medical care, schools, or employment opportunities, can reinforce socioeconomic and racial/ethnic disparities in obesity (Braveman, 2012). Disparities can also be affected by physical conditions related to adequate housing, air and water quality, public transportation, and street connectivity or density (Braveman et al., 2011a,b; Lovasi et al., 2009; Woolf and Braveman, 2011). For this section, the quality of the built environment, and physical form of communities, are assessed as having direct influence on physical activity and other behaviors associated with the prevention and control of obesity. Functional markers include elements of walking surface, streets, traffic; safety, characterized by personal elements; aesthetic, characterized by traffic streetscape; and destination, characterized by views and facilities (Brownson et al., 2009).
Exposure Over the Life Course
The duration of time one spends growing up in deprived physical environments, with poor access to food and activity, is likely to have significant impact on obesity outcomes (Dixon et al., 2012). Childhood disadvantage has been associated with increased risk of obesity from childhood through adulthood, and those who are disadvantaged across the life course are at highest risk (Coogan et al., 2012). The concept of weathering, defined as the cumulative burden of adverse psychosocial and economic circumstances on the physical health of minority populations, has been associated repeatedly with adverse health risks among African American women and men (Das, 2013; Love et al., 2010). Historical trauma endured by American Indian and Alaskan Native populations over multiple generations is also associated with negative physical and health consequences (Evans-Campbell, 2008). Measurement of life course exposure to disadvantage is needed to understand and intervene on pathways that will help to promote health equity (Evans-Campbell, 2008; Huff and Kline, 1999).
Where to Assess: Environments Targeting Obesity Prevention
The five critical environments for policy and related interventions identified in the APOP report (IOM, 2012) reflect a systems perspective in recognition of where people spend their time and how that can influence their intake, activity, and weight. These five environments, abbreviated in Figure 5-1, serve as the basis for tracking progress in meeting recommendations, goals, and actions to address obesity, prevent disparities, and promote health equity.
Physical Activity Environment
Identification of any inequitable distortion of resources that may be promoting disparities in physical activity requires tools and research methods to measure the physical environment and is important for public policy (Gordon-Larsen et al., 2006). For this chapter, the physical activity environment as an indicator was defined by community or home settings, reflecting key tools and methods defined by Brownson et al. (2009). These are summarized across three categories: (1) perceived tools and methods obtained by telephone interview or self-administered questionnaires; (2) observational tools and methods obtained using systematic observational methods (audits); and (3) archival data sets that are often layered and analyzed with geographic information systems (GIS).
Food and Beverage Environment
Access and availability to healthful foods is an important component of a quality food environment and may contribute to obesity disparities (Glanz et al., 2005, 2007). McKinnon and colleagues (2009) suggest the importance of tools and methods that assess places where food can be purchased including food stores, restaurants, worksite cafeterias, and schools. In addition, this chapter assesses methods of measuring quality of foods within the community and home setting.
Message Environment
Marketing strategies that encourage excess consumption of food or discourage physical activity may contribute to disparities in the predisposition of people to gain weight (Glanz et al., 2012; Grier and Kumanyika, 2008). For this chapter, indicators of the message environment are measured by duration and frequency of exposure to marketing/advertisements and by packaging (including the effects of package design and package-based claims) (Chandon and Wansink, 2012).
Health Care and Work Environments
Health care and work environments affect most people, are often interconnected, and can directly influence disparities among populations with obesity (Archer et al., 2011). For this review, methods for measuring the health care and work environments focused on settings that include opportunities for health screenings, intervention by health care providers, the presence of employer-based wellness programs, and other components of a supportive food and physical activity environment in the worksite.
School and Early Child Care Environments
Schools and early child care settings provide venues for reaching nearly all children across the country. Structuring these educational environments to assure access to healthy food and adequate physical activity is crucial to preventing and controlling childhood obesity among high-risk populations (Gittelsohn and Rowan, 2011). For this review, the Committee evaluated tools and methods targeting the school and child care settings.
Tools and Methods for Assessing Progress in Obesity Prevention Targeting Populations with Health Disparities
The following table (see Table 5-1) presents findings for tools and methods for populations of risk or sources of social influence organized by the five environments targeting obesity prevention. The methodology for reviewing and identifying the tools and methods is summarized in Box 5-1. A summary of the findings and more detailed information for each individual tool and method is provided by environment in Appendix E.
TABLE 5-1 Summary of the Number of National Collaborative on Childhood Obesity Research Registry (NCCOR-R) Tools and Methodsa by Environment Targeting Obesity Prevention Efforts for Populations at Risk of Obesity and Social Influences
| Population/Social Influence | Environment | Number of NCCOR-R Tools and Methods by Subpopulation | ||||
| Physical Activity | Food and Beverage | Message and Media | Worksite/ Health Care | School/ Early Childhood | ||
| Racial/Ethnic | ||||||
|
African American |
1 | 13 | 3 | 0b | 1 | 18 |
|
AI/AN only |
1 | 0 | 0 | 0 | 2 | 3 |
|
Hispanic only |
2 | 1 | 1 | 0 | 0 | 4 |
|
Hawaiian/Pacific only |
0 | 0 | 0 | 0 | 0 | 0 |
|
Asian only |
0 | 0 | 0 | 0 | 2 | 2 |
|
Multi-ethnic |
1 | 2 | 0 | 0 | 1 | 4 |
|
Multi-ethnic (Caucasian and other ethnic populations) |
59 | 31 | 3 | 2 | 21 | 116 |
| Sex | ||||||
|
Female only |
6 | 4 | 0 | 0 | 4 | 14 |
|
Male only |
0 | 1 | 0 | 0 | 0 | 1 |
|
Male/Female |
47 | 14 | 2 | 1 | 13 | 138 |
|
Sexual Identity/Orientation |
0 | 0 | 0 | 0 | 0 | 0 |
|
Disability/Special Health Care Needs |
1 | 0 | 0 | 0 | 0 | 1 |
| Geographic Location | ||||||
|
Rural only |
0 | 1 | 0 | 0 | 0 | 1 |
|
Urban only |
36 | 30 | 8 | 2 | 15 | 91 |
|
Rural and urban |
10 | 7 | 0 | 0 | 0 | 17 |
| Social Influences | ||||||
|
Sociocultural variables |
1 | 1 | 1 | 0 | 4 | 7 |
|
Socioeconomic variables |
0 | 10 | 0 | 0 | 0 | 10 |
|
Living and working conditions |
53 | 45 | 7 | 2 | 16 | 123 |
|
Duration of exposure |
1 | 0 | 0 | 0 | 0 | 1 |
| Total Number of NCCOR-R Tools and Methods Identified by Environmentc | 65 | 51 | 8 | 2 | 48 | Total: 174 |
a NCCOR-R contained 893 tools and methods at the time of review (January 2013). Exclusionary criteria applied: prior to 1998; individual tools and methods of dietary intake or physical activity; surveillance tools and methods. After applying exclusionary criteria, each tool and method was categorized by targeted population(s) (e.g., race/ethnicity, sex, sexual identity, disability, geographic location) and social determinants (e.g., sociocultural variables, socioeconomic variables, living and working conditions, duration of exposure). Each tool or method could apply to multiple populations at risk of obesity and social influences (e.g., one tool or method could apply to African American women in urban areas).
b All 0 indicates factor was not reported in tools and methods found in the registry.
c Total number of tools and methods identified for populations at risk of obesity, characterized by environment.
NOTE: AI/AN = American Indian/Alaskan Native.
SOURCE: National Collaborative on Childhood Obesity Research Registry (http://www.nccor.org/projects/measures/index.php, accessed November 11, 2013), as of January 2013.
BOX 5-1
Methodology of Review of National Collaborative on Childhood Obesity Research Registry (NCCOR-R) for Identifying Tools and Methods for Assessing Progress in Obesity Prevention Targeting Populations with Health Disparities
Overview: NCCOR-R is a Web-based tool updated on an ongoing basis. At the time of this review, it contained 893 tools and methods. The tools and methods can be categorized around four filter options: domains (individual dietary behavior, food environment, individual physical activity behavior, physical activity environment); type (geographic information systems, 24-hour dietary recall or food frequency, electronic monitor, environmental observation, questionnaire, record or log, other); age (2-5 years, 6-11 years, 12-18 years); and context (metro/urban, small town/rural) (NCCOR, 2013). NCCOR-R focuses only on tools and methods relevant to children but notes if one also pertained to adults.
Exclusionary/Inclusionary criteria for identifying tools and methods within NCCOR-R targeting populations with health disparities: exclusionary criteria included individual tools and methods of dietary intake or physical activity (e.g., 24-hour dietary recalls, food frequency tools and methods, or actigraph) and surveillance tools and methods because Accelerating Progress in Obesity Prevention (APOP) recommendations focus on environmental and policy changes. [Individual tools and methods are the focus of other reviews (Brownson et al., 2004, 2009; McKinnon et al., 2009)]. Inclusionary criteria included domestic and global tools and methods from 1998 to the present. Individual tools and methods that focused on individual perceptions related to sociocultural influences (e.g., perceptions of culture, body image) were included. A secondary search was performed using key words for dimensions of influence (e.g., sociocultural and socioeconomic influences) to identify any tools and methods that may have been missed.
GAP ANALYSIS4
Evaluation Challenges
The Committee identified several gaps in measurement tools and methods that limit the ability of evaluation users to monitor and evaluate progress in preventing obesity among disadvantaged groups:
1. Tools and methods combining racial ethnic groups comprise the majority of available instruments. These tools and methods, analyzed by subpopulation of interest, are not sensitive to differences in language and culture and may result in inaccurate data collection and/or interpretation of findings. As a result, few NCCOR-R tools and methods are tailored to specific
_____________
4 This summary does not include references. Citations to support statements made herein are given in the body of the report.
Tools and methods meeting inclusionary criteria were
1. Identified for the five environments as recommended in the APOP report (physical activity, food and beverage, message, health care and work, school). Each tool and method was placed in only one of the critical environments (priority of focus) to avoid duplication.
2. Assessed for use with populations at risk for disparities. Key words were used for each racial ethnic group (African American, Hispanic, American Indian and Alaskan Natives, Asian Americans, Hawaiian and Pacific Islanders), sex (female, male), disability, sexual identity of orientation, or geographic region (rural, urban).
3. Reviewed (based on provided descriptive information found on NCCOR-R website) using these questions:
• What is the level of focus of the tool or method (e.g., individual, community, policy)?
• What is the purpose of the tool or method?
• What is the population of focus?
• Did the tool or method include variables reflecting dimensions of disparities as defined in this chapter?
• What are the properties of the tool or method (e.g., number of items, method of delivery)?
• What is the sample size with which the tool or method was used?
• What were the psychometric properties?*
4. Detailed and summary tables were populated with the relevant information (see Appendix E). Two independent reviewers verified the coding of information.
______________
* Psychometric properties are quantifiable attributes that relate to the statistical strength or weakness of data collected.
racial and ethnic groups, despite risks for obesity disparities. There are no tools or methods identified for Hawaiian Islanders and few specific to the cultural differences of Hispanics, American Indians/Alaskan Natives, and Asian Americans. A majority of tools and methods for African Americans are derived from one study conducted a decade ago (Story et al., 2003).
2. Most available tools and methods fail to identify the importance of male-female differences (sex and gender) as a distinguishing factor in obesity.
3. Tools and methods commonly available for urban populations often have little relevance to rural populations, a population for whom NCCOR-R contains few specific tools and methods.
4. Of significant concern is the paucity of appropriate tools and methods found in NCCOR-R for populations with disabilities or special needs, or sensitive to sexual identity or orientation.
These gaps in measurement instruments limit the ability to interpret or understand causes of obesity disparities among these high-risk populations, suggesting they are at continued risk of an obesity burden. To understand the independent and interacting factors contributing to obesity in these high-risk populations, we must ensure availability of sensitive and relevant tools and methods for all disadvantaged populations that recognize and seek to understand these differences.
Another gap is the lack of consistency in defining and operationalizing core constructs associated with disparities. The extensive literature available on disparities and health equity provides broad conceptual perspectives from which to derive constructs and definitions (Braveman et al., 2011c; Koh, 2010; Koh et al., 2011; Whitehead and Popay, 2010). The Committee’s review of measurement tools and methods built on constructs and indicators identified and operationalized from the literature and from the APOP and other IOM reports (see Chapter 4). This approach is critical to understanding the context within which obesity disparities and other health disparities develop and are perpetuated. The vast majority of tools and methods found addressed the construct of living and working conditions, defined by attributes of the physical environment and reflecting the work of several published reviews of the area (Brownson et al., 2009; McKinnon et al., 2009). In contrast, few tools and methods targeted disparities in relation to socioeconomic (e.g., wealth) or sociocultural influences (e.g., racial discrimination, acculturation), at least as defined by our review. It was more likely that these constructs were identified as study covariates, that is, confounding variables to be controlled in the design or analysis, but not often as sensitive content included in tools and methods of interest in analyzing causal influence or evaluating differential outputs, outcomes, or impact of interventions. Of particular concern was the lack of tools and methods or content describing life course exposure to social and economic advantage and disadvantage, a critical element in understanding disparities. This inconsistency in what to measure, and how to measure, further complicates and confuses interpretation of findings relevant to understanding and assessing progress in obesity disparities. Systematic inclusion of consistently defined variables is needed to better identify tools and methods, interpret findings, and understand the pathways to preventing disparities and achieving health equity.
Additional work is needed to assure the psychometric quality of disparities-related tools and methods. Reports of psychometric testing varied across the current NCCOR-R tools and methods. Among those reporting psychometric properties, few cited tools and methods with both reliability and validity testing. This requires further caution in interpretation of any results, particularly related to tracking of obesity-related disparities.
The majority of the NCCOR-R instruments reflected quantitative approaches in measuring influences on disparities or equity. Self-report methods and questionnaires were more common than objective methods. GIS was a frequently used approach to assess environmental quality and behavior. Alternatively, qualitative methods, which can provide a comprehensive and nuanced understanding of the causes of disparities and obesity as defined by the target population, were rarely used. Qualitative methods and tools should be promoted and included as a particularly important strategy for developing and adapting instruments for use with disadvantaged populations.
As described in Chapters 1, 3, 6, and 7, surveillance systems have progressed for obesity and obesity risk factors, and there is growing attention to environmental and policy factors. However, surveillance data are still often lacking for populations with disparities. Often, surveillance data are too sparse to address specific groups and concerns (e.g., risk factors among racial/ethnic subgroups) (Andresen et al.,
2004). For example, national data systems (e.g., National Health and Nutrition Examination Survey) do not adequately sample or provide data on Alaska Natives, Native Hawaiians, or on other U.S.-affiliated Pacific Islanders (Personal communication, Rachel Novotny, University of Hawaii, December 24, 2012; Novotny et al., 2013). The surveillance challenges for populations with disparities fall into three broad categories:
1. Small numbers: The large inflation of the relative standard error occurs with a numerator of less than 30, which is often required by the National Center for Health Statistics (Klein et al., 2002).
2. Limited attention to language and culture: Surveillance systems show lower participation rates for racial/ethnic minority groups and for individuals who do not speak English (Link et al., 2006).
3. Limited surveillance infrastructure: Often agencies that have the highest rates of disparities also lack resources, making it difficult to maintain adequate surveillance systems.
CONCLUSION
Identifying indicators aligned with the APOP report (IOM, 2012) are important for developing a common way forward for measuring progress toward obesity prevention for all populations (see Chapter 4). Yet, tools and research methods that are appropriately tailored and include variables that characterize social advantage and disadvantage are similarly important to evaluation efforts to understand how to promote equity in access to health-promoting resources and environments. A small yet growing literature is developing on the tools and methods for monitoring progress on obesity prevention between populations with disparities in obesity prevalence. These issues are of high importance to both researchers and practitioners. Although the Committee identified limitations for all types of tools and methods appropriate for use with particular attention to obesity disparities, the NCCOR-R provides a useful starting point for several populations and settings or environments related to obesity prevention. As described here and in other chapters in this report, numerous challenges remain, such as continually improving tools and methods, strengthening surveillance systems to sample these populations adequately, ensuring the relevant tools and methods for diverse population groups, and integrating tools and methods into public health surveillance and monitoring systems with criteria of need, effectiveness, and quality of services that are relevant to the various populations.
REFERENCES
Andresen, E. M., P. H. Diehr, and D. A. Luke. 2004. Public health surveillance of low-frequency populations. Annual Review of Public Health 25:25-52.
Archer, W. R., M. C. Batan, L. R. Buchanan, R. E. Soler, D. C. Ramsey, A. Kirchhofer, and M. Reyes. 2011. Promising practices for the prevention and control of obesity in the worksite. American Journal of Health Promotion 25(3):e12-e26.
Armour, B. S., E. Courtney-Long, V. A. Campbell, and H. R. Wethington. 2012. Estimating disability prevalence among adults by body mass index: 2003-2009 National Health Interview Survey. Preventing Chronic Disease 9: E178; quiz E178.
Befort, C. A., N. Nazir, and M. G. Perri. 2012. Prevalence of obesity among adults from rural and urban areas of the United States: Findings from NHANES (2005-2008). Journal of Rural Health 28(4):392-397.
Bennett, G. G., and K. Y. Wolin. 2006. Satisfied or unaware? Racial differences in perceived weight status. International Journal of Behavioral Nutrition and Physical Activity 3:40.
Bethell, C., D. Read, E. Goodman, J. Johnson, J. Besl, J. Cooper, and L. A. Simpson. 2009. Consistently inconsistent: A snapshot of across- and within-state disparities in the prevalence of childhood overweight and obesity. Pediatrics 123(Suppl 5):S277-S286.
Boehmer, U., D. J. Bowen, and G. R. Bauer. 2007. Overweight and obesity in sexual-minority women: Evidence from population-based data. American Journal of Public Health 97(6):1134-1140.
Braveman, P. 2006. Health disparities and health equity: Concepts and measurement. Annual Review of Public Health 27:167-194.
Braveman, P. 2009. A health disparities perspective on obesity research. Preventing Chronic Disease 6(3):A91.
Braveman, P. 2012. Health inequalities by class and race in the US: What can we learn from the patterns? Social Science and Medicine 74(5):665-667.
Braveman, P., S. Egerter, and D. R. Williams. 2011a. The social determinants of health: Coming of age. Annual Review of Public Health 32:381-398.
Braveman, P. A., S. A. Egerter, and R. E. Mockenhaupt. 2011b. Broadening the focus: The need to address the social determinants of health. American Journal of Preventive Medicine 40(1 Suppl 1):S4-S18.
Braveman, P. A., S. Kumanyika, J. Fielding, T. Laveist, L. N. Borrell, R. Manderscheid, and A. Troutman. 2011c. Health disparities and health equity: The issue is justice. American Journal of Public Health 101(Suppl 1):S149-S155.
Brownson, R. C., J. J. Chang, A. A. Eyler, B. E. Ainsworth, K. A. Kirtland, B. E. Saelens, and J. F. Sallis. 2004. Measuring the environment for friendliness toward physical activity: A comparison of the reliability of 3 questionnaires. American Journal of Public Health 94(3):473-483.
Brownson, R. C., C. M. Hoehner, K. Day, A. Forsyth, and J. F. Sallis. 2009. Measuring the built environment for physical activity: State of the science. American Journal of Preventive Medicine 36(4 Suppl):S99-S123, e112.
Caballero, B., J. H. Himes, T. Lohman, S. M. Davis, J. Stevens, M. Evans, S. Going, and J. Pablo. 2003. Body composition and overweight prevalence in 1704 schoolchildren from 7 American Indian communities. American Journal of Clinical Nutrition 78(2):308-312.
Chakraborty, B. M., and R. Chakraborty. 2010. Concept, measurement and use of acculturation in health and disease risk studies. Collegium Antropologicum 34(4):1179-1191.
Chandon, P., and B. Wansink. 2012. Does food marketing need to make us fat? A review and solutions. Nutrition Reviews 70(10):571-593.
Coleman-Jensen, A., M. Nord, M. Andrews, and S. Carlson. 2012. Household food security in the United States in 2011. Washington, DC: U.S. Department of Agriculture, Economic Research Service.
Coogan, P. E., L. A. Wise, Y. C. Cozier, J. R. Palmer, and L. Rosenberg. 2012. Lifecourse educational status in relation to weight gain in African american women. Ethnicity and Disease 22(2):198-206.
Dalenius, K., E. Borland, B. Smith, B. Polhamus, and L. Grummer-Strawn. 2012. Pediatric Nutrition Surveillance 2010 report. Atlanta, GA: U.S. Department of Health and Human Services, Centers for Disease Control and Prevention.
Das, A. 2013. How does race get “under the skin”?: Inflammation, weathering, and metabolic problems in late life. Social Science and Medicine 77:75-83.
Davies, S. L., H. R. Thind, S. D. Chandler, and J. A. Tucker. 2011. Enhancing resilience among young people: The role of communities and asset-building approaches to intervention. Adolescent Medicine: State of the Art Reviews 22(3):402-440.
DeNavas-Walt, C., B. D. Proctor, and J. C. Smith. 2012. Income, poverty, and health insurance coverage in the United States: 2011. Current Population Reports, No. 60-243. Washington, DC: U.S. Government Printing Office.
Dixon, B., M. M. Pena, and E. M. Taveras. 2012. Lifecourse approach to racial/ethnic disparities in childhood obesity. Advances in Nutrition 3(1):73-82.
Evans-Campbell, T. 2008. Historical trauma in American Indian/native Alaska communities: A multilevel framework for exploring impacts on individuals, families, and communities. Journal of Interpersonal Violence 23(3):316-338.
Flaskerud, J. H., and C. R. DeLilly. 2012. Social determinants of health status. Issues in Mental Health Nursing 33(7):494-497.
Flegal, K. M., M. D. Carroll, B. K. Kit, and C. L. Ogden. 2012. Prevalence of obesity and trends in the distribution of body mass index among US adults, 1999-2010. Journal of the American Medical Association 307(5):491-497.
Franklin, B., A. Jones, D. Love, S. Puckett, J. Macklin, and S. White-Means. 2012. Exploring mediators of food insecurity and obesity: A review of recent literature. Journal of Community Health 37(1):253-264.
Gee, G. C., and D. C. Payne-Sturges. 2004. Environmental health disparities: A framework integrating psychosocial and environmental concepts. Environmental Health Perspectives 112(17):1645-1653.
Gittelsohn, J., and M. Rowan. 2011. Preventing diabetes and obesity in American Indian communities: The potential of environmental interventions. American Journal of Clinical Nutrition 93(5):1179S-1183S.
Glanz, K., J. F. Sallis, B. E. Saelens, and L. D. Frank. 2005. Healthy nutrition environments: Concepts and measures. American Journal of Health Promotion 19(5): ii, 330-333.
Glanz, K., J. F. Sallis, B. E. Saelens, and L. D. Frank. 2007. Nutrition environment measures survey in stores (NEMS-S): Development and evaluation. American Journal of Preventive Medicine 32(4):282-289.
Glanz, K., M. D. Bader, and S. Iyer. 2012. Retail grocery store marketing strategies and obesity: An integrative review. American Journal of Preventive Medicine 42(5):503-512.
Gordon-Larsen, P., M. C. Nelson, P. Page, and B. M. Popkin. 2006. Inequality in the built environment underlies key health disparities in physical activity and obesity. Pediatrics 117(2):417-424.
Grier, S. A., and S. K. Kumanyika. 2008. The context for choice: Health implications of targeted food and beverage marketing to African Americans. American Journal of Public Health 98(9):1616-1629.
Guadamuz, T., S. Lim, M. Marshal, M. Friedman, R. Stall, and A. Silvestre. 2012. Sexual, behavioral, and quality of life characteristics of healthy weight, overweight, and obese gay and bisexual men: Findings from a prospective cohort study. Archives of Sexual Behavior 41(2):385-389.
HHS (Department of Health and Human Services). 2010. Healthy People 2020. http://www.healthypeople.gov/2020/default.aspx (accessed January 31, 2013).
Huff, R. M., and M. V. Kline, eds. 1999. Promoting health in multicultural populations: A handbook for practitioners. Thousand Oaks, CA: Sage Publications, Inc.
Hurvitz, E. A., L. B. Green, J. E. Hornyak, S. R. Khurana, and L. G. Koch. 2008. Body mass index measures in children with cerebral palsy related to gross motor function classification: A clinic-based study. American Journal of Physical Medicine and Rehabilitation 87(5):395-403.
IOM (Institute of Medicine). 2012. Accelerating progress in obesity prevention: Solving the weight of the nation. Washington, DC: The National Academies Press.
Jackson, J. E., M. P. Doescher, A. F. Jerant, and L. G. Hart. 2005. A national study of obesity prevalence and trends by type of rural county. Journal of Rural Health 21(2):140-148.
Jun, H. J., H. L. Corliss, L. P. Nichols, M. J. Pazaris, D. Spiegelman, and S. B. Austin. 2012. Adult body mass index trajectories and sexual orientation: The Nurses Health Study II. American Journal of Preventive Medicine 42(4):348-354.
Kawachi, I., N. Daniels, and D. E. Robinson. 2005. Health disparities by race and class: Why both matter. Health Affairs 24(2):343-352.
Klein, R. J., S. E. Proctor, M. A. Boudreault, and K. M. Turczyn. 2002. Healthy People 2010 criteria for data suppression. Healthy People 2010 Statistical Notes (24):1-12.
Koh, H. K. 2010. A 2020 vision for healthy people. New England Journal of Medicine 362(18):1653-1656.
Koh, H. K., J. J. Piotrowski, S. Kumanyika, and J. E. Fielding. 2011. Healthy People: A 2020 vision for the social determinants approach. Health Education & Behavior: The official publication of the Society for Public Health Education 38(6):551-557.
Larson, N. I., and M. T. Story. 2011. Food insecurity and weight status among U.S. children and families: A review of the literature. American Journal of Preventive Medicine 40(2):166-173.
Levi, J., L. Segal, R. St. Laurent, A. Lang, and J. Rayburn. 2012. F as in fat: How obesity threatens Americas future 2012. Washington, DC: Trust for America’s Health/Robert Wood Johnson Foundation.
Link, M. W., A. H. Mokdad, H. F. Stackhouse, and N. T. Flowers. 2006. Race, ethnicity, and linguistic isolation as determinants of participation in public health surveillance surveys. Preventing Chronic Disease 3(1):A09.
Lovasi, G. S., M. A. Hutson, M. Guerra, and K. M. Neckerman. 2009. Built environments and obesity in disadvantaged populations. Epidemiologic Reviews 31:7-20.
Love, C., R. J. David, K. M. Rankin, and J. W. Collins, Jr. 2010. Exploring weathering: Effects of lifelong economic environment and maternal age on low birth weight, small for gestational age, and preterm birth in African-American and white women. American Journal of Epidemiology 172(2):127-134.
Matson, M. L., J. L. Matson, and J. S. Beighley. 2011. Comorbidity of physical and motor problems in children with autism. Research in Developmental Disabilities 32(6):2304-2308.
McKinnon, R. A., J. Reedy, M. A. Morrissette, L. A. Lytle, and A. L. Yaroch. 2009. Measures of the food environment: A compilation of the literature, 1990-2007. American Journal of Preventive Medicine 36(4 Suppl):S124-S133.
National Survey of Children’s Health. 2011. The health and well-being of children in rural areas: A portrait of the nation 2007. Rockville, MD: U.S. Department of Health and Human Services, Health Resources and Services Administration, Maternal and Child Health Bureau.
NCBDDD (National Center on Birth Defects and Developmental Disabilities). 2012. Strategic plan—disabilities & disparities. http://www.cdc.gov/ncbddd/aboutus/disabilities.html (accessed June 24, 2013).
NCCOR (National Collaborative on Childhood Obesity Research). 2013. NCCOR Measures Registry. http://nccor.org/projects/measures/index.php (accessed June 15, 2013).
Nord, M., M. Andrews, and S. Carlson. 2009. Household food security in the United States, 2008. Washington, DC: U.S. Department of Agriculture, Economic Research Service.
Novotny, R., C. Nigg, K. McGlone, G. Renda, N. Jung, M. Matsunaga, and N. Karanja. 2013. Pacific Tracker 2—Expert System (PacTrac2-ES) behavioural assessment and intervention tool for the Pacific Kids DASH for health (PacDASH) study. Food Chemistry 140(3):471-477.
Ogden, C. L., M. D. Carroll, B. K. Kit, and K. M. Flegal. 2012. Prevalence of obesity and trends in body mass index among US children and adolescents, 1999-2010. Journal of the American Medical Association 307(5):483-490.
Oza-Frank, R., and S. A. Cunningham. 2010. The weight of US residence among immigrants: A systematic review. Obesity Reviews 11(4):271-280.
Patterson, P. D., C. G. Moore, J. C. Probst, and J. A. Shinogle. 2004. Obesity and physical inactivity in rural America. Journal of Rural Health 20(2):151-159.
Perez-Escamilla, R. 2011. Acculturation, nutrition, and health disparities in Latinos. American Journal of Clinical Nutrition 93(5):1163S-1167S.
Perez-Escamilla, R., and P. Putnik. 2007. The role of acculturation in nutrition, lifestyle, and incidence of type 2 diabetes among Latinos. Journal of Nutrition 137(4):860-870.
Riegelman, R. K., and D. R. Garr. 2011. Healthy People 2020 and education for health: What are the objectives? American Journal of Preventive Medicine 40(2):203-206.
Rimmer, J. H., K. Yamaki, B. M. Lowry, E. Wang, and L. C. Vogel. 2010. Obesity and obesity-related secondary conditions in adolescents with intellectual/developmental disabilities. Journal of Intellectual Disability Research 54(9):787-794.
Rimmer, J. H., K. Yamaki, B. M. Davis, E. Wang, and L. C. Vogel. 2011. Obesity and overweight prevalence among adolescents with disabilities. Preventing Chronic Disease 8(2):A41.
Simeonsson, R. J., J. S. McMillen, and G. S. Huntington. 2002. Secondary conditions in children with disabilities: Spina bifida as a case example. Mental Retardation and Developmental Disabilities Research Reviews 8(3):198-205.
Story, M., N. E. Sherwood, J. H. Himes, M. Davis, D. R. Jacobs, Jr., Y. Cartwright, M. Smyth, and J. Rochon. 2003. An after-school obesity prevention program for African-American girls: The Minnesota GEMS pilot study. Ethnicity and Disease 13(1 Suppl 1):S54-S64.
USDA (U.S. Department of Agriculture). 2013. SNAP food security in-depth interview study, edited by K. Edin, M. Boyd, J. Mabli, J. Ohls, J. Worthington, S. Greene, N. Redel, and S. Sridharan. Washington, DC: USDA.
Wang, Y. 2011. Disparities in pediatric obesity in the United States. Advances in Nutrition 2(1):23-31.
Whitehead, M. 1992. The concepts and principles of equity and health. International Journal of Health Services 22(3):429-445.
Whitehead, M., and J. Popay. 2010. Swimming upstream? Taking action on the social determinants of health inequalities. Social Science and Medicine 71(7):1234-1236; discussion 1254-1258.
Williams, D. R., and M. Sternthal. 2010. Understanding racial-ethnic disparities in health: Sociological contributions. Journal of Health and Social Behavior 51(Suppl):S15-S27.
Wolff, L. S., D. Acevedo-Garcia, S. V. Subramanian, D. Weber, and I. Kawachi. 2010. Subjective social status, a new measure in health disparities research: Do race/ethnicity and choice of referent group matter? Journal of Health Psychology 15(4):560-574.
Woolf, S. H., and P. Braveman. 2011. Where health disparities begin: The role of social and economic determinants—and why current policies may make matters worse. Health Affairs 30(10):1852-1859.
This page intentionally left blank.


