
Community Obesity Assessment and Surveillance
Why: Why develop a Community Obesity Assessment and Surveillance Plan? Many recommendations from the report Accelerating Progress in Obesity Prevention (APOP) (IOM, 2012a) call for implementation of strategies at the community level, and many of the decisions affecting determinants of obesity are made at the local level. Accurate and timely knowledge of local obesity-related conditions and changes or trends over time are essential for planning and managing community obesity prevention initiatives.
What: What is a Community Obesity Assessment and Surveillance Plan? Complementary to the Community-level Obesity Intervention Monitoring and Summative Evaluation Plan (in Chapter 8), a Community Obesity Assessment and Surveillance Plan is a template to guide communities in describing the current status of and trends in obesity and its determinants in their community.
How: How should a Community Obesity Assessment and Surveillance Plan be implemented? A template to customize a plan for community assessment and surveillance contains guidance for (1) identifying a set of common indicators that measure impacts and outcomes of strategies recommended in the APOP report (IOM, 2012a) that can be measured, compared, and aggregated across multiple jurisdictions; (2) providing guidance for developing local capacity for these assessments; and (3) accommodating communities with varying resources and assets.
Accelerating progress in obesity prevention requires multi-level strategies at the federal, state, and local levels as recommended in the Institute of Medicine (IOM) Accelerating Progress in Obesity Prevention (APOP) report (IOM, 2012a). Unlike the previous chapter, which focused on more macro-level federal and state evaluation of obesity and related determinants, the next two chapters focus on evaluation of obesity prevention at the community or local level. Evaluation at the local level has two components: (1) assessment and surveillance of obesity status, its determinants, and the extent of obe-
sity prevention activities and (2) monitoring and summative evaluation of the quality and effectiveness of obesity prevention interventions. The prominence of local prevention activities implies that evaluating progress in obesity prevention must include knowledge of changes in obesity and its determinants at the local level and of the effectiveness of locally implemented strategies (IOM, 2007). Therefore, local evaluation includes both community assessment and surveillance (CAS)1 and community program and initiative monitoring and summative evaluation (e.g., evaluation of interventions, including programs, systems, policies, environmental changes, services, products). This chapter addresses the former. The subsequent chapter (Chapter 8) focuses on community program and initiative (or intervention) monitoring and summative evaluation.
GOALS OF CAS COMPARED TO INTERVENTION MONITORING AND SUMMATIVE EVALUATION
Community assessment, surveillance, and intervention monitoring and summative evaluation are distinct sets of activities with complementary goals. The goal of community assessments is usually a first-time assessment of status or trends overall. Surveillance provides repeated or continuous assessments of progress over time, whereas intervention monitoring and summative evaluation seeks to establish and share “what works.” The combination of first-time assessment and ongoing surveillance (or CAS) can document, at the local level, associations of the status or trends in obesity prevalence with behaviors, social factors, environments, or interventions. Linking these with the monitoring of implementation of interventions becomes the main sources of data for evaluation. Intervention summative evaluations seek to move beyond association to determine whether observed changes in outcomes can be associated with and, ideally, attributed to the intervention or combination of interventions.
These two purposes—assessing status or progress and evaluating whether interventions are working—require different types or levels of evidence. When assessing status or progress, evidence of current levels or trends in obesity and its determinants (e.g., behaviors, environments, programs, systems, and policies) can be sufficient, without necessarily attributing cause. Causal assumptions will be inevitable because some determinants are found to be above state or national averages, suggesting that interventions need to be developed with those determinants as targets. For implementers of community initiatives, this information can help them to decide whether their approaches are on target or need adjustment. For local efforts that need to show progress to constituents or funders, evidence of progress may be sufficient for accountability. In contrast, when evaluating interventions, the strongest evidence possible is desirable, and this means place-based experiments usually including a comparison or control condition, or the strongest feasible quasi-experiments (see Chapter 8).
CAS and intervention monitoring and summative evaluation interact and share some similarities. Intervention monitoring and summative evaluation can use data generated by CAS and can suggest topics for inclusion in data collection and vice versa. Combining CAS data across communities can contribute data to multi-site assessment designs. Both can incorporate community engagement and participatory research methods.
_____________
1 This chapter focuses on a plan for conducting community assessments and surveillance for obesity prevention efforts as defined. The Committee deliberately uses community assessments or CAs when referring to this aspect only and uses community assessments and surveillance or CAS when referring collectively to both aspects.
WHY MEASURE STATUS OR PROGRESS AT THE COMMUNITY LEVEL
Many of the factors that determine obesity rates—and the decisions to change those factors—are local and, therefore, so are many of the APOP strategies (IOM, 2003, 2012a). In communities, for example:
• planning and land use decisions create built environments that support walking and biking and increase access to better food choices and limit exposure to unhealthful foods;
• schools provide better food choices and more opportunities for physical activity;
• organizations provide and support community programs designed to increase physical activity;
• local governments, organizations, and institutions adopt comprehensive strategies to reduce overconsumption of sugar-sweetened beverages and to implement nutritional standards for foods and beverages available at government and public sites;
• health care providers improve practices for prevention, screening, diagnosis, and treatment of overweight and obesity; and
• employers encourage active living and healthful eating at work.
At the local level, people can be more creative and innovative than at the federal or state level. Local communities, in short, can provide direct services, implement policy, change environments, and create systems changes.
LOCALITY-SPECIFIC AND DIVERSE DATA
Not every strategy enumerated by APOP’s recommendations (IOM, 2012a) can be expected to be appropriate to the specific circumstances of each community. Because local challenges and assets vary widely across America’s communities, selection and adaptation of evidence-based strategies may be most appropriately decided in each community. Local communities across the nation vary widely with respect to population size; cultural, racial and ethnic diversity; and impact of obesity. Local capacities for assessment and surveillance are also highly variable, with a wide range of skills and resources for developing and using health and other data. The Committee tried to account for this heterogeneity by developing a tiered set of guidance suitable to diverse communities and initiatives of varying scales and intensities with differing levels of resources for community assessment and surveillance. Because it is possible for local assessors to connect directly with community organizations, and in some cases residents, the potential for community engagement and use of community-based participatory research (CBPR) methods is greater for CAS than for assessment of progress nationally.
OVERVIEW OF COMMUNITY ASSESSMENT AND SURVEILLANCE
Community assessment2 is a process that involves the systematic collection of data over time at the community level for the purposes of describing current health status and determinants of health at points in time and trends over time (Cibula et al., 2003). Community assessment and surveillance may be global
_____________
2Community assessment as defined by this chapter is focused on assessments of obesity prevention efforts. Community health assessment is commonly used in the field as a way to assess overall health of a community, which can include obesity.
assessments of the health of a community or focus specifically on chronic diseases, or more specifically on obesity. An obesity-focused community assessment and surveillance can draw attention to obesity as a priority health concern and include more obesity-related information than a broader CAS. In both cases, they should include indicators that assess progress in obesity prevention, such as obesity prevalence3; obesity-related behaviors such as physical activity and food and beverage consumption; features of the environment that influence behaviors such as accessibility of healthful foods, walkability, or places for physical activity; policies that shape environments and behaviors, nutrition, and physical activity programs; other interventions such as media campaigns or food retail promotion of healthier foods; levels of funding for obesity prevention initiatives; transportation systems; and social assets (e.g., groups with a history of working together to promote health, community leadership and champions, and political will). CAS also may include information on community contextual factors that influence obesity (Fawcett et al., 2011), such as demographics of the community, and social determinants of health leading to differential exposure and vulnerabilities (e.g., education and unemployment, income inequality, racism/discrimination, social norms, social capital, residential proximity to walkable areas, and “food deserts”). Ideally, they also describe policies that shape environments and behaviors such as menu labeling or pedestrian master plans, as well as the interactions of sectors and institutions in addressing obesity from a systems analysis perspective, although data and methods for these domains are just emerging (see Chapter 9). CAS displays and disseminates data through reports, presentations, and websites using a variety of data description and visualization methods (e.g., maps of available community parks and supermarkets).
The general tasks of CAS in the context of this report are to describe the current state of obesity-related and contextual indicators and track them over time. The information gathered from CAS can identify areas that need improvement, monitor the implementation or emergence of policies, programs, or other interventions, and track changes in contextual influences. These provide various forms of data to facilitate planning for future actions and to examine the effects of interventions over time. CAS systems can range from simple reports of generally available indictors easily accessed on the Web to intensive projects that involve a combination of primary and secondary data collection, sophisticated qualitative and quantitative data analysis, and advanced dissemination and visualization techniques. This chapter describes uses of CAS in the context of this report, commonly used indicators and some innovative ones, sources of data for these indicators, methods for conducting CAS, examples of typical and exemplary CAS, gaps in current CAS indicators and methods, and recommendations for obesity-focused CAS. Box 7-1 provides an actionable plan to implement a community obesity assessment. The rest of the chapter provides support and guidance for implementing each step with specific attention to different needs for larger and smaller communities. This support and guidance includes where possible the identification of existing tools, resources, and methods for consideration framed around assessing the environmental and policy strategies recommended in the APOP report (IOM, 2012a).
DEFINE COMMUNITY BOUNDARIES
The Committee defines community level as activities conducted by local governmental units (e.g., cities, counties), school districts, quasi-governmental bodies (e.g., regional planning authorities, housing authorities) and private-sector organizations (e.g., hospitals, businesses, after school programs). In this
_____________
3 Incidence data would be preferable, but these are generally not available at the local level.
context, community is defined as people sharing a common place (e.g., city, neighborhood); they may also share a common experience (e.g., living in a neighborhood with few grocery stores or parks or living in poverty) or interest (e.g., working together to promote better nutrition or active living) (IOM, 2012b). A community may also be defined as a group of people who identify themselves as sharing a common interest or culture, but this interpretation is only applicable here to the extent that such a common-interest community is local.
Geographic community definitions can be based on jurisdictional boundaries (e.g., city, county, school district, hospital district), census-defined boundaries (e.g., census places or metropolitan/micropolitan statistical areas), or customized boundaries (e.g., aggregations of census tracts or ZIP codes). The choice of geographic boundaries often depends on availability of data for the area of interest.
CAS can describe and track health inequities among different groups; for example, those sharing race/ethnicity, gender, sexual orientation, income, and geography. By displaying indicators stratified by demographic and geographic strata, it becomes apparent whether progress in preventing obesity is occurring equitably (see Figures 7-1 and 7-2 for examples). The boundaries of the community must be explicit to help to clarify the conditions of that particular community and to identify the appropriate set of indicators (McIntyre and Ellaway, 2000).
ENGAGE COMMUNITY MEMBERS AND OTHER KEY STAKEHOLDERS
Collaborative approaches to CAS involving government, community organizations, and private-sector stakeholders have gained recent recognition for addressing the complex set of factors associated with population health. Engaging community members and private-sector stakeholders in planning and sense-making is essential to understanding, implementing, and sustaining community assessments and surveillance and health improvement efforts (IOM, 2003). Interested stakeholders include community organizations and coalitions, hospitals, local public health agencies, human service agencies, schools, business, and community health centers. Meaningful participation extends beyond physical presence of community members to include their active engagement in generating ideas, contributing to decision making, and sharing responsibility for taking action (NIH, 2011). Stakeholders can engage during some or all phases of CAS, including
• Review/revise community definition, participating stakeholders;
• Assess stakeholder priorities for focus/topics, for assessment/surveillance, and to engage in planning the assessment;
• Determine resources and capacities among participants (e.g., staff, technical skills, data, funding, etc.) available for conducting assessment/surveillance;
• Make community participation and involvement easier (i.e., enhance access by arranging meetings at times and places convenient for community members, with language/physical access, transportation, child care, and other necessary accommodations); and
• Include community members in data collection and interpretation of results, and disseminate findings (detailed throughout this chapter).
The extent and type of end-user engagement should be appropriate to the scale and scope of each specific community assessment or development of surveillance capacity.
BOX 7-1
Components of a Community Obesity Assessment and Surveillance Plan
Purpose: To provide accurate and timely knowledge of local obesity-related conditions and relevant changes or trends over time as a result of implementing strategies in the Institute of Medicine Accelerating Progress in Obesity Prevention (APOP) report (IOM, 2012a).
1. Define community boundaries.
a. Create specific geographic areas that reflect jurisdictions, key stakeholders, and community members’ perceptions of geographic boundaries.
2. Engage community members and other key stakeholders.
a. Include stakeholders, to the extent possible, in defining community, identifying priorities, planning assessments, collecting data, interpreting and sense-making of results, and disseminating the findings.
3. Plan assessment/surveillance and include stakeholders and community members.
a. Identify lead agency or agencies responsible for conducting assessment/surveillance.
b. Clarify goals of assessment/surveillance.
c. Define audience and the information that will move it to action.
d. Define topics to include in assessment/surveillance.
e. Identify sub-populations and small areas disproportionately affected by obesity, and develop approach to collecting information about them.
f. Select local data to be included about context, assets, interventions, barriers, and social determinants, and which data to schedule for ongoing surveillance.
The principles and methods developed for conducting CBPR are well-suited for promoting community engagement in assessment and surveillance of the assets of the community; identifying local concerns; designing and conducting the assessment/surveillance; interpreting, disseminating, and translating the findings; and sustaining and evaluating partnerships that act on the assessment/surveillance findings (Fawcett et al., 2003; Israel et al., 2013; Minkler and Wallerstein, 2008). CBPR methods can contribute to assuring accurate findings that describe true conditions in the community because they bring diverse perspectives and knowledge bases into the assessment/surveillance process. CBPR contributes to bringing together
4. Collect data.
a. Obtain existing data from web-based platforms or published reports.
b. As resources permit, add other sources of data.
c. Create an inventory of local obesity prevention interventions.
5. Analyze and interpret the data.
a. Include trends over time.
b. Present data for infants, children, adolescents, adults, and special populations.
c. Describe variation in indicators (e.g., across race/ethnicity/socioeconomic status/small areas).
d. Include comparison to benchmarks, state rates, and peer communities.
e. Compare extent of existing interventions identified to those recommended in the APOP report (IOM, 2012a).
f. Share data with community members and other stakeholders for their interpretations and suggested implications for action.
g. Visualize, or illustrate, data (see Figures 7-1 and 7-2).
6. Disseminate findings.
a. Prepare reports, websites, infographics, and other dissemination tools.
b. Share findings with stakeholders and engage them in interpretation of findings.
c. Present findings at community meetings for further interpretation.
d. Implement a media advocacy strategy to gain media coverage.
e. Consider using social media to further increase awareness of findings.
assessment/surveillance professionals and the community “to establish trust, share power, foster co-learning, enhance strengths and resources, build capacity, and examine and address community-identified needs and health problems” (Israel et al., 2013, p. 14), especially in communities affected by health inequities. Box 7-2 summarizes some key aspects.
An example of the application of participatory methods to community obesity assessment and surveillance comes from the work of Faith Leaders for Environmental Justice in New York City (see Box 7-3).
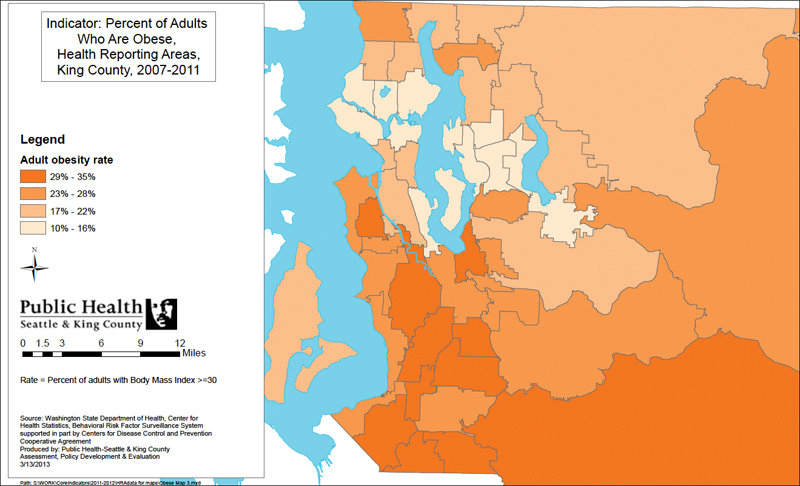
FIGURE 7-1 Example of illustrating community health indicator data—map.
SOURCE: Used with permission from Public Health—Seattle & King County (King County, 2013b).
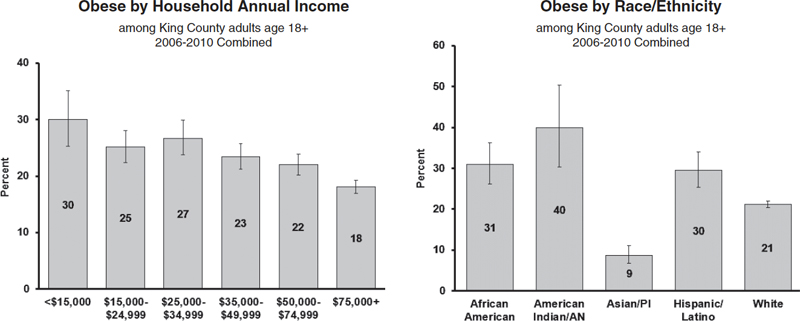
FIGURE 7-2 Examples of illustrating community health indicator data—bar chart.
NOTE: AN = Alaskan Native; PI = Pacific Islander.
SOURCE: Used with permission from Public Health—Seattle & King County (King County, 2013c).
BOX 7-2
Increasing Participation in Community Assessment and Surveillance (CAS)
1. Identify those community members and groups, including those experiencing health disparities, that have a stake in community health improvement and conducting a CAS.
2. Invite members of the community to participate through public announcements and connectors—those with trusting relationships and credibility with members of diverse communities.
3. Make community participation and involvement easier by addressing logistical and cultural barriers to participation.
4. Make community participation and involvement more rewarding
• Assure that the “6 Rs” are incorporated into the group’s meetings and activities, including
— Recognition—Recognize people for their contributions.
— Respect—Respect and consider people’s values, culture, ideas, and time.
— Role—Give each person a clear and meaningful role through which they can contribute.
— Relationships—Provide opportunities for people to establish relationships and build networks.
— Reward—Ensure that the rewards of participating in the group outweigh the costs.
— Results—Work to achieve results that are linked to outcomes of importance to the community.
5. Assess and enhance the cultural competence of the community assessment/surveillance initiative by considering the local customs and values of the community, designing the assessment/surveillance with the participation of people from diverse cultures within the community, and assuring that minority groups have the power and voice to express their concerns and ideas.
6. Assure open communication of draft plans/findings and opportunities for review and feedback from the whole community.
SOURCE: Adapted from Fawcett et al., 2011.
PLAN ASSESSMENT/SURVEILLANCE
Planning a CAS includes identifying a lead agency responsible for conducting it; clarifying its goals; defining the target audience and what information will move them to action; defining topics to include in the assessment/surveillance; identifying sub-populations and small areas disproportionately affected by obesity; developing approaches to collecting information about them; and selecting local data about context, assets, interventions, barriers, and social determinants.
BOX 7-3
Community-Based Participatory Research: The Faith Leaders for Environmental Justice
The Faith Leaders for Environmental Justice (FLEJ), a group of individuals and organizations in New York City with interest in mobilizing communities around environmental justice issues, was interested in influencing public policy focused on the issue of food access. This group brought together community residents to help to identify priority problems in their communities, document problems associated with the food environments, elicit experiences on the Supplemental Nutrition Assistance Program and other food access—related policies, and identify existing policies that may relate to their policy goals and interests. The work of this group illustrates the utility of a community-based participatory approach and to policy advocacy work.
The FLEJ used the Everyday Democracy’s “dialogue-to-change” process (http://www.everyday-democracy.org, accessed November 11, 2013), which involved bringing together a cross-section of community residents to share their views and experiences through structured facilitated conversations in small groups. For this dialogue process, local food and health experts and Everyday Democracy developed a guide. Trained individuals facilitated “dialogue circles” during a 2-day summit, with the materials helping to guide the conversation. Each circle was tasked to identify three action ideas. The information collected from the group conversations identified a list of the most popular ideas and helped form working groups in which the community residents would participate in developing the necessary data and interventions. The working groups were Business Outreach; Community Engagement; Farm Bill; Food; Voter Education; and Healthy Incentives. These working groups then developed a targeted approach to tackling their particular issue.
SOURCE: Tsui et al., 2013.
Valuable resources are available for conducting CAS. The Community Tool Box, Centers for Disease Control and Prevention (CDC), National Association of County and City Health Officials, state health departments, and others offer guidance on methods for conducting CAS. Box 7-4 provides a list of example tools and resources that are available for planning CAS.
Identifying a Lead Agency Responsible for Conducting the Assessment and Surveillance
Identifying a lead agency (or agencies) for the assessment promotes accountability for completing the CAS. The choice of which agency or agencies are best suited to lead the CAS depends on community context and agency assets. A lead agency should have the capacity to convene and manage the CAS process, access to the data needed for the assessment, skills in data analysis, and resources for communicating and disseminating findings. If a lead agency does not have these assets, then collaboration with others is an alternative. In participatory CAS, the engaged stakeholders choose or endorse the lead agency early in the process. In other cases, such as the production of routine assessments as part of a local health department’s responsibilities, the lead agency may initiate and conduct the CAS, engaging stakeholders in a more limited capacity.
BOX 7-4
Example Tools and Resources for Planning Community Assessment/Surveillance
National Resources
• Association for Community Health Improvement: Community Health Assessment Toolkit—http://www.assesstoolkit.org
• Catholic Health Association: Assessing and Addressing Community Health Needs—http://www.chausa.org/communitybenefit/printed-resources/assessing-and-addressing-community-health-needs
• Community Health Assessment and Group Evaluation (CHANGE): Building a Foundation of Knowledge to Prioritize Community Needs—http://www.cdc.gov/nccdphp/dch/programs/healthycommunitiesprogram/tools/change.htm
• Community Health Needs Assessment—http://www.chna.org
• Health Education Curriculum Analysis Tool (HECAT)—http://www.cdc.gov/HealthyYouth/HECAT/index.htm
• Indian Community Health Profile Toolkit—http://www.npaihb.org/images/resources_docs/Toolkit_Final.pdf
• Mobilizing for Action through Planning and Partnerships (MAPP)—http://www.naccho.org/topics/infrastructure/mapp
• Protocol for Assessing Community Excellence in Environmental Health (PACE EH)—http://www.cdc.gov/nceh/ehs/CEHA/PACE_EH.htm
• Resource Center for Community Health Assessments and Community Health Improvement Plans—http://www.naccho.org/topics/infrastructure/CHAIP/chachip-online-resource-center.cfm
• Some Recommended Practice Areas for Enhancing Community Health Improvement. Work Group for Community Health and Development, University of Kansas—http://ctb.ku.edu/sites/default/files/site_ files/recommended_practices_for_enhancing_community_health_improvement.pdf
• School Health Index (SHI): Self-Assessment and Planning Guide—http://www.cdc.gov /HealthyYouth/SHI
• The Community Tool Box—http://ctb.ku.edu/en/default.aspx
State Resources
• New York State Department of Health—http://www.health.ny.gov/statistics/chac
• Minnesota Department of Health—http://www.health.state.mn.us/divs/opi/pm/lphap/cha/howto.html
• North Carolina Department of Health and Human Services—http://publichealth.nc.gov/lhd/cha
NOTE: Web addresses accessed November 11, 2013.
CAS is generally the responsibility of public health officials as outlined in Essential Public Health Services, a guiding framework for the responsibilities of local public health systems (CDC, 2010). Departments from larger local jurisdictions often have the capacity to prepare their own CAS, although the surveillance of continuous or periodic measures are sometimes funded by or contracted with federal, state, or private-sector bodies. Smaller jurisdictions often rely on their state health departments to prepare reports and provide technical assistance (see Box 7-4). The capacity of local and state health departments to prepare CAS depends on local and state funding allocations, because little continuous federal support for these activities exists. Increasingly, other community stakeholders such as United Way, health care delivery systems, health plans, regional health system collaboratives (that include delivery systems, health plans, and employers), and community foundations are conducting assessments relevant to their missions and communities. For example the Puget Sound Health Alliance conducts assessments and surveillance of the health care environment across medical groups and clinics in five counties of Washington State (Puget Sound Health Alliance, 2013).
In some cases, existing policies and regulations specify who should conduct a CAS. For example, the Patient Protection and Affordable Care Act, Section 9007 (Public Law 111-148, 111th Congress) requires nonprofit hospitals to conduct community health needs assessments every 3 years and to adopt an implementation strategy to address identified needs. The legislation also requires incorporation of input from people who represent the broad interests of the community and sharing the results of CAS with the public. Additionally, health centers supported federally by the Health Resources Services Administration are required to produce needs assessments for their programs (Section 330 of the Public Health Service Act, 42 USCS§ 254b). At local public health departments, a CAS must be conducted as a prerequisite for accreditation (Public Health Accreditation Board, 2012).
CAS requires competency in several practice areas including promoting community engagement, data collection and analysis, small area analysis, gathering data on community assets, social determinants, and displaying and disseminating findings (Fawcett et al., 2011). These skills are absent in many communities, given resource constraints. Developing training and technical assistance assets and disseminating them widely requires curricula, training platforms, model protocols and methods, and peer-learning. CDC, U.S. Department of Agriculture (USDA), state health departments, and other nongovernmental and professional organizations support or at least contribute to these activities through direct or indirect funding, publications, webinars, or technical assistance (see Chapter 6).
Clarify Goals of Assessment and Surveillance
In the context of this report, CAS answers questions such as whether and how much obesity rates are declining, health behaviors are changing, and environments are improving. Whether programs are being implemented, systems and capacities are developing, and policies are being implemented become the work of monitoring as part of the formal evaluation or ongoing quality control by responsible agencies. Although the periodic assessments (surveillance) provide for measures of change, community assessment may also be done as a one-time activity to describe or “diagnose” the health of a community for the purposes of planning, developing community health improvement processes, or preparing funding proposals.
CAS can have diverse goals. It can provide an overall description of progress in preventing obesity, meet the local hospital’s need for a community assessment, identify the prevalence of determinants of obe-
sity, inform choice of prevention strategies, address a specific community change target, or meet reporting requirements for boards or funders.
Define Audience and the Information That Will Move Them to Action
CAS has multiple local audiences. Policy makers, local health departments, voluntary health agencies, advocacy groups, schools, employers, and United Way use CAS for planning, prioritization, budget allocations, and solicitations for support. Hospitals must now use CAS for guiding provision of community benefits. The media use CAS as sources for news stories. Community organizations use CAS to demonstrate need and advocate for resources. Assessors use CAS as data sources for conducting intervention summative evaluations. Understanding the audience(s) and what will attract their attention and motivate them to act should guide the tailoring of the assessment to increase its utility (see Chapter 2).
Define Topics to Include in Assessment/Surveillance
Decisions about topics to include in a CAS are driven by the interests of local stakeholders, availability of data for the community of interest, and the scope and purpose. The Committee recommends including core indicators available at the local level from national data sets (see below), including routinely available local data (e.g., student body mass index [BMI] from schools; health system data; planning department data; crime data; surveys; Selected Metropolitan/Micropolitan Area Risk Trends [SMART]; Behavioral Risk Factor Surveillance System [BRFSS]; local Youth Risk Behavior Surveillance System [YRBSS]; and the Special Supplemental Nutrition Program for Women, Infants, and Children program data), and adding additional indicators of local interest after assessing the feasibility of obtaining local data to describe them. The Committee recommends, when possible, including assessment and surveillance of environments that influence food and physical activity behaviors and of policies and norms and attitudes about causes of obesity and willingness to support strategies to prevent obesity as recommended in the APOP report (IOM, 2012a).
Quantitative Data Sources and Systems Available at the Local Level
Data and indicators are available but options limited. Many indicators have relevance to assessment and surveillance of progress in obesity prevention (see Chapter 4). In practice, local communities use a very small subset of these indicators. An important finding of the Committee is that federal data sources are woefully inadequate for describing progress in obesity prevention at the community level because they do not provide data at the local level, either at all or with sufficient sample sizes, coverage, frequency, and timeliness. Larger communities and states tend to have more data because their populations are large enough that sample sizes in current federal data sources are sufficient to permit statistically appropriate analyses or they have resources to oversample their populations to generate sufficient sample sizes within statewide or national samples.
Table 7-1 provides a summary of data sources that have estimates of obesity prevention–related data available at the community level. These existing federal data systems have significant limitations. For example, BRFSS sample sizes are too small to allow subgroup or stratified analyses (e.g., by race or income) in most communities. In addition, data are not consistently available even for large communities over time. The Metropolitan and Micropolitan Statistical Areas, as defined by the Census Bureau, and
TABLE 7-1 Data Sources for Obesity Prevention Indicator Topics Available at the Local Level*
| Data Source | Indicator Topic | Notes |
|
American Community Survey |
Adult active transport by walking Bicycling by adults Demographic dataa |
Provides demographic and transportation variables: age, gender, income, race/ethnicity, education at the county, incorporated place, ZIP code tabulation area, and school district levels |
|
Behavioral Risk Factor Surveillance System (BRFSS) |
Adult physical activity Consumption of fruits (adults) Consumption of vegetables (adults) Obesity (adult) Overweight (adult) |
Can provide data for approximately 90 percent of U.S. counties (although for smaller counties, confidence intervals are quite wide) through multi-year aggregation (5-7 years) Selected Metropolitan/Micropolitan Area Risk Trends (SMART) BRFSS can be used to estimate information for large communities Bayesian estimation methods can be used to obtain data for all counties for single years |
|
Census Bureau’s County and ZIP Code Business Patterns |
Fast-food outlet density Healthy food outlet density Recreational facility outlet density |
|
|
Decennial Census |
Adult active transport by walking Bicycling by adults Demographic dataa |
Includes these variables at census tract and block group levels as well as higher levels |
|
School Health Policies and Practices Survey |
Availability of healthy food options in schools Daily school physical education Joint/shared use of community facilities National Health Education Standards Nutrition professional development for teachers School Breakfast Program in schools School policies to facilitate access to clean drinking water School recess Sugar-sweetened beverage policies in schools |
Provides data for selected large districts, schools, and randomly selected classroom levels |
|
School measurement of student weights and heights |
Obesity (children/adolescents) Overweight (children/adolescents) |
Availability varies depending on state or community policy |
|
Special Supplemental Nutrition Program for Women, Infants, and Children (WIC) |
Obesity (low-income preschool children, 0-5 years of age) |
The WIC program collects weight and height data on most participating children. State WIC programs may provide these data to assessors |
|
U.S. Department of Agriculture’s Food Environmental Atlas |
Community Supported Agriculture Farm-to-School programs Farmers markets |
| Data Source | Indicator Topic | Notes |
|
Youth Risk Behavior Surveillance System (YRBSS) |
Adolescent physical activity Consumption of fruit (adolescents) Consumption of vegetables (adolescents) Daily school physical education Obesity (adolescents) Overweight (adolescents) Sugar-sweetened beverage consumption (adolescents) |
Provides self-report data on middle and high school students for a limited number of large school districts |
* See Appendix D for further information on these sources.
a Indicator to track and monitor differential rates of exposures to social and policy environments.
counties with data available from SMART BRFSS for a given year will fluctuate because of sample size requirements and because states occasionally face administrative or budgetary requirements to change their sample size and design from one year to another. For low-income preschoolers aged 0-5, BMI data had been available from the Pediatric and Pregnancy Nutrition Surveillance System, but this was discontinued in 2012. Data for other indicators must be collected through special local efforts—and most counties lack resources to do so.
Table 7-2 shows which of the indicators recommended in the APOP report (IOM, 2012a) for describing and tracking progress in obesity prevention are available for larger and smaller communities to consider for inclusion in a CA or surveillance system. All of the recommended indicators, described in Chapter 4, that are available at the county level are included. In addition, indicators that are available and used in some communities are included, even though the evidence linking them to obesity outcomes is less robust. Green denotes that an indicator is readily available for all communities from online sources, yellow denotes that more effort is required but some communities have capacity to analyze locally available data or existing BRFSS or YRBSS data, and red denotes not available. A “larger” community is operationally defined as one that has either SMART BRFSS or local YRBSS data available.
The Committee encourages the use of available core indicators so that communities can compare and contrast their progress with their peers and relative to benchmarks and so that data can be aggregated across communities. The Committee also encourages collecting and reporting on indicators that are not part of the core set, including demographics, norms, and attitudes. Table 7-3 provides indicators that may be useful for CAS but currently are not readily available at the local level from available and ongoing data sources that are recommended in Chapter 4 of this report as well as indicators for APOP-recommended strategies that are not readily available (i.e., gaps). As described below, it is possible for communities to obtain or collect data for these indicators by conducting surveys of their own and partnering with others in their community (e.g., academic institutions, hospitals, businesses, organizations). Each community needs to identify priority indicators given its particular needs, resources, and assets.
Data available in certain communities. In addition to these generally available sources, individual jurisdictions may collect primary data, depending on local resources and interests, or may have unique data available from other sources for secondary analyses. Such data may be quantitative or qualitative. Although
TABLE 7-2 List of Indicators Available for Use at the Community Level
| Indicator Topica | Data Source | Current Availability by Community Sizeb | |
| Larger | Smaller | ||
| Overarching/System-Level | |||
|
Obesity-adult |
BRFSS | ||
|
Overweight-adult |
BRFSS | ||
|
Obesity-adolescent |
School reports, YRBSS | ||
|
Overweight-adolescent |
School reports, YRBSS | ||
|
Obesity-child |
School reports | ||
|
Overweight-child |
School reports | ||
|
Obesity-preschool age (low income) |
WIC | ||
| Goal Area 1: Physical Activity Environment | |||
|
Adult physical activity |
BRFSS | ||
|
Adolescent physical activity |
YRBSS | ||
|
Joint/shared use of community facilities (school facilities) |
SHPPS | ||
|
Adult active transport by walking |
ACS | ||
|
Bicycling by adults |
ACS | ||
|
Recreational facility outlet density |
CzCBP | ||
|
Leisure physical activity-adultc |
BRFSS | ||
|
Screen time-adolescentsc |
YRBSS | ||
| Goal Area 2: Food and Beverage Environment | |||
|
Sugar-sweetened beverage policies in schools (school district) |
SHPPS | ||
|
Sugar-sweetened beverage consumption |
YRBSS (adolescents) | ||
|
School policies to facilitate access to clean drinking water |
SHPPS | ||
|
Consumption of fruit-adult |
BRFSS (adults) | ||
|
Consumption of fruit-adolescent |
YRBSS (adolescents) | ||
|
Consumption of vegetable-adult |
BRFSS (adults) | ||
|
Consumption of vegetable-adolescent |
YRBSS (adolescents) | ||
|
Fast food outlet density |
CzCBP | ||
|
Healthy food outlet density |
CzCBP | ||
|
SNAP and WIC-authorized storesc |
USDA | ||
|
Farmers’ markets densityc |
USDA | ||
|
Population living in food desertsc |
USDA | ||
| Goal Area 3: Messaging Environment | |||
| Goal Area 4: Health Care and Worksite | |||
| Goal Area 5: School Environment | |||
|
Daily school physical education (adolescent participation) |
YRBSS | ||
|
Daily school physical education (school requirements) |
SHPPS | ||
| Indicator Topica | Data Source | Current Availability by Community Sizeb | |
| Larger | Smaller | ||
|
School recess (elementary school)-school district |
SHPPS | ||
|
School recess time (elementary school)-school district |
SHPPS | ||
|
Availability of healthy food options in schools-school district |
SHPPS | ||
|
School Breakfast Program in schools-school district |
SHPPS | ||
|
National Health Education Standards |
SHPPS | ||
|
Nutrition professional development for teachers |
SHPPS | ||
| Demographics and Social Determinants | |||
|
Aged |
ACS, Census Bureau | ||
|
Incomed |
ACS, Census Bureau | ||
|
Educationd |
ACS, Census Bureau | ||
NOTES: Green = available for all communities; yellow = available for some communities; red = not readily available at community level. Data sources are detailed in Appendix D. ACS = American Community Survey; BRFSS = Behavioral Risk Factor Surveillance System; CZCBP = County and ZIP Code Business Patterns; SHPPS = School Health Policies and Practices Study; SNAP = Supplemental Nutrition Assistance Program; USDA = U.S. Department of Agriculture; WIC = Special Supplemental Nutrition Program for Women, Infants, and Children; YRBSS = Youth Risk Behavior Surveillance System.
a Indicator topics identified in Chapter 4 of this report, i.e., from available ongoing data sources.
b Smaller <50,000 population; larger >50,000 population.
c Indicator not included in Committee’s recommended indicators (Chapter 4) but may be of interest to some communities.
d Indicator to track and monitor differential rates of exposures to social and policy environments.
TABLE 7-3 Indicators Requiring Further Development and/or Implementation at the Community Level, by APOP-Recommended Environment*
| Environment | Indicator Topica |
| Overarching |
• Birth weight • Gestational weight gain • Maternal post-pregnancy weight • Maternal pre-pregnancy weight • Overweight-infant |
| Physical activity environment |
• Active commuting to school • Child and adolescent daily vigorous physical activity • Child/adolescent physical activity–related attitudes and perceptions (safe, supportive neighborhoods) • Nonschool organized physical activity (children and adolescents) • Physical activity for older adults • Physical activity programs (adults) • Physical activity requirements for licensed child care • Policies that promote physical activity and the built environment |
| Environment | Indicator Topica |
| Food and beverage environment |
• Children and adolescent caloric intake in restaurants • Consumption of solid fats, added sugars, whole grains • Energy intake-adults, adolescents, and children • Food retail incentive policies • Healthy vending/concession policies in government buildings, worksites, and facilities • Nutrition standards in child care • Policies and practices to increase healthier food and beverages for children in restaurants • Price of low-fat milk • Sugar-sweetened beverage consumption (adults, children) • Sugar-sweetened beverage taxation and other policies and practices to reduce overconsumption of sugar-sweetened beverages |
| Message environment |
• Nutrition education policies for local nutrition programs • Purchase of Dietary Guidelines for Americans (DGA) foods and beverages by Supplemental Nutrition Assistance Program participants • Purchase of recommended DGA foods |
| Health care and worksites |
• Body mass index measurement by physicians • Breastfeeding disparities • Community-based primary prevention nutrition/physical activity–related services • Employee health promotion programs • Employee participation in exercise programs • Employee participation in health promotion programs • Employer lactation support programs • Exclusive breastfeeding • Hospital breastfeeding policies • Insurance incentives for healthy lifestyles • Nutrition/weight/physical activity counseling by physicians • Obesity screening and prevention metrics • Obesity screening and prevention reimbursement strategies • Obesity screening and promotion strategies offered by health plans |
| School environment |
• Child school dietary intake/solid fats and added sugars • College physical education/nutrition education • Farm-to-school programs • Federal school meal standards • Nutrition standards in child care • Quality physical education policies • Schools providing food and beverages meeting the DGA |
| Other indicators |
• Norms and attitudes—beliefs about causes of obesity, appropriate obesity prevention strategies, challenges of the community, awareness of community resources, etc. • Percentage APOP-recommended interventions in place |
* Accelerating Progress in Obesity Prevention (APOP) report (IOM, 2012a).
a These are indicators identified in Table 4-1 and related to APOP strategies that are also gaps at the community level.
the Committee was unable to develop a comprehensive census or representative sample of all such data, Table 7-4 provides some possibilities. Box 7-5 illustrates an example of a local health department collecting primary data through local surveys.
Identify Sub-Populations and Small Areas
Obesity and its determinants vary across sub-populations and neighborhoods within the larger community. People of color, sexual minorities, and low-income people are affected by health inequities, as discussed in Chapter 5. Low-income neighborhoods and those with concentrations of minorities have higher obesity rates and greater prevalence of factors that increase obesity. Reporting on rates of obesity, obesity-related behaviors, and on their determinants among these sub-populations and neighborhoods in relation to better-off populations and places provides documentation of inequities and motivates interventions to reduce them.
Select Data to Be Included About Context, Assets, Interventions, Barriers
Obesity prevention occurs in the context of local conditions—demographics and income inequities assets, interventions, and barriers to implementation of interventions. Many communities describe the local context in other documents or formats besides a CA or a surveillance report. Obesity-focused CAS can refer to these sources or include contextual information in the obesity CAS if it helps to make sense of the findings. As described in Table 7-1, demographic contextual data are available variously at the county, incorporated place, ZIP code tabulation area, and school district levels from the American Community Survey and at the census tract level from the Decennial Census. Other contextual data generally accrue in records of various public agencies and their contractors or vendors in individual communities. Additional types and uses to support the inclusion of contextual variables are described in Chapter 5.
COLLECT DATA
The Committee recommends that all communities use the data that are readily available online to conduct basic obesity CAS. Some communities may wish to supplement these data through local ad hoc or periodic data collection.
Obtain Existing Data from Web-Based Platforms
Several websites offer county-level data and data visualization tools that map and chart data (see Table 7-5). The most extensive is the Community Commons and its sister site CommunityHealthNeedsAssessment.org (Community Commons, 2013a). Together they include a data warehouse, a mapping tool, and a CA development tool. The Commons provides access to thousands of comprehensive and current geographic information system data layers and tables ranging from national to point level. Through “Make a Map,” users can explore all data sets and make dynamic, multi-layer maps at the state, county, city, or neighborhood (e.g., ZIP code and census tract) levels (Community Commons, 2013b).
Chna.org produces a CA that includes available indicators selected by the user and then produces maps, charts, and tables. CDC provides data at its Diabetes Interactive Atlas website, which allows the user to view data and trends for diagnosed diabetes (new and existing cases), obesity, and leisure-time
TABLE 7-4 Examples of Data Available in Certain Communities
| Data | Description |
| Body mass index (BMI) of school-aged children | Several states have varying policies for mandating the collection and reporting of BMI (or height/weight) data of students in their schools (NASBE, 2013). |
| Community programs and activities | Community-based programs collect data on their activities. Real-time access to and summary of data already collected through community-based organizations—such as participation in fitness classes and programs, trends in types of food purchased—could be assembled at the local level. Rewards/recognition could be given to participating entities to encourage provision of data. |
| Employee wellness policies and programs | Local business associations may track the presence and types of employee wellness policies and programs, offering insight into the extent to which employers are encouraging active living and healthy eating at work. |
| Environmental scans of activities | Communities may undergo environmental scans to identify obesity prevention activities that are being implemented. |
| Health plan data (BMI and other individual health data) | Some health care providers and local and regional quality improvement collaboratives are reporting BMI data. It may be possible to aggregate BMI and other individual health data across health providers and systems to produce community-level data, although this approach is in its infancy and substantial technical (e.g. aggregation of data across disparate electronic health record [EHR] platforms), political, privacy, and resource issues will need to be overcome before the promise of this approach can be realized. In addition, the validity of EHR data needs to be assessed on a variable by variable basis, and standardized measurement protocols are lacking (Chan et al., 2010; Sheon et al., 2011). Despite these concerns, there is limited evidence that using EHR weight data can accurately describe the weight status of the population and the extent to which providers are measuring it (Arterburn et al., 2009). Data collected by health plans from health risk assessments may become another useful source of self-reported weight and height and obesity-related health behaviors. |
| Local health department survey and other data | Some local health departments collect primary data through local surveys. They may add additional respondents to state Behavioral Risk Factor Surveillance System samples to allow analysis at the county, city, or neighborhood levels. They may conduct surveys to collect data indicators of local interest. Local health departments may also obtain and analyze local data sources, such as built and food environment, vending machine, and child care audits. For example, the availability of county licensing data has allowed Public Health–Seattle & King County to map food retail sites to assess food availability at the neighborhood level (King County, 2013a). California collects detailed health data with the California Health Interview Survey, which provides data for most individual counties for most of its indicators (data from smaller counties is pooled) (CHIS, 2013). New York City conducted a local version of National Health and Nutrition Examination Survey in 1999 and plans to do a second survey in 2013 (New York City Department of Health and Mental Hygiene, 2013b). |
| Local planning departments data | Local planning departments may have databases describing parks and green spaces, locations of trails and recreation facilities, presence of sidewalks, locations of supermarkets and other food-related businesses, and other features of the built environment. They produce maps of these features, often in collaboration with local health departments. |
BOX 7-5
Public Health–Seattle & King County Supporting Primary Data Collection
Public Health–Seattle & King County supports Communities Count, which provides data on the health and well-being of King County communities, informs funding decisions, engages citizens, and complements King County’s existing health, economic, and environmental indicators. It includes measures of obesity, food access (“deserts”), and physical activity derived from existing data sets and complemented by interviews with county residents. In partnership with the state health department and the University of Washington, Public Health–Seattle & King County is conducting a survey of child care sites to assess implementation of nutrition and physical policies and best practices. In collaboration with the University, it has completed a survey of school obesity-related policies and food environments. It is designing a local policy surveillance system to monitor the adoption and implementation of obesity-related policies at the county and municipal levels.
SOURCE: Communities Count, 2012. Communities Count: Social and Health Indicators Across King County.
http://www.communitiescount.org (accessed July 11, 2013).
physical inactivity at national, state, and county levels (CDC, 2013). U.S. Department of Health and Human Services (HHS) offers Community Health Status Indicators for counties, although the latest data are from 2006 (HHS, 2013). USDA hosts the Food Atlas (ERS, 2013), which assembles indicators of three broad categories: the food environment (e.g., food choices including access to and acquisition of healthy, affordable food), health and well-being (e.g., food insecurity, diabetes and obesity rates, and physical activity levels), and community characteristics (e.g., demographics composition, natural amenities, recreation and fitness centers). County Health Rankings compiles county-level data (some of it estimated rather than directly measured in the county) from multiple sources and ranks counties within states (County Health Rankings, 2013; Remington and Booske, 2011). The Census County and ZIP Code Business Patterns provides counts of food and recreation establishments at the county and ZIP code levels (Census Bureau, 2013b). The Census Bureau’s American Community Survey provides detailed demographic, housing, commuting, and economic data (Census Bureau, 2013a).
Additional Locally Collected Data
Communities across the nation have added locally collected data to supplement generally available data, contingent on local resources, interests, and skills. As described above, data may be available from public health, planning, health care, and other sectors. A community may choose to add additional sample size to existing surveys such as the BRFSS or field its own survey. Qualitative data from public forums, interviews, focus groups, photovoice, and other emerging methods can add valuable information about local context, environments, and policies and can be useful in sense-making and summary forums.
TABLE 7-5 Sources of Data from Web-Based Platforms
| Source (Latest Year) | Overarching | Physical Activity Environment | Food and Beverage Environment | Demographics | Comments | ||||||
| Obesity | Overweight | Leisure time | Active transport | Recreational facilities outlet density | Consumption of fruits and vegetables | Grocery/supermarket density | Fast food outlet density | Local food | |||
| American Community Survey (2011) | • | • | 1-, 3-, or 5-year estimates, depending on population size | ||||||||
| http://www.census.gov/acs | |||||||||||
| CDC Diabetes Interactive Atlas (2009) | • | • | Can compare counties across the United States, maps, trends | ||||||||
| http://www.cdc.gov/diabetes/atlas/countydata/atlas.html | |||||||||||
| Community Commons | Maps | ||||||||||
| http://www.communitycommons.org | |||||||||||
| Community Health Needs Assessment (2010-2011) | • | • | • | • | • | • | • | • | Maps, charts | ||
| http://www.chna.org | |||||||||||
| Community Health Status Indicators (2006) | • | • | • | • | • | Offers peer county comparisons | |||||
| http://www.communityhealth.hhs.gov/homepage.aspx?j=1 | |||||||||||
| County and zIP Code Business Patterns (2011) | •b | •b | •b | ||||||||
| http://www.census.gov/econ/cbp | |||||||||||
| County Health Rankings (2010) | • | • | • | • | • | • | Ranks counties within states | ||||
| http://www.countyhealthrankings.org | |||||||||||
| Food Atlas (2009) | •a | • | • | •c | • | • | • | Maps comparing counties, tables, trends | |||
| http://www.ers.usda.gov/data-products/food-environment-atlas.aspx | |||||||||||
NOTE:: Web addresses accessed November 11, 2013.
a Also preschool obesity.
b Counts of stores.
c Also percentage living without nearby store.
SOURCES: CDC, 2013; Census Bureau, 2013a,b; Community Commons, 2013b,c; County Health Rankings, 2013; ERS, 2013; HHS, 2013.
Asset Mapping
The aim of asset mapping is to collect information on community assets (e.g., capabilities and service offerings of key individuals, organizations, and agencies; environmental conditions and policies that affect obesity; community resources such as parks and recreation centers) to better understand and enhance resources that can contribute to obesity prevention. Assets can be identified through interviews with key informants from relevant sectors of the community and from review of reports, service directories, maps, and websites. They have particular value in overcoming the sense of discouragement associated with the history of mapping only the deficits of some communities, such as minority communities (DyckFehderau et al., 2013). Some of the same Web-based platforms (e.g., Community Commons, Community Health Needs Assessment) can be helpful resources for mapping community assets (see Table 7-5).
Department of Motor Vehicles Data
The Oregon Health Authority has explored the usefulness of using BMI data calculated from height and weight information on state-issued driver licenses and identification cards (Morris et al., 2012). Although such data tend systematically to underestimate weight in women, overestimate height in men, and underestimate BMI relative to BRFSS estimates, they should prove useful for describing temporal trends and small area spatial patterns. Driver licenses data would be useful only for first-time applicants because height and weight status may not be changed during renewal processes. Thirty-nine states collect height and weight data for licenses and identification cards (Morris et al., 2012).
Crowd-Sourcing
Citizen scientists4 have used crowd-sourcing5 models to collect scientific data. Projects such as HealthMap,6 Asthmapolis,7 FluNearYou,8 Galaxy Zoo,9 Foldit,10 Lucien Engelen’s Crowdsource your health,11 and CureTogether,12 provide promising examples of how to collect and analyze large quantities of meaningful data. For example, HealthMap collects informal online data sources for disease outbreak monitoring and real-time surveillance of emerging public health threats, including citizen-generated data from mobile devices. Methods used by crowd-sourcing include monitoring online conversations and postings, recruiting people to document their communities with smartphone cameras, and engaging people in wiki-based research projects and virtual focus groups.
A study at Washington University explored the use of crowd-sourcing to capture behavioral physical activity changes as a result of policy and built environment changes (Hipp et al., 2013). Although limited in its current application to obesity prevention interventions, crowd-sourcing may offer a useful approach
_____________
4 Citizen scientists participate in the systematic data collection and analysis; technology development; natural phenomena testing; and dissemination of activities on an advocational basis (Open Scientist, 2011).
5 Crowd-sourcing is the practice of obtaining needed services, ideas, or content by soliciting contributions from a large group of people, typically through the Internet.
6 See http://healthmap.org/about (accessed November 11, 2013).
7 See http://properhealth.com (accessed November 11, 2013).
8 See http://www.flunearyou.org (accessed November 11, 2013).
9 See http://www.galaxyzoo.org (accessed November 11, 2013).
10 See http://fold.it/portal (accessed November 11, 2013).
11 See http://www.ted.com/talks/lucien_engelen_crowdsource_your_health.html (accessed November 11, 2013).
12 See http://curetogether.com (accessed November 11, 2013).
to data collection when data are not available from current sources. Addressing issues of validity, reliability, and representativeness will be essential before this approach can be recommended for routine use.
Qualitative Information
Local assessments can also incorporate qualitative information (Denzin and Lincoln, 2011). The combination of qualitative and quantitative data in a mixed-methods approach can produce a more complete picture of community health (Creswell et al., 2011; Johnson et al., 2007).
Qualitative data can enhance CAS by capturing information that is difficult to obtain through quantitative methods such as community assets for obesity prevention, attitudes and beliefs, and leadership and social and political capital to create change (Work Group for Community Health and Development and University of Kansas, 2013b). They can provide information about subgroups and areas too small to describe with quantitative sources by asking community members and community-based organizations about health issues affecting their communities. The process of collecting qualitative data can be a powerful tool for engaging stakeholders and community members in the CAS process. For example, the King County Food and Fitness Initiative used qualitative methods to identify specific and local conditions contributing to obesity, community assets and barriers for promoting healthy eating and active living, and culturally appropriate interventions in two King County neighborhoods, particularly among immigrant and refugee populations (University of Washington Department of Urban Design and Planning, 2008). In another example, an evaluation of Healthy Tomorrows for New Britain Teens used photovoice, a qualitative method, to capture in pictures community barriers and facilitators for physical activity, and to ask what made for stress and happiness in their community (Hannay et al., 2013). Although quantitative data from surveys such as the BRFSS and the YRBSS can show prevalence and trends for selected indicators, they are often inadequate for explaining the meaning of observed patterns and understanding the local factors driving the indicators; for instance, how improvements/worsening was associated with changes in resources, leadership, or opposition. Qualitative data can fill this gap and give local decision makers useful information for prioritizing among strategies and local program developers’ insight into how best to implement a strategy in their community.
Simple qualitative data collection methods can be substantially less costly than quantitative methods and thus may be a more feasible approach for low-resource communities. These kinds of data can provide an actionable description of community obesity issues.
Limitations of qualitative data have been well described (Baum, 1995; Jick, 1979; Tashakkori and Teddlie, 1998). Qualitative data may not be representative of the population of interest unless appropriate sampling and analytic techniques are used (Brownson et al., 1997). Data can be sensitive to evaluator bias because of the high level of interaction between data collector and data source (Patton, 1987).
Create an Inventory of Local Interventions
A description of local interventions that address obesity can help communities to better understand how changes in the environment (programs, policies, built environment) are unfolding. It can also enable them to see gaps in current activities, better allocate resources, and envision opportunities for coordination and system building. To construct an inventory, community and evaluation partners often use: (a) document review (e.g., of reports, meeting minutes, websites) and (b) interviews with key informants who are knowledgeable about change efforts in their sectors or organizations (e.g., schools, public health,
parks and recreation, community health foundations and councils). When these data are gathered systematically and characterized by important dimensions (e.g., change strategy, reach, duration), they can be displayed in graphic form to support sense-making and visualization of collective impact (Collie-Akers et al., 2007; Fawcett and Schultz, 2008).
ANALYZE AND INTERPRET THE DATA
Once data are collected, those conducting assessments and surveillance should consider several analytic approaches to maximize their impact. These include
• using estimation methods based on state and/or national data when local data are not available;
• displaying trends over time;
• presenting data separately for children (including stratification by preschool, elementary school, middle school, and high school, when possible) and adults;
• describing health inequities through analysis of variation in indicators across race/ethnic and income groups and across small areas (small areas analysis) as appropriate;
• including comparison to benchmarks such as Healthy People 2020 (HHS, 2010) or state health goals, and to rates in state and peer communities;
• comparing extent of existing policies and programs described by the assessment with those recommended in the APOP report (IOM, 2012a);
• sharing data with community members and other stakeholders for interpretation (i.e., systematic reflection on what is seen, its meaning, and implications for action) to identify gaps in local obesity prevention activities and suggest actions; and
• visualizing the data with effective charts, maps, and infographics.
Because methods for the analysis of CAS data are well described (NACCHO, 2013; Teutsch and Churchill, 2000), the Committee limits the rest of this discussion to key issues and emerging methods for interpreting and analyzing the data that are collected.
Quantitative Methods
Basic quantitative methods are well described and widely used (NACCHO, 2013; Teutsch and Churchill, 2000) More sophisticated CAS adds small-area analysis, statistical methods to assess the significance of across-strata differences and time trends, and comparison to peer communities and/or benchmarks. More advanced methods, although not widely used, include use of Bayesian hierarchical modeling, space-time clustering, time series analysis, and geospatial analysis (Brookmeyer and Stroup, 2004; Choi, 2012; Lee et al., 2010; Rao, 2003).
Small-Area Analysis
Small-area analytic methods can provide estimates of indicators for entire communities with small populations and for subdivisions of larger jurisdictions, such as places with disproportionate or unmet health needs (e.g., at the sub-county, neighborhood, ZIP code, or census tract levels) (see Jia et al., 2004; Riva et al., 2007; Srebotnjak et al., 2010). Small-area analysis includes mapping the prevalence of obesity
and its determinants by ZIP code or neighborhood to help to identify specific groups and places experiencing health disparities and differential exposure to determinants of obesity such as density of fast food retailers or location of parks and trails. Small areas may include towns or urban neighborhoods of concentrated poverty. Often, data are not readily available at the small-area level. Until the density of data collection is improved, it is necessary to use alternative approaches including quantitative methods such as pooling data across multiple years, or using synthetic, Bayesian and microsimulation multi-level estimation methods and qualitative methods. For application of small-area analysis to obesity, see Li et al. (2009) and Zhang et al. (2013).
Synthetic Estimation
Synthetic estimation uses national- and state-level data to provide local-level estimates of health service utilization, expenditures, health insurance, household income, and health behaviors (AHRQ, 2013; Census Bureau, 2013c; NCI, 2013). Synthetic estimates use demographic data at the county level, often from the American Community Survey (Census Bureau, 2013a), to directly adjust data available at higher geographic levels so that they reflect county-level or sub-county-level population composition. For example, estimates can be constructed from the National Survey of Children’s Health to obtain county-level prevalence data for childhood overweight and obesity and related variables such as physical activity of child and parents/family (Data Resource Center for Child and Adolescent Health, 2011).
Bayesian Estimation
This method is based on generating indirect model-dependent estimates using a statistical multi-level model that “borrows strength” in making an estimate for one small area from data collected in other nearby areas (Malec et al., 1997; Rao, 2003). Bayesian multi-level modeling techniques, a type of synthetic estimate, have been widely used to obtain local approximations based on state or national data adjusted for the local demographic correlates of the desired statistic. For example, CDC’s National Diabetes Interactive Atlas (CDC, 2013) provides county-level estimates of obesity, physical inactivity, and diabetes using data from the BRFSS and the Census Bureau’s Population Estimates Program (see Table 7-4) to model estimates.
Qualitative and Mixed Methods
A variety of methods are used in qualitative assessment. The more common methods include collecting data through individual and group interviews, field observations, focus groups, community meetings, open-ended survey questions, document reviews, pictures and videos (e.g., photovoice and digital storytelling), and case studies (or detailed examinations of individual cases). Rapid assessment methods, initially developed for use in low-resource developing countries without established quantitative public health surveillance systems, have been adapted for use in communities across the United States (Beebe, 2001; Kumar, 1993; Scrimshaw and Gleason, 1992). These methods can produce powerful stories that influence policy development and resource procurement. Applying qualitative methods to evaluate and monitor policy and environmental approaches at a population level has been underutilized in obesity prevention research. However, researchers have offered guidance in its application to environmental and policy interventions (case studies: Mitchell and Bernauer, 1998; surveys: Brownson et al., 2000; general use: Beierle,
1999; Sofaer, 1999; photovoice: Strack et al., 2010). All qualitative methods offer strengths (e.g., insights into context of population of interest, inexpensive) and have limitations (e.g., complexity of analysis, reliability, training, credibility to stakeholders (Issel, 2009; Patton, 1987).
Community assessments often rely on mixed methods—the combination of quantitative and qualitative approaches. As an example, a CA in Douglas County (Kansas) conducted by a partnership among the local health department, community hospital, United Way, and community foundation used a mixed methods approach to help to set priorities for its community health improvement plan (see Table 7-6) (Collie-Akers and Holt, 2012). The evaluators examined data from quantitative sources (e.g., BRFSS data) and qualitative/mixed methods sources (e.g., concerns survey, focus groups) for convergence on priority issues such as lack of access to affordable healthy foods and poverty.
Describing Health Inequities and Determinants of Health
As described in Chapter 5, a health inequity is difference or disparity in health outcomes or distribution of health determinants exposures that is systematic, avoidable, and unjust (Braveman, 2003; Kawachi, 2002). Thinking about differential exposures, vulnerabilities, and health consequences is a useful starting point. Describing health inequities requires compiling data for the populations or neighborhoods that are affected and then displaying the data to compellingly show the inequities.
Box 7-6 offers guidance that has been developed for ensuring that equity is incorporated into CAS design. Demographic and economic data are readily available from the American Community Survey. Maps at the county, ZIP code, and census tracts levels of some of these data are available from several visualization tool websites (see Table 7-5). Data on environments, behaviors, and obesity are harder to come by, given the limitations of routinely collected data. If quantitative data for the group of interest are not available, then options include collecting supplemental quantitative data (e.g., oversampling in surveys) or using qualitative methods (e.g., community listening sessions, key informant interviews). It may be helpful to develop a health equity value orientation in the CAS process by building awareness and understanding of social determinants of health and upstream (e.g., policy) approaches to health improvement, discussing goals of fairness within the health system and environment and its contribution to health (dis)advantage, health gaps, and social gradients of health outcomes (e.g., related to income inequality). Examples of how communities are assessing health disparities are illustrated in Box 7-7.
Placing Local Data in Context
Placing data in a comparative context helps users to understand whether a given indicator is a cause for concern and can motivate a community to take action if indicators are worse relative to its peers. Methods include comparisons to benchmarks and to peer communities. National benchmarks for obesity prevention are included in Healthy People 2020 (HHS, 2010), and many state health departments produce state obesity goals.13 Peer comparisons are available for counties at the County Health Indicators
_____________
13 National and state goals can be adjusted for local use using simple methods such as applying the fractional change of these benchmarks to local baseline data. For example, the Healthy People 2020 goal for adult obesity is based on a 10 percent improvement from a 2005-2008 baseline. A local community could apply the same improvement target to its baseline data. A more sophisticated approach could incorporate adjustment for age, gender, race/ethnicity, and income differences between the national and community populations.
BOX 7-6
How to Build Health Equity into Your Assessment/Surveillance
1. Understand the health equity issues in the project area
• Identify inequities in health outcomes
• Understand the underlying determinants and socioeconomic issues that lead to inequity (e.g., differential exposures, vulnerabilities, and consequences for marginalized groups)
2. Identify the disadvantaged group(s) on which to focus
• Review secondary data that have been disaggregated by different groups traditionally experiencing disparities (e.g., specific racial/ethnic, geographic, age, gender, religion, or wealth)
• Conduct quantitative or qualitative studies that look at differences between groups
• Work with community members and leaders to identify the most disadvantaged groups, and work within the locally accepted definition of disadvantaged groups
• Consider the cost of reaching/engaging a particular disadvantaged group compared to reaching another group that also needs attention
3. Decide what changes in conditions are important and feasible to change
4. Define goals and objectives for promoting health equity
5. Determine equity strategies and activities (e.g., modifying policies and programs to address differential exposures, vulnerabilities, and consequences)
6. Develop an equity-focused monitoring and evaluation system to assess progress in changing conditions and achieving health equity*
* Methodologies for measuring equity are addressed in detail in the source.
SOURCE: Adapted from USAID and MCHIP, 2011.
website (HHS, 2013) and for large metropolitan jurisdictions at SMART BRFSS (CDC, 2011). They can also be generated at Community Commons (Community Commons, 2013b).
Visualizing Data
Accurate data are essential for high-quality CAS. However, unless the data are readily understood and available in a timely manner, they will not effectively accelerate progress in obesity prevention. Visualization of data so that their meaning is easily understood is another key component of CAS (Tufte, 1997). The ability to create compelling graphics, including charts and maps, has increased dramatically
TABLE 7-6 Community Health Issues Identified Using a Mix of Community Assessment Methods (Douglas County, Kansas, 2012)
| Community Health Issue | Concern Survey | Focus Group | Interviews | Health Status Report | Photovoice |
| Lack of access to affordable healthy foods | • | • | • | • | • |
| Limited access to dental services | • | • | • | • | |
| Insufficient access to health care and other services | • | • | • | • | |
| Poverty/too few job opportunities | • | • | • | • | |
| Limited access to safe,* affordable housing | • | • | • | • | |
| Frequent abuse of alcohol (including binge drinking and drinking and driving) | • | • | • | • | |
| Lack of access to health insurance coverage | • | • | • | • | |
| Disparities in health outcomes and quality of life | • | • | • | ||
| Inadequate recognition of mental health issues and access to mental health services | • | • | • | ||
| Limited knowledge of available health and other services | • | • | • | ||
| Lack of physical activity | • | • | • | ||
| Inadequate transportation linking people to services, jobs, and recreation | • | • | |||
| Prevalence of abuse and intimate partner violence | • | • | |||
* Safe housing includes absence of environmental toxins, including mold and lead.
SOURCE: Collie-Akers and Holt, 2012.
with the widespread availability of software applications and user-friendly websites for data visualization. For example, www.healthydane.org provides an interactive website to view the health status of Dane County, Wisconsin. It is available for use by the entire community. Mapping, facilitated by the increasing availability of geocoded data and sophisticated software, has emerged as a powerful tool for displaying geographic variability of indicators and time trends in geographic patterning.14 Storytelling can bring data to life and create a compelling case for action (Work Group for Community Health and Development and University of Kansas, 2013a). Collecting stories in a story bank so that relevant ones can be accessed in a timely fashion facilitates their use.
_____________
14 For examples, see http://childhealthdata.org/browse/rankings; http://www.cdc.gov/obesity/data/adult.html; http://www.communitycommons.org; http://www.countyhealthrankings.org (accessed November 11, 2013).
BOX 7-7
Assessing Health Inequities and Disparities
Contra Costa Health Services uses small-area analysis to identify health disparities within the Contra Costa county in California. With this information Contra Costa created a 5-year plan to reduce health and health care disparities. This includes efforts to improve its service delivery system to address health disparities (e.g., through culturally and linguistically appropriate services) and efforts to partner with local community and public agencies (e.g., education, housing, transportation, community development, land use planning) to address physical and social environmental factors that underlie health inequities. Website: http://cchealth.org (accessed November 12, 2013).
Alameda County Public Health Department in California is addressing the social conditions that lead to poor health through participation in the Joint Center for Political and Economic Studies, Health Policy Institute National Place Matters Initiative. Alameda County closely tracks inequities in health and uses data on social determinants of health to inform community health improvement efforts. Public health officials in Alameda County use compelling data to raise awareness about inequities and the importance of addressing conditions for health at a fundamental level, and they underscore the need for capacity-building to address these systemic issues. Website: http://www.acphd.org (accessed November 12, 2013).
DISSEMINATE FINDINGS
Community measures of obesity and its determinants are useful to the extent to which they are used to increase awareness of the issue, implement or improve interventions, and track progress (or lack thereof). Therefore, dissemination of findings to end users is an essential component of the assessment and surveillance process. Most commonly, findings are assembled into a report that is posted on a website or distributed to interested parties. Summarizing key findings in an infographic can help users to quickly understand the key messages. A few larger health departments have interactive data analysis or visualization tools on their websites to allow end users to customize their information (Communities Count, 2013; Los Angeles County, 2013; New York City Department of Health and Mental Hygiene, 2013a). Briefings of decision makers and policy makers can increase the likelihood that findings will shape policies, budgets, and programmatic decisions, especially if efforts are made to engage them in interpreting and making sense of the data. Using media advocacy methods to earn media coverage allows the findings to reach a larger audience (APHA, 2000; Wallack et al., 1999). Social media channels can augment coverage and reach more diverse audiences. Hosting community meetings to discuss and make sense of the data can engage residents in devising and implementing interventions and can build support for obesity prevention.
CURRENT PRACTICE IN COMMUNITY ASSESSMENT AND SURVEILLANCE
This chapter concludes with an overview of what communities across the United States are doing with respect to obesity-focused CAS. To locate CAS examples, the Committee consulted with experts and organizations that provide technical assistance for conducting CAS and used Internet search engines to identify and review existing CAS. Table 7-7 identifies indicators reported in the sample of CAS reports the Committee was able to identify and does not represent the wide-ranging set of obesity-related indicators measured in CAS across the country. The table aims to illustrate indicators that are reported from CAS in more than one community. Each community reported a number of other obesity-related indicators in its CAS, such as overweight low-income infants and children, use of outdoor recreational areas, safety of cyclists, adults who have been advised by a health care professional to lose weight, and gaining insight into the community’s obesity-related norms and attitudes, such as the accessibility to affordable healthy foods and effectiveness of the health care system (see Appendix G).
SUMMARY
Community assessments are intended to assess the current status, and surveillance systems are intended to assess progress overall in a community. They involve the collection of data at a point in time and over time at the community level for the purpose of describing current health status and determinants of health at points in time and over time. Specific to obesity, these data can describe the current state of obesity-related intended impacts and outcomes (see Figure 3-1) as well as contextual factors that influence obesity (e.g., demographics, social determinants).
Although the chapter identifies several resources available to aid communities across the country, there is no consensus guidance for what indicators to measure or what methodologies to use when conducting obesity-focused CAS. Based on a review of the current infrastructure for conducting obesity-focused CAS, the Committee found
• a lack of data available at the local level for indicators relevant to measuring progress of APOP strategies (IOM, 2012a). Especially needed are data for preschoolers and elementary school students and systematic descriptions of determinants of obesity (e.g., environments, policies, other interventions, norms, and attitudes). Additional sources of data at the local level may exist in multiple sectors, such as health care, planning, and schools; and
• a need to increase sample size of existing surveillance systems, add data on missing indicators, and develop new systems for policy, environmental, and intervention indicators, and for reporting data by race and socioeconomic status to the extent possible and by small areas affected by inequity in larger communities.
Other important findings include the following:
• There is a lack of a common set of indicators to allow cross-community comparisons and aggregation;
• Engaging stakeholders/community in assessment process is valuable;
• Capacity to develop assessments varies widely across communities; and
TABLE 7-7 Examples of Indicators Reported in Broader Community Health Assessment Reports
| Small Counties (<50,000 residents) | Large Counties (>50,000 residents) | |||||||
| Indicator Topic | Cherokee County, NCa | Hill County, MTb | Lincoln, MAc | McKean County, PAd | Contra Costa County, CAe | Dutchess County, NYf | Lawrence-Douglas County, KSg | Lee County, NCh |
| Overarching | ||||||||
|
Obesity (adult) |
• | • | • | • | • | |||
|
Overweight (adult) |
• | • | ||||||
|
Overweight/obese (adult) |
• | |||||||
|
Obesity (child) |
• | |||||||
|
Overweight (child) |
• | |||||||
|
Overweight/obese (child) |
• | • | ||||||
| Goal Area 1: Physical Activity Environmenti | ||||||||
|
Adults leisure time physical activity |
• | • | • | |||||
|
Adult physical activity |
• | • | ||||||
| Goal Area 2: Food and Beverage Environmenti | ||||||||
|
Adults consumption of fruits and vegetables |
• | • | • | |||||
|
Access to affordable healthy foods |
• | • | ||||||
| Goal Area 3: Message Environmenti | ||||||||
| Goal Area 4: Health Care and Worksite Environmenti | ||||||||
| Goal Area 5: School Environmenti | ||||||||
| Other: Norms/Attitudes, obesity-related | ||||||||
|
Perceived priorities/assets/issues/needs of the community (obesity-related) |
• | • | • | • | • | • | • | |
SOURCES: a County of Cherokee (2008); b Larson (2013); c Community Opportunities Group, Inc. (2010); d Center for Rural Health Practice and University of Pittsburgh at Bradford (2005); e Contra Costa Health Services Public Health Division (2010); f Center for Governmental Research (2009a,b); g Collie-Akers and Holt (2012); h Lee County Public Health Assessment Team and LeeCAN (2010).
i These are goal areas identified in the Accelerating Progress in Obesity Prevention report (IOM, 2012a).
• Improving the accessibility and dissemination of assessment data through multiple channels will improve their use for decision makers, media, and the public.
The Community Obesity Assessment and Surveillance Plan (see Box 7-1) provides guidance for local communities to identify and use a set of common indicators that measure impacts and outcomes of strategies recommended in the APOP report (IOM, 2012a). It also provides guidance for developing local capacity for these assessments, including common use and understanding of assessment protocols, descriptions of health disparities, community engagement, oversight, and public reporting on progress. The plan was developed not only to accommodate communities with varying resources and assets (i.e., large and small communities), but also to provide a common set of indicators that can be measured, compared, and aggregated across multiple jurisdictions. Given the existing gaps in the current infrastructure for CAS of APOP strategies identified by the Committee, Chapter 10 provides seven recommendations (and a set of potential actions and actors) to support the successful implementation of the components of the Community Obesity Assessment and Surveillance Plan.
REFERENCES
AHRQ (Agency for Healthcare Research and Quality). 2013. Medical expenditure panel survey: State-level medical expenditures. http://meps.ahrq.gov/data_stats/quick_tables_results.jsp?component=1&subcomponent=0&year= 2010&tableSeries=8&searchText=&searchMethod=1&Action=Search (accessed March 20, 2013).
APHA (American Public Health Association). 2000. APHA media advocacy manual. Washington, DC: APHA.
Arterburn, D. E., G. L. Alexander, J. Calvi, L. A. Coleman, M. W. Gillman, R. Novotny, V. P. Quinn, M. Rukstalis, V. J. Stevens, E. M. Taveras, and N. E. Sherwood. 2009. Body mass index measurement and obesity prevalence in ten U.S. health plans. Clinical Medical Research 8(3/4):126-130.
Baum, F. 1995. Researching public health: Behind the qualitative-quantitative methodological debate. Social Science and Medicine 40(4):459-468.
Beebe, J. 2001. Rapid assessment process: An introduction. Walnut Creek, CA: Altamira Press.
Beierle, T. C. 1999. Using social goals to evaluate public participation in environmental decisions. Policy Studies Review 16(3/4):75-103.
Braveman, P. A. 2003. Monitoring equity in health and healthcare: A conceptual framework. Journal of Health Population Nutrition 21(3):181-192.
Brookmeyer, R., and D. F. Stroup. 2004. Monitoring the health of populations: Statistical principles and methods for public health surveillance. New York: Oxford University Press.
Brownson, R. C., C. J. Newschaffer, and F. Ali-Abarghoui. 1997. Policy research for disease prevention: Challenges and practical recommendations. American Journal of Public Health 87(5):735-739.
Brownson, R. C., R. A. Housemann, D. R. Brown, J. Jackson-Thompson, A. C. King, B. R. Malone, and J. F. Sallis. 2000. Promoting physical activity in rural communities: Walking trail access, use, and effects. American Journal of Preventive Medicine 18(3):235-241.
CDC (Centers for Disease Control and Prevention). 2010. 10 essential public health services. http://www.cdc.gov/nphpsp/essentialservices.html (accessed March 20, 2013).
CDC. 2011. SMART: BRFSS city and county data. http://www.cdc.gov/brfss/smart/technical_infodata.htm (accessed July 12, 2013).
CDC. 2013. Diabetes public health resource. Diabetes interactive atlas. http://www.cdc.gov/diabetes/atlas (accessed May 30, 2013).
Census Bureau. 2013a. American community survey. http://www.census.gov/acs/www (accessed July 11, 2013).
Census Bureau. 2013b. County business patterns (CBP) and zip code business patterns (ZBP). http://www.census.gov/econ/cbp (accessed July 11, 2013).
Census Bureau. 2013c. Model-based small area income & poverty estimates (SAIPE) for school districts, counties, and states. http://www.census.gov/did/www/saipe (accessed March 20, 2013).
Center for Governmental Research. 2009a. Appendix B—survey script. http://www.co.dutchess.ny.us/CountyGov/Departments/Health/Publications/HDICASurveyAppB.pdf (accessed April 24, 2013).
Center for Governmental Research. 2009b. Dutchess County ICA community health survey final report. http://www.co.dutchess.ny.us/CountyGov/Departments/Health/Publications/HDICASurvey.pdf (accessed April 24, 2013).
Center for Rural Health Practice and University of Pittsburgh at Bradford. 2005. Community health needs assessment. Mckean County, Pennsylvania. http://www.upb.pitt.edu/uploadedFiles/About/Sponsored_Programs/Center_for_Rural_Health_Practice/CHA%20Final.pdf (accessed April 22, 2013).
Chan, K. S., J. B. Fowles, and J. P. Weiner. 2010. Electronic health records and the reliability and validity of quality measures: A review of the literature. Medical Care Research and Review 67(5):503-527.
CHIS (California Health Interview Survey). 2013. California health interview survey. http://healthpolicy.ucla.edu/chis/Pages/default.aspx (accessed July 11, 2013).
Choi, B. C. K. 2012. The past, present, and future of public health surveillance. Scientifica (2012).
Cibula, D. A., L. F. Novick, C. B. Morrow, and S. M. Sutphen. 2003. Community health assessment. American Journal of Preventive Medicine 24(4 Suppl):118-123.
Collie-Akers, V., and C. Holt. 2012. Douglas County community health assessment report. Community Health Improvement Partnership, Lawrence-Douglas County Health Department, Work Group for Community Health and Development.
Collie-Akers, V., S. B. Fawcett, J. A. Schultz, V. Carson, J. Cyprus, and J. E. Pierle. 2007. Analyzing a community-based coalition’s efforts to reduce health disparities and the risk for chronic disease in Kansas City, Missouri. Preventing Chronic Disease 4(3):A66.
Communities Count. 2013. New! Interact with adult obesity data. http://www.communitiescount.org/index.php?page=interactive-15-demographic-breakdowns (accessed April 22, 2013).
Community Commons. 2013a. About. Community commons. http://www.communitycommons.org/about (accessed May 30, 2013).
Community Commons. 2013b. Community commons. Together for the common good. http://www.communitycommons.org (accessed April 4, 2013).
Community Commons. 2013c. Community health needs assessment (CHNA). http://assessment.communitycommons.org/CHNA (accessed July 11, 2013).
Community Opportunities Group, Inc. 2010. Town of Lincoln community health assessment & planning project. http://www.lincolntown.org/Adobe%20Acrobat%20Files/Healthy%20Community/Lincoln%20Healthy%20Communities%20Final%20Report%20071210.pdf (accessed April 22, 2013).
Contra Costa Health Services Public Health Division. 2010. Community health indicators for Contra Costa County. http://cchealth.org/health-data/hospital-council/2010/pdf/2010_community_health_indicators_report_complete.pdf (accessed April 22, 2013).
County Health Rankings. 2013. County health rankings & roadmaps: A healthier nation, county by county. http://www.countyhealthrankings.org (accessed July 12, 2013).
County of Cherokee. 2008. Cherokee County community health assessment (CHA). http://www.mahec.net/media/nccha/cherokee.pdf (accessed April 22, 2013).
Creswell, J. W., A. C. Klassen, V. L. Plano Clark, and K. C. Smith. 2011. Best practices for mixed methods research in the health sciences. Bethesda, MD: Office of Behavioral and Social Sciences Research, National Institutes of Health.
Data Resource Center for Child and Adolescent Health. 2011. Local uses of state data and how to construct a synthetic estimate. Portland, OR: Oregon Health and Sciences University.
Denzin, N. K., and Y. S. Lincoln. 2011. The Sage handbook of qualitative research. 4th ed. Los Angeles, CA: Sage Publications.
DyckFehderau, D., N. L. Holt, G. D. Ball, Alexander First Nation Community, and N. D. Willows. 2013. Feasibility study of asset mapping with children: Identifying how the community environment shapes activity and food choices in Alexander First Nation. Rural Remote Health 13:2289.
ERS (Economic Research Service). 2013. Food environment atlas overview. http://www.ers.usda.gov/data-products/food-environment-atlas.aspx#.Ud7zdDvksxF (accessed July 11, 2013).
Fawcett, S. B., and J. A. Schultz. 2008. Supporting participatory evaluation using the community tool box’s online documentation system. In Community-based participatory research for health, edited by M. Minkler and N. Wallerstein. San Francisco, CA: Jossey-Bass. Pp. 419-425.
Fawcett, S. B., R. Boothroyd, J. A. Schultz, V. T. Fancisco, V. Carson, and R. Bremby. 2003. Building capacity for participatory evaluation within community initiatives. Journal of Prevention and Intervention in the Community 26(2):21-36.
Fawcett, S., C. Holt, and J. Schultz. 2011. Some recommended practice areas for community health improvement (report to the CDC, Office of Prevention through Healthcare). Work Group for Community Health and Development, University of Kansas.
Hannay, J., R. Dudley, S. Milan, and P. K. Leibovitz. 2013. Combining photovoice and focus groups: Engaging Latina teens in community assessment. American Journal of Preventive Medicine 44(3 Suppl 3):S215-S224.
HHS (Department of Health and Human Services). 2010. Healthy People 2020. http://www.healthypeople.gov/2020/default.aspx (accessed January 31, 2013).
HHS. 2013. Community health status indicators. http://www.communityhealth.hhs.gov/homepage.aspx?j=1 (accessed June 15, 2012).
Hipp, J. A., D. Adlakha, B. Chang, A. A. Eyler, and R. B. Pless. 2013. Emerging technologies: Webcams and crowd-sourcing to identify active transportation. Brown School Faculty Publications Paper 3.
IOM (Institute of Medicine). 2003. The future of the public’s health in the 21st century. Washington, DC: The National Academies Press.
IOM. 2007. Progress in preventing childhood obesity: How do we measure up? Washington, DC: The National Academies Press.
IOM. 2012a. Accelerating progress in obesity prevention: Solving the weight of the nation. Washington, DC: The National Academies Press.
IOM. 2012b. An integrated framework for assessing the value of community-based prevention. Washington, DC: The National Academies Press.
Israel, B. A., E. Eng, A. J. Schulz, and E. A. Parker. 2013. Methods for community-based participatory research for health. 2nd ed. San Francisco, CA: Jossey-Bass.
Issel, L. M. 2009. Health program planning and evaluation: A practical systematic approach for community health. 2nd ed. Sudbury, MA: Jones and Bartlett Publishers.
Jia, H., P. Muennig, and E. Borawski. 2004. Comparison of small-area analysis techniques for estimating county-level outcomes. American Journal of Preventive Medicine 26(5):453-460.
Jick, T. D. 1979. Mixing qualitative and quantitative methods: Triangulation in action. Administrative Science Quarterly 24(4):602-611.
Johnson, R. B., A. J. Onwuegbuzie, and L. A. Turner. 2007. Toward a definition of mixed methods research. Journal of Mixed Methods Research 1(2):112-133.
Kawachi, I., S. V. Subramanian, and N. Almeida-Filho. 2002. A glossary for health inequalities. Journal of Epidemiology and Community Health 56(9):647-652.
King County. 2013a. Health policy. http://your.kingcounty.gov/aimshigh/search2.asp?HHChHealthPolicy (accessed July 11, 2013).
King County. 2013b. Indicator: Obesity, health reporting areas. http://www.kingcounty.gov/healthservices/health/data/chi2009/RiskAdultObese/~/media/health/publichealth/documents/indicators/RiskAdultObeseMap.ashx (accessed April 15, 2013).
King County. 2013c. Indicator: Obesity, King County. http://www.kingcounty.gov/healthservices/health/data/chi2009/RiskAdultObese.aspx (accessed April 10, 2013).
Kumar, K. 1993. Rapid appraisal methods. Washington, DC: The World Bank.
Larson, K. 2013. Hill County community health assessment 2010-2011. http://www.dphhs.mt.gov/publichealth/accreditation/documents/hill-cha.pdf (accessed April 22, 2013).
Lee, L. M., S. M. Teutsch, S. B. Thacker, and M. E. St. Louis, eds. 2010. Principles & practice of public health surveillance. 3rd ed. New York: Oxford University Press.
Lee County Public Health Assessment Team and LeeCAN. 2010. Lee County North Carolina. Access to the world. Community health assessment. http://www.leecountync.gov/LinkClick.aspx?fileticket=YcCnyE8Z68k%3D&tabid=205 (accessed April 22, 2013).
Li, W., J. L. Kelsey, Z. Zhang, S. C. Lemon, S. Mezgebu, C. Boddie-Willis, and G. W. Reed. 2009. Small-area estimation and prioritizing communities for obesity control in Massachusetts. American Journal of Public Health 99(3):511-519.
Los Angeles County. 2013. LA HealthDataNow! http://dqs.publichealth.lacounty.gov/default.aspx (accessed April 22, 2013).
Malec, D., J. Sedransk, C. L. Moriarity, and F. B. LeClere. 1997. Small area inference for binary variables in the National Health Interview Survey. Journal of the American Statistical Association 92(439):815-826.
McIntyre, S., and A. Ellaway. 2000. Ecological approaches: Rediscovering the role of the physical and social environment. In Social epidemiology, edited by L. Berkman and I. Kawachi. New York: Oxford University Press. Pp. 332-348.
Minkler, M., and N. Wallerstein. 2008. Community-based participatory research for health: From process to outcomes. 2nd ed. San Francisco, CA: Jossey-Bass.
Mitchell, R., and T. Bernauer. 1998. Empirical research on international environmental policy: Designing qualitative case studies. Journal of Environment & Development 7(1):4-31.
Morris, D. S., S. S. Schubert, D. L. Ngo, D. Rubado, E. Main, and J. P. Douglas. 2012. DMV records are valuable for obesity surveillance in Oregon. Portland: Oregon Health Authority Environmental Public Health Tracking.
NACCHO (National Association of County and City Health Officials). 2013. Recommendations of characteristics for high-quality community health assessments and community health improvement plans. http://www.naccho.org/topics/infrastructure/CHAIP/upload/Final-Consensus-Statement-for-Distribution-Updated-032113.docx (accessed June 24, 2013).
NASBE (National Association of State Boards of Education). 2013. State school health policy database: Screening for health conditions. http://www.nasbe.org/healthy_schools/hs/bytopics.php?topicid=4100 (accessed April 15, 2013).
NCI (National Cancer Institute). 2013. Small area estimates for states, counties, & health service areas. http://sae.cancer.gov (accessed March 20, 2013).
New York City Department of Health and Mental Hygiene. 2013a. Epiquery: NYC interactive health data. https://a816-healthpsi.nyc.gov/epiquery (accessed April 22, 2013).
New York City Department of Health and Mental Hygiene. 2013b. New York City health and nutrition examination survey. http://www.nyc.gov/html/doh/html/data/nyc-hanes.shtml (accessed April 5, 2013).
NIH (National Institutes of Health). 2011. Principles of community engagement. 2nd ed. Pub 11-7782. Washington, DC: Government Printing Office.
Open Scientist. 2011. Finalizing a definition of “citizen science” and “citizen scientists.” http://www.openscientist.org/2011/09/finalizing-definition-of-citizen.html (accessed April 10, 2013).
Patton, M. Q. 1987. How to use qualitative methods in evaluation. Newbury Park, CA: Sage Publications.
Public Health Accreditation Board. 2012. National public health department accreditation prerequisites. http://www.phaboard.org/wp-content/uploads/PrerequisitesJuly-2012.pdf (accessed March 20, 2013).
Puget Sound Health Alliance. 2013. Alliance reports. What is the community checkup? http://www.wacommunitycheckup.org/resources/alliance-reports (accessed April 10, 2013).
Rao, J. N. K. 2003. Small area estimation. Hoboken, NJ: John Wiley & Sons.
Remington, P. L., and B. C. Booske. 2011. Measuring the health of communities—how and why? Journal of Public Health Management and Practice 17(5):397-400.
Riva, M., L. Gauvin, and T. A. Barnett. 2007. Toward the next generation of research into small area effects on health: A synthesis of multilevel investigations published since July 1998. Journal of Epidemiology and Community Health 61(10):853-861.
Scrimshaw, N., and G. R. Gleason. 1992. Rapid assessment procedures: Qualitative methodologies for planning and evaluation of health related programmes. Boston, MA: International Nutrition Foundation for Developing Countries.
Sheon, A., V. Katta, B. Costello, M. Longjohn, and K. Mantinan. 2011. Registry-based BMI surveillance: A guide to system preparation, design, and implementation. Ann Arbor, MI: Altarum Institute.
Sofaer, S. 1999. Qualitative methods: What are they and why use them? Health Services Research 34(5 Pt 2):1101-1118.
Srebotnjak, T., A. H. Mokdad, and C. J. Murray. 2010. A novel framework for validating and applying standardized small area measurement strategies. Population Health Metrics 8:26.
Strack, R. W., K. A. Lovelace, T. D. Jordan, and A. P. Holmes. 2010. Framing photovoice using a social-ecological logic model as a guide. Health Promotion and Practice 11(5):629-636.
Tashakkori, A., and C. Teddlie. 1998. Mixed methodology: Combining qualitative and quantitative approaches (applied social research methods). Thousand Oaks, CA: Sage.
Teutsch, S. M., and R. E. Churchill, eds. 2000. Principles and practice of public health surveillance. 2nd ed. New York: Oxford University Press.
Tsui, E., M. Cho, and N. Freudenberg. 2013. Methods for community-based participatory policy work to improve food environments in New York City. In Methods for community-based participatory research for health. 2nd ed, edited by B. A. Israel, E. Eng, A. J. Schulz, and E. A. Parker. San Francisco, CA: Jossey-Bass. Pp. 517-545.
Tufte, E. R. 1997. Visual explanations, images and quantities, evidence and narrative. Cheshire, CT: Graphics Press.
University of Washington Department of Urban Design and Planning. 2008. Food for thought: Groundwork for the King County Food & Fitness Initiative. Seattle, WA: University of Washington.
USAID (U.S. Agency for International Development) and MCHIP (Maternal and Child Health Integrated Program). 2011. Considerations for incorporating health equity into project designs: A guide for community-oriented maternal, neonatal, and child health projects. Washington, DC: U.S. Government Printing Office.
Wallack, L., K. Woodruff, L. Dorfman, and I. Diaz. 1999. News for a change: An advocate’s guide to working with the media. Thousand Oaks, CA: Sage.
Work Group for Community Health and Development and University of Kansas. 2013a. Community innovator: Increasing access to fresh produce in central Detroit. Peaches & greens produce market—Detroit, Michigan, United States. http://ctb.ku.edu/en/out_of_the_box/finalists/communityinnovatorPeachesAndGreens.aspx (accessed April 10, 2013).
Work Group for Community Health and Development and University of Kansas. 2013b. The Community tool box: Bringing solutions to light. http://ctb.ku.edu/en/default.aspx (accessed March 21, 2013).
Zhang, X., S. Onufrak, J. B. Holt, and J. B. Croft. 2013. A multilevel approach to estimating small area childhood obesity prevalence at the census block-group level. Preventing Chronic Disease 10:E68.


