
| Initiative (Time period) | Target Population/ Design | Intervention | Evaluation Methods | Results |
| 5-2-1-0 Let’s Go! (AHRQ Health Care Innovations Exchange, 2012h) (2009-2011) | Setting: Greater Portland, ME (Community, US) Target population: Children/adolescents Design: Pre/post | Community-level environmental and messaging strategies targeting physical activity, fruits and vegetables, sugary drinks, screen time | Parent surveys from 2007-2011 reporting program awareness and proxy report of children’s behavior | Increased prevalence of targeted behaviors based on parent self-reported data |
| Allegiance Health—Health Improvement Organization (AHRQ Health Care Innovations Exchange, 2012d) (2000-)a | Setting: Jackson, MI (Community, US) Target population: Adults, children/ adolescents Design: Pre/post | Health partnership efforts among patients, physicians, employers, schools, faith-based organizations, the health system, and the health plan | Pilot evaluation of worksite wellness component; tracking of employee participation health status measures | Participants managed stress better, avoided weight gain, controlled blood pressure and cholesterol, avoided sick days, and reduced overall health risk |
| Arkansas Obesity Prevention Initiative (University of Arkansas for Medical Sciences, 2011) (2000-2010) | Setting: Arkansas (State-level, US) Target population: Children/adolescents Design: Quasi-experimental | Range of statewide efforts to support local schools in making policy and environmental change, including Coordinated School Health and Safe Routes to School grants | School district surveys, stakeholder interviews with parents and school leaders, BMIb monitoring; sample of 484 schools across the state | No change in obesity rates. Decreases in student purchases from vending machines; but no changes in soda consumption or visits to fast food restaurants |
| EPODE (Together Let’s Prevent Childhood Obesity) (Romon et al., 2009) (1992-2004) | Setting: 2 small towns in northern France (Community, Europe) Target population: Children, 5-12 yrs old Design: Quasi-experimental (post only comparison) | A school-based nutrition information program initiated in 1992 followed by several community-based interventions | Repeated, cross-sectional, school-based survey for selected school years from 1992-2004 plus BMI on all 5-12 yrs old children attending school; survey in comparison towns in 2004 only | Age-adjusted odds ratio for overweight significantly lower in 2003 and 2004 (girls only). In 2004, the overweight prevalence was significantly lower than in the comparison towns |
| Initiative (Time period) | Target Population/ Design | Intervention | Evaluation Methods | Results |
| Five-a-Day Community Evaluation Tool (Ashfield-Watt et al., 2007) (2001-2005) | Setting: Five economically deprived communities in England (Community, Europe) Target population: Adults Design: Quasi-experimental | Community-based interventions to improve fruit and vegetable intake | 810 people in pilot intervention communities compared with 270 people participating in an unrelated observational study as controls | Knowledge increased as did access to fruits and vegetables, but no demonstrable effect on total fruit and vegetable intake |
| Girls Health Enrichment Multisite Studies (GEMS) (Klesges et al., 2010; Robinson et al., 2010) (1999-2001) | Setting: Memphis, TN; Oakland, CA (Community, US) Target population: Preadolescent overweight/obese African American girls Design: Randomized-controlled trial (individual-level) | Culturally appropriate obesity prevention approaches involving girls and their parents, community centers or YWCAs (Young Women’s Christian Association), and schools | Randomized to obesity prevention program intervention or alternative self-esteem building program | Memphis: no change in BMI Oakland: changes in BMI were not different in the intervention versus the control group |
| Hartslag Limburg (Schuit et al., 2006) (1998-2003) | Setting: Maastricht region, Netherlands (Community, Europe) Target population: Adults Design: Quasi-experimental | Integrative community-based cardiovascular disease prevention program promoting a healthy lifestyle | Cohort study comparing 5-year mean change in risk factors between the intervention and reference area | Adjusted difference in mean change in risk factors between intervention and reference group was significant for BMI, waist circumference, total cholesterol, and serum glucose |
| Healthy Eating, Active Communities and Central California Regional Obesity Prevention Program (HEAC/ CCROPP) (Samuels & Associates, 2010) (2007-2010) | Setting: 14 low-income communities in CA (Community, US) Target population: Youth and adults Design: Quasi-experimental | Policy and environmental interventions in schools, worksites, health care organizations, and the community at large | Repeated cross-sectional surveys of 400 randomly selected 7th and 9th grade students from 13 HEAC communities and 6 out-of-area comparison communities | Findings from the school survey combined with environmental assessments confirm that when students are exposed to healthier environments they are more likely to make healthier choices |
| Initiative (Time period) | Target Population/ Design | Intervention | Evaluation Methods | Results |
| Healthy Eating Active Lifestyles Together Helping Youth (HEALTHY) Armstrong (AHRQ Health Care Innovations Exchange, 2012a) (2005-2009) | Setting: Rural Armstrong County, PA (Community, US) Target population: Children Design: Pre/post | Using elements of the national We Can! program to help children improve their nutritional habits and engage in more physical activity | Pre- and post-implementation comparisons of student behaviors, including time engaged in physical activity, purchases of high-calorie foods, and school cafeteria expenditures on fresh fruits and vegetables | Significantly increased levels of physical activity and improved food choices made by students, who consume less “junk food” and more fruits and vegetables in school |
| Healthy Hawks program (AHRQ Health Care Innovations Exchange, 2012f) (2006-) | Setting: Communities in Kansas (Community, US) Target population: Overweight children Design: Pre/post (individual-level) | Working with children and their families to develop goals and strategies and establish a healthier lifestyle. Community support built for recruitment and sustainability of changes | Pre/post BMI; caloric intake (self-reported dietary data) | Significantly reduced caloric intake and BMI among participants after 12 weeks |
| Healthy Living Cambridge Kids (Chomitz et al., 2010) (2004-2007) | Setting: Cambridge, MA (Community, US) Target population: Students K-8 Design: Pre/post | Community-based effort to support the “5-2-1” guidelines: 5+ servings of fruits and vegetables, screen time <2 hours, 1+ hour of exercise | Comparison of BMI and fitness test results in a 1,900 students tested at baseline and 3 years after program implementation | BMI z-scoresc and proportion obese decreased, and mean number of fitness tests (0-5) passed increased. Obesity among all race/ethnicity groups declined |
| Kaiser Permanente Healthy Eating Active Living Community Health Initiative (HEAL-CHI) (Cheadle et al., 2012a) (2006-2010) | Setting: Three low-income communities in Northern CA (Community, US) Target population: Youth and adults Design: Quasi-experimental logic model design | Policy and environmental interventions in schools, worksites, health care organizations, and the community at large | School-based surveys and Fitnessgramd measures of students in intervention and matched comparison communities; surveys of adults using Interactive Voice Response in intervention communities | Improvements in physical activity behaviors found where high-dose interventions were present in schools |
| Initiative (Time period) | Target Population/ Design | Intervention | Evaluation Methods | Results |
| Nemours Delaware Initiative (Chang et al., 2010) (2006-) | Setting: Delaware (State-level, US) Target population: Children Design: Quasi-experimental | Statewide policy change; learning collaboratives; technical assistance to schools, child care, and primary care | Statewide survey in 2006, 2008. Fitnessgram measurement in pilot school physical education (PE) program (n=19) | Leveling off of obesity rates statewide. Students in pilot PE schools were 1.5 times more likely to be in Healthy Fitness zone (indicator of physical fitness) |
| New York City (NYC) Department of Health obesity prevention initiative (NYC Obesity Task Force, 2012) (2002-) | Setting: New York, NY (Community, US) Target population: Students K-8, adults Design: Pre/post | Community-based environment and policy change efforts, including schools, restaurants, grocery stores, hospitals, worksites | Use of existing surveys: NYC Community Health Survey, New York Youth Risk Behavior Survey, NYC Fitnessgram | Decline in K-8 obesity rate 5.5% between 2006-2007 (21.9%) and 2010-2011 (20.7%). No report on adult progress |
| Paso del Norte Foundation Obesity Initiative (Coleman, 2006; Coleman et al., 2005; Heath and Coleman, 2003; Hoelscher et al., 2010; Smith et al., 2005) (2002-2005) | Setting: El Paso, TX and surrounding area (Community, US). Target population: Adults, children Design: Pre/post (children) | Community-based initiatives that included coordinated school health program support (Coordinated Approach to Child Health [CATCH]), plus community nutrition (Que Sabrosa Vida) and activity (Walk El Paso) programs, and a media program for radio and TV | Population-based representative survey of school children in Texas Health Service Region 9/10 between 2000-2002 and 2004-2005 (School Physical Activity and Nutrition [SPAN] survey) | Children in 4th grade had a 7.0% decrease in obesity (statistically significant). Also related changes in behavior |
| Romp & Chomp (de Silva-Sanigorski et al., 2010) (2004-2008) | Setting: Geelong, Australia (Community, Australia) Target population: Young children (0-5 yrs old) Design: Quasi-experimental | Community-wide, multisetting, multistrategy intervention focused on community capacity building and environmental changes | Repeat cross-sectional design with a comparison sample | Significantly lower mean weight, BMI, and BMI z-scores in the intervention group. Significantly lower relative intake of packaged snacks and fruit juice |
| Initiative (Time period) | Target Population/ Design | Intervention | Evaluation Methods | Results |
| Shape Up Somerville (Economos et al., 2007) (2002-2005) | Setting: Somerville, MA (Community, US) Target population: Children grades 1-3 Design: Quasi-experimental | Comprehensive community-level intervention involving children, parents, teachers, schools, city departments, health care providers | Non-randomized controlled trial: 3 intervention schools compared to 2 comparison schools. Pre/post BMI was primary outcome measure | BMI z-scores decreased by –0.1005 compared with children in the control communities after controlling for covariates |
a Dates are approximate—often not explicitly included in articles or reports, and sometimes unclear if an initiative is ongoing.
b Body mass index (BMI) is a number calculated from a person’s weight and height. BMI provides a reliable indicator of body fatness for most people and is used to screen for weight categories that may lead to health problems.
c BMI z-scores indicates how many units (of the standard deviation) an individual’s BMI is above or below the average value for their age group and sex.
d Fitnessgram is a fitness assessment and reporting program for youth developed in 1982, which measures aerobic capacity; body composition; and muscular strength, endurance, and flexibility.
| Initiative | Description |
| Children and Neighbors Defeat Obesity (CAN DO) Houston (Correa et al., 2010) | Coalition around obesity led by a workplace-oriented wellness organization. Two pilot neighborhoods selected. Children aged 6-12 years targeted. Focus group approach identified physical activity in one neighborhood (safety) and nutrition education in another. |
| Collaborate for Healthy Weight (NICHQ, 2012) | National project of the National Initiative for Children’s Healthcare Quality and the Health Resources and Services Administration bringing together primary care providers, public health professionals, and leaders of community organizations to work across traditional professional borders to address obesity at the community level. |
| Communities Putting Prevention to Work (CPPW) (CDC, 2013) | Fifty communities funded (39 obesity prevention) through a 2-year cooperative agreement to reduce chronic disease related to obesity and tobacco using the evidence and practice-based MAPPS.a This effort is expected to produce broad, high-impact, sustainable, health outcomes through policy, systems, and environmental change. |
| Consortium to Lower Obesity in Chicago Children (CLOCC) (Becker et al., 2008) | Obesity prevention coalition in Chicago promoting healthy and active lifestyles for children through environmental changes, public education, advocacy, research, outcome measurement, and program evaluation. |
| Eat Smart, Move More North Carolina (Eat Smart, Move More North Carolina, 2013) | A statewide movement that promotes increased opportunities for healthy eating and physical activity wherever people live, learn, earn, play, and pray. Emphasizes policy and organizational change and evidence-based practices (e.g., media campaigns, worksite interventions, body mass index [BMI] monitoring). |
| Get a Life! (Mississippi) (AHRQ, 2012c) | Supports schools, churches, local governments, and employers in eight rural Mississippi counties in addressing the area’s obesity epidemic. Key program elements include supporting local health councils, providing technical support, and regional planning. |
| Go for Your Life (Victoria, Australia) (Haby et al., 2009) | Community-based interventions in six communities in regions of low socioeconomic status. Planned and managed by primary care physicians/lead agencies, support from Department of Health Services and a state-wide evaluator. |
| Healthy Alberta Communities Project (Alberta Provence, Canada) (Raine et al., 2010) | Partnership between the Health Ministry and University of Alberta to promote environmental approaches to obesity prevention. |
| Healthy and Active Communities (Missouri) (Hessel et al., 2010) | Approaches include grantmaking, evaluation support, technical assistance for dissemination, policy assessment, and development of local, regional, and statewide collaborations to increase access to physical activity and nutrition through environmental, policy, and behavior change. |
| Initiative | Description |
| Healthy Communities Study (NHLBI, 2013a) | Five-year observational study of communities that aims to (1) determine the associations between community programs/policies and BMI, diet, and physical activity in children; (2) identify the community, family, and child factors that modify or mediate the associations between community programs/policies and BMI, diet, and physical activity in children; and (3) assess the associations between program/policies and BMI, diet, and physical activity in children in communities that have a high proportion of African American, Latino, and/or low-income residents. |
| Healthy Eating Active Living Cities Campaign (California) (AHRQ, 2012g) | Builds awareness among California city officials about the role of the physical environment in promoting healthy habits and provides them with an array of practical support for passing policies and resolutions to make it easier for residents to engage in healthy behaviors. |
| Healthy Kids, Healthy Communities (RWJF, 2013) | Nationwide initiative in 50 communities pursuing policy and environmental change strategies. |
| IDEFICS (Identification and prevention of dietary-and lifestyle-induced health effects in children and infants) (De Heneauw et al., 2011) | Developed and implemented innovative community-oriented intervention programs for obesity prevention and healthy lifestyle primarily in children aged 2-10 years in eight European countries: Belgium, Cyprus, Estonia, Germany, Hungary, Italy, Spain, and Sweden. Eight matched pair communities per country. |
| Nutrition and Physical Activity Self-Assessment for Child Care (NAP SACC) (Smart Start & The North Carolina Partnership for Children) (Iruka et al., 2009) | Creating a cadre of early childhood health and wellness champions among state and local leaders and the professionals working with young children and families, and ensuring that children attending child care programs are served nutritious foods, engage in physical activity, and have teachers modeling healthy behaviors. |
| Project FIT (Grand Rapids, MI) (Eisenmann et al., 2011) | Collaboration between the public school system, local health systems, physicians, neighborhood associations, businesses, faith-based leaders, community agencies, and university researchers to develop a multi-faceted approach to promote physical activity and healthy eating. |
| Recreation Rx (San Diego, CA) (AHRQ et al., 2012e) | Facilitates partnerships between physicians and recreation providers in underserved communities to increase access to safe and structured activities. |
| San Diego County Childhood Obesity Initiative (San Diego County Childhood Obesity Initiative, 2013) | Public/private partnership to reduce and prevent childhood obesity in San Diego County by creating healthy environments for all children and families through advocacy, education, policy development, and environmental change. |
| Initiative | Description |
| Wayne County Health Department/Partnership for the Children of Wayne County (NC)/Goldsborough Parks and Recreation Department (AHRQ et al., 2012b) | Partnership working with nonprofit groups to promote better nutrition and increased physical activity among preschoolers who attend 8 local child care centers. |
| WE CAN! (NHLBI, 2013b) | National movement that offers organizations, community groups, and health professionals a centralized resource to promote a healthy weight in youth through community outreach, partnership development, and media activities. |
| W.K. Kellogg Foundation Food and Fitness Initiative (USDA, 2010) | Creating communities that support access to locally grown, healthy, affordable food, and safe and convenient places for physical activity and play, for families and children. Nine communities nationwide funded for implementation. |
a MAPPS = Five evidence-based strategies, when combined, expected to improve health behaviors by changing community environments: Media, Access, Point of decision information, Price, and Social support/services.
TABLE H-3 Selected Tools for Evaluating Community Obesity Prevention Initiatives
| Source | Description | Website |
| COLLECTIONS | ||
| Active Living Research | Tools to collect data on streets, schools, parks, or other community settings to see how well they support physical activity | http://www.activelivingresearch.org/toolsandresources/toolsandmeasures |
| National Collaborative on Childhood Obesity Research (NCCOR) Measures Registry | Searchable database of diet and physical activity measures relevant to childhood obesity research Measures included to describe, monitor, and evaluate interventions— particularly policy and environmental interventions—and factors and outcomes at all levels of the socio-ecological model | http://tools.nccor.org/measures |
| National Cancer Institute Risk Factor Monitoring & Methods | Tools for researchers, including dietary surveys and environmental assessments | http://riskfactor.cancer.gov |
| SELECTED ENVIRONMENT MEASUREMENT TOOLS | ||
| Environmental Assessment of Public Recreation Spaces (EAPRS) | Comprehensive direct observation assessment of the physical environments of parks and playgrounds, with an emphasis on evaluating physical elements and qualities with respect to their functionality or potential functionality (e.g., how a park or playground element is used or could be used by adults and children) | http://www.seattlechildrens.org/research/child-health-behavior-and-development/saelens-lab/measures-and-protocols |
| Irvine Minnesota Inventory | Measures a wide range of built environment features that may affect physical activity, especially walking Includes 160 items covering 4 domains: accessibility, pleasurability, perceived safety from traffic, and perceived safety from crime | https://webfiles.uci.edu/kday/public/index.html |
| Nutrition Environment Measures Survey (NEMS) | Measures focus on surveying community and consumer nutrition environments; which include the type and location of food outlets (stores and restaurants); availability of healthful choices; and information, pricing, promotion, and placement of healthier food products | http://www.med.upenn.edu/nems |
| Source | Description | Website |
| Communities of Excellence in Nutrition, Physical Activity & Obesity Prevention (CX3) | Field surveys of neighborhood food access | http://www.cdph.ca.gov/programs/cpns/Pages/CX3_T2_FieldSurveys.aspx |
| SELECTED POLICY MEASUREMENT TOOLS | ||
| Bridging the Gap Research Informing Policy and Practices for Healthy Youth | Includes surveys of school district policies and practices related to childhood obesity and tools for coding school district wellness policies | http://www.bridgingthegapresearch.org/research/district_wellness_policies |
| University of California, Berkeley Center for Weight and Health Evaluation/Tools | Surveys include Nutrition Learning Environments, Actions, & Policies (Nutrition LEAP); Nutrition Services Questionnaire; and Survey of Child Care Providers | http://cwh.berkeley.edu/center/evaluation_tools |
| WellSAT: Wellness School Assessment Tool | Online tool for quantitative assessment of school wellness policies from the Yale Rudd Center for Food Policy & Obesity | http://www.wellsat.org |
| School Health Index | Centers for Disease Control and Prevention’s online self-assessment and planning tool schools can use to improve their health and safety policies and programs | http://www.cdc.gov/healthyyouth/shi/index.htm |
| CoalitionsWork Tools & Resources | Resources include assessments of community and state plans for obesity prevention | http://coalitionswork.com/resources/tools |
| TRAINING | ||
| Built Environment Assessment Training (BEAT) Institute online training | Free courses on assessing the built environment for physical activity, including an in-depth look at specific tools, and assessing the nutrition environment with the NEMS | http://www.med.upenn.edu/beat/onlinetraining.shtml |
| Community Tool Box sections on community evaluation | Free, open-source lessons and tools for designing and implementing community evaluations | http://ctb.ku.edu/en/dothework/tools_tk_content_page_254.aspx |
EVALUATIONS ILLUSTRATING BEST PRACTICES FOR MEASUREMENT AND DESIGN
Cultural Competence and PhotoVoice
PhotoVoice1 and other qualitative evaluation strategies offer one method for assessing and comparing environmental and policy changes. PhotoVoice is particularly helpful for evaluating efforts on behalf of ethnic groups most affected by the obesity epidemic that may not have found a collective voice. PhotoVoice enables community members to document community strengths and concerns. Through discussion, photos taken by community volunteers stimulate dialogue about community issues related to obesity and other health issues and provide a basis to critically assess changes (Wang et al., 2004). PhotoVoice can greatly assist evaluation through community sense-making of the results—a critically important issue because the range of environmental changes is so large and complex and their importance locally is still not well understood. Furthermore, if PhotoVoice reveals that a policy is not being enforced, or promised environmental changes have not occurred, then this is a basis for further action. Quantification is helpful to assess the extent of promised changes, but is not needed to demonstrate the lack of progress in achieving those changes.
Healthy Tomorrows for New Britain Teens in Connecticut is an afterschool obesity prevention program serving predominantly low-income Latina girls of Puerto Rican descent (Hannay et al., 2013). It offers a variety of activities including nutritional counseling, physical activity, and leadership development for change in the community. A qualitative mid-course evaluation employed focus groups of teens and parents, as well as an eight-session PhotoVoice curriculum. To guide taking photos, the participants co-developed framing questions about community barriers and facilitators for physical activity and about what made for stress and happiness in their community. PhotoVoice and focus group sessions with teens were in English, and for parents they were in both English and Spanish. Themes emerged that represented a collective narrative and a basis for youth advocacy, which has led to improvements in school physical education policy and the reopening of neighborhood pools (Hannay et al., 2013).
Examples of two approaches that systematically apply logic model designs to data from community-level initiatives are the “community measurement” approach developed by the University of Kansas (Fawcett and Schultz, 2008; Francisco et al., 1993) and the “population dose” concept developed as part of the evaluation of the Kaiser Permanente Community Health Initiative (KP-CHI) (Cheadle et al., 2012b). Media research has employed principles similar to the population dose idea dating from the 1950s, a feature that is potentially important to evaluation of the Home Box Office/Institute of Medicine campaign The Weight of the Nation (Farrelly et al., 2005; Lazarsfeld and Merton, 1971; Schramm and Roberts, 1971).
In the community measurement approach developed by the University of Kansas (Fawcett and Schultz, 2008), community and evaluation partners use key informant interviews and report reviews to document and score instances of community/system changes (i.e., programs, policies, practices, built environment), and to characterize aspects related to their intensity (e.g., strength of change strategy, duration, and reach; sectors and levels in which implemented). A plot of the cumulative community changes is over-
_____________
1 PhotoVoice funds photography-based projects to support social change.
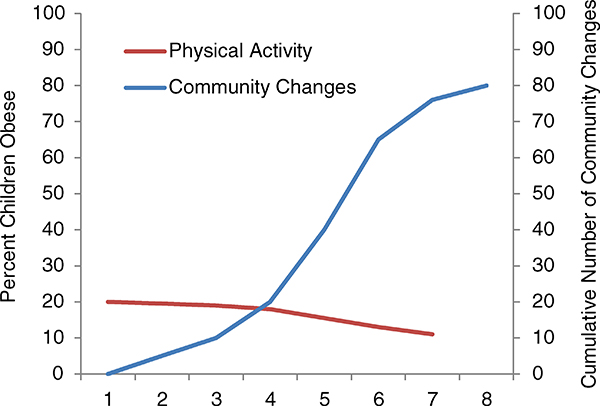
FIGURE H-1 Hypothetical association of community and system changes with population-health improvement. Example of University of Kansas Work Group attribution approach.
SOURCE: Collie-Akers and Fawcett, 2008.
laid with a plot of the trend in a population-level outcome (such as behavior change). See Figure H-1 for an illustrative figure (drawn from Collie-Akers and Fawcett, 2008, p. 362).
If shifts in the population-level outcome trend line coincide temporally with shifts in the trend of community changes, then it is plausible to attribute the population-level changes to the community-level initiative. The University of Kansas team has used this method successfully in several initiatives (e.g., Collie-Akers et al., 2007). Although it is still possible that secular trends could be responsible for this pattern, it is increasingly implausible with every passing year.
The “population dose” approach uses elements of the RE-AIM (reach, effectiveness, adoption, implementation, and maintenance) method of combining reach and effectiveness to estimate the likely impact of a community change strategy on population-level behavior (Glasgow et al., 2006). Population dose is defined operationally as the product of penetration (reach divided by the size of the target population) and effect size (relative change in behavior for each person exposed). For example, if 20 percent of the community target population lives near a new walking trail and the average effect size is a 10 percent increase in minutes walked per day among residents living near a newly installed walking trail, the population dose is 20 percent ÷ 10 percent = 2 percent. Essentially, population dose is the effect size of the intervention, if the effect was spread across all of the residents of the target community. Because quantitative effect sizes for policy and environmental change interventions are generally unavailable in the literature, this method uses a three-level rating system (high/medium/low) to assess the strength of most intervention strategies; methods are described elsewhere (Cheadle et al., 2012b).
The dose ratings are then combined with population-level outcome data to examine whether higherdose community change strategies or clusters of strategies are associated with measured population-level
changes in the relevant outcomes. For example, if a number of built environment changes are rated as high dose for promoting walking, then a survey of community residents should show measurable increases in minutes walked (Cheadle et al., 2012a).
Causal Modeling: The Healthy Communities Study
Funded by the National Heart, Lung, and Blood Institute, the Healthy Communities Study will run from 2010 to 2015 and is designed to be a multi-site national study of community-level programs and policies and their relationship with childhood obesity (NHLBI, 2012). Although not designed as an evaluation, the study includes many features that strengthen the interpretation of evaluations, many of which are within reach of local evaluations. The study is not about assessing causal relationships, but it illustrates some ways in which causal inferences can be strengthened in evaluation. And the role of local implementation is critically important to its success.
The observational study is both retrospective and cross-sectional, covering a 10-year period. It uses the University of Kansas community measurement approach described in Chapter 8 (e.g., Collie-Akers et al., 2007) to (a) identify discrete instances of community programs/policies, (b) characterize them along specific dimensions (e.g., by duration, reach, strength of intervention), and (c) develop an intensity score for the intervention that unfolds over time (reflecting the amount and kind of community programs/policies in place). The study will examine associations between intensity scores for community programs/ policies and children’s body mass index (BMI) trajectories and current behavior. The study is not designed to evaluate any specific program, policy, or community, but will instead systematically assess whether components or characteristics of representative programs/policies in communities across the country are related to BMI, diet, and physical activity in children.
The study uses both qualitative and quantitative data and takes advantage of the natural variation in local programs and policies to
(a) “determine the associations between community programs/policies and BMI, diet, and physical activity for children;
(b) identify the community, family, and child factors that modify or mediate the associations between community programs/policies and BMI, diet, and physical activity in children;
(c) assess the associations among community programs/policies and BMI, diet, and physical activity in children in communities that have a high proportion of African American, Latino, and/or low-income residents” at higher risk for health disparities (NHLBI, 2013a).
Children’s height and weight, diet, and physical activity will be assessed in-person for the crosssectional component, and BMI trajectories over a 10-year period will be calculated, using baseline height and weight abstracted from participant medical records. Thus, the Healthy Communities Study includes multiple observations of intermediate outcomes (community programs/policies) and long-term outcomes. Investigators will be able to examine when various interventions started and whether there were any associated changes in behavior and BMI after that time.
Community programs/policies will be identified and described through interviews with key informants (e.g., school principals, parks and recreation staff, directors of community coalitions) and docu-
ment review (reports of related activities). Instances will then be scored using an observational code and protocol. An overall intensity score will be calculated: the number of community programs and policies implemented, weighted by their intensity (i.e., strength of behavior change strategy used, reach, and duration in place). This composite intensity score—calculated for each community for each year of this study—will serve as a measure of the unfolding of the comprehensive intervention being implemented in the community related to obesity prevention. Thus, the Healthy Communities Study employs the recommended measurement of implementation “dose.” Also, note that this retrospective review depends greatly on the extent to which local evaluation has documented implementation (or key informants are available to be interviewed). A potential weakness is that the documentation may not be as thorough as necessary to examine more fine-grained relationships between particular interventions and outcomes. However, at a community level this documentation should be sufficient to examine intermediate outcomes (community programs/policies) as a particular “dose” of environmental change related to childhood obesity prevention.
More than 200 communities (defined as high school catchment areas) and approximately 20,000 children and their parents/caregivers will be included. In each community, data will be collected on approximately 80 children in kindergarten through 8th grade. Communities were selected using a hybrid approach: a national probability-based sample of communities, and a purposive sample of communities that are known to be active in child obesity prevention work. The probability sample of communities can be generalized to the rest of the United States, while the purposive sample allows a better understanding of the variety of policies and programs being implemented.
By including the probability sample of communities, the Healthy Communities Study greatly improves on the non-equivalent comparison group design. In one sense, the probability sample stands in for a “control” group for the purposive sample of communities that are known to be implementing prevention. In another sense, however, most of the communities are likely to have implemented something—what community programs/policies they have implemented varies in amount, type, time, and place. The study will characterize the temporal patterns of implementation of various interventions, as well as the dose of interventions given. This permits much more powerful causal modeling than is feasible for most local evaluations. The sheer number of communities and children involved makes causal modeling a very powerful explanatory tool. The study will have enough power to control statistically for factors known to affect childhood obesity, such as income, ethnicity, and region of the United States. In addition, it can analyze the temporal relationship between interventions and change. Finally, because communities vary in the types of intervention and the times at which those interventions were introduced, the study can disentangle the relative contributions of these interventions by examining the strength of association between outcomes and particular kinds of intervention (such as introduction of a school policy, strength of the policy, when the policy was implemented).
A Potential Regression-Discontinuity Evaluation
The regression-discontinuity design requires a strict criterion (such as need) to determine who receives intervention and who does not. It then measures the association between pre- and post-values and examines whether there is a discontinuity in this association based on receipt of intervention. It requires many units (e.g., children, schools), as in any regression analysis. This design can be applied in some areas
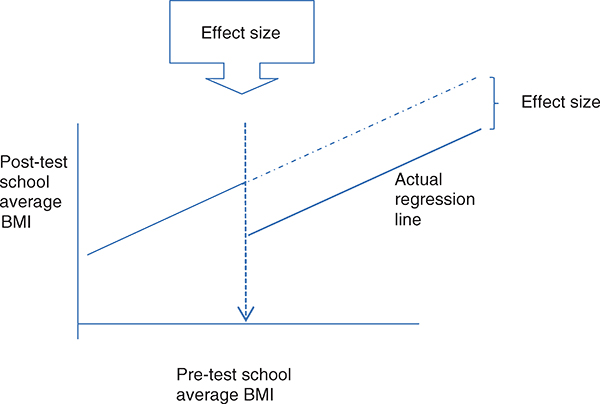
FIGURE H-2 Regression discontinuity design applied to school-based obesity prevention.
NOTE: BMI = body mass index.
of obesity prevention based on a population’s pre-intervention weight status. For example, some states, such as California and Arkansas, measure children’s weight and height in all public schools; schools might be selected for intervention based on school-level prevalence of obesity. In that case, change would be seen in any school-level discontinuity in the regression line between pre- and post-intervention prevalence. The effect size is a change in either the intercept or slope of the regression line (see Figure H-2).
REFERENCES
AHRQ (Agency for Healthcare Research and Quality) Health Care Innovations Exchange. 2012a. Community coalition supports schools in helping students increase physical activity and make better food choices. http://www.innovations.ahrq.gov/content.aspx?id=3232 (accessed April 14, 2013).
AHRQ Health Care Innovations Exchange. 2012b. County, city, and community agencies support childcare centers and parents in improving nutrition and physical activity habits of preschoolers. http://www.innovations.ahrq.gov/content.aspx?id=3283 (accessed June 7, 2013).
AHRQ Health Care Innovations Exchange. 2012c. Foundation supports rural stakeholders in promoting better eating and physical activity, leading to anecdotal reports of improved behaviors and outcomes. http://www.innovations.ahrq.gov/content.aspx?id=3267 (accessed June 7, 2013).
AHRQ Health Care Innovations Exchange. 2012d. Multistakeholder, community-wide collaborative prevents disease and promotes health. http://www.innovations.ahrq.gov/content.aspx?id=1755 (accessed April 15, 2013).
AHRQ Health Care Innovations Exchange. 2012e. Recreation “prescriptions” increase use of free community exercise programs by low-income patients who are overweight or obese. http://www.innovations.ahrq.gov/content.aspx?id=2934 (accessed June 7, 2013).
AHRQ Health Care Innovations Exchange. 2012f. Staged weight management program helps overweight children reduce caloric intake and body mass index. http://www.innovations.ahrq.gov/content.aspx?id=2290 (accessed April 15, 2013).
AHRQ Health Care Innovations Exchange. 2012g. Statewide campaign provides education and technical support to city officials, leading to policies that promote healthy behaviors. http://www.innovations.ahrq.gov/content.aspx?id=3231 (accessed June 7, 2013).
AHRQ Health Care Innovations Exchange. 2012h. Tools, education, and technical assistance encourage child care sites to adopt strategies that promote healthy eating and physical activity in young children. http://www.innovations.ahrq.gov/content.aspx?id=3253 (accessed April 15, 2013).
Ashfield-Watt, P. A., A. A. Welch, S. Godward, and S. A. Bingham. 2007. Effect of a pilot community intervention on fruit and vegetable intakes: Use of FACET (Five-a-day Community Evaluation Tool). Public Health Nutrition 10(7):671-680.
Becker, A. B., M. Longjohn, and K. K. Christoffel. 2008. Taking on childhood obesity in a big city: Consortium to Lower Obesity in Chicago Children (CLOCC). Progress in Pediatric Cardiology 25(2):199-206.
CDC (Centers for Disease Control and Prevention). 2013. Communities putting prevention to work. http://www.cdc.gov/communitiesputtingpreventiontowork (accessed April 10, 2013).
Chang, D. I., A. Gertel-Rosenberg, V. L. Drayton, S. Schmidt, and G. B. Angalet. 2010. A statewide strategy to battle child obesity in Delaware. Health Affairs 29(3):481-490.
Cheadle, A., S. Rauzon, R. Spring, P. M. Schwartz, S. Gee, E. Gonzalez, J. Ravel, C. Reilly, A. Taylor, and D. Williamson. 2012a. Kaiser Permanente’s community health initiative in northern California: Evaluation findings and lessons learned. American Journal of Health Promotion 27(2):e59-e68.
Cheadle, A., P. M. Schwartz, and S. Rauzon. 2012b. Using the concept of “population dose” in planning and evaluating community-level obesity prevention initiatives. Clinical Medicine & Research 10(3):184-185.
Chomitz, V. R., R. J. McGowan, J. M. Wendel, S. A. Williams, H. J. Cabral, S. E. King, D. B. Olcott, M. Cappello, S. Breen, and K. A. Hacker. 2010. Healthy Living Cambridge Kids: A community-based participatory effort to promote healthy weight and fitness. Obesity (Silver Spring) 18(Suppl 1):S45-S53.
Coleman, K. J. 2006. Mobilizing a low income border community to address state mandated coordinated school health. American Journal of Health Education 37(1):15-26.
Coleman, K. J., C. L. Tiller, J. Sanchez, E. M. Heath, O. Sy, G. Milliken, and D. A. Dzewaltowski. 2005. Prevention of the epidemic increase in child risk of overweight in low-income schools: The El Paso Coordinated Approach to Child Health. Archives of Pediatrics and Adolescent Medicine 159(3):217-224.
Collie-Akers, V., and S. B. Fawcett. 2008. Preventing childhood obesity through collaborative public health action in communities. In Handbook of childhood and adolescent obesity, edited by E. Jelalian and R. G. Steele. New York: Springer Science. Pp. 351-368.
Collie-Akers, V. L., S. B. Fawcett, J. A. Schultz, V. Carson, J. Cyprus, and J. E. Pierle. 2007. Analyzing a communitybased coalition’s efforts to reduce health disparities and the risk for chronic disease in Kansas City, Missouri. Preventing Chronic Disease 4(3):A66. http://www.cdc.gov/pcd/issues/2007/jul/06_0101.htm (accessed June 6, 2013).
Correa, N. P., N. G. Murray, C. A. Mei, W. B. Baun, B. J. Gor, N. B. Hare, D. Banerjee, T. F. Sindha, and L. A. Jones. 2010. CAN DO Houston: A community-based approach to preventing childhood obesity. Preventing Chronic Disease 7(4):A88. http://www.cdc.gov/pcd/issues/2010/jul/09_0184.htm (accessed June 7, 2013).
De Henauw, S., V. Verbestel, S. Marild, G. Barba, K. Bammann, G. Eiben, A. Hebestreit, L. Iacoviello, K. Gallois, K. Konstabel, E. Kovacs, L. Lissner, L. Maes, D. Molnar, L. A. Moreno, L. Reisch, A. Siani, M. Tornaritis, G. Williams, W. Ahrens, I. De Bourdeaudhuij, I. Pigeot, and IDEFICS Consortium. 2011. The IDEFICS community-oriented intervention programme: A new model for childhood obesity prevention in Europe? International Journal of Obesity (London) 35(Suppl 1):S16-S23.
de Silva-Sanigorski, A. M., A. C. Bell, P. Kremer, M. Nichols, M. Crellin, M. Smith, S. Sharp, F. de Groot, L. Carpenter, R. Boak, N. Robertson, and B. A. Swinburn. 2010. Reducing obesity in early childhood: Results from Romp & Chomp, an Australian community-wide intervention program. American Journal of Clinical Nutrition 91(4):831-840.
Eat Smart, Move More North Carolina. 2013. Eat smart, move more North Carolina. http://www.eatsmartmovemorenc.com/index.html (accessed June 7, 2013).
Economos, C. D., R. R. Hyatt, J. P. Goldberg, A. Must, E. N. Naumova, J. J. Collins, and M. E. Nelson. 2007. A community intervention reduces BMI z-score in children: Shape Up Somerville first year results. Obesity (Silver Spring) 15(5):1325-1336.
Eisenmann, J. C., K. Alaimo, K. Pfeiffer, H. J. Paek, J. J. Carlson, H. Hayes, T. Thompson, D. Kelleher, H. J. Oh, J. Orth, S. Randall, K. Mayfield, and D. Holmes. 2011. Project FIT: Rationale, design, and baseline characteristics of a school- and community-based intervention to address physical activity and healthy eating among lowincome elementary school children. BMC Public Health 11:607.
Farrelly, M. C., K. C. Davis, M. L. Haviland, P. Messeri, and C. G. Healton. 2005. Evidence of a dose-response relationship between “truth” antismoking ads and youth smoking prevalence. American Journal of Public Health 95(3):425-431.
Fawcett, S. B., and J. A. Schultz. 2008. Using the Community Tool Box’s online documentation system to support participatory evaluation of community health initiatives. In Community-based participatory research for health, edited by M. Minkler and N. Wallerstein. San Francisco, CA: Jossey-Bass.
Francisco, V. T., A. L. Paine, and S. B. Fawcett. 1993. A methodology for monitoring and evaluating community health coalitions. Health Education Research 8(3):403-416.
Glasgow, R. E., L. M. Klesges, D. A. Dzewaltowski, P. A. Estabrooks, and T. M. Vogt. 2006. Evaluating the impact of health promotion programs: Using the RE-AIM framework to form summary measures for decision making involving complex issues. Health Education Research 21(5):688-694.
Haby, M., R. Doherty, and L. Holt. 2009. Experiences of the Health Promoting Communities demonstration projects. Powerpoint presentation to the Community-based Childhood Obesity Prevention Initiatives—Putting the Lessons Learned into Practice Forum, July 23, 2009. http://www.goforyourlife.vic.gov.au/hav/admin.nsf/Images/Michelle_Haby_forum.ppt/$File/Michelle_Haby_forum.ppt (accessed June 7, 2013).
Hannay, J., R. Dudley, S. Milan, and P. K. Leibovitz. 2013. Combining Photovoice and focus groups: Engaging Latina teens in community assessment. American Journal of Preventive Medicine 44(3 Suppl 3):S215-S224.
Heath, E. M., and K. J. Coleman. 2003. Adoption and institutionalization of the Child and Adolescent Trial for Cardiovascular Health (CATCH) in El Paso, Texas. Health Promotion Practice 4(2):157-164.
Hessel, A. S., J. W. Marshall, W. Brown, A. B. Sabina, and K. DeForest. 2010. Healthy and Active Communities Initiative: A foundation’s response to the obesity epidemic. Preventive Medicine 50(Suppl 1):S93-S94.
Hoelscher, D. M., S. H. Kelder, A. Perez, R. S. Day, J. S. Benoit, R. F. Frankowski, J. L. Walker, and E. S. Lee. 2010. Changes in the regional prevalence of child obesity in 4th, 8th, and 11th grade students in Texas from 2000-2002 to 2004-2005. Obesity (Silver Spring) 18(7):1360-1368.
Iruka, I., K. Maxwell, and J. Sotolongo. 2009. Nutrition and physical activity self-assessment for child care (NAP SACC): Final 2009 evaluation report. University of North Carolina Frank Porter Graham Child Development Institute & North Carolina Partnership for Children, Inc.
Klesges, R. C., E. Obarzanek, S. Kumanyika, D. M. Murray, L. M. Klesges, G. E. Relyea, M. B. Stockton, J. Q. Lanctot, B. M. Beech, B. S. McClanahan, D. Sherrill-Mittleman, and D. L. Slawson. 2010. The Memphis Girls’ Health Enrichment Multi-site Studies (GEMS): An evaluation of the efficacy of a 2-year obesity prevention program in African American girls. Archives of Pediatrics and Adolescent Medicine 164(11):1007-1014.
Lazarsfeld, P. F., and Merton R. K. 1971. Mass communication, popular taste and organized social action. In The process and effects of mass communication, edited by W. Schramm and D. F. Roberts. Urbana, IL: University of Chicago Press. Pp. 554-578.
NHLBI (National Heart, Lung, and Blood Institute). 2012. Healthy communities study. http://www.nhlbi.nih.gov/hcs/index.htm (accessed April 10, 2013).
NHLBI. 2013a. Healthy communities study: How communities shape children’s health (HCS). http://www.nhlbi.nih.gov/resources/obesity/pop-studies/hcs.htm (accessed May 30, 2013).
NHLBI. 2013b. WE CAN! Ways to enhance children’s activity and nutrition. http://www.nhlbi.nih.gov/health/public/heart/obesity/wecan (accessed June 7, 2013).
NICHQ (National Initiative for Children’s Healthcare Quality). 2012. Joining forces for healthier communities: Collaborate for Healthy Weight progress report. Boston, MA: NICHQ.
NYC (New York City) Obesity Task Force. 2012. Reversing the epidemic: The New York City Obesity Task Force plan to prevent and control obesity. http://www.nyc.gov/html/om/pdf/2012/otf_report.pdf (accessed April 16, 2013).
Raine, K. D., R. Plotnikoff, C. Nykiforuk, H. Deegan, E. Hemphill, K. Storey, D. Schopflocher, P. Veugelers, T. C. Wild, and A. Ohinmaa. 2010. Reflections on community-based population health intervention and evaluation for obesity and chronic disease prevention: The Healthy Alberta Communities Project. International Journal of Public Health 55(6):679-686.
Robinson, T. N., D. M. Matheson, H. C. Kraemer, D. M. Wilson, E. Obarzanek, N. S. Thompson, S. Alhassan, T. R. Spencer, K. F. Haydel, M. Fujimoto, A. Varady, and J. D. Killen. 2010. A randomized controlled trial of culturally tailored dance and reducing screen time to prevent weight gain in low-income African American girls: Stanford GEMS. Archives of Pediatrics and Adolescent Medicine 164(11):995-1004.
Romon, M., A. Lommez, M. Tafflet, A. Basdevant, J. M. Oppert, J. L. Bresson, P. Ducimetiere, M. A. Charles, and J. M. Borys. 2009. Downward trends in the prevalence of childhood overweight in the setting of 12-year school- and community-based programmes. Public Health Nutrition 12(10):1735-1742.
RWJF (Robert Wood Johnson Foundation). 2013. Healthy kids, healthy communities. http://www.healthykidshealthycommunities.org (accessed April 10, 2013).
Samuels & Associates. 2010. Healthy Eating, Active Communities and Central California Regional Obesity Prevention Program final evaluation synthesis report. Oakland: The California Endowment.
San Diego County Childhood Obesity Initiative. 2013. San Diego County Childhood Obesity Initiative. http://ourcommunityourkids.org (accessed June 7, 2013).
Schramm, W., and D. F. Roberts. 1971. The process and effects of mass communication. Urbana, IL: University of Chicago Press.
Schuit, A. J., G. C. Wendel-Vos, W. M. Verschuren, E. T. Ronckers, A. Ament, P. Van Assema, J. Van Ree, and E. C. Ruland. 2006. Effect of 5-year community intervention Hartslag Limburg on cardiovascular risk factors. American Journal of Preventive Medicine 30(3):237-242.
Smith, W. E., R. S. Day, and L. B. Brown. 2005. Heritage retention and bean intake correlates to dietary fiber intakes in Hispanic mothers—Que Sabrosa Vida. Journal of the American Dietetic Association 105(3):404-411; discussion 411-412.
University of Arkansas for Medical Sciences. 2011. Year 7 evaluation: Arkansas Act 1220 of 2003 to combat childhood obesity. Little Rock, AR: Fay W. Boozman College of Public Health.
USDA (U.S. Department of Agriculture). 2010. The W.K. Kellogg Food and Fitness Initiative. http://www.nifa.usda.gov/nea/food/in_focus/health_if_food_fitness_initiative.html (accessed April 10, 2013).
Wang, C. C., S. Morrel-Samuels, P. M. Hutchison, L. Bell, and R. M. Pestronk. 2004. Flint Photovoice: Community building among youths, adults, and policymakers. American Journal of Public Health 94(6):911-913.


