
Indicators for the Evaluation Plans
Why: Why develop indicators? The Statement of Task called for the Committee to draw on the recommendations and indicators included in the Institute of Medicine (IOM) report Accelerating Progress in Obesity Prevention (IOM, 2012). In its framework, the Committee included indicator development as a key activity and sought to identify indicators that are aligned with the recommendations in the IOM report (IOM, 2012).
What: What can the indicators be used for? The indicators of progress can serve multiple purposes: (1) to be incorporated into the national, state, and community plans (Chapters 6, 7, and 8); (2) to identify gaps in existing surveillance systems (where future indicators could be developed); and (3) to be used as examples by evaluators of obesity prevention programs, policies, and environments.
How: How were the indicators developed? The Committee identified the indicators of progress through a comprehensive review of existing indicator sources (drawing heavily on those included in Healthy People 2020 [HHS, 2010]) and national surveillance systems, as well as recognition of existing gaps in these sources compared to recommendations in the IOM report.
The Committee was charged to identify and develop indicators that could be used at the national and community levels for measuring progress of obesity prevention efforts. The Statement of Task called for the Committee to draw from the indicators included in the Institute of Medicine (IOM) Accelerating Progress in Obesity Prevention (APOP) report (IOM, 2012), as well as currently used indicators not included in the APOP report, and to identify areas where new indicators are needed. The Committee sought to align the indicators with its framework by focusing on developing indicators related to the items included in box 5 of Figure 4-1, “Intended Impacts/Improvements.”
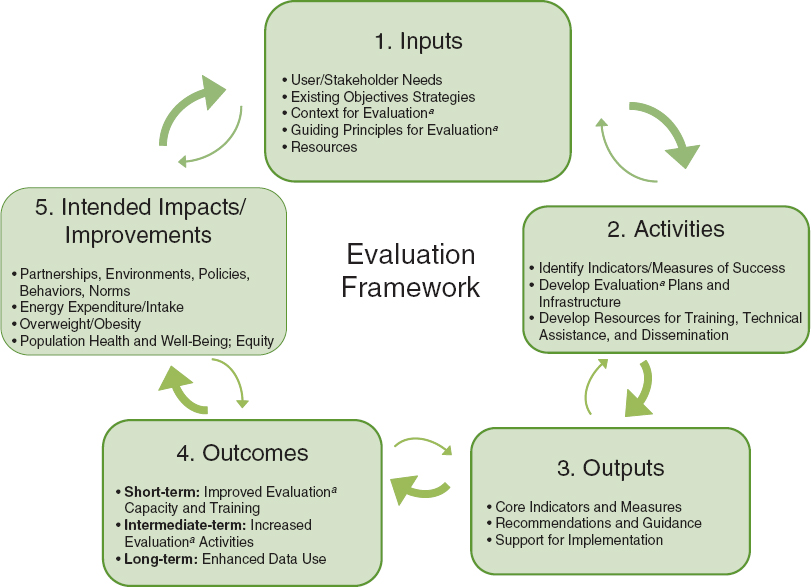
FIGURE 4-1 Framework for evaluating progress of obesity prevention efforts.
a Evaluation refers to assessment, monitoring, surveillance, and summative evaluation activities.
METHODOLOGY
The Committee defined the terms environment, strategy, indicator, objective, and measure. Environment refers to the five environments emphasized in the APOP report (IOM, 2012): physical activity, food and beverage, messaging, health care and worksite, and school and child care (outside the home) (with child care added by this Committee). Strategy refers to the APOP report’s 20 recommended strategies related to policy, systems, and environmental changes across the five environments (IOM, 2012). Interventions refer to the specific combination of policy, educational, mass media, organizational, and economic changes being evaluated in relation to specific APOP strategies and intended impacts (see Figure 4-1). For this report, the Committee adapted more recent definitions provided by the IOM’s Committee on Leading Health Indicators for Healthy People 2020 (IOM, 2011). Herein, an indicator is defined as a measurement related to a criterion of success or standard of acceptability, for example, the prevalence of obesity or the proportion of states with strong nutritional standards for foods and beverages sold or provided in schools. An objective is a statement of movement in an indicator toward a quantita-
tive target, usually by a specified time, e.g., among children aged 2-11 reduce by 10 percent the prevalence of obesity by 2020. A measure refers to the actual survey item or set of items, assessment method, observational technique, etc., that is used to quantify an indicator. For example, 24-hour dietary recall or observational methods could be used to assess intake of sugar-sweetened beverages or accelerometers could be used to assess physical activity levels.
For the indicators and objectives that were directly drawn from Healthy People 2020, such targets already exist (HHS, 2013). In Table 4-1 below, the Committee identifies all such indicators and objectives with a reference to Healthy People 2020 as the source and refers the reader to the Healthy People 2020 website (www.healthypeople.gov) for the most up-to-date baseline and target information. As additional surveillance systems are developed or exising systems incorporate additional indicators and objectives not currently included in Healthy People 2020, baseline and target data will be more readily available for a broader range of the indicators and objectives noted below. The Committee was unable to identify specific measures for each indicator and objective noted in Table 4-1; however, the reader is referred to examples of such measures in national, state, and community plans presented in Chapters 6, 7, and 8.
The Committee used the following criteria to select the indicators and objectives:
1. The indicator/objective specifically relates to the Committee’s framework—that is, partnerships, changes to the physical and/or social environments through policy or environmental changes (e.g., infrastructure, resources, systems, programs, pricing), improved energy intake and energy expenditure behaviors, or improved weight outcomes;
2. The indicator/objective directly relates to the overarching goal of preventing obesity and overweight or one of the five APOP environments and the related strategies;
3. The indicator/objective was
a. drawn from an existing Healthy People 2020 (HHS, 2013) indicator (particularly the Leading Health Indicators1), an APOP indicator, or existing nationally recognized or state-based data systems (e.g., National Survey of Children’s Health [CAHMI, 2013]);
b. a strategy specifically recommended by a nationally recognized scientific advisory panel (e.g., the Community Preventive Services Task Force [CDC, 2013]); or
c. identified by the Committee as part of its review.
To decide between a Healthy People 2020 objective versus a similar objective from another source, the Committee gave preference to the Healthy People 2020 objective wording; and,
4. The indicator/objective has the following properties:
a. The indicator/objective is relevant and closely linked to the overarching goal of a strategy included within the APOP report (IOM, 2012);
b. Data for the indicator/objective are readily and currently available for at least one of the jurisdictional levels of interest (i.e., national, regional, territories, state, county, municipal, and/or school district levels);
c. The indicator/objective is measured on a regular basis over time (e.g., where possible, every 3 years or more frequently). Measurement over time will reflect results of action; that is, if action is taken, then tangible results will indicate improvements in various aspects of the
_____________
1 Leading Health Indicators are a subset of the Healthy People 2020 indicators selected for priority health issues (www.healthypeople.gov).
nation’s health. In some cases, sources that provided data every 1 to 3 years were not available; as such, the Committee included the indicator/objective but, in the spirit of accelerating progress in obesity prevention, also included recommendations to increase the frequency with which such data are compiled;
d. The indicator/objective is already computed from the available data source or can be easily computed based on the available data;
e. Indicators/objectives can be understood by people who need to act, that is, they have face validity and suggest what can be done to accelerate progress in obesity prevention; and
f. The objective will galvanize action, that is, the objectives are of such a nature that stakeholders (e.g., decision makers at the national, regional, state, county, municipal, school district, school, child care, worksite, etc. levels) can take action, whether they are individuals or part of organized groups and public and private agencies. This action can in part come from mobilization across multiple sectors.
The universe of potential indicators was based on a scan of data sources and indicators including those available from or identified by
• Healthy People 2020 (HHS, 2013);
• APOP report (IOM, 2012);
• Community Commons GIS (geographic information system) (Community Commons, 2013);
• Childhood Obesity GIS System (CARES-University of Missouri, 2013);
• U.S. Department of Agriculture (USDA) Food Environment Atlas (USDA, 2013);
• National Survey of Children’s Health (CAHMI, 2013);
• national data surveillance systems available from U.S. federal agencies, including the departments of Agriculture, Education, Health and Human Services, and Transportation or state-based data systems (e.g., state birth registries); and
• private-sector and/or commercial data sources (e.g., the National Consumer Panel [National Consumer Panel, 2013], Employee Benefits Research Institute [EBRI, 2013]).
Additionally, the Committee reviewed the data systems catalogued in the National Collaborative on Childhood Obesity Research’s Catalogue of Surveillance Systems (NCCOR, 2013). Appendix D includes a full list of indicator data sources. While many of the sources consulted reflected a repository or compilation of data from several primary data sources (e.g., the USDA Food Environment Atlas or the Community Commons), the Committee chose to refer to the original data source as the source for a given indicator and objective rather than referring to compiled data systems.
INDICATORS
The scan of potential data sources yielded 322 initial indicators, which the Committee pared down to 206 by eliminating duplicates. The 206 indicators were organized as (1) overarching/system-level indicators focused on obesity, overweight, and early life years (e.g., birth weight, and perinatal and pregnancy weight) and (2) goal-area indicators that specifically addressed each of the APOP (IOM, 2012) goal
TABLE 4-1 Potential Indicator Topics and Objectives by APOP Goal and Strategy Areas*
| Indicator Topic | Objectivea |
| OVERARCHING/SYSTEM-LEVEL INDICATORS | |
|
1 Obesity-adult |
Reduce the proportion of adults who are obese (body mass index [BMI] <30)a |
|
2 Obesity-adolescent |
Reduce the proportion of adolescents aged 12-19 who are considered obesec |
|
3 Obesity-child |
Reduce the proportion of children aged 6-11 who are considered obeseb,c |
|
4 Obesity-preschool age |
Reduce the proportion of children aged 2-5 who are considered obeseb,c |
|
5 Overweight-adult |
Reduce the proportion of adults who are considered overweight (BMI 25-29.9)d |
|
6 Overweight-adolescent |
Reduce the proportion of adolescents aged 12-19 who are considered overweightd |
|
7 Overweight-child |
Reduce the proportion of children aged 6-11 who are considered overweightd |
|
8 Overweight-preschool age |
Reduce the proportion of children aged 2-5 who are considered overweightd |
|
9 Overweight-infant |
Reduce the proportion of infants aged 0-2 with weight-for-length greater than the 95th percentile based on the Centers for Disease Control and Prevention recommendation to use the World Health Organization growth charts standard for birth to age 24 months |
|
10 Gestational weight gain |
Reduce gestational weight gain to meet the Institute of Medicine (IOM) (2009) recommendations for total and rate of weight gain based on pre-pregnancy BMI |
|
11 Birth weight |
Increase the number of children with a birth weight that is appropriate for their gestational age |
|
12 Maternal pre-pregnancy weight |
Reduce the proportion of women whose pre-pregnancy weight is considered obese or overweight |
|
13 Maternal post-pregnancy weight |
Reduce the proportion of women who are considered obese or overweight post-pregnancy |
| APOP GOAL AREA 1: PHYSICAL ACTIVITY ENVIRONMENT | |
|
14 Adult physical activity |
Increase the proportion of adults who meet current federal physical activity guidelines for aerobic physical activity and for muscle-strengthening activityb,c |
|
15 Adolescent physical activity |
Increase the proportion of adolescents who meet current federal physical activity guidelines for aerobic physical activityb |
|
16 Child and adolescent daily vigorous physical activity |
Increase the proportion of children aged 6-17 who engage in at least 20 minutes per day of vigorous physical activity |
| Strategy 1-1: Enhance the physical and built environment | |
|
17 Joint/shared use of community facilities |
Increase the proportion of the nation’s public and private schools that provide access to their physical activity spaces and facilities for all persons outside of normal school hours (i.e., before and after the school day, on weekends, and during summer and other vacations)b |
|
18 Policies that promote physical activity and the built environment |
Increase legislative policies for the built environment (i.e., community-scale, street-scale, and transportation and travel) that enhance access to and availability of physical activity opportunitiesb(developmental) |
|
19 Adult active transport by walking |
Increase the proportion of walking trips made by adults for leisure or commuting to workb(developmental) |
| Indicator Topic | Objectivea |
|
20 Active commuting to school |
Increase the proportion of trips to school made by walking 1 mile or less or biking 2 miles or less by children aged 5-15b(developmental) |
|
21 Bicycling by adults |
Increase the proportion of trips of 5 miles or less made by bicycling by adults for leisure or active transport for commuting purposesb(developmental) |
|
22 Recreational facility outlet density |
Increase the proportion of recreation and fitness facilities per 1,000 people |
|
23 Child and adolescent physical activity–related attitudes and perceptions |
Increase the proportion of children aged 0-17 living in safe neighborhoods |
|
24 Child and adolescent physical activity–related attitudes and perceptions |
Increase the proportion of children aged 0-17 living in supportive neighborhoods |
|
25 Physical activity for older adults (relates to strategy 1-2 also) |
Increase the proportion of older adults (aged 65 and older) with reduced physical or cognitive function who engage in light, moderate, or vigorous leisure-time physical activitiesb |
| Strategy 1-2: Provide and support community programs designed to increase physical activity | |
|
26 Nonschool organized physical activity–related activities |
Increase the proportion of children aged 6-17 who participate in one or more organized physical activities outside of school, such as sports teams or lessons, clubs, or organizations |
| Strategy 1-3: Adopt physical activity requirements for licensed child care providers | |
|
27 Physical activity requirements for licensed child care |
Increase the number of states with licensing regulations for physical activity in child care that require a number of minutes of physical activity per day or by length of time in care (physical activity is defined to include large muscle or gross motor activity, development, and/or equipment as well as vigorous or moderate physical activity)b |
| APOP GOAL AREA 2: FOOD AND BEVERAGE ENVIRONMENT | |
|
28 Adult energy intake |
Reduce the mean calories consumed among adults to meet Dietary Guidelines for Americans recommendations for age, gender, and activity levels |
|
29 Child and adolescent energy intake |
Reduce the mean calories consumed among children and adolescents aged 2-19 to meet Dietary Guidelines for Americans recommendations for age, gender, and activity levels |
| Strategy 2-1: Adopt policies and implement practices to reduce overconsumption of sugar-sweetened beverages | |
|
30 Sugar-sweetened beverage policies in schools |
States and school districts adopt policies that prohibit the sale of sugar-sweetened beverages in schools and require that schools offer a variety of no- or low-calorie beverage options that are favorably pricedd |
|
31 Sugar-sweetened beverage consumption |
Reduce energy intake from consumption of sugar-sweetened beveragesd |
|
32 Price of low-fat milk |
Reduce the relative price of low-fat milk (compared to soda/sweetened beverages) |
|
33 Sugar-sweetened beverage taxation |
Increase the number of states that adopt a law imposing an excise tax on sugar-sweetened beverages and dedicate a portion of the revenue to obesity prevention programs |
| Indicator Topic | Objectivea |
| Strategy 2-2: Increase the availability of lower-calorie and healthier food and beverage options for children in restaurants | |
|
34 Child and adolescent caloric intake in restaurants |
Reduce caloric intake by children and adolescents in chain and quick-service restaurantsd |
| Strategy 2-3: Utilize strong nutritional standards for all foods and beverages sold or provided through the government, and ensure that these healthy options are available in all places frequented by the public | |
|
35 Consumption of solid fats and added sugars |
Reduce consumption of calories from solid fats and added sugars in the population aged 2 years and olderb |
|
36 Consumption of solid fats |
Reduce consumption of calories from solid fatsb |
|
37 Consumption of added sugars |
Reduce consumption of calories from added sugarsb |
|
38 School policies to facilitate access to clean drinking water |
Increase the proportion of states and school districts with policies that require schools to provide access to free, clean, potable water throughout the school settingd |
|
39 Consumption of fruits |
Increase the contribution of fruits to the diets of the population aged 2 years and olderb |
|
40 Consumption of vegetables |
Increase the variety and contribution of total vegetables to the diets of the population aged 2 years and olderb,c |
|
41 Consumption of whole grains |
Increase the contribution of whole grains to the diets of the population aged 2 years and olderb |
|
42 Healthy vending policies in federal buildings and worksites |
The federal government expands its healthy vending/concession guidelines to include all federal government-owned, -operated, and -occupied buildings, worksites, and facilitiesd |
|
43 Nutrition standards in child care |
Increase the number of states with nutrition standards for foods and beverages provided to preschool-aged children in child careb |
| Strategy 2-4: Introduce, modify, and utilize health-promoting food and beverage retailing and distribution policies | |
|
44 Food retail incentive policies |
Increase the number of states that have state-level policies that incentivize food retail outlets to provide foods that are encouraged by the Dietary Guidelines for Americansb |
|
45 Fast food outlet density |
Reduce the density of fast-food restaurants (per 100,000 population) |
|
46 Healthy food outlet density |
Increase the proportion of healthy food outlets in communities across the United States |
|
47 Price of fruit and vegetables |
Decrease the relative price of fruit and vegetables (compared to snack items) |
| APOP GOAL AREA 3: MESSAGING ENVIRONMENT | |
| Strategy 3-1: Develop and support a sustained, targeted physical activity and nutrition social marketing program | |
|
48 Funding for national social marketing program |
Federal funding for sustained, targeted physical activity and nutrition social marketing campaign, and designation of a lead federal agency to oversee itd |
| Strategy 3-2: Implement common standards for marketing foods and beverages to children and adolescents | |
|
49 Television marketing of foods and beverages to children and adolescents |
Increase the proportion of foods and beverages marketed to children and adolescents that are recommended by the Dietary Guidelines for Americans and reduce the proportion of foods and beverages marketed that are not recommended by the Dietary Guidelines for Americans |
| Indicator Topic | Objectivea |
| Strategy 3-3: Ensure consistent nutrition labeling for the front of packages, retail store shelves, and menus and menu boards that encourages healthier food choices | |
|
50 Purchase of foods and beverages recommended in Dietary Guidelines for Americans |
Increase purchases of reformulated foods that meet the definition in the Dietary Guidelines for Americans of foods and beverages people should consume in greater quantities and reduce purchases of items not recommended by the Dietary Guidelines for Americans |
| Strategy 3-4: Adopt consistent nutrition education policies for federal programs with nutrition education components | |
|
51 Nutrition education policies for federal nutrition programs |
Increase the proportion of states that adopt Supplementation Nutrition Assistance Program (SNAP) education component (SNAP-Ed) curricula that note which foods and beverages to increase (i.e., those recommended by the Dietary Guidelines for Americans) and which to decrease (e.g., solid fats and added sugars)d |
|
52 Purchase by SNAP participants of foods and beverages recommended in Dietary Guidelines for Americans |
Increase the proportion of foods and beverages purchased by SNAP participants that are recommended by the Dietary Guidelines for Americans and decrease the proportion of foods and beverages purchased that are not recommended by the Dietary Guidelines for Americans |
| APOP GOAL AREA 4: HEALTH CARE AND WORKSITES | |
| Strategy 4-1: Provide standardized care and advocate for healthy community environments | |
|
53 Community-based primary prevention nutrition-related services |
Increase the number of community-based organizations (including local health departments, tribal health services, nongovernmental organizations, and state agencies) providing population-based primary prevention services in the following area: nutritionb |
|
54 Community-based primary prevention physical activity-related services |
Increase the number of community-based organizations (including local health departments, tribal health services, nongovernmental organizations, and state agencies) providing population-based primary prevention services in the following area: physical activityb |
|
55 BMI measurement by physicians |
Increase the proportion of primary care physicians who regularly measure the body mass index of their patientsb |
|
56 Nutrition and weight counseling by physicians |
Increase the proportion of physician office visits that include counseling or education related to nutrition or weightb |
|
57 Physical activity-related counseling by physicians |
Increase the proportion of physician office visits that include counseling or education related to physical activity |
| Strategy 4-2: Ensure coverage of, access to, and incentives for routine obesity prevention, screening, diagnosis, and treatment | |
|
58 Insurance incentives for healthful lifestyles |
Increase the number of health plans that include incentives for maintaining healthful lifestylesd |
|
59 Obesity screening and promotion strategies offered by health plans |
Increase the number of health plans that promote obesity screening and preventiond |
|
60 Obesity screening and prevention reimbursement strategies offered by health plans |
Increase the number of health care plans that use innovative reimbursement strategies for screening and obesity prevention servicesd |
| Indicator Topic | Objectivea |
|
61 Obesity screening and prevention metrics |
Increase the number of health plans reporting and achieving obesity prevention and screening metrics, including universal BMI assessment, weight assessment, and counseling on physical activity and nutrition for children, adolescents, and adultsd |
| Strategy 4-3: Encourage active living and healthy eating at work | |
|
62 Employee health promotion programs |
Increase the proportion of worksites that offer an employee health promotion program to their employeesb(developmental) |
|
63 Employee participation in health promotion programs |
Increase the proportion of employees who participate in employer-sponsored health promotion activitiesb(developmental) |
|
64 Employee participation in exercise programs |
Increase the proportion of employed adults who have access to and participate in employer-based exercise facilities and exercise programsb(developmental) |
| Strategy 4-4: Encourage healthy weight gain during pregnancy and breastfeeding and promote breastfeeding-friendly environments | |
|
65 Exclusive breastfeeding |
Increase the proportion of children between the ages of 6 months and 5 years who were exclusively breastfed or given breast milk for their first 6 months |
|
66 Hospital breastfeeding policies |
Increase the percentage of U.S. hospitals with policies and practices to support breastfeedingd |
|
67 Employer lactation-support programs |
Increase the proportion of employers that have worksite lactation-support programsb |
|
68 Breastfeeding disparities |
Reduce disparities in breastfeeding initiation and maintenanced |
| APOP GOAL AREA 5: SCHOOLS AND CHILD CARE ENVIRONMENTSe | |
| Strategy 5-1: Require quality physical education and opportunities for physical activity in schools | |
|
69 Daily school physical education |
Increase the proportion of adolescents who participate in daily school physical educationb |
|
70 Daily school physical education |
Increase the proportion of public and private schools that require daily physical education for all studentsb |
|
71 School recess—state |
Increase the number of states that require regularly scheduled elementary school recessb |
|
72 School recess—school district |
Increase the proportion of school districts that require regularly scheduled elementary school recessb |
|
73 School recess time |
Increase the proportion of school districts that require or recommend elementary school recess for an appropriate period of timeb |
| Strategy 5-2: Ensure strong nutritional standards for all foods and beverages sold or provided through schools | |
|
74 Availability of healthy food options in schools |
Increase the proportion of school districts that require schools to make fruits or vegetables available whenever other food is offered or soldb |
|
75 School Breakfast Program in schools |
Increase the proportion of schools with a School Breakfast Programb |
|
76 Child dietary intake in school |
Increase the proportion of children and adolescents aged 5-18 who consume foods and beverages at school recommended by the Dietary Guidelines for Americansd |
| Indicator Topic | Objectivea |
|
77 Federal school meal standards |
Increase the proportion of schools offering meals that meet the 2012 federal nutrition standards for school meals. |
|
78 Child dietary intake of solid fats and added sugars in school |
Decrease the proportion of children and adolescents aged 5-18 who consume foods and beverages at school not recommended by the Dietary Guidelines for Americans such as those containing solid fats and added sugarsd |
|
79 Farm-to-School programs |
Increase the number of schools with Farm-to-School programs |
| Strategy 5-3: Ensure food literacy in schools | |
|
80 National Health Education Standards |
Increase the proportion of schools that require cumulative instruction in health education that meet the National Health Education Standards for elementary, middle, and senior high schoolsb |
|
81 Nutrition professional development for teachers |
Increase the proportion of required health education classes or courses taught by a teacher who has had professional development related to nutrition and dietary behavior within the past 2 years |
| GOAL AREA 5: RELATED AND RELEVANT INDICATORS | |
|
82 College physical education |
Increase the proportion of college and university students who receive information from their institution on the priority health risk behavior area: inadequate physical activityb |
|
83 College nutrition education |
Increase the proportion of college and university students who receive information from their institution on the priority health risk behavior area: unhealthy dietary patternsb |
* The indicators in Table 4-1 are best aligned with the recommendations included in the IOM’s Accelerating Progress in Obesity Prevention report (IOM, 2012) based on available and ongoing data sources.
NOTE: Physical activity is defined to include large muscle or gross motor activity, development, and/or equipment as well as vigorous or moderate physical activity. A healthy food outlet is defined as a grocery store or produce stand/farmers’ market. A supportive neighborhood is usually or always an area where neighbors help each other and watch each other’s children, where parents feel children are safe at school, and where trusted adults are nearby.
a Objective wording based on wording available from data source and/or from Healthy People 2020 (HHS, 2010), if applicable. See Table 4-2 for data sources associated with each indicator.
b Healthy People 2020 indicator (HHS, 2010). “Developmental” indicates that there were no baseline data available for the indicator and therefore it did not have a set target at the time of the Committee’s work.
c Leading Health Indicators are a subset of the Healthy People 2020 indicators selected on priority health issues (HHS, 2010).
d Accelerating Progress in Obesity Prevention indicator (IOM, 2012).
e Additional indicators in this table of interest related to the school and child care environment include school (#30 and #38) and child care (#27 and #43).
areas and strategies. Using the four criteria for choosing indicators and objectives described above, the Committee consolidated the list into 83 indicators and concomitant objectives—13 overarching and 70 goal-area indicators and objectives.
Table 4-1 presents the 83 indicators identified by the Committee to (1) inform the national, state, and community plans; (2) to recommend items for strengthening surveillance systems with indicators that would have comparability across jurisdictions; and (3) as examples of indicators that could be used by independent evaluators who wish to design their own obesity prevention evaluation studies. The list of
indicators is intentionally broad, providing a menu of possible indicators for use by policy makers, planners, and evaluators. Because the indicators and objectives were drawn from existing, readily available data sources and because priority was given to indicators and objectives that had been previously vetted (e.g., those from Healthy People 2020), the wording of the Committee’s objectives (see Table 4-1) matches the wording of the individual data source or the existing Healthy People 2020 objective.
Across these multiple data sources, there is variable information available on the reliability and validity of the systems and measures. For example, at the national level, the burden of obesity can be accurately assessed for various subgroups because large national surveys (e.g., National Health and Nutrition Examination Survey [NHANES]) take actual measures of the weight and height of the respondents. Generally at the state and community levels, however, only self-reported information on weight and height is available for adults through systems such as the Behavioral Risk Factor Surveillance System (BRFSS) or the Youth Risk Behavioral Surveillance System. Estimates based on self-reported weight and height will differ from, and be potentially biased compared to, estimates based on objective measurements (Gillum and Sempos, 2005; Yun et al., 2006). Estimation may be biased across various socio-demographic groups and across time periods (where body mass index underestimation may be increasing over time) (Le et al., 2013; Shiely et al., 2013; Yun et al., 2006).
The list of indicators is intended to illustrate the range of indicators that may be considered by evaluators based on currently available data sources, but in no way is it intended to be exhaustive, nor does it necessarily include the best indicators for a given strategy or goal. The Committee was not able to assess which indicators might be the “best” in every case or which combination(s) of indicators might be ideal for the national and/or community plans or for individual obesity prevention evaluation studies. Rather, the Committee identified a range of overarching/system-level and goal area–specific indicators that were best aligned with the APOP recommendations (IOM, 2012) based on available and ongoing data sources. The discussion below provides recommendations for future work on indicator development.
Although obesity rates in the United States may have plateaued in some population subgroups, overall rates remain stubbornly high, and disparities across multiple levels, including race/ethnicity, income, and gender appear to be increasing. Many factors contribute to the intractability of disparities in the prevalence of obesity, ranging from the social, built, policy, and economic environments to individual behaviors, physiology, and epigenetics. Thus, tracking and monitoring of differential rates of exposures to these factors and their subsequent influence on obesity incidence and prevalence is important. Rather than developing a separate set of indicators specifically for disadvantaged populations, the Committee recommends that available indicators, such as those included in Table 4-1, be used broadly, expanded as needed, and include traditionally disadvantaged groups in an effort to evaluate progress on obesity efforts among populations most affected. In Chapter 5 of this report, the Committee provides context for obesity prevention in disadvantaged populations, related challenges, and a summary of the methods and tools that are likely to be useful.
DATA SOURCES
In the United States, several monitoring surveys and surveillance systems have been used to document weight status and related measures using nationally representative samples, including NHANES, the National Health Interview Survey, and periodic evaluations of nutrition program participants.
Evaluations that collect data representative of state populations include the Centers for Disease Control and Prevention’s BRFSS and the Youth Risk Behavior Surveillance System, and others. These surveys and surveillance systems differ according to the geographic level of data (e.g., national, state, regional, county, municipal, school district, etc.); types of measures (e.g., objective versus subjective [self-report]), including nutrition and physical activity–related behaviors; periodicity; population (e.g., adults, children, program participants, etc.); and purpose (e.g., monitoring, policy making, regulatory, safety, evaluation). Surveillance systems in the United States focus more on nutrition-related measures than on physical activity. Additionally, current national surveillance and monitoring efforts lack surveillance/summative evaluations of obesity-related policies and environmental features, probably because of the relatively recent focus on policies and the environment as levers for intervention activities (see Chapter 1). Furthermore, as indicated in Table 4-2, most of the indicators included in Table 4-1 are available from large, national data systems providing data estimates at the national or state levels primarily, with only a few systems providing data estimates below the state level. Appendix D provides detailed information on each of the data sources listed in Table 4-2, including the sponsoring organization, study design, periodicity, and populations studied. Tables 6-3 and 7-2 list specific indicator topics and data sources at the national and state levels and at the community level, respectively.
TABLE 4-2 Data Sources for Recommended Indicator Topics* and Available Level of Estimates
| Data Source | Indicator Topic(s) | Level of Estimates Available |
|
1 American Community Survey (ACS) |
• Adult active transport by walking • Bicycling by adults |
• National, state, county, city, ZIP code, selected American Indian/Alaskan Native areas |
|
2 Behavioral Risk Factor Surveillance System (BRFSS) |
• Adult physical activity • Consumption of fruit (adults) • Consumption of vegetables (adults) • Obesity (adult) • Overweight (adult) |
• National, state, selected metropolitan/micropolitan statistical areas, selected counties |
|
3 Bridging the Gap (BTG) |
• Availability of healthy food options in schools • Daily school physical education • School Breakfast Program in schools • School policies to facilitate access to clean drinking water • School recess—state • School recess—school district • School recess time • Sugar-sweetened beverage policies in schools • Sugar-sweetened beverage taxation |
• National, state |
|
4 Centers for Disease Control and Prevention (CDC) Chronic Disease State Policy Tracking System |
• Policies that promote physical activity and the built environment • Sugar-sweetened beverage taxation |
• State |
| Data Source | Indicator Topic(s) | Level of Estimates Available |
|
5 CDC State Indicator Report on Fruits and Vegetables |
• Food retail incentive policies |
• National, state |
|
6 Classification of Laws Associated with School Students (CLASS) |
• School policies to facilitate access to clean drinking water • Sugar-sweetened beverage policies in schools |
• National, state |
|
7 County and ZIP Code Business Patterns (CZCBP) |
• Fast-food outlet density • Healthy food outlet density • Recreational facility outlet density |
• National, state, county, metropolitan/micropolitan statistical areas, ZIP code |
|
8 Federal appropriations laws |
• Funding for national social marketing program |
• National |
|
9 General Services Administration (GSA) |
• Healthy vending policies in federal buildings, worksites, and facilities |
• National |
|
10 Healthcare Effectiveness Data and Information Set (HEDIS) |
• Obesity screening and prevention metrics |
• National, regional, state |
|
11 Infant Feeding Practices Study II (IFPS-II) |
• Employer lactation support programs • Gestational weight gain • Maternal post-pregnancy weight • Maternal pre-pregnancy weight |
• National |
|
12 National Ambulatory Medical Care Survey (NAMCS) |
• Insurance incentives for healthy lifestyles • Nutrition and weight counseling by physicians • Obesity screening and prevention reimbursement strategies • Obesity screening and promotion strategies offered by health plans • Physical activity-related counseling by physicians |
• National |
|
13 National College Health Assessment (NCHA) |
• College nutrition education • College physical education |
• National |
|
14 National Compensation Survey–Benefits (NCS) |
• Employer lactation support programs |
• National, selected metropolitan/micropolitan statistical areas, census regions, census division |
|
15 National Consumer Panel (formerly known as A.C. Nielsen Homescan) |
• Purchase of foods and beverages recommended in Dietary Guidelines for Americans |
• National |
|
16 National Farm-to-School Network |
• Farm-to-School programs |
• National, state |
| Data Source | Indicator Topic(s) | Level of Estimates Available |
|
17 National Health and Nutrition Examination Survey (NHANES) |
• Adolescent physical activity • Adult energy intake • Adult physical activity • Child and adolescent daily vigorous physical activity • Child and adolescent energy intake • Child school dietary intake • Child school dietary intake of solid fats and added sugars (SoFAS) • Consumption of added sugars • Consumption of fruits • Consumption of solid fats • Consumption of solid fats and added sugars (SoFAS) • Consumption of vegetables • Consumption of whole grains • Obesity (adult, adolescent, child, and preschool age) • Overweight (adult, adolescent, child, preschool age, and infant) • Physical activity for older adults • Purchase by Supplemental Nutrition Assistance Program (SNAP) participants of foods and beverages recommended in Dietary Guidelines for Americans • Sugar-sweetened beverage consumption |
• National |
|
18 National Health Interview Survey (NHIS) |
• Adult physical activity • Employee participation in exercise programs • Physical activity for older adults |
• National, selected state estimates w/ years combined |
|
19 National Household Travel Survey (NHTS) |
• Active commuting to school • Bicycling by adults |
• National, selected states (if they choose to add on) |
|
20 National Immunization Survey (NIS) |
• Breastfeeding disparities |
• National, state, selected large urban areas |
|
21 National Profile of Local Health Departments |
• Community-based primary prevention nutrition-related services • Community-based primary prevention physical activity–related services |
• National |
|
22 National Resource Center for Health and Safety in Child Care and Early Education—State Licensing Information |
• Nutrition standards in child care • Physical activity requirements for licensed child care |
• State |
| Data Source | Indicator Topic(s) | Level of Estimates Available |
|
23 National Survey of Children’s Health (NSCH) |
• Child and adolescent daily vigorous physical activity • Child and adolescent physical activity– related attitudes and perceptions • Exclusive breastfeeding • Nonschool organized physical activity– related activities |
• National, state, Health Resources and Services Administration (HRSA) region |
|
24 National Survey of Employer-Sponsored Health Plans |
• Employee health promotion programs • Employee participation in health promotion programs |
• National |
|
25 National Survey of Maternity Practices in Infant Nutrition and Care (mPINC) |
• Hospital breastfeeding policies |
• National, state |
|
26 National Survey on Energy Balance-related Care among Primary Care Physicians |
• Body mass index measurement by physicians • Insurance incentives for healthy lifestyles • Nutrition and weight counseling by physicians • Obesity screening and prevention reimbursement strategies • Obesity screening and promotion strategies offered by health plans • Physical activity–related counseling by physicians |
• National |
|
27 National Vital Statistics System |
• Birth weight • Gestational weight gain • Maternal pre-pregnancy weight |
• National, state |
|
28 Nielsen Media Research |
• Television marketing of foods and beverages to children and adolescents |
• National, metropolitan, market groups (constructed by Nielsen) |
|
29 NPD Group |
• Child and adolescent caloric intake in restaurants |
• National |
|
30 Pregnancy Risk Assessment Monitoring System (PRAMS) |
• Gestational weight gain • Maternal pre-pregnancy weight |
• State |
|
31 Quarterly Food-at-Home Price Database (QFAHPD) |
• Price of fruit and vegetables • Price of low-fat milk |
• Community |
| Data Source | Indicator Topic(s) | Level of Estimates Available |
|
32 School Health Policies and Practices Survey (SHPPS) |
• Availability of healthy food options in schools • Daily school physical education • Joint/shared use of community facilities • National Health Education Standards • Nutrition professional development for teachers • School Breakfast Program in schools • School policies to facilitate access to clean drinking water • School recess • Sugar-sweetened beverage policies in schools |
• National, state, selected large districts |
|
33 School Nutrition Dietary Assessment Study (SNDA) |
• Availability of healthy food options in schools • Farm-to-School programs • Federal school meal standards • School Breakfast Program in schools • Sugar-sweetened beverage policies in schools |
• National |
|
34 State Birth Registries/Birth Records Databases |
• Birth weight • Exclusive breastfeeding • Gestational weight gain (for states using 2003 revised live birth certificates) • Maternal pre-pregnancy weight |
• State |
|
35 State SNAP-Ed Plans (available from the U.S. Department of Agriculture) and SNAP Policy Database |
• Nutrition education policies for federal nutrition programs |
• State |
|
36 Yale Rudd Center for Food Policy and Obesity—Legislative Database |
• Sugar-sweetened beverage taxation |
• National, state, selected large metropolitan areas |
|
37 Youth Risk Behavior Surveillance System (YRBSS) |
• Adolescent physical activity • Consumption of fruit (adolescent) • Consumption of vegetables (adolescent) • Daily school physical education • Daily vigorous physical activity (adolescent) • Obesity (adolescent) • Overweight (adolescent) • Sugar-sweetened beverage consumption (adolescent) |
• National, state, community |
* Recommended Indicator Topics identified in Table 4-1.
NOTE: Appendix D provides detailed information on each of the data sources listed in Table 4-2, including the sponsoring organization, study design, periodicity, and populations studied.
Broader Population Health and Obesity Prevention–Related Indicator Topics
In addition to indicators that could align with the APOP (IOM, 2012) goal areas and strategies, the Committee considered it equally important to identify a menu of additional indicator categories addressing broader population health and well-being. These obesity prevention–related indicators do not directly link to APOP topics, but they are important for the Committee’s national and community plans, as well as for independent obesity prevention–related evaluation studies. Such broader, population health and prevention indicators would offer perspective to obesity prevention efforts and would help to relate grassroots priorities and action to achievement of community and national improvements in health outcomes. These broader indicators should be viewed as complementary to the APOP indicators. Although not an exhaustive list, Table 4-3 provides examples of major categories of additional indicators that would be worthwhile to include in obesity prevention–related evaluation studies at the national and community levels.
GAPS IN EXISTING INDICATORS
Consistent with the APOP (IOM, 2012) strategies, the proposed goal-area indictors are heavily focused on policy, environment, and behavior changes with very few, if any, indicators addressing partnerships and leadership or health equity issues. Although the Committee wanted to include indicators on each of these gap areas, it could not find any widely uniform data sources that address these categories of the framework, measured at regular intervals, or that were already or could be computed from the available data. As noted above, the vast majority of the indicators were compiled from sources providing national- and state-level data, with only a limited number of sources providing readily available and repeated data below the state level. In Table 4-4 the Committee identifies examples of key national- and community-level surveillance gaps. Although not exhaustive, the list illustrates a range of data that if fulfilled would facilitate monitoring and evaluation of the implementation and impact of the full spectrum
TABLE 4-3 Categories of Broader Population Health and Well-Being Issues for Consideration in an Evaluation Plan
|
• Child feeding practices • Complementary feeding* (infants) • Food insecurity • Neighborhood safety/environment • Obesity-related chronic conditions (e.g., coronary heart disease, diabetes, gestational diabetes, hypertension) • Overall reported health status • Participation in federal nutrition assistance programs (WIC, NSLP, SBP, SNAP, etc.) • Participation in organized physical activities outside of school • Physical activity of mother/father • Physical inactivity and sedentary behaviors (e.g., time spent playing electronic video games or watching television) • Safe school environments • Sleep duration and quality |
* Complementary feeding is defined as the feeding of solid foods.
NOTE: NSLP = National School Lunch Program; SBP = School Breakfast Program; SNAP = Supplemental Nutrition Assistance Program; WIC = Special Supplemental Nutrition Program for Women, Infants, and Children.
TABLE 4-4 Examples of Surveillance Needs Related to the Recommended APOP* Goals
|
Overarching/System-level • Communitya-level estimates of dietary- and physical activity–related environments, policies, programs, partnerships, leadership, and social norms • Individual exposure to obesity prevention–related policies and programs on a daily basis (ideally at the state and community levels as well as nationwide) • Data on social determinant variables (e.g., living and working conditions, stress, and social support) • National- and community-level data obtained from medical records including but not limited to: — Gestational diabetes — Gestational weight gain — Maternal smoking during pregnancy — Overweight among young children (<2 years of age) based on World Health Organization growth charts Goal Area 1: Physical Activity Environments (and Related Behaviors) • Adult walking activity • Community or shared-use agreements for physical activity/recreational purposes • Community-based physical activity programs such as those offered by Young Men’s Christian Associations and Boys and Girls Clubs • Individual exposure to physical activity–related programs and policies on a daily basis (ideally at the state and community levels as well as nationwide) • Land use and urban planning efforts aimed at facilitating walkable communities • Muscle- and bone-strengthening activity levels for children • Physical activity by young children aged 2-5 • Physical activity/inactivity by location (e.g., domestic, leisure time, occupational, transportation [not work-related]) • Readily compiled and accessible national and community-level geographic information system (GIS) data related to the physical environment (e.g., sidewalks, trails, parks, playgrounds, etc.) Goal Area 2: Food and Beverage Environments (and Related Behaviors) • Availability of sugar-sweetened beverages in stores, vending machines, and other outlets selling beverages outside of school environments (ideally data at both the community and national levels) and data on individual-level purchasing of such items • Commercial or private-sector food- and beverage-related policies, and programs as well as food and beverage availability and portion size data (ideally data would be available at the community and national levels) • Community-level data on food and beverage pricing and promotion practices and the relative availability of healthy options as compared to unhealthy options in food outlets • Community-level surveillance of food- and beverage-related policies, including zoning related to food outlets, taxation of sugar-sweetened beverages, and incentive programs to encourage development of outlets selling fruits and vegetables • Individual-level snacking behavior • Individual exposure to nutrition-related policies and programs on a daily basis (ideally at the state and community levels as well as nationwide) • Institutional-level interactions and collaborations such as farm-to-institution collaborations, industry and government purchasers, and collaborations between developers, governments, and major chain supermarkets • Readily compiled and accessible nationwide and community-level GIS data related to the food and beverage environment (e.g., food outlet density) • Availability of free easily accessible potable water • Surveillance of local policies on sugar-sweetened beverages • Surveillance of local policies on nutrition standards for foods and beverages provided to preschool-aged children in child care |
|
Goal Area 3: Messaging Environment • Nationwide and community-level data on child, adolescent, and adult exposure to obesity-related social marketing campaigns • Community-level data on child, adolescent, and adult exposure to food and beverage advertising and sedentary activity advertising Goal Area 4: Health Care and Worksite Environments • Counseling on diet and physical activity by health care providers (as documented in electronic medical records) • National and community-level data on worksites with health promotion programs and policies and nutrition or weight management counseling or classes • National and community-level data on the proportion of the workforce with sedentary jobs • National and community-level data on hospitals and worksites promoting healthy eating and active living • Proportion of states with health education classes or courses for health care providers that focus on nutrition and physical activity Goal Area 5: School and Child Care Environments • Individual-level data compiled at the national and community levels related to — Child and adolescent knowledge of the Dietary Guidelines for Americans and Physical Activity Guidelines for Americans • National-, state-, and community-level data on policies, programs, and/or practices related to — Community use of school facilities for recreational purposes — Elementary, middle, and high schools providing sequential, comprehensive school health education, including components related to unhealthy dietary behaviors and inadequate physical activity — All foods and beverages sold/served in early child care and school settings meet the recommendations of the Dietary Guidelines for Americans or federal nutrition standards — Physical activity–related programs in child care and early childhood education settings • Nutrition- and physical activity–related policies and programs on college campuses • Proportion of states with health education classes or courses for child care providers that focus on nutrition and physical activity |
* Accelerating Progress in Obesity Prevention (IOM, 2012).
a For all items referring to “community-” level data, data are needed nationwide. The Committee intends that the surveillance activities would provide community-level information nationwide and not be limited to or necessarily nationally representative data.
of the APOP strategies (IOM, 2012). As a key activity in the proposed National Obesity Evaluation Plan (see Chapter 6), the gaps identified in this chapter can provide guidance for improving the infrastructure for continuous, nationwide monitoring and surveillance of progress in implementing the APOP strategies. Chapter 10 provides recommendations and potential actions to improve existing surveillance and monitoring systems and to address these gaps (see Recommendation 2).
SUMMARY
This chapter identifies a broad spectrum of indicators and data systems that could be used to evaluate progress in achieving the strategies recommended by the Committee to Accelerate Progress in Obesity Prevention (IOM, 2012). Although the list of existing indicators is vast, there are several gaps in existing surveillance systems and a limited number of indicators and surveillance systems that provide data below the national or state levels. Such issues are further addressed in the chapters that follow.
REFERENCES
CAHMI (The Child and Adolescent Health Measurement Initiative). 2013. The National Survey of Children’s Health. http://www.childhealthdata.org/learn/NSCH (accessed January 29, 2013).
CARES-University of Missouri. 2013. Childhood obesity GIS. http://www.childhoodobesitygis.org (accessed February 3, 2013).
CDC (Centers for Disease Control and Prevention). 2013. The Community Guide. http://www.thecommunityguide.org/index.html (accessed January 30, 2013).
Community Commons. 2013. Community Commons. Together for the common good. http://www.communitycommons.org (accessed April 19, 2013).
EBRI (Employee Benefits Research Institute). 2013. Employee data book on health benefits. http://ebri.org/publications/books/?fa=databook (accessed February 3, 2013).
Gillum, R. F., and C. Sempos. 2005. Ethnic variation in validity of classification of overweight and obesity using self-reported weight and height in American women and men: The third National Health and Nutrition Examination Survey. Nutrition Journal 4(1):1-8.
HHS (Department of Health and Human Services). 2010. Healthy People 2020. http://www.healthypeople.gov/2020/default.aspx (accessed January 31, 2013).
HHS. 2013. 2020 topics & objectives. http://www.healthypeople.gov/2020/topicsobjectives2020/default.aspx (accessed May 28, 2013).
IOM (Institute of Medicine). 2009. Weight gain during pregnancy. Reexamining the guidelines. Washington, DC: The National Academies Press.
IOM. 2011. Leading health indicators for Healthy People 2020: Letter report. Washington, DC: The National Academies Press.
IOM. 2012. Accelerating progress in obesity prevention: Solving the weight of the nation. Washington, DC: The National Academies Press.
Le, A., S. E. Judd, D. B. Allison, R. Oza-Frank, O. Affuso, M. M. Safford, V. J. Howard, and G. Howard. 2013. The geographic distribution of obesity in the US and the potential regional differences in misreporting of obesity. Obesity (Silver Spring) [March 20 Epub].
National Consumer Panel. 2013. National Consumer Panel. http://www.ncppanel.com/content/ncp/ncphome.html (accessed March 20, 2013).
NCCOR (National Collaborative on Childhood Obesity Research). 2013. NCCOR Catalogue of Surveillance Systems. http://tools.nccor.org/css (accessed February 3, 2013).
Shiely, F., K. Hayes, I. J. Perry, and C. C. Kelleher. 2013. Height and weight bias: The influence of time. PLoS ONE 8(1):e54386.
USDA (U.S. Department of Agriculture). 2013. Food Environment Atlas. http://www.ers.usda.gov/data-products/food-environment-atlas.aspx (accessed February 3, 2013).
Yun, S., B. P. Zhu, W. Black, and R. C. Brownson. 2006. A comparison of national estimates of obesity prevalence from the Behavioral Risk Factor Surveillance System and the National Health and Nutrition Examination Survey. International Journal of Obesity 30(1):164-170.


