
Uncertainties Spanning Potential SORCE/TIM to JPSS/TIM Gap
Greg Kopp & Judith Lean
Sept. 2011
Section
Executive Summary of a TIM Data Gap
3. Climate Data Record Requirements
4. Effects Contributing to Gap Uncertainties
5. Spanning a Gap via Instruments: ACRIM3, VIRGO, PREMOS
5.3. Example TIM Data Gap Filled by ACRIM3
5.4. Summary of Accuracies, Stabilities, and Noise
6. Spanning a Gap via Empirical Solar Models
7. Summary of Uncertainties Via Different Cap Filling Methods
EXECUTIVE SUMMARY OF A TIM DATA GAP
Uncertainties in the TSI climate data record are estimated in the event of a gap in data between the TIM instrument currently on the SORCE mission and that being built for the upcoming JPSS. ACRIM3, VIRGO, PREMOS, and solar models are considered as possible methods of filling a TIM data gap, and uncertainties are provided as a function of gap duration and TIM overlap time for each, ESA’s VIRGO currently provides the best means of filling a TIM data gap, with solar models offering limited capability for short duration gaps; but no gap filling method meets the JPSS TSI climate data record requirements, since no other instrument or model has demonstrated the stability or low noise of the TIM instrument.
The 33 year long spacecraft record of total solar irradiance (TSI) has been acquired by several different instruments. Although absolute accuracy has been limited, measurement overlap enables the construction of TSI composites, such as that shown in Figure 1, that provide knowledge of the energy driving the Earth’s climate system and a needed input for climate models.
The current SORCE/TIM has demonstrated superior accuracy, noise, and stability to any other TSI instrument on orbit. The upcoming JPSS/TIM has yet more stringent climate-driven accuracy requirements that are not met by any other flight instrument. Since the solar climate data record (CDR) currently relies on
measurement continuity and instrument stability, a gap in TIM measurements will degrade the 33 year data record.
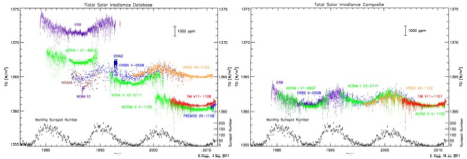
Figure 1: The spaceborne TSI data record has been continuous since 1978 (left plot). Offsets due to calibration differences are adjusted by overlap between successive instruments. The composite record (right plot) relies on measurement continuity and instrument stability.
In the undesirable event of a gap in measurements between the SORCE and JPSS TIM instruments, how well can other extant flight instruments measure or solar models estimate solar variability? What uncertainties will be induced in the 33-year TSI climate data record by such a gap?
1. Via comparisons to co-temporal TIM observations, estimate uncertainties in TSI measurement accuracy, stability, and noise from extant spaceborne radiometers, particularly ACRIM3, VIRGO, and PREMOS.
2. Use resulting TSI measurement uncertainties to estimate uncertainties in knowledge of solar variability as a function of TIM measurement gap duration, accounting for observed inter-instrument drifts (if constant).
3. Consider fits to TSI data via empirical solar proxy models, in particular sunspot-and faculae-based models and photometric indices from ground observations, and estimate uncertainties in spanning a TIM measurement gap via such models.
4. Simulate a gap in SORCE/TIM data and fill with data from other instruments or proxy-based models, estimating uncertainties in filled data.
5. Compare uncertainties in filled data with JPSS TSI CDR requirements and with uncertainties from purely relying the absolute accuracies of the SORCE and JPSS TIMs.
6. Deliver report describing potential instrument and model comparisons with associated uncertainty assessments.
3. CLIMATE DATA RECORD REQUIREMENTS
The JPSS/TIM climate data record (CDR) requirements are driven by the need to detect possible long-term solar variability critical for climate studies, and are summarized in Table 1.
Table 1: CPR Requirements for the JPSS/TIM
| Parameter | CDR Requirement |
| Absolute Accuracy | 0.01% (100 ppm) |
| Stability | 0.001%/yr (10 ppm/yr) |
| Noise | 0.001% (10 ppm) |
4. EFFECTS CONTRIBUTING TO GAP UNCERTAINTIES
The effects contributing uncertainties in filling a gap in TIM measurements, similar for both instruments and models used to fill that gap, are:
1. Absolute Accuracy: Absolute accuracy allows measurements against an SI scale. Sufficient accuracy enables long-term solar trend detections without reliance on measurement continuity. Uncertainties filling a gap via absolute accuracy are independent of gap duration. While the JPSS/TIM promises improved accuracy over prior TSI instruments, existing instruments - the SORCE/TIM being the best at a low 350 ppm uncertainty - are more limited. Solar models cannot indicate absolute accuracy.
2. Stability (Long-Term Precision): Relative changes, or drifts, between instruments or models limit gap filling. If constant, such drifts may be estimated during times of instrument measurement overlap, so can be removed to the accuracy with which they are known. Uncertainties filling a gap increase with stability uncertainties and gap duration.
3. Noise (Short-Term Precision): Gap filling relies on overlap with measurements or models prior to and after the gap. Noise, or short-term variances, between the TIM and comparison instruments or models will limit the accuracy to which the SORCE/TIM and the JPSS/TIM can be connected. Noise effects are reduced statistically with longer overlap periods.
Spanning a gap relying on absolute accuracy is limited by the uncertainties of the prior and subsequent instruments; in this case, the SORCE/TIM and the JPSS/TIM, which could bridge a gap to ~360 ppm uncertainty independent of the gap duration. Uncertainties from noise and stability for a short gap duration are small compared to accuracy limitations. Spanning a gap via either intervening measurements or models relies on the utilized instruments’ or models’ stabilities (unaccounted for drifts), which increase uncertainties with gap duration, and on measurement agreement (limited by noise) with the TIMs prior to and after the gap. Longer overlap durations improve knowledge of both stability and agreement, so gap uncertainties decrease with overlap duration. Examples of these effects are shown in Figure 2.
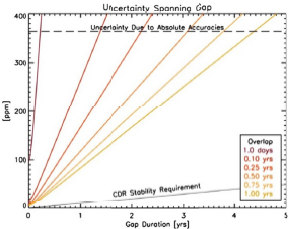
Figure 2: General effects contributing to uncertainties in spanning a TSI data gap. Stability uncertainties increase with gap duration, limiting accuracy; measurement noise limits the uncertainties at short gap durations. Longer overlap durations with prior (SORCE/TIM) and following (JPSS/TIM) instruments improve knowledge of stability of and agreement with intervening gap-filling instrument or model, decreasing uncertainties.
5. SPANNING A GAP VIA INSTRUMENTS: ACRIM3, VIRGO, PREMOS
The ACRlMSat/ACRIM3 was launched in 1999. Recent comparisons of a ground-based model to the TSI Radiometer Facility (TRF) have improved the on-orbit ACRIM3 absolute accuracy significantly, reducing its uncertainty from a heretofore unrecognized ~0.4% to perhaps an optimistic 0.1%1. This accuracy is not sufficient to achieve the JPSS CDR requirements, so reliance on ACRIM3 will depend on this instrument’s stability during a gap and its noise during periods of overlap with the SORCE/TIM and JPSS/TIM
The SoHO/VIRGO was launched in 1996. Tests of a ground-based unit have demonstrated high scatter that has not been corrected and some uncertainty in power measurement accuracy, limiting the VIRGO’s absolute accuracy to ~0.4%2 This instrument utilizes TIM measurements to some degree for correcting long-term degradation, so its stability may be degraded during a TIM gap.
The PICARD/PREMOS was launched in June 2010, so is the youngest TSI instrument on orbit and thus may overlap with both the SORCE and JPSS TIMs. This instrument is the most thoroughly characterized of those on-orbit, but is showing extremely high degradation that limits its stability critical for spanning a TIM gap. Data have recently been made available for this study and are preliminary - future degradation corrections are hoped to improve these data.
_________________________________
1 Updated uncertainties have not yet been reported by ACRIM instrument team.
2 Author assessment based on recent laboratory findings.
The instrument data records and models utilized for this report are listed in Table 2. The instrument daily TSI time series are shown in Figure 3.
Table 2: TSI Data Records Studied
| Instrument/Model | Data Set & Version | Time Range |
| SORCE/TIM | V.11 | 25 Feb. 2003 - 22 August 2011 |
| ACRIMSat/ACRIM3 | acrim3_sdc_ts_1104 | 5 Apr. 2000 - 2 May 2011 |
| SoHO/VIRGO | virgo_tsi_d_v6_002_1102 | 7 Feb. 1996 - 2 Feb. 2011 |
| PICARD/PREMOS | preliminary (for study) | 27 July 2010 - 17 Aug. 2011 |
| NRL Model | tis_mod_mr2_11Mar11 | 6 Nov. 1978 - 26 Dec 2010 |
| SFO Model | sfo_Sigmas_F10_ Mg | 9 May 1988 - 31 May 2011 |
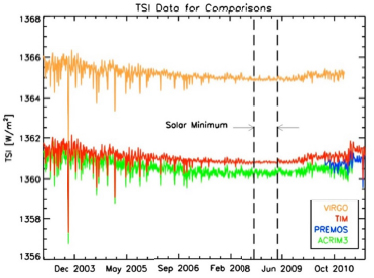
Figure 3: Time series of TSI data from TIM, ACRIM3, VIRGO, and PREMOS where instruments overlap. These are the data used for this analysis.
The noise in the ACRIM and VIRGO measurements is estimated during solar minimum, shown in the expanded time scale of Figure 4. The reported standard deviations of the TSI values for each instrument, being the quadrature sum of the instrumental noise and the actual solar variability, are listed in this figure. For the TIM, independent calibration measurements give 4 ppm as the noise, implying that the solar activity during this plotted time range accounts for nearly all of the TIM’s reported 17 ppm variability. The larger variations in the ACRIM and VIRGO data during this time period indicate they are limited by instrumental noise rather than solar variability, with estimates of their noise given in Table 4. The noise from two
TSI models, discussed later, is computed similarly over this solar minimum period and is included in Table 4. Higher noise values will require longer overlap periods with the SORCE and JPSS TIMs to reduce gap uncertainties.
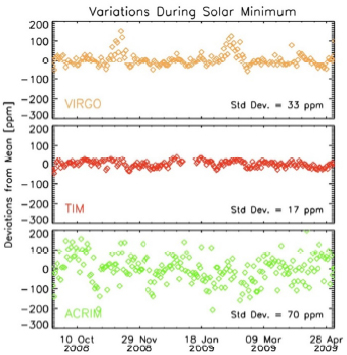
Figure 4: Instrument noise is estimated during low solar activity at solar minimum.
The PREMOS data, shown in figure 5, began in mid-2010 and thus cannot be compared during solar minimum. This instrument agrees within uncertainties to the SORCE/TIM on an absolute scale. Relative variations, mainly due to uncorrected degradation (i.e. instrument stability), currently greatly exceed those from the ACRIM and the VIRGO, but may improve with future PREMOS degradation corrections.
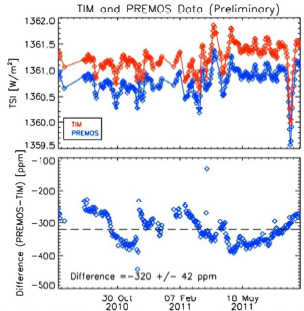
Figure 5: Preliminary PREMOS data are a mere 320 ppm lower than the SORCE/TIM TSI values. Relative variations are higher than the ACRIM and VIRGO vs. TIM, but may improve with future PREMOS degradation corrections.
This study’s stability estimates for the ACRIM3 and VIRGO come from comparisons of the instruments relative to the SORCE/TIM and from changes with reprocessing for different data versions. (For instance, the latest version of the ACRIM3 data differs in slope from the prior version by 11 ppm/yr, indicating the instrument’s stated 3 ppm/yr stability - quoted at the time for the older version - is underestimated.) Relative comparisons of the TSI data from the instruments and the NRL empirical solar model (see §6) are shown in Figure 6 and indicate high drift rates that will contribute to increasing uncertainties with time if using these instruments to fill a TIM data gap.
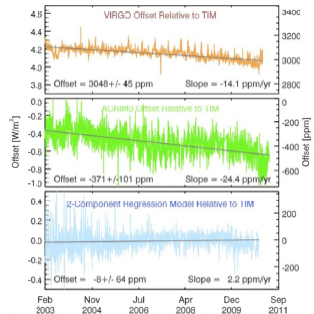
Figure 6: Relative comparisons of the ACRIM3 and VIRGO to TIM show measurement offsets and relative drifts that need to be assessed via overlap periods, but will even then introduce uncertainties in spanning a gap in TIM measurements. Lean’s empirical NRL solar TSI model shows better trend agreement with the TIM data.
Where constant, the drifts in Figure 6 can be removed during a gap. Drift consistency (i.e. stability uncertainty) is estimated using residuals smoothed over different time scales, The residuals and smoothed residuals are plotted in Figure 7. The standard deviation of the varying slope of the smoothed residuals indicates the uncertainty in drift knowledge, which improves with smoothing duration (linked to overlap time) as shown in Table 3. The lower noise and better stability of the VIRGO make it the preferred instrument for filling a potential TIM data gap, although future improvements in the PREMOS degradation corrections may lower its stability uncertainties. None of these instruments can presently fill a potential TIM measurement gap while achieving the CDR stability requirement in Table 1.
Table 3: Stability Uncertainties Decrease With Smoothing Time
| Smoothing Time [yr] | ACR1M3 [ppm/yr] | VIRGO [ppm/yr] | PREMOS [ppm/yr] |
| 0.10 | 819 | 397 | 597 |
| 0.25 | 330 | 141 | 366 |
| 0.50 | 141 | 58 | 159 |
| 0.75 | 77 | 34 | 79 |
| 1.0 | 57 | 23 | 71 |
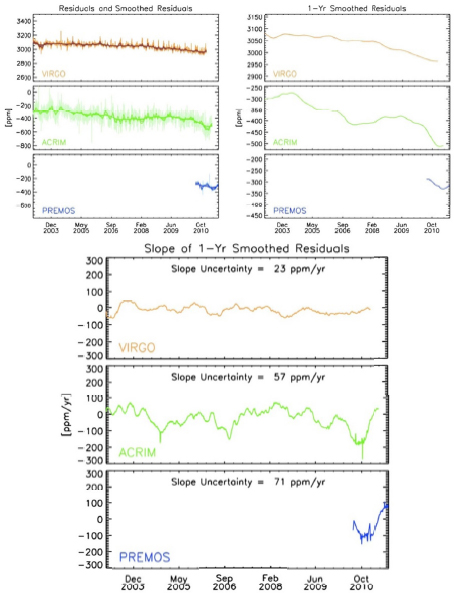
Figure 7: ACRIM. VIRGO. and PREMOS stability uncertainties are estimated by studying the variability of the residuals smoothed over various time scales expected for instrument overlap (upper left plot). The smoothed residuals from a 1-year running triangular weighting are shown individually in the upper right plot. The standard deviation of the slope of these smoothed residuals indicates the uncertainty in each instrument’s drift consistency (lower plot).
5.3. Example TIM Data Gap Filled by ACRIM3
Figure 8 provides an example of a TIM data gap filled by ACRIM3. TIM data prior to the gap are shown in red, with a fainter red curve indicating the “true” TSI values (i.e. in the absence of a gap). Another TIM instrument, offset from the first by one standard deviation (~360 ppm) of the absolute accuracies of both instruments, acquires data (shown in blue) after the 1.5 year gap. ACRIM3 data (green) are used to link the TIM data across this gap. Differences in slope between the TIM instruments and the ACRIM3 during the 1 year overlap periods prior to and after the gap are used to estimate and correct for the ACRIM3 drifts relative to the TIMs across the gap, when only the ACRIM3 provides any knowledge of solar variability. These slope corrections and the TIM-to-ACRIM3 offsets before and after the gap link the pre- and post-gap TIMs, correcting the TIM data after the gap downward (dark blue). In the example shown, this correction differs from the “true” TSI by 60 ppm, causing an erroneous drift in the TSI climate data record of 40 ppm/yr.
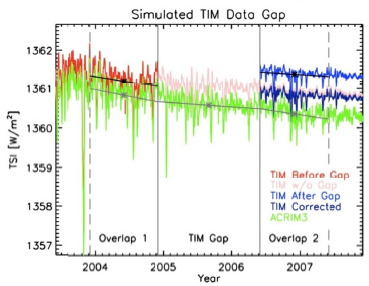
Figure 8: A simulated 1.5 year gap in TIM data filled by ACRIM3 demonstrates the effects of differences in instrument offsets and slopes leading to a 60 ppm error.
5.4. Summary of Accuracies, Stabilities, and Noise
Table 4: Instrument and Model Performance Estimates
| Instrument | Accuracy [ppm] | Stability [ppm/yr] | Noise [ppm] |
| SORCE/TIM | 350 | 10 | 4 |
| ACRIMSat/ACRIM3 | 1000 | 57 | 68 |
| SoHO/VIRGO | 2500 | 23 | 28 |
| PICARD/PREMOS | -350 [?] | 71 | <42 |
| JPSS/TIM | 100 | 10 | 10 |
| NRL Model | NA | 37 | 39 |
| SFO Model | NA | 7 | 18 |
6. SPANNING A GAP VIA EMPIRICAL SOLAR MODELS
Proxy-based solar models can estimate TSI in the absence of actual TSI measurements. Such models can then be used to spart a TIM data gap.
Empirical models utilize information about the primary solar sources of solar irradiance variability to calculate the relative changes that occur when these features are present on the Sun’s disk. The Naval Research Laboratory (NRL) TSI model, created by Dr. Lean, is constructed from two time series, the sunspot blocking function and the facular brightening function. The San Fernando Observatory (SFO) TSI model utilizes red and Ca K photometric sums from ground images representing sunspots and faculae, respectively, to create a similar model. Figure 9 shows results from these two models fitted to the TIM data, with both models estimating TSI based on their proxies prior to the SORCE launch. A SATIRE-based 4-component model fitted to TIM data was presented at the 2011 SORCE Science Meeting and shows even higher correlations (R=0.992). None of these proxy models allow for long-term changes in the base level of the quiet Sun, but they can track solar variability on the short-term time scales to span a TIM data gap. This paper focuses on the potential of the NRL model for spanning a gap in TIM measurements.
The bolometric sunspot blocking used in the NRL model is calculated from ground-based white-light images of the solar disk made by the Air Force Solar Optical Observatory Network (SOON) and available from the NOAA National Geophysical Data Center. A daily average sunspot blocking function is calculated as the mean of sunspot region observations made by multiple observatories spaced around the globe so as to sample different times of day. The facular brightening function is specified by the Mg II index of activity in the solar chromosphere. Being a relative measure of the ratio of the emission in the core of the Mg II 282 nm Fraunhofer line to that in the wings, this index achieves greater stability than an absolute flux measurement, Because it is obtained from UV observations, the Mg II index must be measured from space. For the duration of the SORCE mission, a Mg II index is available from the SORCE/SOLSTICE measurements. NOAA also produces a Mg II
index from its SBUV instruments, which must be cross calibrated to the SORCE measurements because of differing instrument spectral resolutions.
Figure 9 shows the NRL and SFO TSI models compared with the SORCE TIM measurements, and the separate sunspot and facular influences. The relative contribution of the sunspot blocking and facular brightening components is determined from multiple regression of the two time series with the TIM measurements. The coefficients from this regression also provide the conversion of the input time series to energy units.
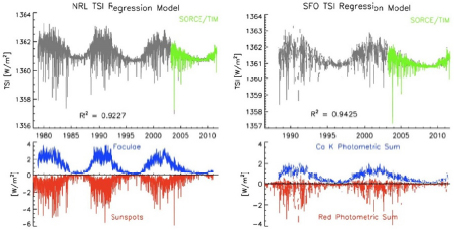
Figure 9: The NRL (left) and SFO (right) TSI models (grey) are matched to the TIM observations (green) by linearly regressing facular brightening (blue) and sunspot darkening (red) indices to the TSI measurements.
The correlation of the NRL TSI model with the TIM measurements is R=0.96; the model therefore explains a high fraction (92%) of the observed TSI variability. Differences occur between the measurements and the model on multiple time scales; in particular, the model has reduced short-term precision relative to TIM observations and small systematic drifts on longer time scales. Figure 6 shows the differences between the TIM measurements and the NRL TSI model for the duration of the SORCE mission. The magnitude of these differences and their temporal evolution with solar activity determines the utility of the NRL TSI model in filling a gap between the SORCE/TIM and JPSS/TIM, with the model’s stability and noise parameters summarized in Table 4.
By simulating TIM data gaps during both 2003-2004 (representative of solar maximum) and 2009-2010 (for solar minimum) and extrapolating the NRL model through each of these time periods then comparing to the actual TIM data, estimates of the model’s accuracy to span a data gap are acquired. Figure 10 shows the differences between the TIM measurements and the modeled TSI estimates averaged over subsequent 365-day and 80-day intervals starting in 2009. The top panel uses the best TSI model, which assumes the Mg II facular index is available, while the second plot shows a similar analysis but with a TSI model that instead
uses a proxy based on the F10.7 cm flux. Figure 11 shows a similar gap analysis for times prior to 2005 and representative of solar maximum. There is little difference between the simulated gaps during solar maximum and solar minimum, with both comparisons showing drifts with gap duration between the model and the TIM observations.
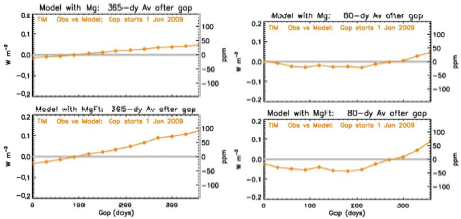
Figure 10: One-year (left) and 80-day (right) running mean differences between model and TIM measurements for a data gap starting in 2009 (representative of solar minimum) using Mg II (top) and F10.7 (bottom) facular proxies.
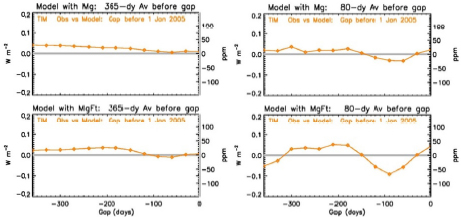
Figure 11: One-year (left) and 80-day (right) running mean differences between model and TIM measurements for a data gap prior to 2005 (representative of solar maximum) using Mg II (top) and F10.7 (bottom) facular proxies.
For a gap of one year (i.e. 365 days in the plots) the values of the best-case TSI model for the subsequent 365-day averages differ from the “true” TSI (i.e. as measured directly by the TIM) by almost 0.05 Wm-2 (37 ppm), so using the NRL TSI
model to span a TIM measurement gap introduces a 37 ppm/yr drift uncertainty to the record. If the Mg II index is not available, forcing the use of a poorer facular index in the model, then the added imprecision can be up to 88 ppm/yr. This should be considered a worst case scenario since a variety of other solar data and models would be investigated in the absence of SORCE Mg II data to better substantiate the facular component than the F10.7 cm flux alone.
In either case, proxy models may achieve comparable gap filling capabilities to the alternate TSI instruments for these best-case simulated gaps, but cannot achieve the CDR stability requirement in Table 1.
7. SUMMARY OF UNCERTAINTIES VIA DIFFERENT GAP FILLING METHODS
The uncertainties in spanning a TIM data gap of different durations and different overlap periods are estimated from the derived noise and stability estimates summarized in Table 4. Using the graphical representation of Figure 2, these are plotted in Figure 12 for the ACRIM3, VIRGO, PREMOS, and NRL model.
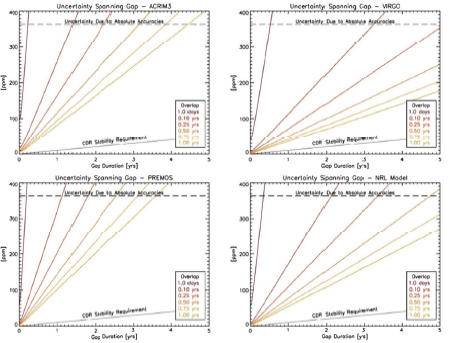
Figure 12: Estimated uncertainties as a function of gap and overlap durations are estimated for the ACRIM3 (top left), VIRGO (top right), PREMOS (lower left), and NRL model (lower right). All show similar trends: longer gap durations and shorter overlap times contribute to greater uncertainties. The VIRGO currently provides the best means of filling a TIM data gap, although no instrument or model used to fill a gap comes close to achieving the TSI CDR stability requirement (grey line).
The expected induced errors for a TIM data gap of 1.5 years with 1 year overlaps prior and following are summarized in Table 5 for each instrument or model. All exceed the JPSS TSI CDR stability requirement.
Table 5: Errors from 1.5 Year TIM Data Gap with 1 Year Overlap Durations
| Instrument | ACRIM | VIRGO | PREMOS | NRL Model |
| Error [ppm] | 123 | 53 | 152 | 81 |
The ACRIM3, VIRGO, PREMOS, and solar models are evaluated for noise and stability and for their resulting capabilities in filling a potential gap in TIM measurements between the SORCE and JPSS missions. Uncertainties introduced into the TSI climate data record are estimated as a function of gap duration and TIM overlap time for each.
The VIRGO currently provides the best method for filling a TIM data gap due to its stability and relatively low noise, both critical for spanning a TIM data gap. Nevertheless, a gap analysis with this instrument indicates the JPSS CDR stability requirement would be exceeded by 350%. Solar models are the next best option for spanning a gap of short duration, with ACRIM3 and PREMOS providing the least capability due to their higher noise and/or lower stabilities. No instrument or model achieves the JPSS TSI CDR requirements in the undesirable event of a TIM data gap.
The Solar Climate Data Record:
Greg Kopp
Laboratory for Atmospheric and Space Physics, University of Colorado, Boulder, CO.
Judith Lean
Space Science Division, Naval Research Laboratory, Washington DC
Prepared for Dr. Jeffrey L. Privette
Chief (Acting), Remote Sensing and Applications Division (RSAD)
NOAA’s National Climatic Data Center (NCDC)
151 Patton Avenue, Asheville, NC 28801-5001 Tel. 828.271.4331
31 Jan. 2013
Table of Contents
1.1. Need for the Solar Climate Data Record
1.2. Requirements for TSI Climate Data Record
1.3. Existing TSI Observational Record
1.5. Study of Uncertainties Spanning Potential SORCE/TIM to JPSS/TIM Gap
2. Status of Present TSI Measurements
2.4. Comparisons of Measurements from Current TSI Instruments
2.4.3. Summary of Accuracies, Stabilities, and Noise
3. The TSI Calibration Transfer Experiment (TCTE) Motivation and Need
3.1. TCTE Mission Background and Approach
3.1.1. Comprehensive Success Criteria
3.1.2. Minimum Success Criteria
3.2. Strengths of TCTE Approach
3.3. Weaknesses of TCTE Program
4. Extending the Solar Data Record from SORCE to TSIS Using TCTE
4.1. Background on Gap Filling
4.2. Baseline (no TCTE) SORCE-to-TSIS Gap
4.3. TCTE Measurement Cadences and Effects on Uncertainties
4.4. TCTE Does Not Overlap with Either SORCE or TSIS
4.5. TCTE Overlaps with SORCE Only
4.6. TCTE Overlaps with SORCE and TSIS
5. Extending the Solar Data Record from SORCE to TSIS Using Models
5.1. Formulation of TSI Variability Regression Models
5.2. TSI Observations for Model Construction
5.3. Sunspot Darkening Indices
5.4. Facular Brightening Indices
5.5. Models of TSI Variability
5.6. Scenarios for Model Comparisons with TCTE/TIM
1.1. Need for the Solar Climate Data Record
The need for the solar climate data record is well documented in NRC, NASA, and NOAA reports. In the 1980’s NASA designated solar irradiance as one of 21 key Earth Science observables needed to provide the scientific foundation of the Earth Observing System (EOS) envisioned in Earth System Science: A Closer View (1988). In the 1990’s the NPOESS Integrated Operations Requirement Document (IORD) identified solar irradiance as an operational Climate Data Record and specified the requirements for the Total Solar Irradiance Instrument (TSIS); however, NPOESS’s descope and Nunn-McCurdy recertification in 2006 eliminated the TSIS. NRC’s Earth Science and Applications from Space; National Imperatives for the Next Decade and Beyond (2007) recommended that “NOAA ensure the continuity of measurements of Earth’s Radiation Budget (ERB) and total solar irradiance (TSI).” A subsequent NRC report, Options to Ensure the Climate Record from the NPOESS and GOES-R Spacecraft: A Workshop (2007), addressed the specific impacts of the descoped NPOESS on climate records and identified as the highest priority “Preservation of long-term climate records…including multi-decadal records of total solar irradiance.” The TSIS was subsequently manifested under the JPSS Free Flyer program with expected launch no earlier than mid-2016.
1.2. Requirements for TSI Climate Data Record
The TSIS Climate Data Record (CDR) requirements are driven by the need to detect possible long-term solar variability critical for climate studies, and are summarized for the TSIS Total Irradiance Monitor (TIM) in Table 1.
Table 1: CDR Requirements Established for the TSIS/TIM
| Parameter | CDR Requirement | |
| Absolute Accuracy | 0.01% (100 ppm, 0.14 Wm-2) | |
| Stability | 0.001%/yr (10 ppm/yr, 0.014 Wm-2yr-1) | |
| Noise | 0.001% (10 ppm, 0.014 Wm-2) | |
1.3. Existing TSI Observational Record
Multi-decadal solar irradiance records are obtained by cross calibrating space-based measurements made by individual solar radiometers since 1978. Figure 1 compares the PMOD and ACRIM composite records, constructed independently by combining respectively the SoHO/VlRGO (Dec. 1995 to present) and the SMM/ACRIM1 (Feb, 1980 to 1989), UARS/ACRIM2 (Sept. 1991 to 2001), and ACRIMSat/ACRIM3 (Dec. 1999 to present) datasets with select other TSI measurements. Evident between these two primary TSI composites are drifts ranging from -0.043 Wm-2 per year (in the 1980’s) to +0,172 Wm-2 per year (in the 1990’s). Comparisons of each composite record with the SORCE/TIM, as shown in Figure 2 and Table 2, indicate that relative to the TIM, the PMOD is drifting at -0.0242 Wm-2 per year and ACRIM at -0.0235 Wm-2 both of which exceed the TIM’s CDR-level of stability of 10 ppm per year (0.014 Wm-2 per year) by almost a factor of two. Thus, of the currently operating TSI
instruments, only the TIM has the needed accuracy and stability to meet the TSIS requirements.
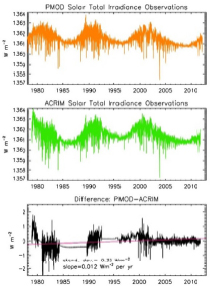
Figure 1: Compared are the PMOD-based TSI composite (upper panel) and ACRIM-based TSI composite (middle panel). Over the 34-year duration, differences between these two primary multi-decadal TSI records (lower panel) show a long-term drift of 0.012 Wm-2 per year, with significantly larger short-term drifts for example, -0.043 Wm-2 per year in the 3-year period from 1981 to 1983 (inclusive) and +0.172 Wm-2 per year in the 2-year period from 1990 to 1991 (inclusive). These drifts exceed the needed solar CDR stability.
Table 2: Statistical Comparisons of SORCE/TIM with SoHO/VIRGO and ACRIMSat/ACRIM3 in the period 2003 to 2012.
| Instrument | Mean Value Wm-2 | Standard Deviation of daily means Wm-2 | Slope of daily means Wm-2yr-1 | Correlation with TIM | Standard Deviation of differences from TIM Wm-2 | Slope of differences from TIM Wm-2yr-1 |
| TIM | 1361.07 | 0.370 | +0.0191 | 1.0 | 0 | 0 |
| VIRGO | 1365.50 | 0.350 | -0.0226 | 0.9753 | 0.0777 | -0.0242 |
| ACRIM3 | 1360.54 | 0.362 | -0.0389 | 0.9351 | 0.1280 | -0.0235 |
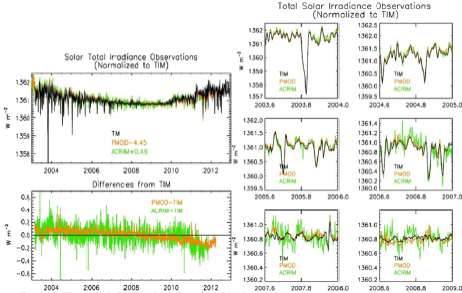
Figure 2: The PMOD (VIRGO-based) and ACRIM-based TSI composites are offset to the mean of and compared with the SORCE/TIM observations in the upper left panel. Their differences from TIM are shown in the lower left panel for the duration of the SORCE mission. Details of select short-term irradiance variations are shown at different epochs of the solar cycle in the panels on the right.
To mitigate the loss of stable TSI measurements in the expected gap between the 5-yr SORCE mission launched in 2003 and the subsequent NPOESS/TSIS, NASA planned and developed the Glory mission, on which a next-generation TIM would provide the needed measurements.
The failure of the Glory launch in 2011 put the extant TSI record severely at risk.
The SORCE spacecraft on which the SORCE/TIM currently operates has been in orbit for ten years, well beyond its design lifetime, and is suffering severe battery problems that have recently started to limit the TIM calibration observations and degrade its thermal stability. Both SoHO/VIRGO and ACRlMSat/ACRlM3 have been operating in space even longer than SORCE (17 and 13 years, respectively). In addition to lacking the capability to meet the long term stability requirements for the solar climate data record, both are susceptible to budgetary and logistical limitations. The recently launched PICARD mission, which carries the PREMOS and SOVAP TSI instruments, will terminate in February 2013.
Launch of the TCTE/TIM is planned for mid-to late-2013 to provide crucial overlap of TSI measurements with the SORCE/TIM and reduce uncertainties in the TSI record prior to launch of the JPSS/TSIS.
1.5. Study of Uncertainties Spanning Potential SORCE/TIM to JPSS/TIM Gap
In an earlier report, delivered to NOAA in September 2011 and prior to plans for TCTE to help bridge the gap, uncertainties in the TSI climate data record were estimated for assumed scenarios of a measurement gap between the TIM instrument currently on the SORCE mission and that built for the upcoming JPSS/TSIS with an intended 2016 launch. Uncertainties were estimated as a function of gap duration and TIM overlap time for each of the ACRIM3, VIRGO, and PREMOS databases, and also using solar models. That “Study A” report determined that ESA’s SoHO/VlRGO instrument provided the best means of filling a TIM data gap, with solar models offering limited capability for short duration gaps. Using VIRGO to fill a 1.5-year data gap (with 1 year overlap on both ends) was estimated to introduce an error of 53 ppm to the solar climate data record, far exceeding the CDR stability requirements. Subsequent delays in the expected launch of the TSIS have since extended that expected gap duration.
No gap-filling method was found to meet the JPSS TSI climate data record requirements, since no other instrument or model has demonstrated the stability or low noise of the TIM instrument.
2. Status of Present TSI Measurements
Spaceborne TSI measurements began in 1978 and have continued uninterrupted since (see Figure 3). Measurement overlap helps enable cross calibrations of the independent databases that have different absolute calibrations. The primary cause of offsets among the different TSI time series is uncorrected internal instrument scatter, which causes erroneously high readings. Since the needed levels of absolute accuracy (Table 1) have not yet been demonstrated on-orbit, this 34-year long solar climate data record relies on continuity from stable instruments.
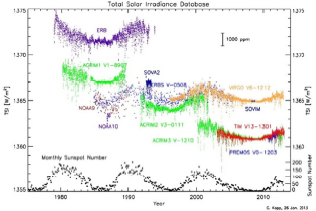
Figure 3: The spaceborne TSI record has been uninterrupted since 1978, helping account for offsets between different instruments due to calibration errors.
The Solar Radiation and Climate Experiment (SORCE) was launched in Jan. 2003 with a Total Irradiance Monitor (TIM) to continue the TSI record with improved accuracy and stability over prior instruments. The TIM has been successful in both regards, and has established a new, lower value of TSI due to improved calibrations and instrument design (Kopp and Lean, 2011). SORCE is currently ten years old and is having battery issues that limit the TIM’s measurements and will at some point likely cause an abrupt end to the mission. The SORCE/TIM measurements were intended to be continued, with overlap, via the Glory mission’s TIM, which was intended to continue the solar irradiance CDR until the launch of the TIM on JPSS/TSIS. The Glory launch failure in 2011 puts the quality of the TSI record at risk due to a likely gap in the TIM data, since no other instrument currently achieves the TSISCDR requirements.
The CNES PICARD mission launched in June 2010 carrying two TSI instruments, the PREMOS and the SOVAP. The PREMOS, the first flight instrument to have successfully transferred state-of-the-art SI-traceable TSI Radiometer Facility (TRF) irradiance calibrations to orbit, shows good agreement with the absolute value of the SORCE/TIM. This instrument has now acquired 2.5 years of measurements, which are evaluated in §2.4. No data have been made publicly available from the SOVAP, so its quality is not evaluated in this report.
The PICARD is intended to be decommissioned in Jan. 2013, so will likely not provide continued TSI measurements beyond those of the SORCE.
The SoHO/VlRGO and the ACRIMSat/ACRIM3 both currently provide TSI measurements. While neither achieves the CDR requirements in Table 1, they may provide some benefit for spanning a short-term TIM data gap. Study A showed that the VIRGO provided the best means of spanning a gap, but subsequent updates to the ACRIM3 data have reduced the signal noise that limited its usefulness at the time of that earlier report. The latest data from both instruments are reevaluated in §2.4 of this report. As with SORCE, VIRGO and ACRIM3 are both operating well beyond their intended mission lifetimes, so their dependability, particularly in the timeframe of the TSIS launch, is questionable.
2.4. Comparisons of Measurements from Current TSI Instruments
The instrument data records and models utilized for this report are listed in Table 3. The instrument daily TSI time series are shown in Figure 4.
Table 3: TSI Data Records Analyzed
| Instrument/Model | Data Set & Version | Time Range |
| SORCE/TIM | V.13 | 25 Feb. 2003 - 19 Jan. 2013 |
| ACRIMSat/ACRIM3 | daya2sddeg_ts4_Nov_2012_hdr | 5 Apr, 2000 - 21 Oct, 2012 |
| SoHO/VIRGO | virgo_tsi_d_v6_002_1212 | 7 Feb. 1996 - 4 Dec. 2012 |
| PICARD/PREMOS | 27 July 2010 - 31 Mar, 2012 | |
| NRL Model | TIM_models_14Jan13 | 1 Jan. 2003 - 30 Oct. 2012 |
| SFO Mode | l’SFO Indices’(13 Dec. 2012) | 28 Apr. 1988 - 12 Dec, 2012 |
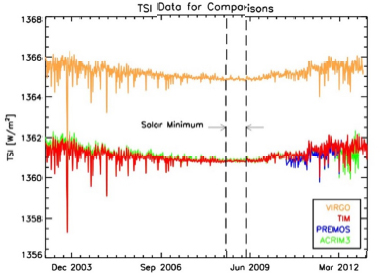
Figure 4: Time series of TSI data from TIM, ACRIM3, VIRGO, and PREMOS since the 2003 SORCE launch. These are the instrument data used for this report’s analyses.
The solar minimum period indicated in Figure 4 allows estimates of instrument noise, as the Sun was relatively quiet during this time. This time range is expanded for the TIM, ACRIM3, and VIRGO in Figure 5. Common mode variations between instruments likely indicate true solar variations; differences are instrument artifacts. Two prominent such artifacts are: two positive spikes in the VIRGO data, which coincide with SoHO spacecraft Keyhole pointing maneuvers; and a varying periodicity (see also Figure 6) in the ACRIM3 data, the cause of which is currently unknown but suspected to be due to uncorrected instrument thermal variations.
Figure 5: Instrument noise is estimated during low solar activity at solar minimum. Actual solar variability likely accounts for only 16 ppm of the computed standard deviations.
The standard deviations of the daily TSI values from each instrument, being the quadrature sum of the instrument noise and the actual solar variability, are listed with each plot in Figure The TIM’s noise is lower than that of any other flight instrument because it is the only instrument utilizing phase sensitive detection in either on-orbit thermal control or ground data processing. Independent calibration measurements give 4 ppm as the TIM instrument noise, implying that the solar activity during this solar minimum time range accounts for nearly all of its plotted 17 ppm variability. The larger variations in the ACRIM3 and VIRGO data during this time period indicate that their solar minimum measurements are dominated by instrument noise rather than solar variability. Estimates of the noise of each instrument are given in Table 5. Higher noise values necessitate longer measurement overlap periods to reduce gap uncertainties.
The PREMOS data, shown in Figure 6, began in mid-2010 and thus cannot be compared during solar minimum. This instrument agrees within uncertainties with the SORCE/TIM on an absolute scale. Relative variations, mainly due to uncorrected degradation (i.e. instrument stability), exceed the needed CDR stability. The PICARD mission is due to be decommissioned in Feb. 2013, so it is very unlikely that the PREMOS will overlap with TCTE or TSIS.
This study’s stability uncertainty estimates for the ACRIM3, VIRGO, and PREMOS come from comparisons of the instrument data records relative to those of the SORCE/TIM and from changes between each instrument’s successive data versions.
Relative comparisons of the TSI instrument data and the NRL empirical solar model (see §5.4) to the SORCE/TIM are shown in Figure 6. The drift rates, indicated by the slopes of linear fits to the differences, exemplify the lack of long-term stability of the different TSI instrument records. Filling a TIM measurement gap with any of these other instrument data could induce erroneous trends in the 34-year TSI record.
Figure 6: Relative comparisons of the ACRIM3 and VIRGO to TIM (left-hand plots) show measurement offsets and relative drifts that - even if corrected for the linear portion - will Introduce uncertainties in spanning a gap in TIM measurements. The empirical NRL solar TSI model shows better trend agreement with the TIM data (bottom left). PREMOS data show good absolute agreement with the SORCE/TIM TSI values, but are drifting steeply upward relative to the TIM (right-hand plots), whereas the VIRGO and ACRIM3 show downward drifts of different rates.
If constant, the linear portion of the drifts in Figure 6 could be removed to help span a gap; however, even removing a linear drift leaves residual variations that would induce errors. Drift inconsistencies (i.e. instrument or model stability uncertainties) are estimated using such residuals smoothed over different time scales. The residuals and smoothed residuals are plotted in Figure 8 for comparisons of the SORCE/TIM to the VIRGO, ACRIM3, and PREMOS instruments as well as to the NRL and SFO models (shown in Figure 12). The standard deviation of the varying slope of each smoothed residual indicates an instrument’s or model’s stability uncertainty, These uncertainties improve with smoothing duration as shown in Table 4 and in Figure 7. These essentially give the uncertainties induced across a TIM data gap spanned by the listed instruments and models for different smoothing times. (Each
smoothing time necessitates even longer measurement overlap duration with both a TIM and another instrument observing in order to estimate the trend differences.)
Table 4: Stability Uncertainties Decrease With Smoothing Time
| Smoothing Time [yr] | ACRIM3 [ppm/yr] | VIRGO [ppm/yr] | PREMOS [ppm/yr] | NRL Model [ppm/yr] | SFO Model [ppm/yr] |
| 0.10 | 711 | 421 | 508 | 623 | 1701 |
| 0.25 | 273 | 150 | 273 | 187 | 522 |
| 0.50 | 132 | 66 | 174 | 89 | 237 |
| 0.75 | 89 | 41 | 114 | 61 | 127 |
| 1.0 | 71 | 29 | 79 | 48 | 88 |
The comparative stability of the VIRGO and its relatively lower noise (both of which are summarized in Table 5) make it the preferred instrument for filling a potential TIM data gap. The NRL solar proxy model is the next best choice for filling this gap based on its stability; the SFO model’s stability uncertainties are higher because it has data points on only about half the days due to limited ground-based solar sampling. As Table 4 indicates, none of these instruments or models can fill a potential TIM measurement gap while achieving the CDR stability requirement in Table 1.
Figure 7: Stability uncertainties between two instruments or models decrease with longer smoothing durations, which require overlap between the two of at least this duration. These uncertainties provide estimates of the trending potentially induced in the TSI data record if using the shown instruments or models to span a potential SORCE-to-TSIS TIM data gap.
In addition to differences between data records indicating stability uncertainties, changes between successive instrument data versions as updated corrections are applied by the instrument teams indicate a likely lower bound to an instrument’s stability uncertainty. For example, the latest version of the ACRIM3 data differs in slope from the prior version by 8 ppm/yr, indicating that the ACRIM instrument team feels the prior data were incorrect and needed adjusting by this amount, Differences between the most recent VIRGO data versions show similarly large changes.
Figure 8: Stability uncertainties are estimated for the ACRIM, VIRGO, and PREMOS instrument and the NRL and SFO models by studying the variability of the residuals relative to the TIM TSI data smoothed over various time scales expected for instrument overlap (upper left plot). The smoothed residuals from a 1-year running triangular weighting are shown separately in the upper right plot The variation in the slope of these smoothed residuals Indicates the uncertainty in each instrument’s stability uncertainty (lower plot).
2.4.3. Summary of Accuracies Stabilities, and Noise
Table 5: Instrument and Model Performance Estimates
| Instrument | Stated Accuracy [ppm] | Stability [ppm/yr] | Noise [ppm] |
| SORCE/TIM | 350 | 10 | 4 |
| ACRIMSat/ACRIM3 | 1000 | 71 | 34 |
| SoHO/VIRGO | 2500 | 29 | 28 |
| PICARD/PREMOS | 300 | 79 | <52 |
| JPSS/TCTE/TIM | 350 | 10 | 50* |
| JPSS/TSIS/TIM | 100 | 10 | 10 |
| NRL Model | -NA- | 48 | 38 |
| SFO Model | -NA- | 88 | 19 |
* Effective noise due to orbital sampling at times of high solar activity (see §4.3). Instrument noise is less than 10 ppm.
The NOAA JPSS/TSIS utilizes an advanced TIM instrument to achieve the CDR requirements in Table 1. Baselined as part of the JPSS Free Flyer program, this instrument is currently intended for launch no earlier than 2016 due to delays in spacecraft selection, making overlap with TCTE/TIM on the 1-year (18 month goal) duration STP-Sat3 mission unlikely. Any extended duration of the TCTE or earlier launch of the JPSS/TSIS will greatly benefit the TSI data record by reducing the TCTE- to-TSIS gap (see §4).
3. The TSI Calibration Transfer Experiment (TCTE) Motivation and Need
3.1. TCTE Mission Background and Approach
The Glory launch failure left a gap between the planned SORCE and TSIS TIM measurements intended to achieve the TSI CDR requirements, Restructuring of the JPSS program has resulted in delays selecting a spacecraft to accommodate TSIS, which exacerbated this problem.
TCTE, the TSI Calibration Transfer Experiment, is JPSS’s approach to mitigating risk of a TSJ measurement gap in a timely manner This mission utilizes the ground-based SORCE/TIM Witness instrument, which was built alongside the SORCE/TIM Flight unit and has been used for inter-comparisons at NIST and at the 2010 International Pyrheliometer Comparison (IPC-XI). The already underway Air Force program STP-Sat3 with planned August 2013 launch was identified to carry the TIM as part of its payload. Accommodation modifications to the SORCE/TIM Witness unit (now called the TCTE/TIM) and updated calibrations have been completed, and the instrument has been integrated on the STP-Sat3, which is currently finishing environmental testing.
The STP-Sat3 payloads are primarily nadir-viewing, so solar measurements with the TCTE are made only intermittently. This mission is not intended to directly achieve the measurement requirements of Table 1, but to reduce the severity of a long-duration measurement gap between the SORCE and TSIS TIMs, As such, the TCTE must meet the stability requirement given in Table 1 and have measurement
overlap with both the SORCE and TSIS in order to transfer the improved TSIS/TIM’s absolute calibration between the two. Although the TCTE should meet or exceed the SORCE/TIM absolute accuracy given in Table 5, its primary benefit is in providing stable knowledge of solar irradiance fluctuations between the two surrounding TIM instruments on solar-dedicated missions, The TCTE success criteria are described below.
3.1.1. Comprehensive Success Criteria
Comprehensive Success requires 6 months of overlap with both SORCE and TSIS. During the overlap periods with these other missions a measurement is acquired at least every 2 days with weekly measurements during the intervening period. The TCTE must meet its stability requirement of 10 ppm/year and its accuracy requirement of 350 ppm. The stability requirement helps propagate the TSI record forward with needed long-term solar trend detection capability, while the accuracy requirement reduces offsets between the SORCE and TSIS TIMs should overlap not be achieved.
3.1.2. Minimum Success Criteria
1. Assuming overlap with SORCE: Minimum Success is 2 months of overlap with 1 measurement every 2 days followed by 1 year of data at 1 measurement per week, sufficient to improve the record over that provided by other extant means.
2. Assuming no overlap with SORCE: Minimum Success is a 3-year duration of daily measurements. This will have lower uncertainty than any other measurement or model, justifying filling the TIM gaps on either side of TCTE.
In either case, the TCTE must meet its stability requirement of 10 ppm/year.
3.2. Strengths of TCTE Approach
The TCTE benefits from the following:
• It utilizes a SORCE-like TIM originally built alongside the SORCE Flight instrument, and should have comparable well-characterized performance;
• Being already built, the instrument is available for an imminent launch to increase likelihood of acquiring overlapping measurements with the SORCE/TIM;
• It benefits from improved ground calibrations not available at the time of the SORCE launch - particularly superior electrical power calibrations and irradiance measurements in the TSI Radiometer Facility- and has undergone testing at NIST and comparisons with the World Radiometric Reference, so helps transfer those SI-traceable reference measurements to space;
• Updates to the instrument for accommodation on the selected spacecraft were completed on schedule, and the mission is proceeding as intended, ready for a mid- to late-2013 launch.
3.3. Weaknesses of TCTE Program
The TCTE is intended to reduce the severity of a measurement gap between the SORCE and the TSIS TIMs, but is not a replacement for either.
• The TCTE acquires only intermittent observations rather than the continual measurements of the SORCE and TSIS TIMs. The minimum TCTE observations given in §3.1 can be as infrequent as one orbit per week. While helpful for discerning long-term solar changes from effects due to instrument offsets (assuming overlaps with both SORCE and TSIS are achieved), these observations sub-sample solar variability. This observational aliasing precludes the low noise measurements needed to meet CDR requirements (see §4.3).
• The infrequent TCTE observations do not provide the daily record of TSIS-required fidelity needed for improving proxy-based solar models such as those described in §5.
• Intended as a 1-year mission with an 18-month goal largely limited by the spacecraft bus, the STP-Sat3 duration is unlikely to provide overlap with the TSIS/TIM intended for launch no earlier than mid-2016. Thus TCTE postpones, but likely does not prevent, a pre-TSIS TSI measurement gap.
• Because of a classified instrument on the STP-Sat3, all telemetered data from the spacecraft are initially classified. The Air Force currently lacks any means of declassifying the TCTE data. While intended for public release eventually, these data will likely remain classified until well after launch, precluding broad community assessments of the data quality and approval of operations scenarios initially. (The TIM Science and Operations Teams are acquiring security clearances to assess instrument state of health and acquisition of intended data for this planned initial mode of operation.)
4. Extending the Solar Data Record from SORCE to TSIS Using TCTE
4.1. Background on Gap Filling
We outline in §4.1 the procedure for estimating the uncertainties induced in a data record when filling a measurement gap between two instruments by other methods. We then apply this procedure in the remainder of §4 to estimate quantitative uncertainties induced in the TSI record by spanning the expected SORCE-to-TSIS TIM measurement gap under different scenarios.
For a very long-duration gap, absolute accuracy of the two bracketing instruments may be superior to continual measurements, For example, a long-term change in TSI of 0.1% over 100 years would be a 1-sigma detection for continual measurements having 10 ppm/year stability uncertainty (using the CDR measurement requirements in Table 1), but a 7-sigma detection for two 100-ppm accuracy instruments separated by those 100 years. Sufficient absolute accuracy reduces the reliance on measurement continuity and instrument stability for long-term trenc detection.
Over short time spars however, measurement continuity from stable instruments is generally more capable of trend detection. A change of 0.01% over 5 years would be a 0.7-sigma detection for two 100-ppm accuracy instruments separated by those 5 years, but a 2-sigma detection for a single 10 ppm/yr stability instrument operating over that duration.
Since the SORCE-to-TSIS gap is expected to be about 4 years in duration rather thar. decades, we focus in this report on maintaining the TSI record via measurement stability as opposed to absolute accuracy.
A data record provided by a single instrument has stability uncertainties determined completely by that instrument, Transitioning measurements from one instrument (or model) to another induces additional uncertainties which depend on the duration of an overlap period where both are operating; longer overlap durations reduce these uncertainties by providing more measurements, which lowers offset uncertainties due to noise (scaling as time-½) and improves relative stability knowledge of the two (as quantitatively shown in Table 4 and Figure 7).
For the analysis here, the net uncertainty induced in the TSI record between two instruments, A and B, separated by a gap of length tgap during which data are provided by a third instrument or model C having some number of overlapping measurements Noverlap (which scales with overlap duration) with A and B is thus the quadrature sum of the uncertainty determining the instrument offsets.
![]()
and the stability uncertainty of the intervening data from C during the gap (using the appropriate stability uncertainty for the actual overlap duration, as in Table 4),
![]()
4.2. Baseline (no TCTE) SORCE-to-TSIS Gap
Study A focused on methods of spanning the expected measurement gap between. the stable SORCE/TIM TSI measurements and those expected from the TSIS/TIM. That study reviewed approaches available at the time, including using VIRGO, ACRIM3, and PREMOS measurements as well as empirical solar TSI models based on proxies from space- and ground-based observatories. The conclusion was that VIRGO provided the best means of spanning a short duration (1.5 year) gap due to its stability and noise, while models provided the next best means, but neither came close to achieving the desired stability levels.
Since that time:
• The ACRIM3 data processing has been updated to correct a previous thermal artifact causing high noise (see §2.3),
• CNES decided to turn off the PICARD mission, meaning PREMOS TSI data will not be available in the post-SORCE era (§2.2).
• JPSS/TSIS spacecraft procurement delays have postponed its launch.
• JPSS’s TCTE was initiated to acquire additional measurements in the SORCE-to-TSIS time frame.
• SORCE’s battery has degraded further such that operation through the end of 2013 may be optimistic.
These effects lengthen the expected SORCE-to-TSIS gap. For a realistic gap from the end of 2013 to the end of 2016, TSI values would best be provided by VIRGO data based on the stability and noise results in Table 5. Using the methodology of §4.1, the net uncertainty induced in the TSI record over the 4-year period between the present (early 2013) and the TSIS launch (end of 2016) is 97 ppm, or 24 ppm/yr mainly due to the 3-year TIM measurement gap from late 2013 to late 2016 spanned by VIRGO having 1-year overlaps with both SORCE and TSIS. The next most stable gap filling source, the NRL solar model, would induce a net uncertainty of 154 ppm.
4.3. TCTE Measurement Codences and Effects on Uncertainties
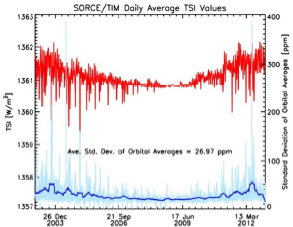
Figure 9: The reported Level 3 SORCE/TIM daily TSI values are averages of high-cadence (50 second) solar irradiance measurements acquired fairly uniformly throughout each day and therefore representative of the day’s TSI. The TCTE will acquire only a single orbit of measurements each day. The standard deviation of the orbital averages from SORCE/TIM data (light blue) show variability through the solar cycle in matching the true daily average (red). The mean of these orbital average standard deviations is about 27 ppm, but can be much higher during times of solar activity. Thus the TCTE’s sub-sampling will alias solar variability into its results, precluding achieving the desired CDR’s low-noise measurements.
The TCTE acquires TSI measurements during one orbit per day at most. This subsamples actual solar variability, since a single orbit is not necessarily representative of the daily average TSI value. The standard deviations of orbital averaged TSI measurements during each day of SORCE/TIM data are shown in Figure 9, and indicate agreement only to 27 ppm, with greater deviations during times of higher solar activity. This subsampling limits the expected agreement of TCTE data to other instruments or models over short time durations by effectively increasing the “noise” of the TCTE data to ~50 ppm at times of high solar activity,
such as when the STP-Sat3 is expected to launch; however, the agreement over long durations, where multiple orbital values can be averaged, will be much better.
The TCTE minimum observing cadence is weekly, which complicates comparison. timing with other instruments or models and requires longer overlap duration times to acquire the amount of overlapping data points needed to reduce uncertainties.
4.4. TCTE Does Not Overlap with Either SORCE or TSIS
STP-Sat3 carrying TCTE is expected to launch in Aug. 2013 as a 1-year mission with an 18-month goal. If SORCE were to fail imminently and STP-Sat3 achieves its 1-year duration requirement, there will be a 6-month gap between the SORCE and TCTE TIMs followed by 1 year of stable TCTE measurements and then a 2.5-year gap between TCTE and TSIS.
VIRGO again provides the most stable and lowest noise means of filling the gaps, assuming it remains operational to provide 1 year of overlap after the TSIS launch presumed here at the end of 2016. The low - in this case, weekly - TCTE observing cadence slightly increases the noise connecting the TCTE record to that of VIRGO, Spanning both the SORCE-to-TCTE and the TCTE-toTSIS gaps with VIRGO induces a net uncertainty to the TSI record of 98 ppm (24 ppm/yr), with 15 ppm attributable to the SORCE-to-TCTE gap, 10 ppm to the TCTE stability during one year of operation, and 73 ppm to the 2.5-year TCTE-to-TSIS gap.
This case is no improvement over that in §4.2 because it assumes the imminent loss of the stable SORCE/TIM measurements, whereas in §4.2 the SORCE/TIM continued until the end of 2013. Repeating the analysis of §4.2 for an imminent failure of the SORCE mission gives a net induced uncertainty of 116 ppm (29 ppm/yr) for better comparison with the result here.
Lacking overlap with both SORCE and TSIS and having only a 1-year duration, TCTE provides little improvement for spanning the SORCE-to-TSIS gap (compare to §4.2).
4.5. TCTE Overlaps with SORCE Only
If SORCE lasts to provide a minimum of 2 months of overlap with TCTE, during which time TCTE acquires its minimum of one orbit of measurements every two days, the continuity of the TSI record in the near future is greatly improved. The SORCE/TIM’s low measurement noise allows nearly cotemporaneous high cadence data comparisons between it and the TCTE’s orbital measurements, reducing offset uncertainties due to the TCTE’s subsampling of solar variability and improving connection of the two data records.
VIRGO is still chosen to fill the TCTE-to-TSIS gap of 2.5 years. In this scenario, the net uncertainty induced in the TSI record is 88 ppm (22 ppm/yr), with 5 ppm from the 6-month SORCE-to-TCTE period, 10 ppm for the TCTE’s 1-year duration of measurements, and 73 ppm for the 2.5-year TCTE-to-TSIS gap.
This scenario is similarly limited by the TCTE-to-TSIS gap filled by VIRGO, as in §4.4; so while TCTE provides very little improvement over a SORCE- to - TSIS gap, it prolongs
the stability of the TSI record until the end of the TCTE mission, which may allow time to implement alternate measurement approaches.
4.6. TCTE Overlaps with SORCE and TSIS
If SORCE lasts to provide 2 months of overlap with the TCTE and the TCTE lasts to provide 2 months of overlap with the subsequent TSIS/TIM, assumed here to start in late 2016, expected uncertainties induced in the TSI record over these four years from the three stable and overlapping instruments are 40 ppm (10 ppm/yr), with 5 ppm from the 6-month SORCE-to-TCTE period, and 35 ppm for the following continuous TCTE operations.
If the STP-Sat3 - despite its 1-year lifetime requirement - lasts 4 years and provides 2 months of overlap with the TSIS/TIM, the stability of the TSI record is maintained with CDR levels of stability.
5. Extending the Solar Data Record from SORCE to TSIS Using Models
The record of TSI that SORCE/TIM established beginning in 2003 has an estimated absolute accuracy uncertainty of 350 ppm and a stability uncertainty of 10 ppm per year. These capabilities exceed those of other ongoing TSI measurements by VIRGO, ACRIM3, and PREMOS; Figure 6 and Table 5 show that these instruments drift relative to the TIM by much more than the required long-term stability. The TIM instrument planned for TSIS is expected to have accuracy 100 ppm and stability 10 ppm per year (Table 1).
Models of TSI variablity constructed from the SORCE/TIM data are unavoidably less accurate and less repeatable than the direct TIM observations because of additional uncertainties accruing from the proxy indices that the model uses, the assumption that these proxies are able to reproduce the actual physical causes of TSI variability, and the statistical uncertainties in the coefficients that relate the model’s proxies with the direct observations. A model’s absolute scale is on average that of the instrument database used to construct it; the models make no attempt to estimate the actual TSI absolute value. A model’s stability - and hence its capability of estimating true TSI variability during a measurement gap - depends crucially on drifts in the proxy indices that the model uses. For any model of TSI variability to be useful in mitigating gaps between direct TSI observations, these indices must have appropriately low long term stability uncertainties for the duration of the gaps, which may range from years (in the case of no direct measurements between SORCE and TSIS, as assessed in Study A, or TCTE, as assessed in this Study B) to days or weeks (in the case of the proposed minimum one-measurement-per-week with TCTE/TSIS that this Study B assesses).
5.1. Formulation of TSI Variability Regression Models
Models of TSI variability have been developed by combining indices representative of solar activity, Two prominent such indices are sunspots darkening and facular brightening, which are known primary solar sources of irradiance variability. The sunspot and facular indices, Ispot and Ifact are obtained from a variety of ground and
space-based datasets and convertrd to equivalent change that each produces on the TSI according to
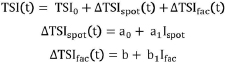
The coefficients a0, a1, b0, b1 and TSI0 are determined from multiple linear regression of the sunspot and facular indices against the directly observed TSI.
5.2. TSI Observations for Model Construction
The models of TSI variability used in this study are constructed using the TSI measurements made by TIM for the duration of the SORCE mission and, for comparison, an average of the TSI composites based on SoHO/VIRGO (the PMOD composite) and the ACRIM instruments (the ACRIM composite) from 1978 to the present. Figure 1 and Figure 2 illustrate and compare these composites. Prior to constructing TSI variability models, the PMOD and ACRIM composites are adjusted to the TIM absolute scales by applying absolute calibration differences of-4.45 Wm-2 and 0.49 Wm-2, respectively (Table 2).
5.3. Sunspot Darkening Indices
Sunspot darkening (also called the sunspot blocking function, or the photometric sunspot index) is specified using indices derived independently by five different groups from a variety of ground- and space-based observations of the Sun (typically magnetograms and white light images). Figure 10 illustrates the following sunspot darkening indices: the sunspot blocking function derived at NRL using sunspot regions that the USAF reports from multiple white light solar images in the SOON network; the Mt. Wilson sunspot area index derived from ground-based magnetograms; the STARA daily projected sunspot area obtained by processing SoHO/MDI and SDO/HMI full-disk images; the San Fernando Observatory sunspot deficit index; and the Debrecen projected sunspot area index derived from ground-based images.
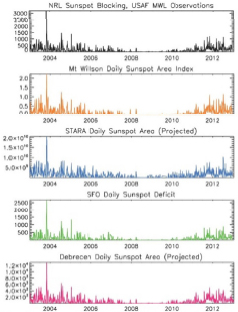
Figure 10: Compared for the duration of the SORCE mission, which is approaching one solar cycle, are five different time series that are used as proxy Indicators of sunspot darkening in models of TSI variability. The NRL sunspot blocking function (top) and the SFO daily sunspot deficit both account for the projected sunspot area and contrast, whereas the ML Wilson, SFO, and Debrecen daily sunspot time series do not account for sunspot contrast, which some studies indicate is area dependent.
5.4. Facular Brightening Indices
Facular brightening (also called the photometric facular index) is specified using indices derived from both space- and ground-based observations of the Sun, Figure 11 illustrates the following facular brightening indices; the Mg II irradiance (i.e., sun-as-a-star) index derived from solar spectra in the vicinity of 280 nm measured by SORCE/SOLSTICE; the Mt Wilson facular area index derived from ground-based magnetograms; and the San Fernando Observatory facular area and facular excess indices, and the Ca II K line emission index derived from ground-based images. Additional facular indices are also available from measurements of the Ca II K line emission (in the vicinity of 390nm) made by the KPNO SOLIS and Sacramento Peak programs and by the Kitt Peak Vacuum Telescope.
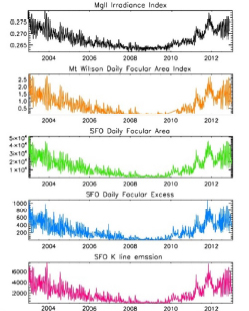
Figure 11: Compared for the duration of the SORCE mission, which is approaching one solar cycle, are five different time series that are used as proxy indicators of facular brightening in models of total solar irradiance variability. The Mg II Index (top), the SFO Daily Facular Excess, and the SFO K line emission are global (i,e., sun-as-a-star irradiance) indices that record the integrated emission from bright areas on the solar disk, projected to Earth. The Mt. Wilson and SFO Daily Facular Area time series do not account for facular contrast or center-to-limb variations,
5.5. Models of TSI Variability
Multiple models of TSI variability are constructed for this report using selected combinations of sunspot and facular indices, determining the models’ parameters by fitting to the direct TIM TSI observations (from 2003 to 2012) and to the average of the PMOD and ACRIM TSI composites (from 1978 to 2012), Table 6 provides statistical comparisons of each of ten different models of TSI variability constructed based on the SORCE/TIM observations (upper portion of table) and the average PMOD and ACRIM composites (lower). Figure 12 compares four models constructed from the TIM observations with the directly measured daily averaged time series, and Figure 13 compares four models constructed from the average PMOD and ACRIM composites with the daily averaged composite time series.
According to the metrics in Table 6, of the ten models considered, the NRL TSI variability model reproduces the SORCE/TIM observations with the highest Fidelity: the correlation coefficient is highest (with r=0.961, the model explains 92% of the variance that the TIM observes), and both the standard deviation of the model’s differences from the observations and the long term slope in these differences are lowest. The slope of the differences over the entire 10 years is 0.0055 W m-2 yr-1 (4 ppm per year) with this model, which is less than the TIM long-term stability
uncertainty (estimated to be 10 ppm per year). This model uses the sunspot darkening calculated from USAF ground-based multiple white light images and the Mg II index for facular brightening measured by the SORCE/SOLSTICE instrument. A part of the reason for the NRL model’s better statistical metrics is likely due to the higher (daily) cadence of the model values, In comparison, the Mt. Wilson Observatory and the San Fernando Observatory record the sunspot and facular indices less frequently than daily.
While the models of total solar irradiance have comparable stability (< 10 ppm per year) to the direct TIM observations when assessed over ten years, differences are larger on shorter time scales, as seen in Figure 12 and Figure 13.
Table 6: Comparison of TSI Models and Observations During the SORCE Epoch (2003-2012).
| Observations, Model Sunspot and Facular Indices (# of days) | Correlation Coëfficiënt of Model with Observations | Standard Deviation of Model Differences from Observations W m-2 | Slope of Model Differences from Observations W m-2 yr-1 |
| TIM NRL USAF Spot Blocking, Mg Index [3448) NRL Debrec Spot Area, Mg Index (3462) |
0.961 0.956 |
0.102 0.108 |
0.0042 0.0052 |
| TIM ML Wilson Spot Area, Facular Area (2564) |
0.913 | 0.150 | 0.0124 |
| TIM SFO Spot Area, Facular Area (1794) |
0.938 | 0.131 | 0.0106 |
| TIM SFO Spot Deficit, Facular Excess (1788) |
0.942 | 0.127 | 0.0055 |
| PMOD+ACRIM Average NRL USAF Spot Blocking, Mg Index (10931) NRL Debrec Spot Area, Mg Index (10902) |
0.895 0.894 |
0.266 0.267 |
-0.0042 -0.0007 |
| PMOD+ACRIM Average ML Wilson Spot Area, Facular Area (8143) |
0.817 | 0.337 | -0.0018 |
| PMOD+ACRIM Average SFO Spot Area, Facular Area (4602) |
0.872 | 0.280 | -0.0093 |
| PMOD+ACRIM Average SFO Spot Deficit, Facular Excess (4597) |
0.894 | 0.257 | -0.0061 |
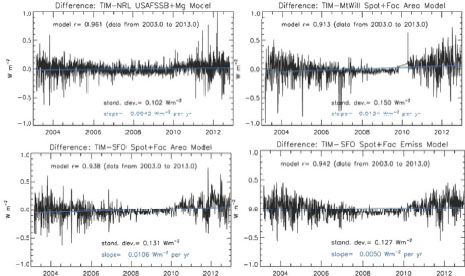
Figure 12: Models of the daily mean TSI constructed from four different datasets of sunspot darkening and facular brightening fitted to SORCE/TIM data.
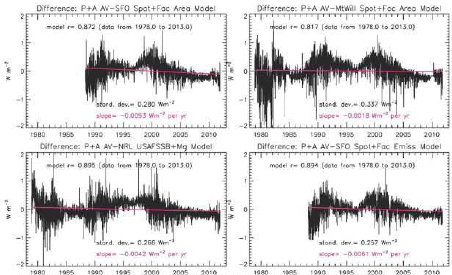
Figure 13: Models of the daily mean TSI constructed from four different datasets of sunspot darkening and facular brightening over the duration of the spaceborne TSI data record.
5.6. Scenarios for Model Comparisons with TCTE/TIM
Maintaining the TSI climate data record in the near future relies on 1) cross calibration of overlapping TSI measurements made with high absolute accuracy, 2) continuous monitoring of TSI variations as the solar cycle evolves with high instrument stability (long-term repeatability) on time scales of years to decades,
and 3) frequent sampling of the TSI variations throughout each day with high precision (low noise).
Measurement overlap remains essential because uncertainties in the absolute accuracies of different TSI measurements exceed the amplitudes of true solar irradiance variations (see Figure 3). Long term continuous monitoring of TSI variations with good stability is essential to both characterize solar cycle amplitudes, and ultimately, for the detection of possible longer-time scale changes that may underlie the solar activity cycle, The frequent sampling throughout each day is necessary because TSI can vary over a day and from day-to-day by amounts comparable to its variations during the solar cycle; if not properly sampled, this natural variability can add significant uncertainty to the radiometric comparisons needed to cross calibrate different TSI observational datasets, thus affecting long term trend determiration, and to refine TSI models. Since day-to-day variability is significantly larger during higher solar activity than during solar minimum, this uncertainty can depend on the phase of the solar cycle during overlap periods.
A limitation of the TCTE/TIM measurements is their infrequent cadence of a minimum of one orbit per week, To assess the ability of models of TSI variability to provide additional information that may reduce uncertainties in the solar irradiance CDR arising from gaps among TSI observations, scenarios are considered in which the TCTE/TIM provides one measurement of TSI per week for one year at different phases of the solar cycle.
Each TSI variability model is adjusted to the simulated TCTE/TIM measurements by a scaling determined in one-year intervals. Augmenting the TCTE/TIM measurements with these (scaled) model values provides a record of TSI variability with higher daily cadence than is afforded by TCTE/TIM direct measurements alone, In these scenarios, SORCE/TIM’s daily mean observations are assumed to be the “true” total solar irradiance. The TCTE/TIM measurements of this quantity one-orbit-per-week are represented by selecting one SORCE/TIM measurement per orbit on one day of each week. The resultant TSI time series constructed using these representative TCTE/TIM observations combined with the scaled model values is then compared with the full SORCE/TIM dataset of daily mean observations by evaluating the standard deviations and the slopes of the daily observation-to-model differences.
Figure 14 shows annually averaged values of the simulated TCTE TSI record, compared with SORCE/TIM’s directly measured daily averaged TSI. The annual averages of the standard deviations and slopes of the daily differences are also shown; each of these annual values simulates the uncertainty in true TSI for a one-year duration TCTE mission augmented with scaled values from TSI variability models. The second top panels in Figure 14 show that during low to moderate solar activity (2006-2011) the simulated TCTE TSI values, on average, agree with the “true” (i.e., SORCE/TIM) annual average values to within 20 ppm. The agreement deteriorates to as much as 40 ppm differences during higher solar activity (2003, 2012). The bottom panels show that the slopes of the TCTE TSI for any individual year can differ from the “true” TSI trend by up ±50 ppm per year. Comparison of the
figures on the right and left show that these statistical parameters can differ slightly depending on the phasing of the TCTE measurement cycle within the week. Only in some select years, under certain conditions (e.g. in 2006-2012 in the right panel), do simulated TCTE TSI time series achieve the CDR requirement of maintaining the long-term TSI precision to within 10 ppm per year.
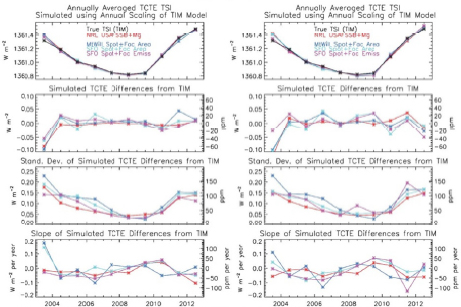
Figure 14: Annually averaged absolute TSI values (upper panel) and differences from SORCE/TIM’s direct observations (second panel) of TSI time series simulated for TCTE/TIM, with one observation per orbit per week and assimilation of various TSI variability models (indicated by different colors). Shown in the two bottom panels are the standard deviations and slopes of the daily differences between the observed (TIM) and simulated (TCTE) TSI values, for each year from 2003 to 2012. The right- and left-hand figures correspond to TCTE direct observations made on 2 different days (0, 2) of the week.
5.7. Future A variability of Model Inputs
Each of the models of TSI variability used for assimilation into the one orbit per week TCTE/TIM simulations requires two inputs: an index of sunspot darkening and an index of facular brightening. None of these indices is produced with an operational program that has the express purpose of generating inputs for TSI variability models.
Thus, there is no guarantee that all, or even any, of the indices that enable current models of TSI variability will be acquired or available during the TCTE measurement period. And for those indices that are available, there is no guarantee that the measurement cadence will be daily, or even weekly, but rather when opportunity, viewing conditions, and funding allow. During the TCTE measurement period, sunspot indices suitable for modeling TSI variability are more likely to be available than are facular indices. The lack of the stable, reliable Mg II facular index,
currently being provided by the SORCE/SOLSTICE, is likely the largest single factor that will degrade the TSI variability model capability (long-term stability) below that assessed in this analysis.
Neither alternate currently on-orbit TSI instruments nor solar models can fill and expected SORCE-to-TSIS TIM measurement gap with the required solar climate data record stability. With a TSIS launch late in 2016 and a 1-year baseline TCTE mission duration beginning in late 2013, as analyzed in this report, TCTE will maintain the record’s current level of stability for the duration of the STP-Sat3 mission if it overlaps with SORCE, but will otherwise provide only marginal stability improvement to the TSI record across a SORCE-to-TSIS gap because of its short duration and lack of direct connectivity to the SORCE/TIM record. Only if the TCTE overlaps with both SORCE and TSIS are the CDR stability requirements maintained until TSIS launches.
Although they fail to meet the TSIS CDR requirements by a factor of three, we show that VIRGO data provide the best TSI values in both stability and noise for filling TIM measurement gaps of the anticipated durations, The NRL model provides the next best alternative should the VIRGO data not be available.
We find that the planned TCTE low observing cadence does not limit the TSI record long-term stability provided that the TCTE overlaps with each of the surrounding instruments for two months.


