
“It is easy to be complacent about U.S. competitiveness and preeminence in science and technology. We have led the world for decades, and we continue to do so in many research fields today. But the world is changing rapidly, and our advantages are no longer unique.”
Rising Above the Gathering Storm: Energizing and Employing America for a Brighter Future (Washington, DC: The National Academies Press, 2006), pp. 12–13.
“The polity requires greater equality, the economy greater merit. The two, which are not absolute opposites, are however, to a degree in conflict. The task is to make them as compatible and as reinforcing as possible.”
Clark Kerr, Troubled Times in American Higher Education (Albany, NY: State University of New York Press, 1994), p. 28.
Measuring the effect of the programs in the Experimental Program to Stimulate Competitive Research (EPSCoR) is no easy task. Congressional legislation describes different objectives for each program. Federal agencies—each harboring different legislative mandates—often pursue different programmatic strategies and seek different outcomes (see Figure 3-1). States, institutions, and researchers each bring their own aspirations, skill sets, and levels of commitment to the effort. Eligible states exhibit broad diversity in demographics, geography, economic standing, and scientific and technical capacity.
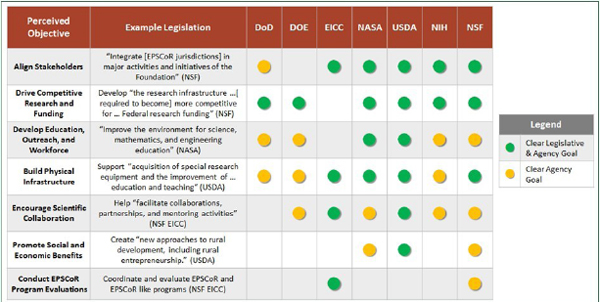
Figure 3-1. The governing legislation for various EPSCoR and IDeA programs reveal program objectives that differ by agency. [SOURCE: Legislative Objectives: PL 96-44; PL 111-358; PL 103-43; PL 107-293; PL 103-337; PL 102-588; PL 102-486; 7 USC Sec. 450i (AFRI); 42 USC 16.1862 p.9 (EICC). Agency Objectives: Agency program websites such as http://grants.nih.gov/grants/guide/pa-files/PAR-12-205.html. Accessed on August 13, 2013]
In short, significant differences among players, objectives, and capabilities present formidable obstacles to analysts and scholars seeking to design comprehensive assessments of the programs’ accomplishments.
These obstacles, however, have not precluded assessments of EPSCoR programs. To the contrary, agency and participant reports often present a range of performance metrics that allow proponents to lay claim to EPSCoR’s transformative impact on statewide research capacity and competitiveness. While these documents are useful for oversight and advocacy, they often lack the methodological controls required to isolate EPSCoR’s impacts from other determinants or larger national trends. For example, countless government reports, academic studies and media stories have highlighted the role of science and technology in stimulating economic growth. The fact that state leaders have become more aware of the value of research cannot be credited to EPSCoR alone and is consistent with a national shift in attitude. Furthermore, commonly used metrics linking university research, technology transfer, and economic development have unproven ties to EPSCoR activities. Although there is broad agreement that research can be an important factor in stimulating economic growth, there is also consensus that it is not sufficient by itself.37 Numerous
_________________________
37Measuring the Impacts of Federal Investments in Research: A Workshop Summary. (Washington, DC: The National Academies Press, 2011); Research Universities and the Future of America: Ten Breakthrough Actions Vital to Our Nation's Prosperity and Security. (Washington, DC: The National Academies Press, 2012).
other public policy and economic factors play essential roles, and experts do not agree on how to measure the relative contribution of all these factors.
Few independent comprehensive evaluations of federal agency program design or state implementation of EPSCoR programs have been conducted. Existing assessments, moreover, have tended to focus on selected program aspects, have been largely confined to National Science Foundation (NSF) EPSCoR, or were conducted a decade or more ago.38 As a result, they have not been able to take account of such critical factors as the increase in the number of eligible states, the expanding of programmatic objectives, and the cumulative effects of state and university participation in EPSCoR. In addition, few independent studies have evaluated eligibility criteria or presented comparisons of the effectiveness of the programs across agencies.39 Nor have they considered the impact of a growing set of program objectives or assessed whether national demand can support an increasing number of research universities.
While such shortcomings warrant independent evaluations, a lack of data present significant additional obstacles. This problem is not unique to EPSCoR. The White House Office of Management and Budget (OMB) has been promotiing a government-wide effort to collect the data necessary for rigorous program evaluation.40 Furthermore, publicly accessible data are collected and published in a highly aggregated form, making it difficult to draw clear conclusions about national impacts.
As a result of all these factors, EPSCoR’s reputation (as recorded in the studies done to date) has been largely based on anecdotal and institutional evidence rather than on detailed analyses of statewide or national results.
EPSCOR IN THE NATIONAL CONTEXT
Given that EPSCoR’s mandate calls for fostering greater research competitiveness nationwide, the programs must be assessed in a national context. States and their research institutions compete within a nationwide framework, seeking advantage in both research inputs (faculty, students, facilities, and funds) and research outputs (publications, degrees completed, economic development, and recognition). Furthermore, because EPSCoR’s mandate also calls for reducing “undue concentration” of research, it must also be measured within a state, and not institutional, context.
_________________________
38 For an exception, see Assessment of the Defense Experimental Program To Stimulate Competitive Research (DEPSCoR): Final Report Volumes I and II, Oct. 2008 (Alexandria, VA: Institute for Defense Analyses, 2008), which evaluates the Department of Defense DEPSCoR.
39 These goals include improving science education, nurturing greater workforce diversity, serving as a catalyst for economic growth and innovation, and promoting public understanding and appreciation for science.
40 Office of Management and Budget (OMB), “Memorandum for the Heads of Departments and Agencies,” M-10-01, Executive Office of the President, OMB, October 7, 2009.
Share of Federal Academic R&D Expenditures
Evidence to date suggests that EPSCoR programs have had little impact on the national distribution of academic research and development (R&D) expenditures. Such expenditures have historically been concentrated in relatively few institutions located in a relatively few states. As of 2009, aggregating across all currently eligible states, EPSCoR states received approximately the same share of federal academic science and engineering funds as they did at the inception of EPSCoR in 1979 (see Figure 3-2).
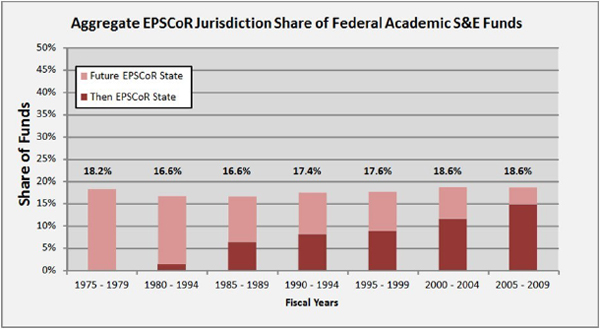
Figure 3-2. The share of federal academic science and engineering funds received by EPSCoR states has remained largely the same since the inception of the EPSCoR program. [SOURCE: NSF Survey of Federal Science and Engineering Support to Universities, Colleges, and Nonprofit Institutions via WebCASPAR]
This outcome should not be surprising. As Yonghong Wu, one of the most authoritative researchers of EPSCoR programs and Associate Professor of Public Administration at the University of Illinois at Chicago, observes:
“Non-EPSCoR states, which have higher quality universities and researchers, can secure most of the increments of federal S&E [science and engineering] support. As a result, the growth of the aggregate federal S&E support could outpace the addition of EPSCoR funding to EPSCoR states, leaving the share of EPSCoR states’ federal S&E funding stagnant.”41
_________________________
41 Yonghong Wu, “Tackling Undue Concentration of Federal Research Funding: An Empirical Assessment of NSF’s Experimental Program to Stimulate Competitive Research (EPSCoR),” Research Policy 39 (July 2010).
However, this result does not imply that EPSCoR-like programs have had no impact. As Wu also notes:
“A small positive effect is better than no effect… Given that non-EPSCoR states are advantaged in obtaining federal S&E support, the distribution of federal funds would have been even more uneven in the absence of the EPSCoR efforts.”42 Yet noting that the program has produced some favorable results is not saying that it has met expectations. The committee noted that the goal of all federal programs is not just to do some good but to spend taxpayer funds as effectively as possible.
Proposal Success Rates
Changes in the submission and success rates of research grant proposals serve as key indicators of research participation and competitiveness. Available data do not suggest that EPSCoR programs have appreciably improved overall competitiveness of the EPSCoR states by these measures. At NSF, the success rate of proposals for all grants from EPSCoR states has consistently remained 3 to 5 percent lower than those from non-EPSCoR states since 1990 (see Figure 3-3).
However, broad trends in grant success rates mask significant differences among states. In recent years, some EPSCoR states have held their own when competing for federal R&D funds, despite a national decline in proposal success rates due to tightening federal R&D budgets. An increase in the number of proposals is an indication that a state is trying to raise its research profile by hiring additional researchers or giving current faculty more time to devote to proposal writing. The challenge is to maintain quality, which is reflected in the success rate, while increasing quantity. This is particularly difficult during periods when overall success rates are falling. All states have increased their number of submissions during the past two decades, and many have managed to do so without an excessive drop in success rate (see Figure 3-4). Idaho, for example, has doubled its number of proposals with no decline in success rate. Conversely, other EPSCoR states have failed to keep pace and have actually experienced a decline in their rankings for R&D expenditures.
_________________________
42 Ibid.
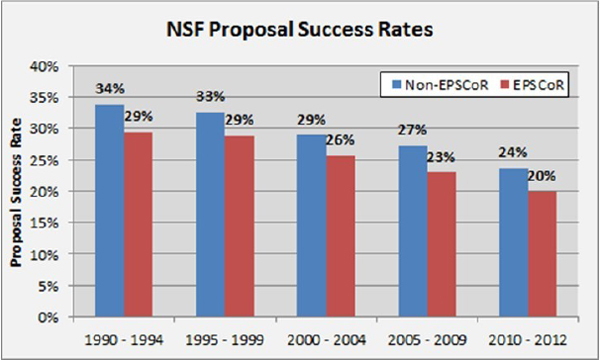
Figure 3-3. Declining proposal success rates have taken place in both EPSCoR and non-EPSCoR states (according to FY 2012 eligibility) although EPSCoR states are consistently lower. [SOURCE: NSF Competitive Proposal and Award Counts by State/Territory and Fiscal Year of Decision; NSF.gov/awardsearch]
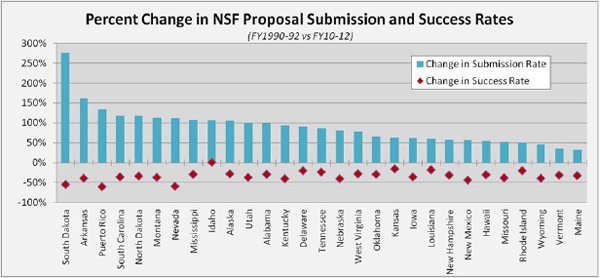
Figure 3-4. Some FY 2012 eligible EPSCoR states have done better than others in increasing their submission rates while minimizing a reduction in success rates. Here a positive “Change in Submission Rate” means an increase in the number of proposals submitted, and a negative “Change in Success Rate” means a decrease in the number of proposals approved. [SOURCE: NSF Competitive Proposal and Award Counts by State/Territory and Fiscal Year of Decision; NSF.gov/awardsearch]
The reasons for these disparities are difficult to determine and would require extensive institutional-level analysis beyond the scope of the committee’s charge or resources. In fact, negative short-term trends could
actually mark an expansion in the research community. As proposal-writing experience among young researchers grows, their success may increase.
Centers of Excellence
Opportunities for multiyear, multipurpose, and multiobjective centers—such as Engineering Research Centers, Science and Technology Centers, and Materials Research Science and Engineering Centers —represent an important element in NSF’s R&D grant portfolio. These large-scale projects not only yield financial rewards but also raise the host institution’s image and standing in the research community. Not surprisingly, competition is fierce.
Although universities in some EPSCoR states have successfully competed for these centers,43 both the number and percentage of awards received by universities in EPSCoR states remains low. Whether this is because EPSCoR universities have submitted fewer proposals or because the proposals have not fared well during the review process cannot be determined. NSF policies do not permit the list of rejected proposals to be made public.
EPSCOR IN THE INSTITUTIONAL AND STATE CONTEXT
As the previous section highlights, EPSCoR programs face formidable challenges in their efforts to alter the national research landscape. EPSCoR proponents, however, often cite the programs’ positive impact on individuals and institutions as evidence of programmatic success. Indeed, success on the individual and institutional level could take place—in fact, likely does take place—even as the overall competitiveness of the state does not improve.
Academic Rankings
Measuring the quality of a state’s universities is a difficult, if not impossible, task. Recognizing how difficult the task is, the National Academies’ assessment of the nation’s graduate programs opted not to include a simple quality ranking of university departments.44 A number of organizations, including U.S. News and World Report, publish widely cited rankings of university quality, but the committee does not consider these to be reliable measures of university quality. Universities in EPSCoR states have been submitting more research proposals, which is an indicator of increased research activity, and some universities have won competitions for major research
_________________________
43 Examples of research centers include: Montana State University, Mississippi State University, and Clemson University, which have been chosen to host Engineering Research Centers; the University of Alabama, University of Southern Mississippi, University of Nebraska, University of Oklahoma, and University of Arkansas, which have been chosen to host Materials Research Science and Engineering Centers. These and other centers types have also been awarded to other EPSCoR states; this list is not exhaustive.
44See A Data Based Assessment of Research-Doctorate Programs in the United States (Washington, DC: NAP, 2011).
projects such as the NSF Science and Technology Centers or Engineering Research Centers, which is an indicator of high quality.
Research Culture
Advocates often observe that the EPSCoR programs encourage state governments and institutions to support both higher education and research capacity building. They praise the EPSCoR program for helping to foster significant changes in the priorities, policies, aspirations, and the administrative structure of participating universities. Improvements include establishing chief research officers, creating positions for grant-writing experts, forging stronger private-sector relationships, and highlighting the role that research universities play in state economic growth.
In addition, EPSCoR’s state committees are credited with having helped strengthen political support for higher education and facilitating research planning in a number of states. Although these effects are difficult to measure, EPSCoR has nevertheless been cited by administrators and faculty at participating institutions—and by outside observers as well—as having done an admirable job in helping to change the “culture” for the support of research in many of participating states. For example, funding per student at research universities in EPSCoR states has, in the aggregate, equalized to that in non-EPSCoR states (see Figure 3-5). It must be noted that state accounting practices vary and that other factors, such as demographic changes, affects these numbers. Also, total state spending on universities is not a perfect indicator of investment in research activity. In general, and as noted above, the broad cultural changes, which are commonly cited in state reports as due to EPSCoR effects, are impossible to quantify or attribute to EPSCoR alone.
While it is difficult to disaggregate the discrete impacts of EPSCoR, this much is clear: Public universities in EPSCoR-eligible states, many of which once focused largely on undergraduate teaching, have become increasingly invested in research. This trend has been stimulated by many factors, ranging from the growing interest of state governments to promote R&D as a key element of economic development and job creation strategies, to an ever-increasing pool of science, technology, engineering, and mathematics doctoral graduates and postdoctoral students in search of university employment, to the growth in federal funding for academic R&D (at least until recently), and to the pride and recognition that is engendered by having a “home state” university that is gaining a reputation for its research prowess.45
_________________________
45Not all assessments of EPSCoR’s impact on state involvement in building research capacity have been positive. Of special concern, as suggested by empirical findings, is that EPSCoR funds may prompt a decline (or crowding out) of state government support of academic research, especially when considering the recent decline in funding for public research universities. As Yonghong Wu notes: “This negative trend of state governments’ contribution to academic research contradicts the NSF’s expectation of a high level of engagement and commitment by state governments, industries, and other major partners.” See “NSF’s Experimental Program to Stimulate Competitive Research
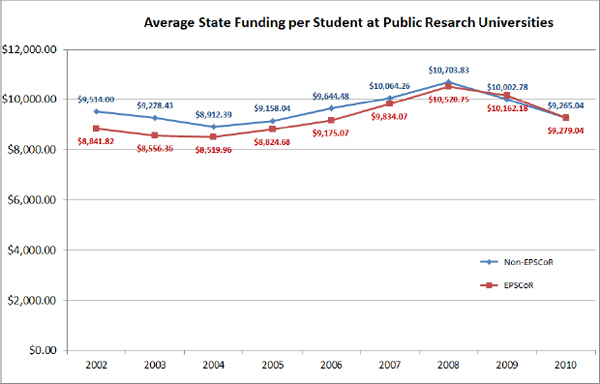
Figure 3-5. The FY 2012 eligible EPSCoR states have—on average—closed the gap in state funding per student. NOTE: Data are unclear as to the cause of this result and cannot be attributed solely to EPSCoR; other factors, such as population shifts or changes in state policies, could have a significant influence. [SOURCE: Table 8-29 “State funding for major public research universities per enrolled student, by state: 2002–2010”;http://www.nsf.gov/statistics/seind12/c8/interactive/table.cfm?table=29]
Are Effects Sustainable?
EPSCoR programs face formidable challenges in helping eligible institutions compete for an increased share of federal R&D funds. Although universities pursuing federal R&D dollars are increasingly investing their own resources to build research infrastructure to enhance their competitiveness, public universities are generally facing shrinking appropriations from their states.46 These reductions are exerting downward pressures on faculty and staff salaries and increasingly impeding the ability of universities to attract top faculty and/or research staff. State budget reductions often constrain funding for
_________________________
(EPSCoR): Subsidizing Academic Research or State Budgets?” Journal of Policy Analysis and Management 28 (2009).
46 Public universities currently contribute an average 24 percent of their own funds to research infrastructure and initiatives. See Science and Engineering Indicators 2012 (Arlington, VA: NSF National Science Board, 2012).
graduate and postgraduate student fellowships, decrease seed money for precompetitive and start-up activities, and delay laboratory maintenance and construction projects designed to enhance institutional research competitiveness. Long periods of fiscal retrenchment can also adversely affect faculty morale. While scant data exist on faculty mobility patterns associated with state budget cutbacks, anecdotal evidence suggests that public research universities have been losing some outstanding faculty to private research universities (see Box 3-1).
Box 3-1
Public University Budget Cuts
Potential Effects on EPSCoR States
In a survey on faculty satisfaction, Julia Melkers and Yonghong Wu found that faculties at EPSCoR state institutions were “generally less satisfied with their relatively low salaries…, were significantly less satisfied…with…the reputation of their institution and academic department,” and expressed concerns about “the quality of research assistants and the availability of research equipment and instrumentation.”
Following a 30 percent reduction in state support between 2009 and 2011, a junior faculty member commented that every other faculty member under the age of 50 was “looking for a job outside the state.” Having joined the University of Nevada, Las Vegas (UNLV) in 2007 “at time when UNLV seemed to be on the rise,” the faculty member recently concluded “that the state’s antipathy toward academe [has] undermined the university’s future.”
_________________________
SOURCE: Melkers and Wu, “Evaluating the Improved Research Capacity of EPSCoR States: R&D Funding and Collaborative Networks in the NSF EPSCoR Program.” Review of Policy Research, Volume 26, Number 6 (2009).
It should be noted that public research universities in EPSCoR states do not appear to have suffered greater reductions in state support than their non-EPSCoR counterparts. However, there is no guarantee that state support will continue to be maintained, an important consideration for public universities in EPSCoR states given their more fragile research base (see Table 3-1).
Table 3-1. EPSCoR States Are Among the Most Dependent on State and Local Government Funding for Academic R&D Expenditures
| Share of Academic R&D Expenditures from State or Local Government | |||
| All Colleges and Universities | Public Colleges and Universities | ||
| State | % | State | % |
| North Dakota* | 23 | District of Columbia | 33 |
| Arkansas* | 23 | North Dakota* | 23 |
| Idaho* | 21 | Arkansas* | 23 |
| Louisiana* | 17 | Louisiana* | 21 |
| South Dakota* | 17 | Idaho* | 21 |
| Oklahoma* | 15 | South Dakota* | 17 |
| Montana* | 15 | North Carolina | 16 |
| Kansas* | 13 | Oklahoma* | 16 |
| Virgin Islands* | 13 | Tennessee* | 15 |
| Texas | 13 | Montana* | 15 |
NOTE: * indicates EPSCoR state
SOURCE: The Survey of Research and Development Expenditures at Universities and Colleges data 2009; http://www.nsf.gov/statistics/rdexpenditures/. Accessed on August 13 2013.
Conceived as a time-limited, well-defined, and innovative program, EPSCoR has grown into a large and diffuse initiative. The failure to articulate a coherent and enduring rationale for EPSCoR programs has led both federal agencies and states to expand EPSCoR’s strategic framework and range of activities. The absence of a clear and lucid rationale, in turn, has also stymied discussions on alternative eligibility and graduation. As a result, EPSCoR currently embraces definitions of responsibilities and success that not only diverge from the original mandate but are also difficult to examine or assess.
Nonetheless EPSCoR has contributed to increased research competitiveness at a select number of research-intensive and doctoral universities in a number of states. Data, however, show that EPSCoR has not had a significant impact on the aggregate share of federal academic R&D funds received by eligible states or the aggregate award rate of research proposals from EPSCoR states. Additional progress on competitiveness measures would require EPSCoR to overcome structural factors such as the size or population of the states that play such large roles in determining university research competitiveness. EPSCoR funding is a small percentage of the total research funding going to the EPSCoR states, and the committee could not find evidence that the EPSCoR did or did not have a significant impact on the states’ ability to attract non-EPSCoR funds. This task is well beyond the mission and means of the EPSCoR program and would be difficult for any initiative to achieve under any circumstances.
Recent reductions in state funding for public universities in most states raise serious questions as to whether the modest gains in research capacity in EPSCoR states can be sustained. If state financial support for higher education falters, the core responsibility of EPSCoR—to serve as catalysts for building research capacity—will falter as well. States that are committed to strengthening research capacity can demonstrate their desire by maintaining support over the long term and taking other actions to encourage research.


