
Appendix G
Selected Results of the Committee’s Commissioned Empirical Analyses
MEDICARE SERVICE CATEGORY UTILIZATION (MONTHLY COST RESIDUAL) BY HRR
To determine the extent to which variation in particular health care services contributes to total variation in Medicare expenditure, the Committee disaggregated price-standardized, risk-adjusted Medicare spending into seven types of services. Table G-1 sorts 306 hospital referral regions (HRRs) by their total monthly adjusted differences from the national mean of spending (also known as residual cost). This table serves as a supplement to Figure 2-5a–h (Medicare Service Category Utilization by Hospital Referral Region), in Chapter 2.1
_________________
1Information on other services categories are available on the Acumen Medicare spreadsheets, which can be accessed through the Institute of Medicine website (http://www.iom.edu/geovariationmaterials).
TABLE G-1
Medicare Service Category Utilization (Monthly Cost Residual) by Hospital Referral Region (HRR)
| HRR Name | Total Monthly Adjusted Differences from the National Mean of Spending Across HRRs | Acute Care Monthly Adjusted Differences from the National Mean of Spending Across HRRs | Post-Acute Care Monthly Adjusted Differences from the National Mean of Spending Across HRRs |
| Rochester, NY | -$174 | -$43 | -$79 |
| Stockton, CA | -$172 | -$41 | -$64 |
| Sacramento, CA | -$171 | -$52 | -$69 |
| Buffalo, NY | -$166 | -$46 | -$57 |
| Bronx, NY | -$166 | -$38 | -$89 |
| Santa Cruz, CA | -$158 | -$39 | -$64 |
| Santa Rosa, CA | -$157 | -$61 | -$67 |
| Medford, OR | -$156 | -$48 | -$69 |
| San Francisco, CA | -$153 | -$34 | -$65 |
| Salem, OR | -$150 | -$47 | -$58 |
| Albuquerque, NM | -$149 | -$52 | -$31 |
| Modesto, CA | -$141 | -$25 | -$80 |
| La Crosse, WI | -$138 | -$36 | -$68 |
| Bakersfield, CA | -$136 | -$26 | -$86 |
| Yakima, WA | -$135 | -$39 | -$70 |
| Eugene, OR | -$134 | -$34 | -$59 |
| Santa Barbara, CA | -$134 | -$59 | -$71 |
| Alameda County, CA | -$133 | -$24 | -$57 |
| Syracuse, NY | -$131 | -$41 | -$73 |
| Portland, ME | -$130 | -$40 | -$36 |
| Fresno, CA | -$130 | -$34 | -$83 |
| Burlington, VT | -$127 | -$38 | -$58 |
| San Jose, CA | -$126 | -$36 | -$58 |
| Portland, OR | -$126 | -$36 | -$57 |
| Binghamton, NY | -$121 | -$45 | -$71 |
| Elmira, NY | -$117 | -$13 | -$71 |
| Danville, PA | -$115 | -$49 | -$25 |
| HRR Name | Total Monthly Adjusted Differences from the National Mean of Spending Across HRRs | Acute Care Monthly Adjusted Differences from the National Mean of Spending Across HRRs | Post-Acute Care Monthly Adjusted Differences from the National Mean of Spending Across HRRs |
| Minot, ND | -$114 | -$21 | -$42 |
| Albany, GA | -$112 | -$54 | -$62 |
| Olympia, WA | -$110 | -$33 | -$43 |
| Iowa City, IA | -$108 | -$14 | -$52 |
| Honolulu, HI | -$108 | -$28 | -$48 |
| Chico, CA | -$104 | -$17 | -$57 |
| El Paso, TX | -$104 | -$48 | -$7 |
| Redding, CA | -$104 | -$38 | -$45 |
| Dubuque, IA | -$103 | -$30 | -$41 |
| San Bernardino, CA | -$102 | -$23 | -$26 |
| Springfield, MA | -$102 | -$40 | -$12 |
| Pueblo, CO | -$101 | -$38 | -$34 |
| Marshfield, WI | -$101 | -$10 | -$61 |
| San Mateo County, CA | -$100 | -$28 | -$48 |
| Charleston, WV | -$100 | -$23 | -$50 |
| Appleton, WI | -$99 | -$34 | -$49 |
| Albany, NY | -$97 | -$21 | -$57 |
| Roanoke, VA | -$96 | -$24 | -$25 |
| Sayre, PA | -$96 | -$11 | -$58 |
| Madison, WI | -$95 | -$22 | -$37 |
| Bangor, ME | -$93 | -$20 | -$55 |
| Neenah, WI | -$93 | -$34 | -$52 |
| Rochester, MN | -$93 | -$4 | -$51 |
| Napa, CA | -$92 | -$15 | -$80 |
| Providence, RI | -$92 | -$30 | -$16 |
| Rapid City, SD | -$91 | -$22 | -$44 |
| Charlottesville, VA | -$91 | -$20 | -$36 |
| HRR Name | Total Monthly Adjusted Differences from the National Mean of Spending Across HRRs | Acute Care Monthly Adjusted Differences from the National Mean of Spending Across HRRs | Post-Acute Care Monthly Adjusted Differences from the National Mean of Spending Across HRRs |
| Everett, WA | -$90 | -$38 | -$47 |
| Bend, OR | -$88 | -$36 | -$42 |
| Winchester, VA | -$87 | -$18 | -$42 |
| Tacoma, WA | -$86 | -$28 | -$36 |
| Grand Junction, CO | -$84 | -$33 | -$24 |
| Muskegon, MI | -$83 | -$54 | -$20 |
| San Luis Obispo, CA | -$82 | -$42 | -$51 |
| Seattle, WA | -$80 | -$27 | -$38 |
| Fargo, ND/Moorhead, MN | -$80 | -$10 | -$35 |
| Contra Costa County, CA | -$79 | -$11 | -$50 |
| Greensboro, NC | -$79 | -$33 | -$35 |
| Morgantown, WV | -$76 | -$11 | -$42 |
| Cedar Rapids, IA | -$75 | -$14 | -$40 |
| Spokane, WA | -$73 | -$38 | -$40 |
| Des Moines, IA | -$73 | -$5 | -$56 |
| Bismarck, ND | -$72 | -$5 | -$60 |
| Erie, PA | -$72 | -$25 | -$26 |
| Anchorage, AK | -$72 | $6 | -$62 |
| Lancaster, PA | -$71 | -$11 | -$22 |
| Columbus, GA | -$67 | -$36 | -$15 |
| Lebanon, NH | -$65 | -$37 | -$22 |
| St. Cloud, MN | -$63 | -$1 | -$45 |
| Green Bay, WI | -$63 | -$15 | -$37 |
| San Diego, CA | -$63 | -$33 | -$28 |
| Grand Rapids, MI | -$62 | -$21 | -$24 |
| Minneapolis, MN | -$61 | $4 | -$43 |
| Salinas, CA | -$61 | $16 | -$57 |
| HRR Name | Total Monthly Adjusted Differences from the National Mean of Spending Across HRRs | Acute Care Monthly Adjusted Differences from the National Mean of Spending Across HRRs | Post-Acute Care Monthly Adjusted Differences from the National Mean of Spending Across HRRs |
| Mason City, IA | -$59 | $8 | -$67 |
| Wausau, WI | -$59 | -$1 | -$44 |
| Harrisburg, PA | -$58 | -$18 | -$21 |
| Springfield, MO | -$58 | -$25 | -$21 |
| Kingsport, TN | -$57 | -$9 | -$9 |
| Duluth, MN | -$57 | -$2 | -$35 |
| Augusta, GA | -$56 | -$25 | -$33 |
| Missoula, MT | -$56 | -$18 | -$36 |
| Durham, NC | -$56 | -$16 | -$37 |
| Altoona, PA | -$55 | -$31 | $5 |
| Spartanburg, SC | -$54 | -$25 | -$12 |
| St. Paul, MN | -$53 | $13 | -$47 |
| Hartford, CT | -$52 | -$24 | -$10 |
| Johnstown, PA | -$51 | -$3 | -$6 |
| Norfolk, VA | -$51 | -$13 | -$36 |
| Manhattan, NY | -$51 | -$10 | -$86 |
| Sioux City, IA | -$50 | $0 | -$52 |
| Lynchburg, VA | -$50 | $0 | -$5 |
| Springdale, AR | -$48 | -$6 | $7 |
| Marquette, MI | -$45 | -$10 | -$39 |
| Manchester, NH | -$44 | -$27 | $3 |
| Colorado Springs, CO | -$43 | -$22 | -$8 |
| Newport News, VA | -$42 | -$22 | -$37 |
| Worcester, MA | -$42 | -$18 | $16 |
| Billings, MT | -$41 | $0 | -$45 |
| Reading, PA | -$40 | -$8 | -$6 |
| Arlington, VA | -$39 | -$12 | -$20 |
| HRR Name | Total Monthly Adjusted Differences from the National Mean of Spending Across HRRs | Acute Care Monthly Adjusted Differences from the National Mean of Spending Across HRRs | Post-Acute Care Monthly Adjusted Differences from the National Mean of Spending Across HRRs |
| York, PA | -$39 | -$16 | -$17 |
| Tucson, AZ | -$39 | -$9 | -$20 |
| Tallahassee, FL | -$37 | -$26 | -$10 |
| Ogden, UT | -$37 | -$61 | $25 |
| Boise, ID | -$35 | -$41 | $7 |
| Davenport, IA | -$35 | $8 | -$30 |
| South Bend, IN | -$33 | -$22 | -$7 |
| Sioux Falls, SD | -$33 | $15 | -$43 |
| Kalamazoo, MI | -$32 | $2 | -$16 |
| Reno, NV | -$32 | -$12 | -$21 |
| Allentown, PA | -$32 | $13 | -$14 |
| Phoenix, AZ | -$31 | $4 | -$21 |
| Traverse City, MI | -$31 | $3 | -$40 |
| Huntington, WV | -$31 | $4 | -$31 |
| Urbana, IL | -$30 | $11 | -$38 |
| Fort Wayne, IN | -$29 | -$20 | -$6 |
| New Haven, CT | -$29 | -$10 | -$10 |
| Asheville, NC | -$29 | -$31 | -$11 |
| Richmond, VA | -$28 | $17 | -$22 |
| Scranton, PA | -$27 | -$15 | $14 |
| Macon, GA | -$27 | $3 | -$40 |
| Salt Lake City, UT | -$27 | -$50 | $13 |
| Atlanta, GA | -$27 | -$20 | -$15 |
| Petoskey, MI | -$26 | -$1 | -$29 |
| Waterloo, IA | -$26 | $2 | -$53 |
| Winston-Salem, NC | -$26 | -$12 | -$22 |
| Ventura, CA | -$24 | -$7 | -$45 |
| HRR Name | Total Monthly Adjusted Differences from the National Mean of Spending Across HRRs | Acute Care Monthly Adjusted Differences from the National Mean of Spending Across HRRs | Post-Acute Care Monthly Adjusted Differences from the National Mean of Spending Across HRRs |
| Bloomington, IL | -$24 | $0 | -$35 |
| Great Falls, MT | -$23 | $15 | -$36 |
| Columbia, MO | -$23 | $22 | -$34 |
| Greenville, SC | -$23 | -$20 | -$6 |
| Springfield, IL | -$22 | $15 | -$37 |
| Canton, OH | -$22 | -$10 | -$2 |
| White Plains, NY | -$17 | $16 | -$44 |
| Denver, CO | -$16 | -$20 | -$10 |
| Boston, MA | -$15 | -$9 | $31 |
| East Long Island, NY | -$15 | $12 | -$54 |
| Milwaukee, WI | -$15 | $11 | -$20 |
| Bridgeport, CT | -$14 | $1 | -$31 |
| Jonesboro, AR | -$14 | $6 | -$10 |
| Palm Springs/Rancho Mira, CA | -$14 | -$12 | -$43 |
| Paterson, NJ | -$14 | -$2 | -$30 |
| Lansing, MI | -$13 | $3 | -$19 |
| Flint, MI | -$13 | $26 | -$20 |
| Temple, TX | -$13 | -$25 | $27 |
| Hickory, NC | -$12 | -$22 | -$8 |
| Raleigh, NC | -$12 | $1 | -$25 |
| Peoria, IL | -$11 | $20 | -$15 |
| Greenville, NC | -$11 | $10 | -$43 |
| Charlotte, NC | -$11 | -$15 | -$18 |
| Johnson City, TN | -$10 | $12 | $3 |
| Casper, WY | -$9 | $20 | -$24 |
| Florence, SC | -$9 | $23 | -$39 |
| St. Joseph, MI | -$9 | -$6 | -$10 |
| HRR Name | Total Monthly Adjusted Differences from the National Mean of Spending Across HRRs | Acute Care Monthly Adjusted Differences from the National Mean of Spending Across HRRs | Post-Acute Care Monthly Adjusted Differences from the National Mean of Spending Across HRRs |
| Fort Smith, AR | -$8 | -$27 | $72 |
| Greeley, CO | -$8 | $0 | -$9 |
| Knoxville, TN | -$8 | -$18 | $1 |
| Fort Collins, CO | -$7 | -$1 | -$8 |
| Grand Forks, ND | -$5 | $21 | -$29 |
| Newark, NJ | -$5 | $14 | -$39 |
| Joplin, MO | -$4 | $25 | -$2 |
| Wilkes-Barre, PA | -$4 | -$28 | $51 |
| Rockford, IL | -$3 | $27 | -$18 |
| Washington, DC | -$2 | $45 | -$48 |
| Wilmington, DE | -$1 | $21 | -$12 |
| Dothan, AL | -$1 | $5 | $18 |
| Chattanooga, TN | $0 | -$11 | $18 |
| Muncie, IN | $0 | -$21 | $9 |
| Rome, GA | $1 | -$1 | $8 |
| Little Rock, AR | $2 | $12 | -$2 |
| Sun City, AZ | $3 | $10 | -$26 |
| Akron, OH | $3 | $13 | $7 |
| Morristown, NJ | $4 | $5 | -$16 |
| Lafayette, IN | $4 | -$8 | $0 |
| St. Louis, MO | $6 | $26 | -$13 |
| Youngstown, OH | $7 | $29 | -$1 |
| Philadelphia, PA | $8 | $22 | -$17 |
| Lawton, OK | $8 | $3 | $37 |
| New Brunswick, NJ | $9 | $21 | -$22 |
| Topeka, KS | $10 | $1 | -$3 |
| Montgomery, AL | $10 | -$12 | $21 |
| HRR Name | Total Monthly Adjusted Differences from the National Mean of Spending Across HRRs | Acute Care Monthly Adjusted Differences from the National Mean of Spending Across HRRs | Post-Acute Care Monthly Adjusted Differences from the National Mean of Spending Across HRRs |
| Ridgewood, NJ | $10 | $13 | -$22 |
| Cape Girardeau, MO | $10 | $3 | -$21 |
| Cleveland, OH | $11 | $14 | $20 |
| Idaho Falls, ID | $11 | -$24 | $6 |
| Jackson, TN | $12 | -$5 | $42 |
| Lexington, KY | $12 | $7 | $4 |
| Boulder, CO | $12 | -$2 | $0 |
| Cincinnati, OH | $13 | $4 | $6 |
| Paducah, KY | $13 | $34 | -$5 |
| Memphis, TN | $14 | $10 | $15 |
| Indianapolis, IN | $15 | -$8 | $13 |
| Aurora, IL | $15 | $26 | $11 |
| Toledo, OH | $15 | $21 | $6 |
| Pittsburgh, PA | $15 | $26 | $20 |
| Nashville, TN | $15 | $2 | $21 |
| Columbia, SC | $16 | -$4 | -$10 |
| Owensboro, KY | $16 | $24 | -$24 |
| Oxford, MS | $16 | $12 | $20 |
| Omaha, NE | $17 | $25 | -$17 |
| Ann Arbor, MI | $17 | $11 | $12 |
| Provo, UT | $17 | -$45 | $44 |
| Huntsville, AL | $19 | $8 | -$1 |
| Los Angeles, CA | $20 | $3 | -$12 |
| Columbus, OH | $20 | $18 | $3 |
| Camden, NJ | $20 | $20 | -$17 |
| Dayton, OH | $21 | $16 | $10 |
| Birmingham, AL | $22 | $12 | $23 |
| HRR Name | Total Monthly Adjusted Differences from the National Mean of Spending Across HRRs | Acute Care Monthly Adjusted Differences from the National Mean of Spending Across HRRs | Post-Acute Care Monthly Adjusted Differences from the National Mean of Spending Across HRRs |
| Waco, TX | $22 | -$6 | $37 |
| Saginaw, MI | $25 | $32 | -$4 |
| Savannah, GA | $25 | -$6 | -$23 |
| Gainesville, FL | $25 | $9 | $14 |
| Hackensack, NJ | $26 | $13 | -$21 |
| Lincoln, NE | $27 | $11 | -$21 |
| Louisville, KY | $27 | $19 | $13 |
| Charleston, SC | $29 | -$3 | -$4 |
| Covington, KY | $30 | $48 | -$1 |
| Kansas City, MO | $30 | $16 | $9 |
| Tuscaloosa, AL | $33 | $41 | $26 |
| Evansville, IN | $34 | $8 | $23 |
| Mesa, AZ | $34 | $15 | -$6 |
| Salisbury, MD | $36 | $61 | -$28 |
| Ocala, FL | $36 | -$6 | $12 |
| Takoma Park, MD | $37 | $60 | -$42 |
| Pensacola, FL | $37 | $9 | $17 |
| Wichita, KS | $39 | $18 | -$9 |
| Tupelo, MS | $40 | -$6 | $29 |
| Melrose Park, IL | $40 | $49 | $31 |
| Kettering, OH | $42 | $5 | $30 |
| Wilmington, NC | $42 | -$12 | -$19 |
| Ormond Beach, FL | $43 | -$18 | $31 |
| Orange County, CA | $44 | -$5 | $4 |
| Odessa, TX | $47 | -$16 | $80 |
| San Antonio, TX | $47 | -$20 | $63 |
| Dearborn, MI | $50 | $42 | $26 |
| HRR Name | Total Monthly Adjusted Differences from the National Mean of Spending Across HRRs | Acute Care Monthly Adjusted Differences from the National Mean of Spending Across HRRs | Post-Acute Care Monthly Adjusted Differences from the National Mean of Spending Across HRRs |
| New Orleans, LA | $52 | -$20 | $85 |
| Hinsdale, IL | $55 | $42 | $29 |
| Hudson, FL | $57 | -$5 | $42 |
| Lakeland, FL | $57 | $9 | $46 |
| Chicago, IL | $59 | $51 | $63 |
| Mobile, AL | $61 | $31 | $34 |
| Terre Haute, IN | $64 | $11 | -$3 |
| Tampa, FL | $65 | $13 | $44 |
| Detroit, MI | $66 | $38 | $25 |
| Gary, IN | $66 | $50 | $26 |
| San Angelo, TX | $67 | $16 | $55 |
| Abilene, TX | $68 | $23 | $45 |
| Evanston, IL | $69 | $24 | $29 |
| Elyria, OH | $69 | $51 | $28 |
| Orlando, FL | $73 | $13 | $28 |
| Sarasota, FL | $74 | -$36 | $11 |
| Texarkana, AR | $75 | $1 | $94 |
| Pontiac, MI | $75 | $32 | $16 |
| Houma, LA | $76 | -$5 | $54 |
| Blue Island, IL | $79 | $78 | $37 |
| Corpus Christi, TX | $85 | -$36 | $115 |
| Royal Oak, MI | $90 | $37 | $22 |
| Elgin, IL | $90 | $72 | $33 |
| Las Vegas, NV | $91 | $27 | $54 |
| Joliet, IL | $92 | $85 | $15 |
| Fort Myers, FL | $93 | $1 | $10 |
| Lubbock, TX | $93 | $23 | $73 |
| HRR Name | Total Monthly Adjusted Differences from the National Mean of Spending Across HRRs | Acute Care Monthly Adjusted Differences from the National Mean of Spending Across HRRs | Post-Acute Care Monthly Adjusted Differences from the National Mean of Spending Across HRRs |
| Bradenton, FL | $96 | -$10 | $32 |
| Tulsa, OK | $97 | $17 | $87 |
| Gulfport, MS | $97 | $52 | $52 |
| Baltimore, MD | $98 | $135 | -$53 |
| Jacksonville, FL | $98 | $24 | $28 |
| Austin, TX | $100 | -$1 | $57 |
| Amarillo, TX | $100 | $7 | $69 |
| Munster, IN | $104 | $78 | $50 |
| Oklahoma City, OK | $108 | $22 | $82 |
| Hattiesburg, MS | $108 | $17 | $60 |
| Longview, TX | $109 | $3 | $101 |
| Panama City, FL | $109 | $26 | $39 |
| Bryan, TX | $111 | $33 | $60 |
| Jackson, MS | $115 | $5 | $110 |
| Wichita Falls, TX | $115 | -$8 | $114 |
| Fort Worth, TX | $116 | -$7 | $113 |
| St. Petersburg, FL | $120 | $13 | $72 |
| Meridian, MS | $120 | -$4 | $125 |
| Clearwater, FL | $120 | -$13 | $81 |
| Harlingen, TX | $123 | -$34 | $157 |
| Beaumont, TX | $123 | -$5 | $102 |
| Slidell, LA | $129 | $30 | $81 |
| Lake Charles, LA | $132 | $17 | $107 |
| Tyler, TX | $133 | -$2 | $90 |
| Victoria, TX | $152 | $38 | $79 |
| Dallas, TX | $159 | -$3 | $140 |
| Metairie, LA | $163 | $11 | $111 |
| HRR Name | Total Monthly Adjusted Differences from the National Mean of Spending Across HRRs | Acute Care Monthly Adjusted Differences from the National Mean of Spending Across HRRs | Post-Acute Care Monthly Adjusted Differences from the National Mean of Spending Across HRRs |
| Fort Lauderdale, FL | $172 | -$2 | $52 |
| Baton Rouge, LA | $172 | -$12 | $140 |
| Shreveport, LA | $174 | $20 | $145 |
| Lafayette, LA | $177 | $5 | $143 |
| Alexandria, LA | $180 | $41 | $134 |
| Houston, TX | $189 | $23 | $120 |
| Monroe, LA | $229 | $8 | $179 |
| McAllen, TX | $266 | -$23 | $255 |
| Miami, FL | $435 | -$10 | $350 |
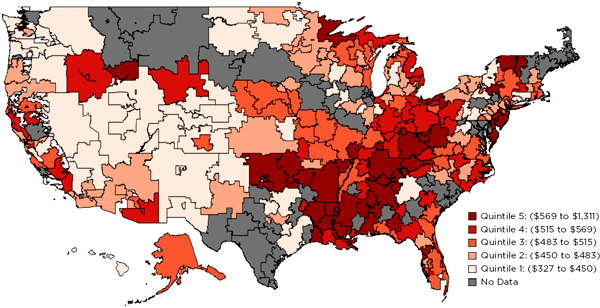
FIGURE G-1 Input-price-adjusted/total health care spending by hospital referral region (HRR).
NOTE: PHE’s analysis of total health care spending accounts for the commercially insured, Medicare, Medicaid, and the uninsured. HRR regions are divided into five spending quintiles. The figure above illustrates the variation in total health care spending in the United States. Refer to the original subcontractor report for details on methodology, and associated discussion.
SOURCE: PHE, 2013.


